
Dog teams, pack animals and lifecycle care define demand
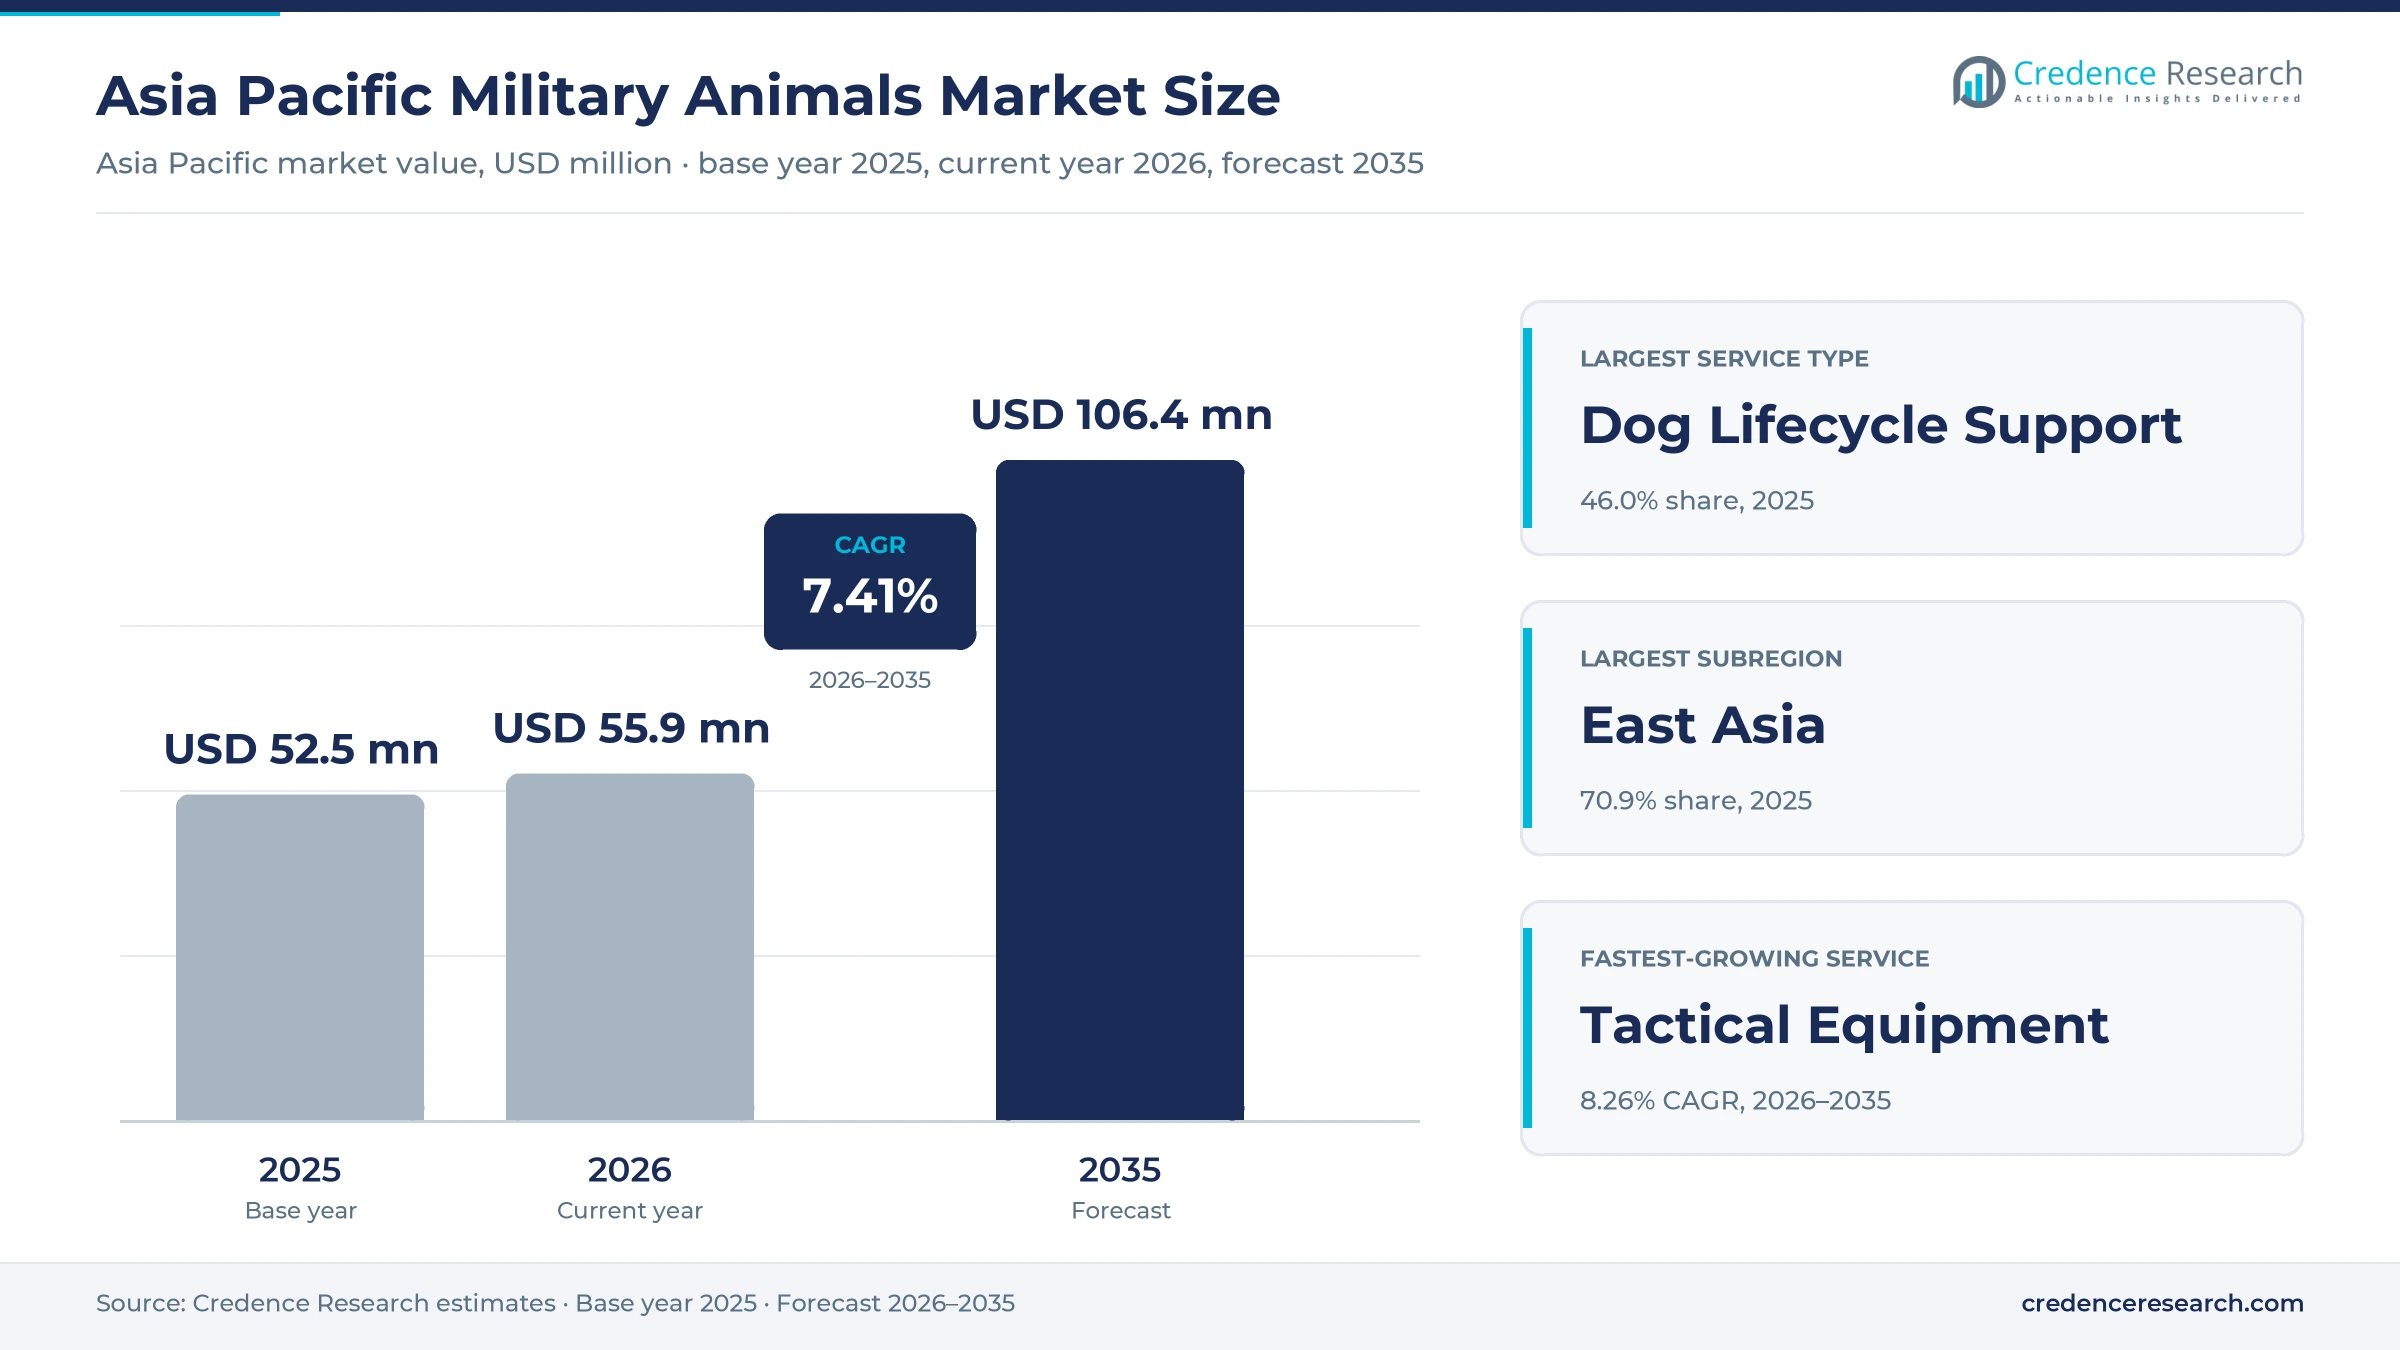
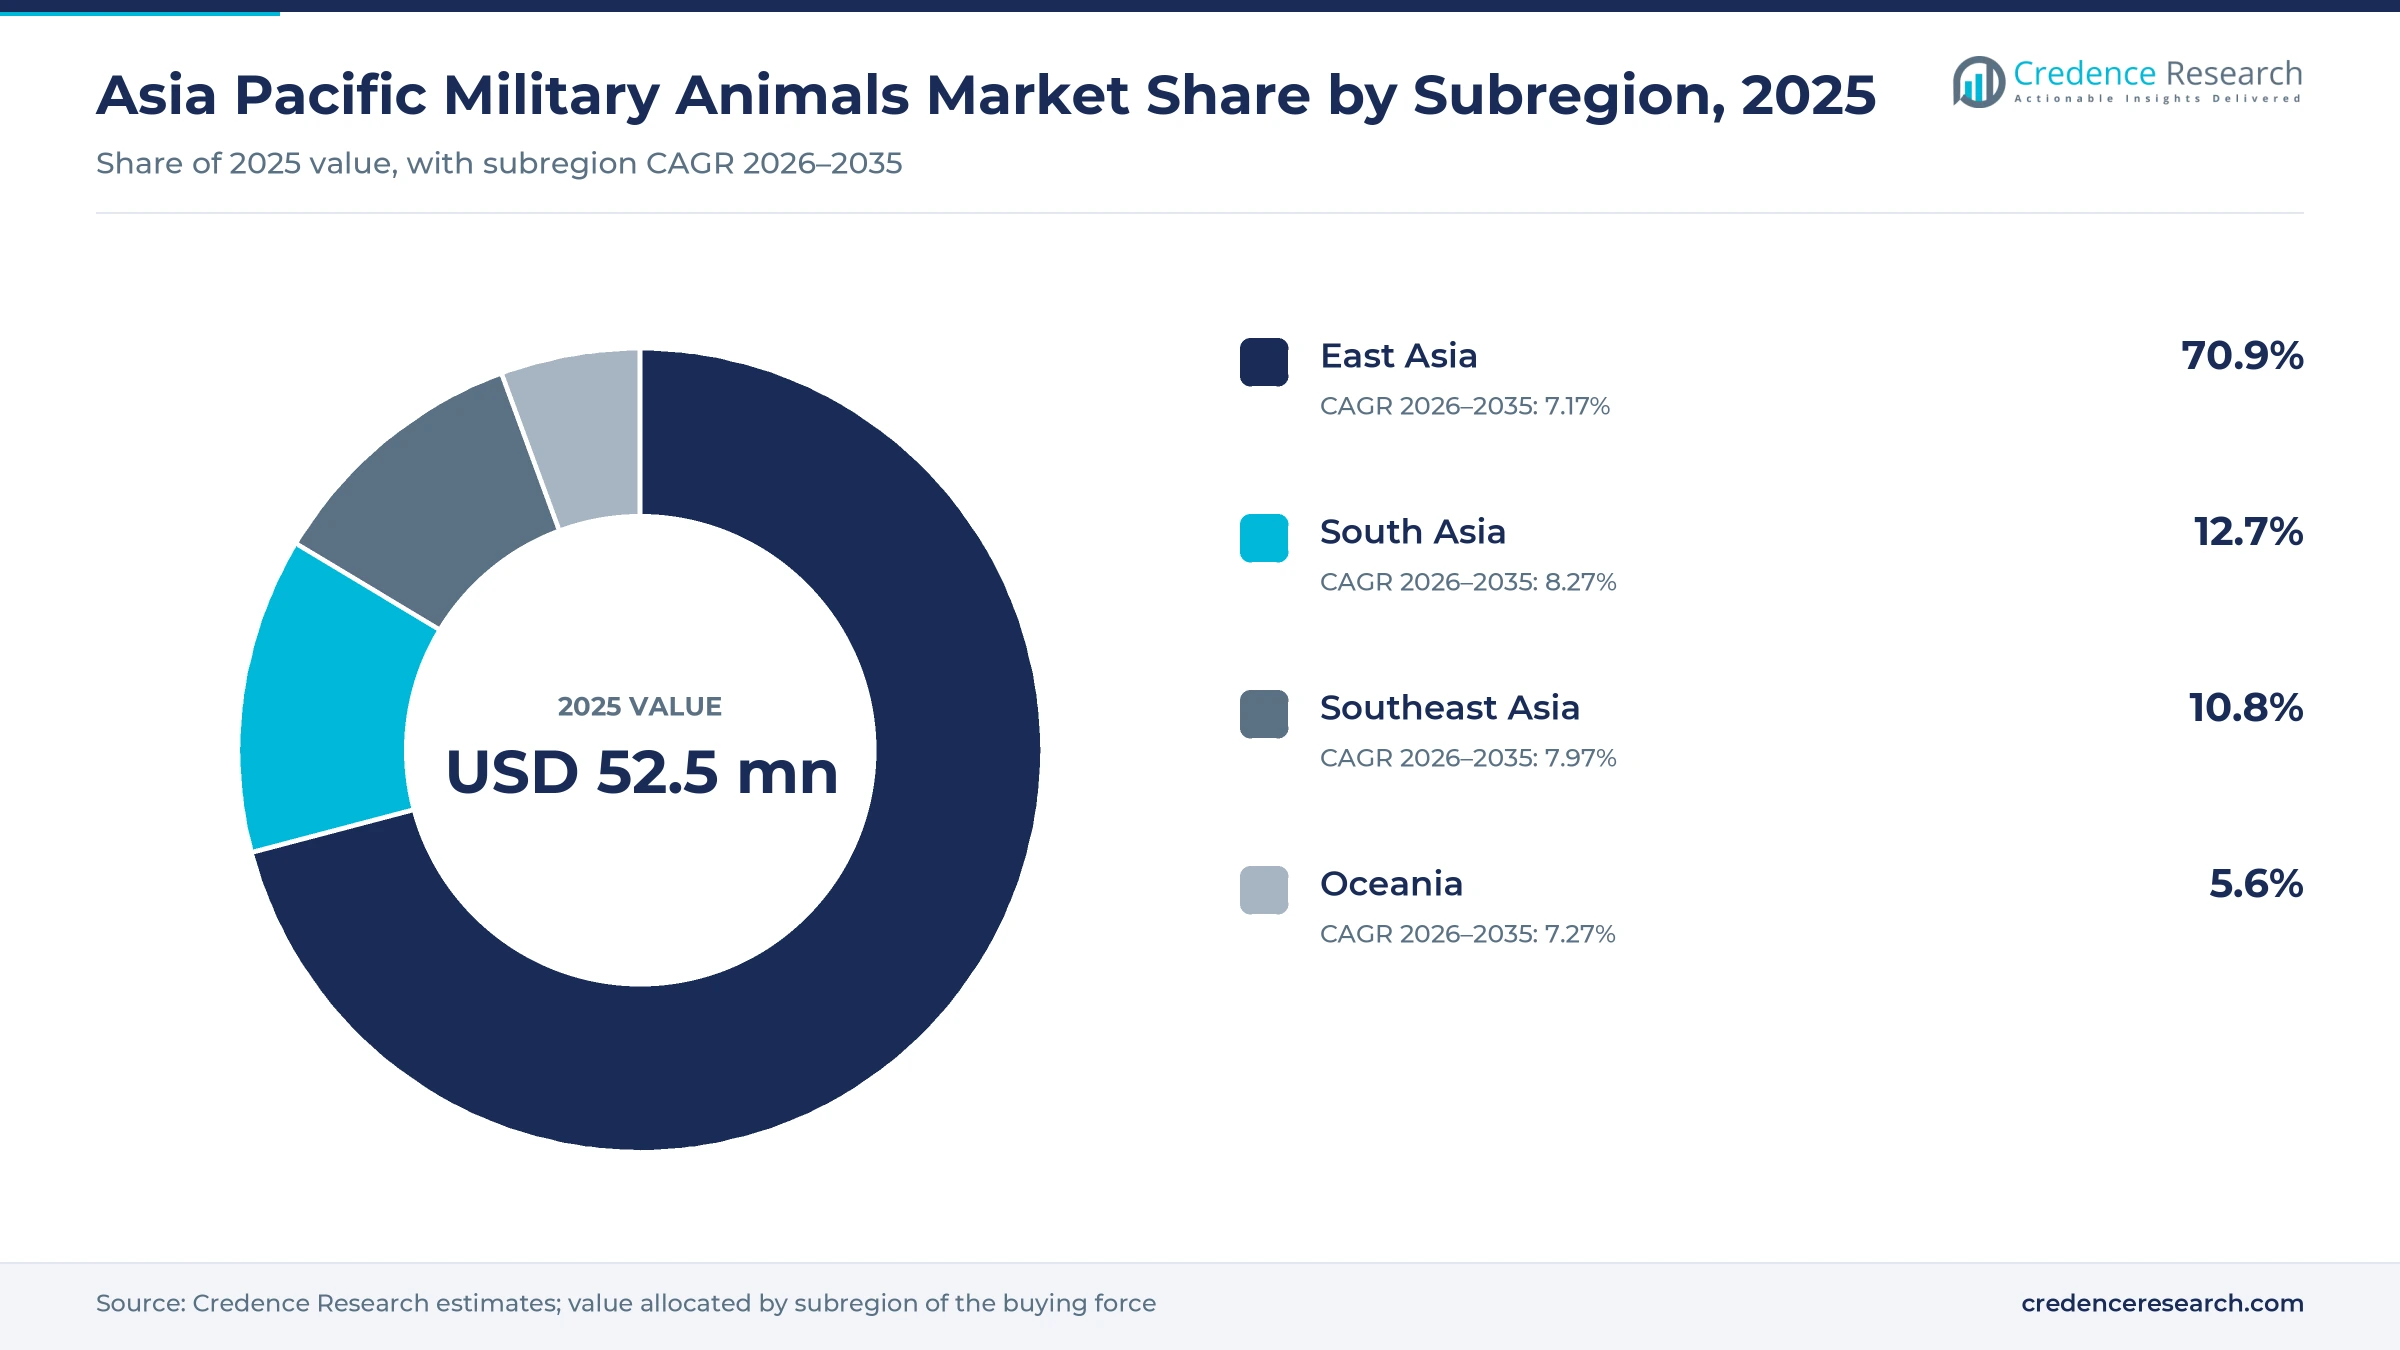
The Asia Pacific military animals market was valued at USD 52.5 million in 2025 and is projected to increase from USD 55.9 million in 2026 to USD 106.4 million by 2035, registering a CAGR of 7.41% during 2026–2035. Demand comes from armies, air forces, navies and border forces that keep detection and patrol dogs, and from mountain units that still rely on mules, ponies and camels to supply remote posts. East Asia held the largest subregional share, 70.9% in 2025, because China, Japan and South Korea fund the largest dog programs and pay more for veterinary care and imported breeding stock. South Asia is the fastest-growing subregion at 8.27% a year, as Indian forces expand breeding and training of local hound breeds. Retirement care is also becoming a funded cost, and South Korea began subsidizing the care of retired service dogs in April 2026.
Which animals, services and buyers does the regional estimate cover?
The estimate measures spending on lifecycle support, specialist training and tactical equipment for working dogs, horses, mules, ponies and camels that serve armed forces and border and paramilitary forces in the Asia-Pacific region. Lifecycle support covers breeding, feed, veterinary care, kenneling, transport and retirement care. Values are measured at the point of purchase through competitive tenders, framework agreements and direct specialist contracts, and they include the running cost of government-managed programs.
The estimate excludes the pay of handlers and veterinary officers, robotic dogs, civilian police dog units and pet products sold to households. The value chain runs from breeders, feed makers and equipment suppliers through specialist trainers and veterinary providers to military breeding centers, base kennels and remount depots across East Asia, South Asia, Southeast Asia and Oceania.
Asia Pacific Military Animals Market Insights
- The Asia Pacific military animals market was valued at USD 52.5 million in 2025 and is projected to reach USD 106.4 million by 2035, registering a CAGR of 7.41% during 2026–2035.
- East Asia held a 70.9% share of 2025 value, because China, Japan and South Korea run the largest and best-funded military dog programs.
- Dog lifecycle support led service demand with a 46.0% share of 2025 value, because feed, veterinary care and kenneling recur every year.
- The Indian Army formalized the induction of 14 Bactrian camels for logistics in Ladakh in August 2025, after almost a decade of trials.
- South Korea began covering up to 60% of the care costs of adopted retired service dogs in April 2026, which adds funded lifecycle spending.
Dog lifecycle support leads while equipment grows fastest
Why does dog lifecycle support lead service demand?
Based on service type, the market is categorized into dog lifecycle support, equine and camel lifecycle support, specialist training and tactical equipment. Dog Lifecycle Support led with a 46.0% share of 2025 value, because feed, veterinary care, kenneling and retirement care recur every year for each dog. Tactical Equipment grows fastest at 8.26% a year, as forces buy harnesses, protective vests and transport crates for larger detection teams.
How do working dogs shape animal type demand?
Based on animal type, the market is categorized into working dogs, equines and camels. Working Dogs led with a 78.0% share of 2025 value, because every major force in the region keeps detection and patrol dogs at bases, ports and borders. Camels grow fastest at 8.21% a year, as India adds Bactrian camels for high-altitude supply work in Ladakh.
Why does detection lead application demand?
Based on application, the market is categorized into detection, patrol and tracking, pack logistics and ceremonial duties. Detection led with a 44.0% share of 2025 value, because explosives and narcotics search dogs need longer training and more frequent odor refresher work. Patrol and tracking dogs follow, while pack logistics depends on mules, ponies and camels in mountain areas.
How do armies and border forces divide customer demand?
Based on customer type, the market is categorized into army, air force, navy and border and paramilitary forces. Army led with a 41.0% share of 2025 value, because armies keep the largest dog, horse and mule holdings in the region. Border and Paramilitary Forces grow fastest at 7.87% a year, as long land borders need more detection and tracking teams.
| Segment Group | Leading Sub-segment | Share, 2025 | Fastest-growing Sub-segment | CAGR, 2026–2035 |
|---|---|---|---|---|
| By Service Type | Dog Lifecycle Support | 46.0% | Tactical Equipment | 8.26% |
| By Animal Type | Working Dogs | 78.0% | Camels | 8.21% |
| By Application | Detection | 44.0% | Detection | 7.85% |
| By Customer Type | Army | 41.0% | Border and Paramilitary Forces | 7.87% |
Request a Free Sample
Fill in your details and we'll send you a free sample report.
- Sample data tables & charts
- Research methodology
Canine capability, animal health and high-altitude supply
What keeps detection and patrol teams expanding?
Operational canine capability anchors demand, because armed and border forces across the region keep expanding their detection and patrol dog teams. Australia has more than 200 military working dogs, according to the Department of Defence in February 2025. The Singapore Armed Forces Military Working Dog Unit keeps about 100 dogs active across its camps and bases, according to a MINDEF Pioneer article from October 2023. India's Border Security Force has trained almost 150 Mudhol and Rampur Hounds at its Tekanpur dog center since 2021, The Week reported in October 2025. As a result, working dogs hold a 78.0% share of 2025 value, the largest share among animal types, and they set the pace for spending on care and training.
Why are veterinary and welfare budgets growing?
Animal health and readiness spending widens budgets, because forces now pay for veterinary care across the full working life and retirement of each animal. South Korea's agriculture ministry announced on April 1, 2026, that it will cover up to 60% of a retired service dog's costs, capped at 1 million won a year, according to the Korea Herald. Under the same program, 44 member hospitals of the Korean Animal Hospital Association offer 30% off medical fees. During Exercise Talisman Sabre 2025, a New Zealand air force dog followed a structured acclimatization program to manage heat stress in Australia. As a result, spending on veterinary vaccines and clinical care rises, and dog lifecycle support leads service demand with a 46.0% share of 2025 value.

What makes dogs central to base security?
Base protection and monitoring needs lift spending, because air bases, camps and ports rely on dogs to find threats and secure their perimeters. Australia's Combat Support Group oversees military working dogs at most Air Force bases, according to a Department of Defence article from June 2023. The Singapore unit splits its dogs between protection work and explosives or narcotics detection, using German Shepherds, Belgian Malinois, Labradors and Spaniels. A 12-year-old Japan Air Self-Defense Force guard dog at Iruma Air Base served from February 2016 on counterterrorism tasks such as explosives detection, Sakigake Shimpo reported. As a result, detection leads application demand with a 44.0% share of 2025 value, and it also grows fastest at 7.85% a year.
Why do mountain posts still need pack animals?
High-altitude supply needs sustain equine and camel use, because vehicles and aircraft cannot reach many remote border posts in the Himalayas. The Indian government told the Rajya Sabha on Aug. 18, 2025, that the military holds about 12,600 animals, including horses, mules, camels and dogs, The Week reported. The Army formalized the induction of 14 trained Bactrian camels for its 14 Corps in Ladakh after almost a decade of trials, according to The Tribune. These camels carry 150 to 200 kilograms at altitudes up to 14,000 feet, compared with 60 to 80 kilograms for mules and ponies. In turn, camels grow fastest among animal types at 8.21% a year, although they start from a small base.
Indigenous breeds and retirement care reshape programs
Why are local hound breeds replacing imports in India?
The shift toward indigenous dog breeds is changing sourcing, because Indian forces now favor hardy local hounds over imported breeds. The Border Security Force fielded its first Indian breed dog contingent at the National Unity Day parade in Gujarat in October 2025, with Mudhol and Rampur Hounds, The Tribune reported. More than 150 Indian breed dogs have already been deployed along the western and eastern borders and on internal security duties. The Army's animal contingent at the 2026 Republic Day Parade included 10 Indian-breed dogs alongside six conventional military dogs, as reported by All India Radio. As a result, South Asia is the fastest-growing subregion, as domestic breeding and training programs expand.
How does post-service care change program budgets?
The rise of retirement and adoption programs is adding lifecycle cost, because forces now plan care for dogs after their service ends. South Korea has about 1,500 active service dogs, and more than 150 retire each year, The Korea Herald reported in July 2026. Only about 22% of retired service dogs were adopted in 2024, while the remaining 78% stayed with their agencies for life. The Japan Air Self-Defense Force base at Misawa offered two retired German Shepherd guard dogs, aged 12 and 10, for paid adoption in June 2026. In turn, dog lifecycle support stays the largest service type, because retirement care adds feeding, veterinary and kennel costs for years after duty ends.
Where can suppliers find openings in Southeast Asia?
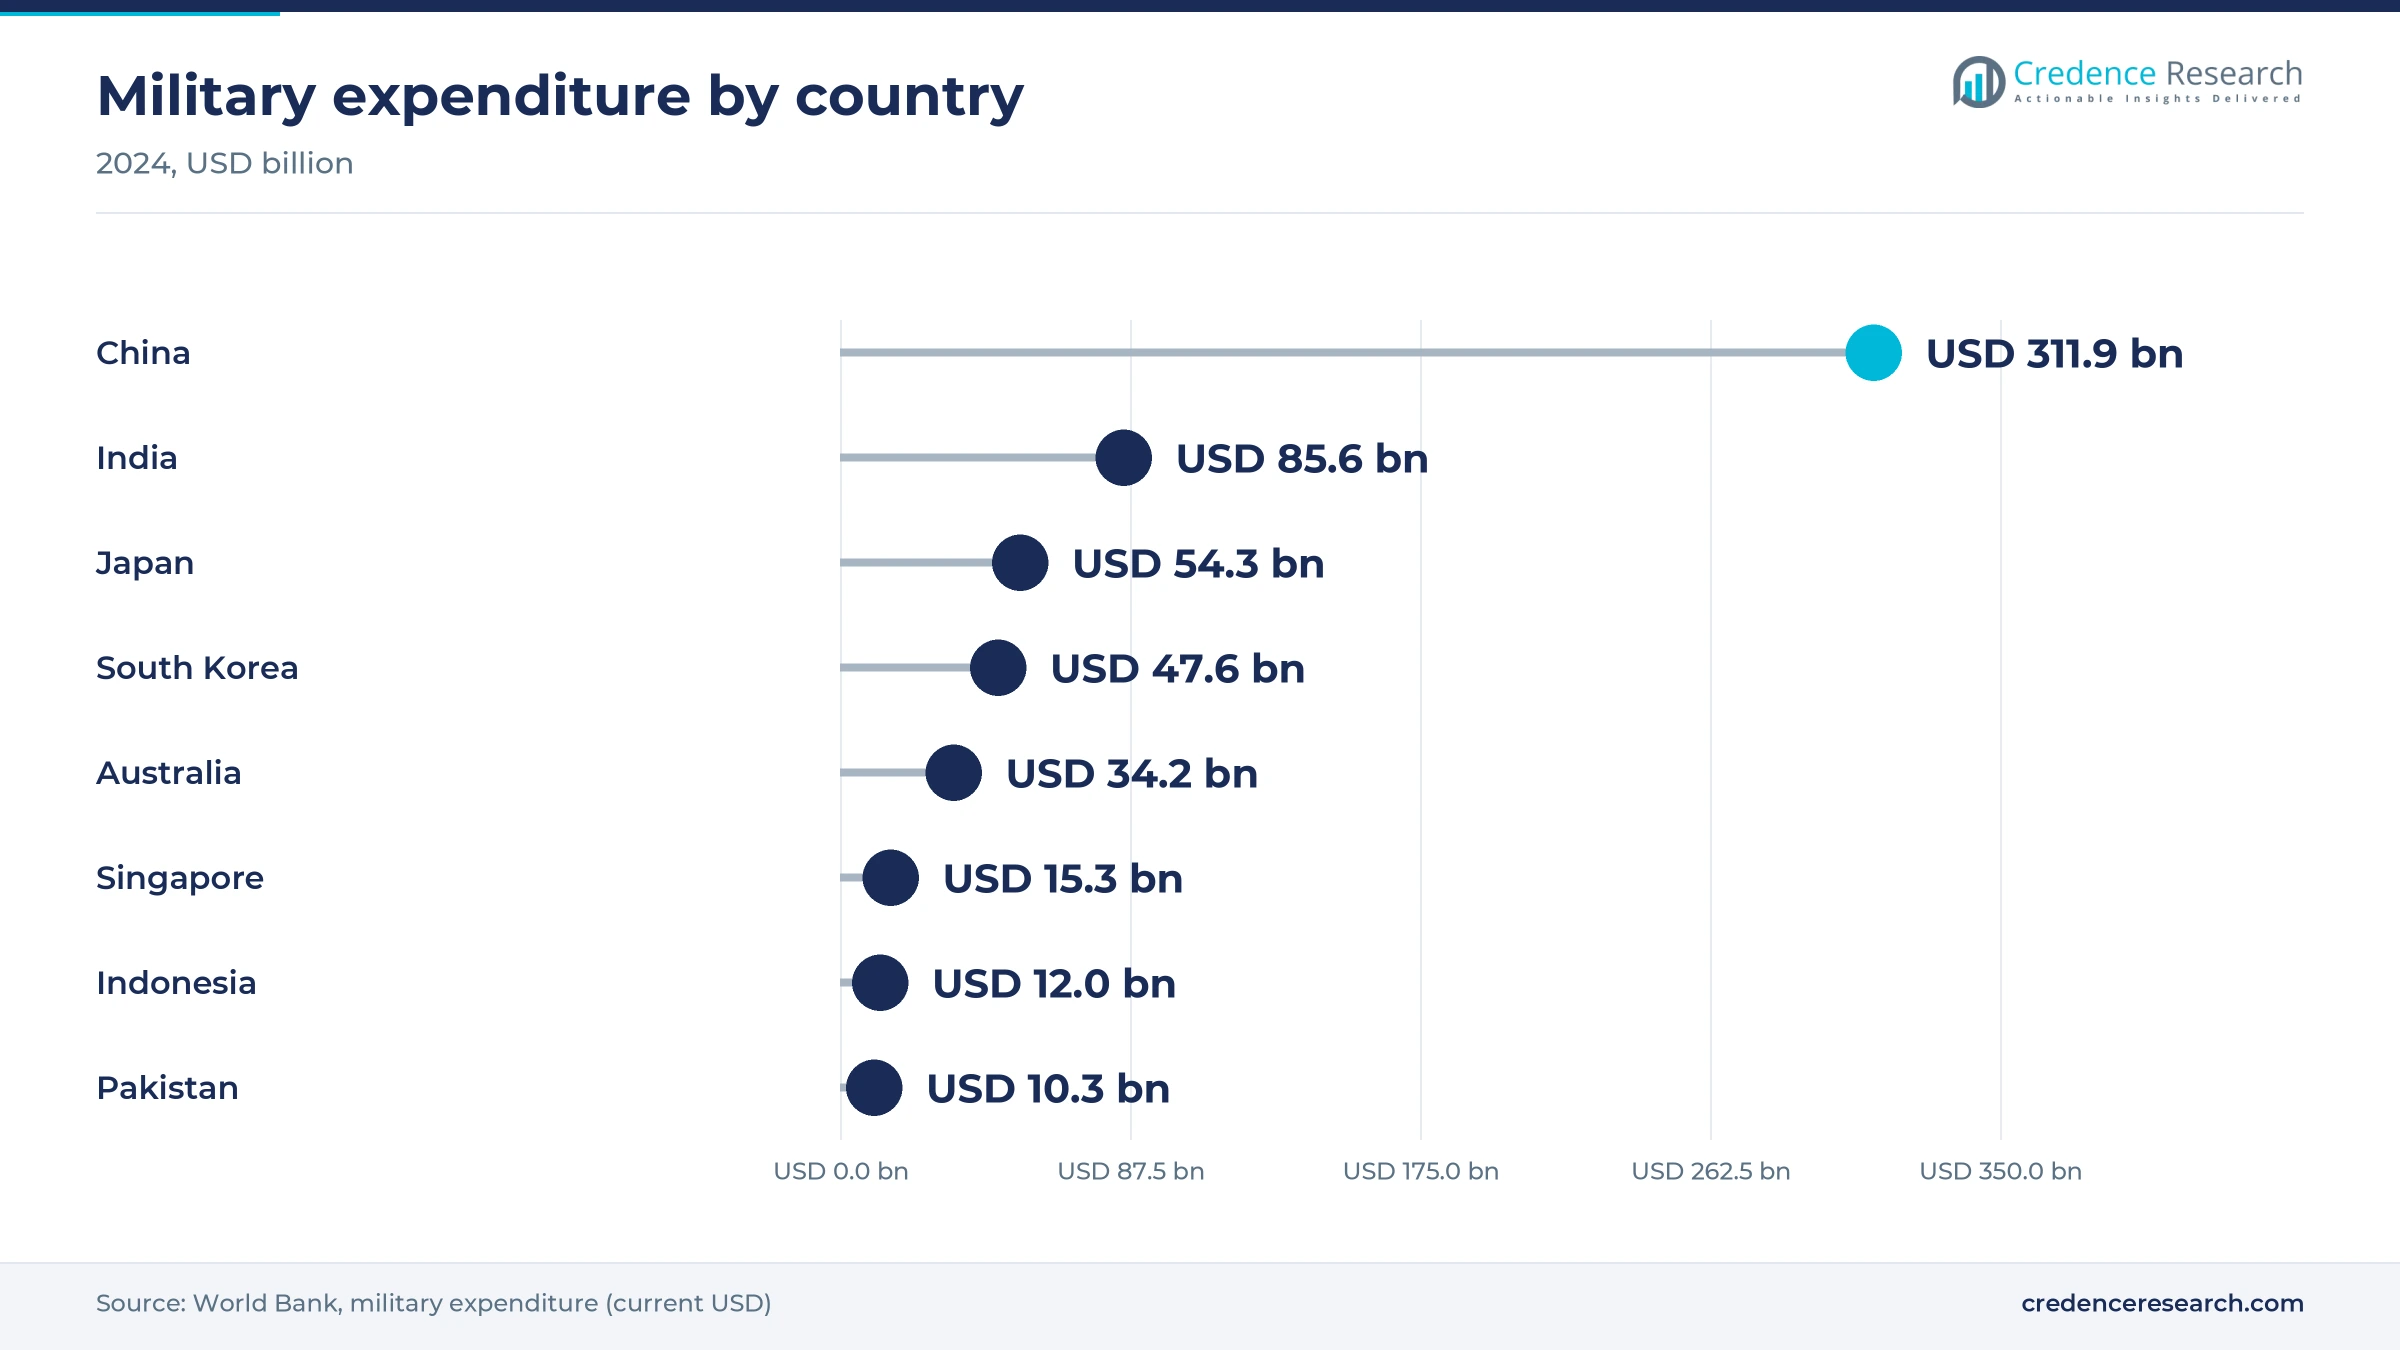
Southeast Asian dog programs open supplier opportunities, because several forces run in-house breeding and training centers that need equipment, veterinary supplies and instructor support. The Royal Thai Army runs a Military Dog Centre in Pak Chong district of Nakhon Ratchasima under its Veterinary and Remount Department, the Bangkok Post reported. Singapore spent USD 15.3 billion on its military in 2024, while Indonesia spent USD 12.0 billion, according to World Bank data. Vietnam spent USD 8.6 billion and Thailand USD 5.5 billion in the same year, which funds border and base security programs that use dogs. As a result, Southeast Asia grows at 7.97% a year, faster than the regional average.
How could joint exercises lift training purchases?
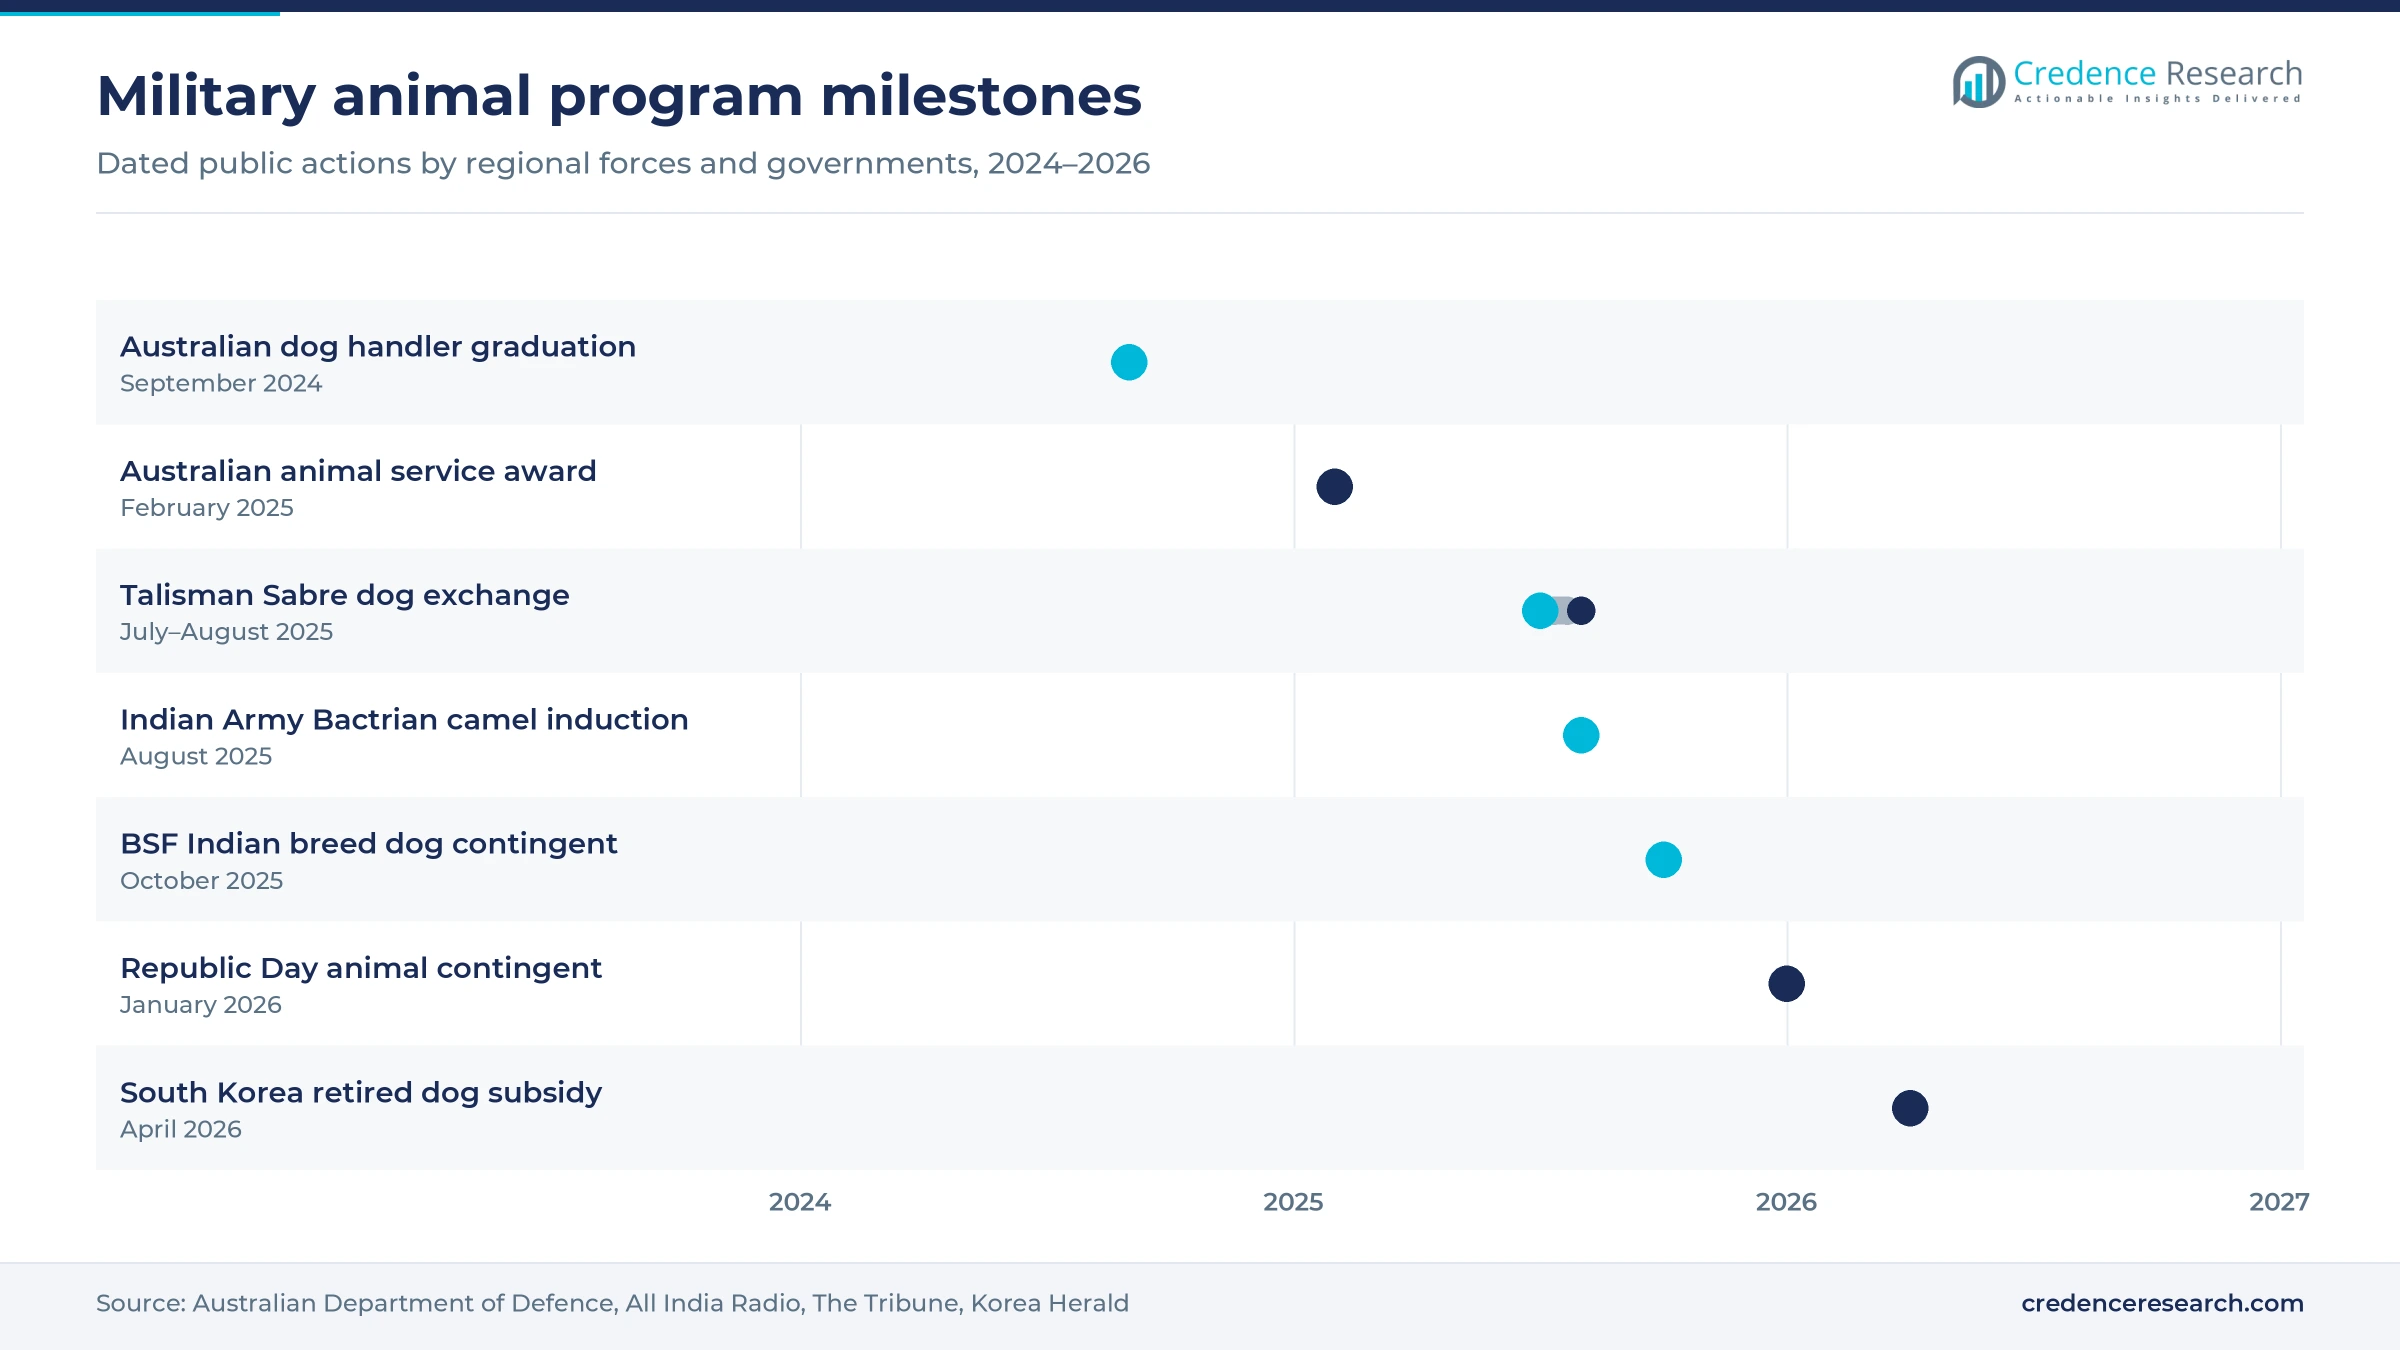
Allied training exchanges open new service demand, because joint exercises need dogs that are fit, transportable and trained to shared standards. The Royal New Zealand Air Force embedded a dog team with the Royal Australian Air Force's 27 Squadron Security Flight during Talisman Sabre 2025, an exercise with more than 40,000 personnel from 19 nations, and it expanded a partnership that began at Exercise Pitch Black in 2024. Australia's RAAF Security and Fire School and Swartz Barracks graduated five dog handlers in September 2024 after a 20-week course. U.S. Army veterinary units at Camp Humphreys in South Korea practiced air evacuation of working dogs in July 2026. In turn, specialist training holds a steady place in spending, as forces buy courses, instructors and transport-ready equipment.
Training costs, wash-outs and in-house programs limit demand
What slows the supply of ready dog teams?
Long training cycles strain dog programs, because breeding, socialization and odor training take many months before a dog can work. Australian Border Force detector dog teams train together for at least seven months, and foster carers raise pups for up to 18 months first. As a result, smaller forces struggle to keep teams at full strength when dogs retire. Programs respond with in-house breeding, careful choice of breeding pairs and shared courses with allied forces.
How do wash-outs affect program economics?
Failed candidates raise the cost per working dog, because many young dogs do not meet service standards after months of care. The Royal Thai Army auctioned 64 German Shepherds and Belgian Malinois that did not pass its service dog requirements, the Bangkok Post reported. In turn, the cost of breeding and raising those dogs falls on the dogs that do qualify. Forces respond with earlier temperament screening, health testing of breeding stock and adoption sales.
Which climate risks reduce readiness?
Heat, altitude and terrain affect animal readiness, because dogs and pack animals must work in climates far from where they were bred. A New Zealand dog in Australia during Talisman Sabre 2025 needed heat acclimatization, and its handler also noted the risk of ticks and snakes. As a result, forces pay for cooling, parasite control and longer conditioning periods. Breeding programs respond by choosing hardy local breeds, and India now tests animals suited to cold desert conditions.
Why is the open share for private suppliers small?
In-house programs limit outsourced spending, because many forces breed, train and treat their own animals. India's Remount and Veterinary Corps breeds, rears and trains Army horses, mules and dogs at its Meerut center. Australia runs its Department of Defence dog breeding program at RAAF Base Amberley. As a result, private suppliers compete mainly for equipment, feed, specialist courses and veterinary products. Suppliers respond with framework agreements and hybrid delivery that supports government staff.
East Asia leads as South Asian forces grow fastest
| Subregion | Value, 2025 (USD million) | Share, 2025 | CAGR, 2026–2035 |
|---|---|---|---|
| East Asia | 37.2 | 70.9% | 7.17% |
| South Asia | 6.7 | 12.7% | 8.27% |
| Southeast Asia | 5.7 | 10.8% | 7.97% |
| Oceania | 2.9 | 5.6% | 7.27% |
What makes East Asia the biggest buyer?
East Asia held a 70.9% share of 2025 value and grows at 7.17% a year, because China, Japan and South Korea run the largest and best-funded military dog programs in the region. China spent USD 311.9 billion on its military in 2024, while Japan spent USD 54.3 billion and South Korea USD 47.6 billion. China Daily showed 62 German Shepherd, Belgian Malinois and Springer Spaniel puppies taking first tests at a border defense training facility in Harbin in April 2022. Japan and South Korea also pay higher prices for veterinary care and imported breeding stock.
Why is South Asia expanding fastest?
South Asia held a 12.7% share of 2025 value and grows fastest at 8.27% a year, because India is expanding its use of dogs, ponies and camels on long mountain borders. The 2026 Republic Day Parade featured an Army animal contingent with two Bactrian camels, four Zanskar ponies and four raptors for the first time. The RVC Centre and College in Meerut raises and trains the Army's dogs. India spent USD 85.6 billion on its military in 2024, and Pakistan spent USD 10.3 billion.
Why are Southeast Asian forces adding detection teams?
Southeast Asia held a 10.8% share of 2025 value and grows at 7.97% a year, because Singapore, Thailand and the Philippines are adding detection teams for bases, ports and coastlines. Singapore's Military Working Dog Unit is part of the SAF Military Police Command and keeps about 100 dogs active. The Philippine Coast Guard Auxiliary began training 11 detection dogs in November 2022. Vietnam spent USD 8.6 billion on its military in 2024, which supports border guard dog programs.
How does Oceania support high spending per dog?
Oceania held a 5.6% share of 2025 value and grows at 7.27% a year, because Australia and New Zealand spend heavily on each dog through breeding, fostering and veterinary care. The Department of Defence breeding program at RAAF Base Amberley recorded 95 puppies in 2016 and placed 76 with foster families. Strong local veterinary services support these dogs during and after service. Australia spent USD 34.2 billion on its military in 2024.
Inductions, parades and welfare milestones, 2024–2026
| Development | Status and market relevance |
|---|---|
| In September 2024, Australia's RAAF Security and Fire School and Swartz Barracks graduated five dog handlers after a 20-week course. | Adds trained handler capacity for Air Force and Army dog teams |
| In February 2025, a 2nd Commando Regiment dog received the Australian Animal Distinguished Service Award at the Australian War Memorial. | Raises attention to care for retired military working dogs |
| In August 2025, the Indian Army introduced 14 trained Bactrian camels for logistics in Ladakh after formal induction. | Opens a new camel lifecycle support need at high altitude |
| In October 2025, the Border Security Force unveiled its first Indian breed dog contingent at the National Unity Day parade. | Signals wider use of locally bred Mudhol and Rampur Hounds |
| In April 2026, South Korea announced subsidies covering up to 60% of care costs for adopted retired service dogs. | Adds funded retirement care to dog lifecycle spending |
Odor training, microchips and health monitoring tools
- Real-odor detection training uses genuine explosive and drug samples rather than substitutes, which The K9 Centre in Queensland applies to its detection dogs.
- Microchip identification gives each animal a permanent code with the same implant technology used in pet ID microchips, which helps kennels keep breeding, vaccination and transfer records.
- Wearable health monitors record heart rate, temperature and activity with sensors similar to veterinary wearable devices, which helps handlers watch for heat stress in hot climates.
- Structured acclimatization programs condition dogs gradually to heat and humidity, which helped a New Zealand dog work in northern Australia during Talisman Sabre 2025.
Need a Custom Version of This Report?
Tailor the scope, geography, or segments to your exact requirements.
- Custom geography or segment scope
- Direct access to our analyst team
Specialist suppliers compete around in-house programs
Competition takes place around large government programs that breed, train and treat most animals in house. Private suppliers compete mainly for equipment, feed, training courses and specialist dog teams through tenders and framework agreements. K9 Pro sells handler wear such as vests, jackets and tracking aprons, together with canine equipment, from Australia to buyers in several countries. Von Forell supplies Performadog premium dry dog food and training products for obedience, tracking, police, military and security work. The K9 Centre, which trades as Australian Canine Group in Narangba, Queensland, trains detection and protection dogs and supplies dog teams to government and private clients. Specialists compete on dog quality, odor training, product durability and the ability to support small units in remote areas.
Companies profiled and their roles in this market
| Company | Type | Role in the market |
|---|---|---|
| K9 Pro | Equipment and handler wear supplier | Sells vests, jackets, tracking aprons and canine equipment from Australia |
| Von Forell | Feed and training products supplier | Supplies Performadog dry food and training products for police and military work |
| The K9 Centre | Specialist dog trainer | Trains detection and protection dogs in Narangba, Queensland |
Credence Research view on regional working animal demand
Credence Research's view is that regional demand for military animal support will grow steadily because forces are adding detection dogs, funding retirement care and keeping pack animals for mountain supply. Dog lifecycle support keeps the largest service share, while tactical equipment grows fastest as teams expand. East Asia keeps the largest share, and South Asia grows fastest as Indian forces breed local hounds and add camels. However, in-house programs will limit the share open to private suppliers. Suppliers that offer durable equipment and flexible training support should gain share fastest.
How the regional working animal estimate was built
The report uses 2025 as the base year on a calendar basis, and market values come from the Credence Research model. That model combines published animal holdings, defense spending statistics, government program releases and company information on products and services. Segment splits and subregional growth rates are Credence Research estimates, while subregional shares follow the Credence Research regional model. Sources used are official statistics, parliamentary replies, defense ministry releases, company websites and news reporting, and no interviews or surveys were used.
Detection dogs and border forces carry demand to 2035
Regional spending on military animals is expected to reach USD 106.4 million by 2035, a 7.41% CAGR during 2026–2035, as forces add detection teams and fund care across the full life of each animal. Growth should be strongest in South Asia, where local breeds and camels expand mountain and border work. After 2030, equipment, health monitoring and retirement care will take a larger part of value as programs mature. Wider use of framework agreements would support this outlook, while tighter defense budgets would slow it.
Frequently Asked Questions
How big is the Asia Pacific military animals market?
Which service type leads regional demand?
Which subregion leads the regional market?
Why do working dogs lead animal type demand?
Why did the Indian Army add Bactrian camels?
Which customer type leads the market?
Who are the leading companies in the region?
What are the main challenges for military animal programs?
Table of Content
Chapter 1 Market Segmentation
- 1.1 Segmentation Framework
- 1.1.1 Product and Service Classification
- 1.1.2 Application and End-Use Classification
- 1.1.3 Technology and Solution Classification
- 1.1.4 Customer and Distribution Channel Classification
- 1.1.5 Geographic Segmentation
- 1.1.6 Market Segment Definitions and Boundaries
- 1.2 By Service Type
- 1.2.1 Dog Lifecycle Support
- 1.2.2 Equine and Camel Lifecycle Support
- 1.2.3 Specialist Training
- 1.2.4 Tactical Equipment
- 1.3 By Animal Type
- 1.3.1 Working Dogs
- 1.3.2 Equines
- 1.3.3 Camels
- 1.4 By Application
- 1.4.1 Detection
- 1.4.2 Patrol and Tracking
- 1.4.3 Pack Logistics
- 1.4.4 Ceremonial Duties
- 1.5 By Customer Type
- 1.5.1 Army
- 1.5.2 Air Force
- 1.5.3 Navy
- 1.5.4 Border and Paramilitary Forces
- 1.6 By Subregion
- 1.6.1 South Asia
- 1.6.2 East Asia
- 1.6.3 Southeast Asia
- 1.6.4 Oceania
Chapter 2 Introduction
- 2.1 Report Objectives and Scope
- 2.2 Product Definition and Industry Terminology
- 2.3 Market Inclusions and Exclusions
- 2.4 Research Process
- 2.4.1 Primary Research and Expert Interviews
- 2.4.2 Secondary Research and Source Review
- 2.4.3 Top-Down and Bottom-Up Estimation
- 2.4.4 Data Triangulation and Verification
- 2.5 Market Size Measurement Basis
- 2.5.1 2025: USD 52.5 million → 2035: USD 106.4 million
- 2.6 Historical and Forecast Reference Periods
- 2.6.1 Historical Period: 2018-2025
- 2.6.2 Base Year: 2025
- 2.6.3 Forecast Period: 2025-2035
- 2.7 Research Assumptions and Limitations
Chapter 3 Executive Summary
- 3.1 Market Snapshot and Key Findings
- 3.2 Base-Year Market Size, 2025
- 3.3 Forecast Market Size, 2035
- 3.4 Revenue and Volume Growth Outlook
- 3.5 Key Demand and Supply Indicators
- 3.6 Leading Market Segments
- 3.7 Fastest-Growing Market Opportunities
- 3.8 Regional Performance Highlights
- 3.9 Technology and Industry Transformation
- 3.10 Competitive Landscape Summary
- 3.11 Analyst View and Strategic Implications
Chapter 4 Asia Pacific Military Animals Market Trends and Developments
- 4.1 Historical Industry Development, 2018-2025
- 4.2 Recent Market Trends and Developments
- 4.3 Demand and Customer Behavior Trends
- 4.4 Technology and Product Innovation
- 4.5 Artificial Intelligence, Automation and Digitalization
- 4.6 Local Manufacturing and Supply Chain Realignment
- 4.7 Industry Partnerships, Mergers and Acquisitions
- 4.8 Sustainability and Circular Economy Developments
- 4.9 Government and Private Sector Investment Trends
- 4.10 Emerging Business Models and Commercialization
- 4.11 Industry Developments and Announcements
Chapter 5 Asia Pacific Military Animals Market Production, Supply and Demand Analysis
- 5.1 Demand Trend and Consumption Analysis, 2018-2025
- 5.2 Demand Forecast, 2025-2035
- 5.3 Production and Output Trend, 2018-2025
- 5.4 Production and Output Forecast, 2025-2035
- 5.5 Installed Capacity and Capacity Utilization
- 5.6 Company-Wise Production Plants and Statistics
- 5.6.1 Installed Production Capacity
- 5.6.2 Actual Production
- 5.6.3 Planned Capacity and Expansion Targets
- 5.7 Supply Chain Structure and Procurement Trends
- 5.8 Supply-Demand Gap and Bottlenecks
- 5.9 Import Dependence and Sourcing Structure
- 5.10 Contract Manufacturing and Outsourcing
- 5.11 Regional Supply and Demand Concentration
Chapter 6 Asia Pacific Military Animals Market Pricing Analysis
- 6.1 Pricing Structure and Measurement
- 6.2 Historical Pricing Trends, 2018-2025
- 6.3 Pricing Outlook, 2025-2035
- 6.4 Average Selling Price and Unit Economics
- 6.5 Pricing by Product and Market Segment
- 6.6 Geographic Pricing Differences
- 6.7 Key Input, Energy, Labor and Logistics Costs
- 6.8 Contract Pricing and Purchasing Models
- 6.9 Pricing Sensitivity and Competitive Positioning
- 6.10 Price, Margin and Profitability Implications
Chapter 7 Asia Pacific Military Animals Market Dynamics
- 7.1 Market Growth Drivers
- 7.1.1 Demand-Side Drivers
- 7.1.2 Technology and Innovation Drivers
- 7.1.3 Infrastructure and Investment Drivers
- 7.1.4 Regulatory and Policy Drivers
- 7.2 Market Restraints
- 7.2.1 Cost and Affordability Constraints
- 7.2.2 Technology and Adoption Barriers
- 7.2.3 Supply Chain and Operational Constraints
- 7.3 Market Challenges
- 7.3.1 Competitive Pressure and Margin Erosion
- 7.3.2 Skills, Infrastructure and Implementation Gaps
- 7.4 Emerging Market Opportunities
- 7.5 Market Dynamics Impact and Time-Horizon Assessment
Chapter 8 Asia Pacific Military Animals Value Chain Analysis
- 8.1 Industry Value Chain Overview
- 8.2 Upstream Suppliers and Critical Inputs
- 8.3 Technology and Component Providers
- 8.4 Manufacturing or Service Delivery
- 8.5 Distribution, Channel Partners and Integrators
- 8.6 Downstream Applications and End Users
- 8.7 Value Addition and Profit Pools
- 8.8 Vertical Integration and Outsourcing
- 8.9 Supplier Concentration and Risk
- 8.10 Supply Chain Localization and Resilience
Chapter 9 Asia Pacific Military Animals Market Regulations and Policies
- 9.1 Relevant Laws, Standards and Compliance Frameworks
- 9.2 Product, Service, Safety and Quality Requirements
- 9.3 Government Policies, Incentives and Subsidies
- 9.4 Imports, Exports and Trade Barriers
- 9.5 Public Procurement and Local Content Requirements
- 9.6 Environmental and Sustainability Compliance
- 9.7 Upcoming Policy Changes and Market Implications
Chapter 10 Asia Pacific Military Animals Market Hotspots and Opportunities
- 10.1 Market Opportunity Mapping and Growth Hotspots
- 10.2 High-Growth Applications and Customer Groups
- 10.3 Underserved Markets and White-Space Opportunities
- 10.4 Emerging Technology and Product Opportunities
- 10.5 New Capacity and Investment Hotspots
- 10.6 Market Entry and Expansion Opportunities
- 10.7 Distribution and Partnership Opportunities
- 10.8 Near-Term and Long-Term Commercial Potential
- 10.9 Opportunity Attractiveness and Execution Risks
Chapter 11 Asia Pacific Military Animals Market Outlook, 2025-2035
- 11.1 Market Size and Analysis
- 11.1.1 Revenue (Market Measurement: 2025: USD 52.5 million → 2035: USD 106.4 million)
- 11.1.2 Market Volume and Quantity Sold
- 11.1.3 Historical Market Size, 2018-2025
- 11.1.4 Base-Year Market Size, 2025
- 11.2 Market Forecast, 2025-2035
- 11.2.1 Revenue Forecast to 2035
- 11.2.2 Volume Forecast to 2035
- 11.2.3 CAGR and Year-on-Year Growth
- 11.2.4 Incremental Revenue Opportunity
- 11.3 Forecast Assumptions and Scenario Analysis
- 11.3.1 Base-Case Forecast
- 11.3.2 Optimistic and Conservative Scenarios
- 11.3.3 Technology, Pricing and Policy Sensitivities
- 11.4 Market Attractiveness and Growth Outlook
Chapter 12 Asia Pacific Military Animals Market Segmentation and Outlook
- 12.1 Segmentation Summary and Market Shares, 2025
- 12.2 Largest and Fastest-Growing Segments
- 12.3 By Service Type - Market Size and Forecast, 2025-2035
- 12.3.1 Segment Definition and Scope
- 12.3.2 Historical Market Size, 2018-2025
- 12.3.3 Revenue Forecast, 2025-2035
- 12.3.4 Volume Forecast, 2025-2035
- 12.3.5 Base-Year Market Share, 2025
- 12.3.6 Segment CAGR and Growth Drivers
- 12.3.7 Subsegment Market Size and Forecast
- 12.3.7.1 Dog Lifecycle Support
- 12.3.7.2 Equine and Camel Lifecycle Support
- 12.3.7.3 Specialist Training
- 12.3.7.4 Tactical Equipment
- 12.3.8 Subsegment Pricing and Adoption Trends
- 12.3.9 Leading Suppliers and Competition
- 12.3.10 Regional Demand and Opportunities
- 12.4 By Animal Type - Market Size and Forecast, 2025-2035
- 12.4.1 Segment Definition and Scope
- 12.4.2 Historical Market Size, 2018-2025
- 12.4.3 Revenue Forecast, 2025-2035
- 12.4.4 Volume Forecast, 2025-2035
- 12.4.5 Base-Year Market Share, 2025
- 12.4.6 Segment CAGR and Growth Drivers
- 12.4.7 Subsegment Market Size and Forecast
- 12.4.7.1 Working Dogs
- 12.4.7.2 Equines
- 12.4.7.3 Camels
- 12.4.8 Subsegment Pricing and Adoption Trends
- 12.4.9 Leading Suppliers and Competition
- 12.4.10 Regional Demand and Opportunities
- 12.5 By Application - Market Size and Forecast, 2025-2035
- 12.5.1 Segment Definition and Scope
- 12.5.2 Historical Market Size, 2018-2025
- 12.5.3 Revenue Forecast, 2025-2035
- 12.5.4 Volume Forecast, 2025-2035
- 12.5.5 Base-Year Market Share, 2025
- 12.5.6 Segment CAGR and Growth Drivers
- 12.5.7 Subsegment Market Size and Forecast
- 12.5.7.1 Detection
- 12.5.7.2 Patrol and Tracking
- 12.5.7.3 Pack Logistics
- 12.5.7.4 Ceremonial Duties
- 12.5.8 Subsegment Pricing and Adoption Trends
- 12.5.9 Leading Suppliers and Competition
- 12.5.10 Regional Demand and Opportunities
- 12.6 By Customer Type - Market Size and Forecast, 2025-2035
- 12.6.1 Segment Definition and Scope
- 12.6.2 Historical Market Size, 2018-2025
- 12.6.3 Revenue Forecast, 2025-2035
- 12.6.4 Volume Forecast, 2025-2035
- 12.6.5 Base-Year Market Share, 2025
- 12.6.6 Segment CAGR and Growth Drivers
- 12.6.7 Subsegment Market Size and Forecast
- 12.6.7.1 Army
- 12.6.7.2 Air Force
- 12.6.7.3 Navy
- 12.6.7.4 Border and Paramilitary Forces
- 12.6.8 Subsegment Pricing and Adoption Trends
- 12.6.9 Leading Suppliers and Competition
- 12.6.10 Regional Demand and Opportunities
- 12.7 By Subregion - Market Size and Forecast, 2025-2035
- 12.7.1 Segment Definition and Scope
- 12.7.2 Historical Market Size, 2018-2025
- 12.7.3 Revenue Forecast, 2025-2035
- 12.7.4 Volume Forecast, 2025-2035
- 12.7.5 Base-Year Market Share, 2025
- 12.7.6 Segment CAGR and Growth Drivers
- 12.7.7 Subsegment Market Size and Forecast
- 12.7.7.1 South Asia
- 12.7.7.2 East Asia
- 12.7.7.3 Southeast Asia
- 12.7.7.4 Oceania
- 12.7.8 Subsegment Pricing and Adoption Trends
- 12.7.9 Leading Suppliers and Competition
- 12.7.10 Regional Demand and Opportunities
- 12.8 Segment Growth Comparison
- 12.9 Segment Attractiveness and Priority Matrix
Chapter 13 Asia Pacific Military Animals End-Use and Application Market Outlook
- 13.1 End-Use Industry and Customer Demand Structure
- 13.2 Leading Applications and Customer Groups
- 13.3 End-Use Market Size, Share and Forecast
- 13.4 Major End-Use Industry Deep Dives
- 13.4.1 Customer Requirements and Use Cases
- 13.4.2 Demand and Replacement Cycles
- 13.4.3 Technical and Regulatory Considerations
- 13.4.4 Purchasing and Procurement Models
- 13.4.5 Leading Vendors and Distribution Channels
- 13.4.6 Forecast and Commercial Opportunities
- 13.5 Emerging Applications and Cross-Segment Demand
- 13.6 End-Use Industry Investment Priorities
Chapter 14 Asia Pacific Military Animals Geographic Market Outlook, 2025-2035
- 14.1 Regional Market Size and Country-Level Shares, 2025
- 14.2 Country Market Size Comparison, 2025
- 14.3 Country Market Forecasts, 2025-2035
- 14.4 Subregional Industrial and Demand Clusters
- 14.5 Intra-Regional Pricing and Cost Differences
- 14.6 Cross-Border Trade and Supply Networks
- 14.7 Regional Supply and Demand Balances
- 14.8 Country Opportunity Comparison and Prioritization
Note: Every listed country is covered on the structure shown under the first country.
Chapter 15 Asia Pacific Military Animals Technology, Innovation and Sustainability Outlook
- 15.1 Technology Landscape and Maturity
- 15.2 Product, Process and Service Innovation
- 15.3 AI, Automation and Digital Tools in the Industry
- 15.4 Technology Adoption and Performance Benchmarking
- 15.5 Innovation Pipeline and R&D Investment
- 15.6 Patent and Intellectual Property Trends
- 15.7 Energy Efficiency and Resource Management
- 15.8 Sustainability, Recycling and Circularity
- 15.9 Technology Roadmap, 2025-2035
- 15.10 Risks of Obsolescence and Technology Substitution
Chapter 16 Asia Pacific Military Animals Market Key Strategic Imperatives
- 16.1 Growth and Market Entry Priorities
- 16.2 High-Return Products and Segments
- 16.3 Pricing, Profitability and Cost Optimization
- 16.4 Technology Investment and Product Differentiation
- 16.5 Supply Chain Localization and Resilience
- 16.6 Distribution and Customer Acquisition
- 16.7 Partnership, Acquisition and Capacity Strategy
- 16.8 Regional Expansion Priorities
- 16.9 Short-, Medium- and Long-Term Actions
Chapter 17 Competition Outlook
- 17.1 Industry Competition Characteristics
- 17.2 Market Structure and Concentration
- 17.3 Market Share and Competitive Positioning, 2025
- 17.4 Company-Wise Revenue and Product Benchmarking
- 17.5 Production and Service Capacity Benchmarking
- 17.6 Technology, Pricing and Differentiation
- 17.7 Regional Footprint and Distribution Strength
- 17.8 Mergers, Acquisitions and Strategic Alliances
- 17.9 New Entrants and Competitive Threats
- 17.10 Porter's Five Forces and Industry Attractiveness
- 17.11 Competitive Outlook, 2025-2035
Chapter 18 Company Profiles
- 18.1 Company Coverage and Selection Criteria
- 18.2 K9 Storm
- 18.2.1 Business Description
- 18.2.2 Company Ownership and Geographic Presence
- 18.2.3 Product and Service Portfolio
- 18.2.4 Manufacturing and Operating Footprint
- 18.2.5 Production Capacity and Expansion Plans
- 18.2.6 Financial Performance and Investment
- 18.2.7 Market Share and Competitive Position
- 18.2.8 Technology and Innovation Capabilities
- 18.2.9 Strategic Alliances or Partnerships
- 18.2.10 Recent Developments
- 18.2.11 Growth Strategy and Outlook
- 18.3 Australian Corporate Protection
- 18.4 K9 Solutions Australia
- 18.5 TASK-9
- 18.6 Kaizen K9
- 18.7 The K9 Centre
- 18.8 Commando Kennels
- 18.9 K9 Pro
- 18.10 K9 Hard Case Gear & Services
- 18.11 Von Forell
- 18.12 Other Relevant Market Participants
Note: Every listed company is profiled on the structure shown under the first company. The company list is preliminary and may change based on research findings, market developments, data availability and client requirements.
Chapter 19 Disclaimer
- 19.1 Research and Forecast Disclaimer
- 19.2 Data Source and Estimation Limitations
Note: The depth of individual sections depends on data availability for this market. Volume, capacity, trade and other unit-based metrics are included where applicable.

