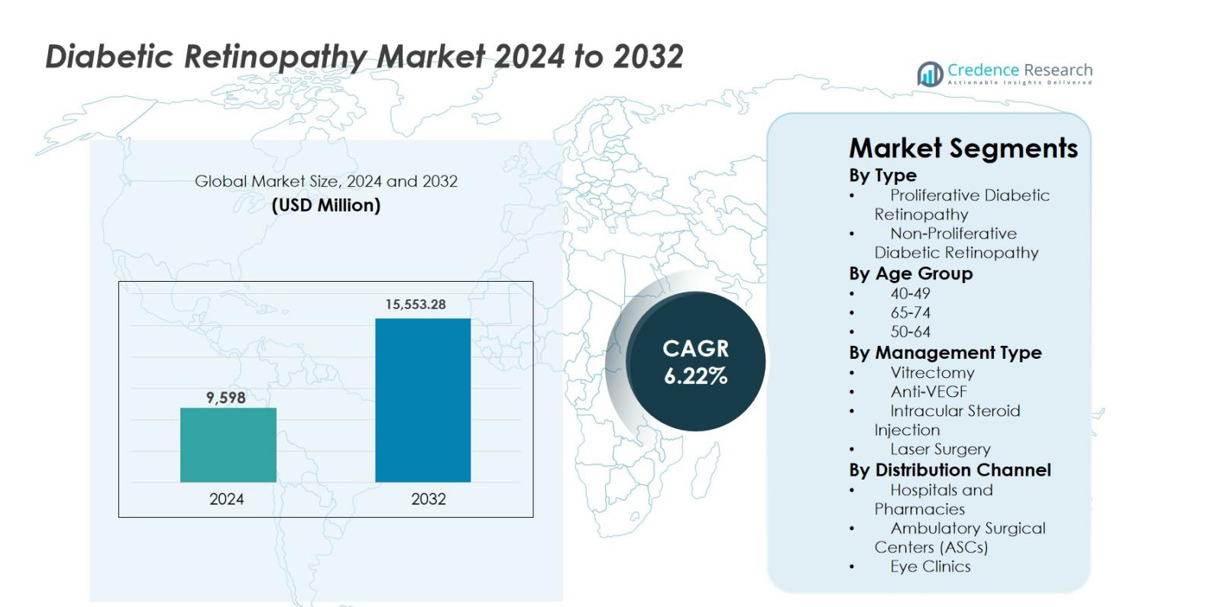
Home » Healthcare » Diabetic Retinopathy Market

Diabetic Retinopathy Market By Type (Non-proliferative Diabetic Retinopathy, Proliferative Diabetic Retinopathy); By Treatment Type (Anti-VEGF Drugs, Steroids, Laser Surgery, Vitrectomy, Intraocular Implants, Others); By End-User (Hospitals, Ophthalmic Clinics, Ambulatory Surgical Centers, Others); By Diabetes Type (Type 1 Diabetes, Type 2 Diabetes); By Distribution Channel (Hospital Pharmacies, Online Pharmacies, Retail Pharmacies); By Product Type (Therapeutics, Diagnostic Equipment, Surgery Devices, Others); By Stage of Diabetic Retinopathy (Mild to Moderate NPDR, Severe NPDR, PDR); By Region – Growth, Share, Opportunities & Competitive Analysis, 2024 – 2032

Price: $4999

Published: | Report ID: 4361 | Report Format : PDF
REPORT ATTRIBUTE DETAILS
Historical Period  2019-2022
Base Year  2023
Forecast Period  2024-2032
Diabetic Retinopathy Market Size 2023  USD 3158.2 Million
Diabetic Retinopathy Market, CAGR  14.50%
Diabetic Retinopathy Market Size 2032  USD 10682.89 Million

Market Insights

  • The demand for diabetic retinopathy is expected to grow at a compound annual growth rate (CAGR) of 14.50% between 2024 and 2032, from its estimated USD 3158.2 million in 2023 to USD 10682.89 million in 2032.
  • The largest type section is non-proliferative diabetic retinopathy (NPDR). On the other hand, proliferative diabetic retinopathy (PDR) is expected to grow at a strong CAGR.
  • Anti-VEGF (Vascular Endothelial Growth Factor) drugs are the leading treatment type segment.
  • The CAGR for hospitals is expected to be the highest during the projection period.
  • Throughout the prediction period, type 1 diabetes will probably have the highest CAGR.
  • Hospital pharmacies are estimated to have the greatest CAGR during the forecast period.
  • The therapeutics segment will likely have the highest CAGR during the prediction period.
  • During forecasting, mild to moderate non-proliferative diabetic retinopathy (NPDR) will probably have the highest CAGR.
  • North America dominated the diabetic retinopathy market.
  • Regarding diabetic retinopathy market share, Europe is expected to come second.
  • In the diabetic retinopathy market, Asia Pacific is anticipated to grow fastest.
  • The main factors propelling the market expansion are the increasing prevalence of diabetes worldwide, the aging population, technological advancements in diagnostic tools, and campaigns to increase diabetes awareness.
  • The expansion of telemedicine, the integration of artificial intelligence, home monitoring devices, and point-of-care testing have created numerous opportunities for the diabetic retinopathy industry.

Diabetic Retinopathy Market

Design Element 2

Access crucial information at unmatched prices!

Request your free sample report today & start making informed decisions powered by Credence Research!

Download Free Sample
CTA Design Element 3

Executive Summary

Market Definition

The market for diabetic retinopathy pertains to the entire economic system involved in identifying, diagnosing, treating, and preventing diabetic retinopathy, a retinal disease caused by diabetes. When long-term high blood sugar levels harm the blood vessels in the retina, it can cause diabetic retinopathy, a dangerous consequence of diabetes that, if untreated, can result in blindness. The market includes a range of goods, services, and technologies designed to manage diabetic retinopathy. These include early-detection diagnostic tools, medications, surgical procedures, and supportive therapies.

Market Overview

With consistent growth in recent years, the global diabetic retinopathy market is predicted to expand at a compound annual growth rate (CAGR) of 14.50% between 2024 and 2032. The market was valued at USD 3158.2 million in 2023 and is expected to reach USD 10682.89 million in 2032.

Diagnostic tool technological developments have been instrumental in improving the diagnosis and treatment of diabetic retinopathy (DR), which has led to a notable increase in the diabetic retinopathy market. If diabetic retinopathy is not identified and treated promptly, it can cause vision loss. Diabetic retinopathy is a common complication of diabetes. Healthcare practitioners can now take detailed retina pictures with high-resolution digital retinal imaging. With the use of this technology, alterations in the retinal vasculature linked to diabetic retinopathy can be identified early. Digital imaging helps to monitor and manage diabetic retinopathy by making it easier to record, compare, and track changes in the retina over time.

OCT is a non-invasive imaging method that offers cross-sectional pictures of the retina, making it possible to see the layers and structures of the retina in great detail.  Modern OCT technology offers faster and higher-resolution imaging, which helps medical practitioners identify minute alterations in the retinal architecture linked to diabetic retinopathy early on. Artificial intelligence (AI) algorithms are used by automated screening systems to evaluate retinal images and automatically identify indicators of diabetic retinopathy. These systems can offer a rapid and economical means of screening many patients and determining which ones might require additional testing by an eye care specialist.

Segmentation by Type

  • Non-proliferative diabetic retinopathy (NPDR) is the market leader by type. One of the early stages of diabetic retinopathy, an eye complication of diabetes, is called non-proliferative diabetic retinopathy (NPDR). Diabetes can potentially cause blood vessel damage in the retina, the light-sensitive tissue at the rear of the eye. The later stage, known as proliferative diabetic retinopathy (PDR), is distinguished from NPDR by abnormal development of new blood vessels but alterations in the retina’s blood vessels.
  • The proliferative diabetic retinopathy (PDR) category is anticipated to exhibit a sizable CAGR during the projected period. The mature stage of proliferative retinopathy is characterized by the growth of aberrant new blood vessels on the retina’s surface. Major vision loss could result from these veins breaking and leaking blood into the vitreous, the translucent, watery gel that fills the eye. Treatment for diabetic retinopathy at this point is usually critical.

Segmentation by Treatment Type

  • The main treatment type is anti-VEGF (Vascular Endothelial Growth Factor) drugs. A series of injections are usually administered as part of anti-VEGF therapy at regular intervals; the frequency of injections is based on the severity of diabetic retinopathy and the patient’s response to treatment. The intention is to keep the growth of aberrant blood vessels suppressed and shield the retina from additional harm.
  • The steroids category will likely register a significant CAGR during forecasting. High blood sugar levels damage the blood vessels in the retina, causing vision problems and, in severe cases, blindness. Steroids are one of the options for the treatment of diabetic retinopathy. They manage inflammation and prevent further damage to the retina.
  • Other treatment types, such as laser surgery, vitrectomy, intraocular implants, and others, also contribute to the demand for diabetic retinopathy.

Segmentation by End-User

  • It is projected that over the projection period, the category of hospitals will grow at the fastest rate. Treatment and care for diabetic retinopathy are frequently specialized. Hospitals are furnished with ophthalmologists and retina specialists, among other eye care experts, who can offer the required medical care. This could entail anti-VEGF injections, laser therapy, or, in more severe situations, surgical procedures.
  • Other end-users, such as ophthalmic clinics and ambulatory surgical centers, also contribute to the demand for diabetic retinopathy.

Segmentation by Diabetes Type

  • The type 1 diabetes category will likely have the highest CAGR during the projection period. Diabetes type 1 is a chronic illness in which the pancreas fails to produce much or any insulin. A hormone called insulin enables cells to absorb glucose from the blood and use it as fuel.
  • Other diabetes types, such as type 2 diabetes, also contribute to the demand for diabetic retinopathy.

Segmentation by Distribution Channel

  • Hospital pharmacies will be expected to have the foremost CAGR during the prediction period. Hospital pharmacies fill prescriptions for drugs used to treat diabetic retinopathy from medical professionals. These prescriptions could include ones that treat associated complications, regulate blood pressure, and manage diabetes.
  • Other distribution channels, such as online and retail pharmacies, also contribute to the demand for diabetic retinopathy.

Segmentation by Product Type

  • Throughout the forecast duration, the category for therapeutics is anticipated to have the greatest CAGR. When considering therapeutics for diabetic retinopathy, it means the various methods and medications utilized to control and minimize the consequences of this diabetic eye condition.
  • Other product types, such as diagnostic equipment, surgery devices, and others, also contribute to the demand for diabetic retinopathy.

Segmentation by Stage of Diabetic Retinopathy

  • Throughout the forecast period, mild to moderate non-proliferative diabetic retinopathy (NPDR) is anticipated to have the highest CAGR. An early stage of diabetic retinopathy, a complication of diabetes that affects the eyes, is called non-proliferative diabetic retinopathy (NPDR). High blood sugar levels harm the blood vessels in the retina, the light-sensitive tissue located at the back of the eye, which results in diabetic retinopathy.
  • Other stages of diabetic retinopathy, such as severe non-proliferative diabetic retinopathy (NPDR) and proliferative diabetic retinopathy (PDR), also contribute to the demand for diabetic retinopathy.

Segmentation by Region

  • North America leads the diabetic retinopathy industry. Diabetes is relatively common in North America and is a major risk factor for diabetic retinopathy. A higher incidence of related complications results from the region’s large diabetic population.
  • Europe is estimated to rank second in market size for diabetic retinopathy.
  • Asia Pacific will witness the most rapid growth of the diabetic retinopathy market.
  • The remaining need for diabetic retinopathy is met by parts of the world such as Africa, the Middle East, and Latin America.

The establishment of drug pipelines, improved patient compliance, telemedicine, remote surveillance, and the use of artificial intelligence for medical purposes are the fundamental factors boosting the diabetic retinopathy market.

Regarding forecasting, the diabetic retinopathy market is leading in North America due to several important factors. Several factors that propel this market include an advanced healthcare infrastructure, pro-drug development government initiatives, and elevated levels of awareness among patients and practitioners. The significant market share of this region can be attributed to the high market penetration of novel products like anti-VEGF medications like Lucentis, Avastin, and Eylea. Numerous factors contribute to this, including high healthcare costs, rising diabetes patient awareness, a well-established healthcare system, and a supportive reimbursement environment.

Moreover, the area is home to cutting-edge medical facilities, including cutting-edge diagnostic and treatment centers. This makes diabetic retinopathy easier to diagnose and treat early. Innovation and research in medicine are centered in North America. It’s possible that local academics and medical experts will actively contribute to improvements in our knowledge of and ability to treat diabetic retinopathy. Patients with diabetic retinopathy in North America frequently have easier access to cutting-edge medical technology and therapies. Better results and a higher standard of care may result from this. In North America, people are generally well-informed about diabetes and its complications. Better management of diabetic retinopathy may result from screening programs and initiatives to identify the condition early.

According to the estimate, growth in the Asia Pacific area is anticipated to be the fastest. The primary causes are China and Japan, which dominate the Asia Pacific region. Regarding revenue share, China dominated the region’s diabetic retinopathy market. This is a result of both the expanding prevalence of diabetes and the presence of large market players. The aging population, the increasing prevalence of lifestyle diseases like obesity, and technological developments in the treatment of diabetic retinopathy are some other factors that will contribute to market expansion.

Furthermore, the high population density in the area may contribute to an increased incidence of diabetic retinopathy since lifestyle factors such as diet and physical activity are frequently linked to diabetes. Several Asia-Pacific nations have made investments to upgrade their medical infrastructure, which includes facilities for eye care. Better identification, diagnosis, and treatment of diabetic retinopathy may result from this.

Key Highlights of the Report

The global diabetic retinopathy market is segmented by type, treatment type, end-user, diabetes type, distribution channel, product type, stage of diabetic retinopathy, and region. As far as the type is concerned, non-proliferative diabetic retinopathy (NPDR) is the market spearhead. Anti-VEGF (Vascular Endothelial Growth Factor) drugs are the top treatment type segment. The hospital category is anticipated to increase at the highest CAGR throughout the projection period. The therapeutics will experience the highest CAGR during the forecast period. Diabetic retinopathy is expanding mostly in North America.

The increasing number of cases of diabetes-related blindness has contributed to the market’s expansion. A microvascular consequence of both type I and type II diabetes is diabetic retinopathy. If left untreated, it can advance to sight-threatening stages, which can result in blindness and visual impairment. A report released by the World Health Organization states that 4.8% of the 37 million cases of blindness worldwide are caused by diabetic retinopathy. It is anticipated that the prevalence of diabetic retinopathy will rise quickly in the United States. One in 29 Americans, or 4.1 million people over 40, are thought to have diabetic retinopathy. Within this group, an estimated 899,000 individuals, or 1 in 132, suffer from vision-threatening diabetic retinopathy. Even with the diabetic population taking all the required precautions, diabetic retinopathy still exists.

However, according to forecasts, North America will hold the largest market share for diabetic retinopathy globally. In North America, the general public is comparatively well-informed about diabetes and its complications. Furthermore, early detection and treatment of diabetic retinopathy may be aided by having access to healthcare services, such as routine eye exams. The market is anticipated to grow fastest in the Asia Pacific region. Due to genetic predisposition, urbanization, and lifestyle modifications, the Asia Pacific region has seen an increase in diabetes cases as a result of ongoing urbanization. The incidence of diabetic retinopathy is significantly influenced by the prevalence of diabetes.

Which Key Factors Are Driving The Global Diabetic Retinopathy Market?

The diabetic retinopathy industry is developing due to several factors, including innovative drug delivery systems, patient advocacy groups, increased healthcare spending, and drug pipeline development.

What Are The Key Challenges In The Global Market For Diabetic Retinopathy?

The diabetic retinopathy market faces several challenges in its expansion, such as low patient awareness, healthcare accessibility issues, high treatment costs, and treatment side effects.

What Market Opportunities Exist For Diabetic Retinopathy Globally?

The usage of artificial intelligence, partnerships with tech companies, pharmacogenomics, and continuous medical education (CME) programs all contribute to the growing prominence of the diabetic retinopathy industry.

Market Drivers

Multiple factors propel the diabetic retinopathy industry across the globe. The primary factors propelling the global diabetic retinopathy market are as follows:

Growing Numbers of People are Suffering from Diabetes

The expanding frequency of diabetes is one of the primary reasons behind the increasing prevalence of diabetic retinopathy globally. The number of people at risk of developing diabetic retinopathy rises with the number of diabetes diagnoses. Diabetes can cause diabetic retinopathy, an eye complication that, if untreated, can result in blindness or vision impairment. The strong correlation between diabetes and diabetic retinopathy can be attributed to multiple factors, which explains why the market for diabetic retinopathy treatments and diagnostics is directly impacted by the rising prevalence of diabetes. The longer a person has diabetes, the higher their chance of developing diabetic retinopathy. Diabetic retinopathy is more likely to develop in people who have had diabetes for longer periods—this ongoing exposure. High blood sugar levels associated with poorly controlled diabetes raise the risk and severity of diabetic retinopathy. In the market for diabetic retinopathy, ineffective diabetes management can hasten the development of retinal damage and call for more extensive intervention and treatment. Improved screening and diagnosis have been made possible by developments in medical technology and a greater understanding of diabetic retinopathy. In the market for diabetic retinopathy, demand for early intervention and treatment is rising as more people receive earlier diagnoses.

Market Restraints

There are several obstacles that the global diabetic retinopathy market must overcome to continue growing. Among them are the following:

High Cost of Treatment

Advanced imaging methods, including fundus photography, optical coherence tomography (OCT), and fluorescein angiography, are used to diagnose diabetic retinopathy. These diagnostic techniques are expensive and complex. Advanced stages of diabetic retinopathy may necessitate vitrectomy or laser therapy as surgical interventions. These operations can be costly and require specialized equipment and trained personnel. Because diabetic retinopathy is a chronic condition, it needs to be continuously monitored to track the disease’s progression and modify treatment. The entire cost is influenced by follow-up appointments with healthcare providers and routine eye exams. The use of state-of-the-art technologies in diabetic retinopathy diagnosis and treatment may result in increased expenses. The price of newer, more sophisticated technologies is often higher, which raises the total cost of care. Providing thorough and reasonably priced treatment for diabetic retinopathy may present difficulties in areas with a weak healthcare infrastructure. Insufficient resources such as specialized facilities, qualified personnel, and essential equipment may increase expenses.

Opportunities

There are plenty of potential prospects in the global diabetic retinopathy industry. Among these are the following:

Increase in the Number of Research and Development Activities

Research and development endeavors have the potential to yield novel and enhanced therapies for diabetic retinopathy. New medications, surgical techniques, or cutting-edge technologies for early detection and intervention could fall under this category. Future studies may lead to the development of more precise and effective diabetic retinopathy diagnostic instruments. Improving diagnostic capabilities can result in timely interventions, potentially preventing severe complications, and early detection is essential for managing the condition. The genetic and molecular components of diabetic retinopathy’s onset and progression may be identified through research. This information may help develop personalized medicine, which would allow doctors to customize a patient’s course of care according to their particular genetic composition and disease symptoms. Research activities frequently enhance our comprehension of the illness, resulting in heightened cognizance among medical practitioners, patients, and the wider community. Better overall results, more proactive management, and earlier detection are possible outcomes. Collaboration between pharmaceutical companies, research institutions, healthcare providers, and regulatory bodies is facilitated by increased research and development efforts. These kinds of partnerships can hasten the creation and authorization of novel therapies, guaranteeing their prompt release onto the market.

Competitive Landscape

Shape Your Report to Specific Countries or Regions & Enjoy 30% Off!

Key Players

There are several major competitors in the fiercely competitive global diabetic retinopathy market. The following are a few of the leading market participants and their market shares:

  • Alimera Science, Inc.
  • Abbvie, Inc.
  • Ampio Pharmaceuticals, Inc.
  • Bayer AG
  • Kowa Co., Ltd.
  • Novartis
  • Pfizer, Inc.
  • Regeneron Pharmaceuticals, Inc.
  • F-Hoffmann-La Roche Ltd
  • Valeant Pharmaceuticals International, Inc.
  • Bausch Health Companies Inc.
  • Others

These companies prioritize product innovation, distribution channel expansion, mergers, and acquisitions to remain competitive.

The major global diabetic retinopathy market players always try to remain ahead of the competition by introducing innovations and products.

In June 2023, The FDA authorised Eyenuk’s usage of the Topcon NW400 retinal camera in conjunction with its EyeArt AI system to automatically identify diabetic retinopathy.

In January 2023, Eyenuk’s EyeArt AI eye screening system has been certified in accordance with European Union Medical Device Regulation (MDR). This certification includes glaucoma, age-related macular degeneration, and diabetic retinopathy detection.

Summary of Key Findings

  • The market for diabetic retinopathy is still growing due to the expansion of artificial intelligence into the healthcare industry.
  • The market is segmented by type, treatment type, end-user, diabetes type, distribution channel, product type, stage of diabetic retinopathy, and region.
  • The most popular type of treatment in the market is anti-VEGF (Vascular Endothelial Growth Factor) drugs.
  • Non-Proliferative diabetic retinopathy (NPDR) is the foremost category.
  • Regarding CAGR, type 1 diabetes is expected to grow fastest during the forecast period.
  • The category for mild to moderate non-proliferative diabetic retinopathy (NPDR) will likely see the highest CAGR during the anticipated time frame.
  • North America is leading market development; the market is highly competitive with key players including Alimera Science, Inc., Abbvie, Inc., Ampio Pharmaceuticals, Inc., Bayer AG, Kowa Co., Ltd., Novartis, Pfizer, Inc., Regeneron Pharmaceuticals, Inc., F-Hoffmann-La Roche Ltd, Valeant Pharmaceuticals International, Inc., Bausch Health Companies Inc., and Others.

Future Outlook

  • The diabetic retinopathy industry is expected to increase significantly in North America and has a positive outlook worldwide.
  • The increasing demand for AI-powered diabetic management apps supports the expansion of the diabetic retinopathy market.
  • Limited coordination of care is one of the key factors anticipated to hamper the development of the diabetic retinopathy market during the forecast timeframe.
  • To stay ahead of the competition, key enterprises must develop new products, expand their market reach, and keep their prices competitive.

How CXOs Can Benefit from the Credence Research Diabetic Retinopathy Market Report

CXOs may get a detailed picture of the market in the Credence Research Diabetic Retinopathy Market Report, which includes:

  • Market size and growth forecast: The report provides detailed estimates of the global diabetic retinopathy market size, segmented by type, treatment type, end-user, diabetes type, distribution channel, product type, stage of diabetic retinopathy, and region. It also includes forecasts for the market through 2032 based on key trends and drivers.
  • Market segmentation: The research report breaks down the market for diabetic retinopathy into segments based on the type, treatment type, end-user, diabetes type, distribution channel, product type, stage of diabetic retinopathy, and region. This segmentation provides CXOs with a granular understanding of the market and the opportunities in each segment.
  • Competitive landscape: The research report offers a detailed analysis of the major companies in the diabetic retinopathy industry, including information on their business plans, line of products, and earnings. CXOs can use this information to evaluate and identify their competitors.
  • Key trends and drivers: The research report identifies and evaluates the main trends and factors influencing the market for diabetic retinopathy. CXOs can use this information to make well-informed choices regarding their plans and investments.

CXOs can use the insights from the Credence Research Diabetic Retinopathy Market Report to:

  • Identify growth opportunities: With the help of this analysis, CXOs may identify new growth opportunities in the diabetic retinopathy sector. For example, the report identifies the growing demand for diabetic retinopathy from hospitals as a key opportunity.
  • Make informed investment decisions: With the help of the report, CXOs can choose diabetic retinopathy wisely. For example, the research study provides information on the critical factors to consider while selecting diabetic retinopathy solutions and evaluating diabetic retinopathy suppliers.
  • Develop competitive strategies: The research report can be used by CXOs to develop competitive strategies for their diabetic retinopathy businesses. For example, the research paper outlines the main strategies suppliers of diabetic retinopathy utilize to differentiate themselves from competitors.
  • Track market developments: CXOs may stay ahead of the curve by tracking market developments with the aid of this research report. For instance, the research report offers insights into the most recent developments and trends in the market for diabetic retinopathy.

In general, CXOs seeking to expand their industry knowledge and spot growth prospects will find the Credence Research Diabetic Retinopathy Market Report a useful tool.

Segmentation

  • By Type
    • Non-proliferative diabetic retinopathy (NPDR)
    • Proliferative diabetic retinopathy (PDR)
  • By Treatment Type
    • Anti-VEGF (Vascular Endothelial Growth Factor) Drugs
    • Steroids
    • Laser Surgery
    • Vitrectomy
    • Intraocular Implants
    • Others
  • By End-User
    • Hospitals
    • Ophthalmic Clinics
    • Ambulatory Surgical Centers
    • Others
  • By Diabetes Type
    • Type 1 Diabetes
    • Type 2 Diabetes
  • By Distribution Channel
    • Hospital Pharmacies
    • Online Pharmacies
    • Retail Pharmacies
  • By Product Type
    • Therapeutics
    • Diagnostic Equipment
    • Surgery Devices
    • Others
  • By Stage of Diabetic Retinopathy
    • Mild to Moderate Non-Proliferative Diabetic Retinopathy (NPDR)
    • Severe Non-Proliferative Diabetic Retinopathy (NPDR)
    • Proliferative Diabetic Retinopathy (PDR)
  • By Region
    • North America
      • The U.S.
      • Canada
      • Mexico
    • Europe
      • Germany
      • France
      • The U.K.
      • Italy
      • Spain
      • Rest of Europe
    • Asia Pacific
      • China
      • Japan
      • India
      • South Korea
      • South-east Asia
      • Rest of Asia Pacific
    • Latin America
      • Brazil
      • Argentina
      • Rest of Latin America
    • Middle East & Africa
      • GCC Countries
      • South Africa
      • Rest of Middle East and Africa

Table of Content
1. Preface
1.1. Report Description
1.1.1. Purpose of the Report
1.1.2. Target Audience
1.1.3. USP and Key Offerings
1.2. Research Scope
1.3. Market Introduction
2. Executive Summary
2.1. Market Snapshot: Global Diabetic Retinopathy Market
2.1.1. Global Diabetic Retinopathy Market, By Type
2.1.2. Global Diabetic Retinopathy Market, By Treatment Type
2.1.3. Global Diabetic Retinopathy Market, By End-User
2.1.4. Global Diabetic Retinopathy Market, By Diabetes Type
2.1.5. Global Diabetic Retinopathy Market, By Distribution Channel
2.1.6. Global Diabetic Retinopathy Market, By Product Type
2.1.7. Global Diabetic Retinopathy Market, By Stage of Diabetic Retinopathy
2.1.8. Global Diabetic Retinopathy Market, By Region
2.2. Insights from Primary Respondents
3. Market Dynamics & Factors Analysis
3.1. Introduction
3.1.1. Global Diabetic Retinopathy Market Value, 2019-2032, (US$ Mn)
3.1.2. Y-o-Y Growth Trend Analysis
3.2. Market Dynamics
3.2.1. Diabetic Retinopathy Market Drivers
3.2.2. Diabetic Retinopathy Market Restraints
3.2.3. Diabetic Retinopathy Market Opportunities
3.2.4. Major Diabetic Retinopathy Industry Challenges
3.3. Growth and Development Patterns
3.4. Investment Feasibility Analysis
3.5. Market Opportunity Analysis
3.5.1. Type
3.5.2. Treatment Type
3.5.3. End-User
3.5.4. Diabetes Type
3.5.5. Distribution Channel
3.5.6. Product Type
3.5.7. Stage of Diabetic Retinopathy
3.5.8. Geography
4. Market Competitive Landscape Analysis
4.1. Company Market Share Analysis, 2023
4.1.1. Global Diabetic Retinopathy Market: Company Market Share, Value 2023
4.1.2. Global Diabetic Retinopathy Market: Top 6 Company Market Share, Value 2023
4.1.3. Global Diabetic Retinopathy Market: Top 3 Company Market Share, Value 2023
4.2. Global Diabetic Retinopathy Market: Company Revenue Share Analysis, 2023
4.3. Company Assessment Metrics, 2023
4.3.1. Stars
4.3.2. Emerging Leaders
4.3.3. Pervasive Players
4.3.4. Participants
4.4. Startups/ SMEs Assessment Metrics, 2023
4.4.1. Progressive Companies
4.4.2. Responsive Companies
4.4.3. Dynamic Companies
4.4.4. Starting Blocks
4.5. Strategic Development
4.5.1. Acquisition and Mergers
4.5.2. New Product Launch
4.5.3. Regional Expansion
4.5.4. Partnerships
4.6. Key Player Product Matrix
4.7. Potential for New Players in the Global Diabetic Retinopathy Market
5. Premium Insights
5.1. STAR (Situation, Task, Action, Results) Analysis
5.2. Porter’s Five Forces Analysis
5.2.1. Threat of New Entrants
5.2.2. Bargaining Power of Buyers/Consumers
5.2.3. Bargaining Power of Suppliers
5.2.4. Threat of Substitute Types
5.2.5. Intensity of Competitive Rivalry
5.3. PESTEL Analysis
5.3.1. Political Factors
5.3.2. Economic Factors
5.3.3. Social Factors
5.3.4. Technological Factors
5.3.5. Environmental Factors
5.3.6. Legal Factors
5.4. Key Market Trends
5.4.1. Demand Side Trends
5.4.2. Supply Side Trends
5.5. Value Chain Analysis
5.6. Technology Analysis
5.6.1. Research and development in the global market
5.6.2. Patent Analysis
5.6.3. Emerging technologies and their potential disruption to the market
5.7. Consumer Behaviour Analysis
5.7.1. Consumer Preferences and Expectations
5.7.2. Factors Influencing Consumer Buying Decisions
5.7.2.1. North America
5.7.2.2. Europe
5.7.2.3. Asia Pacific
5.7.2.4. Latin America
5.7.2.5. Middle East and Africa
5.7.3. Consumer Pain Points
5.8. Analysis and Recommendations
5.9. Adjacent Market Analysis
6. Market Positioning of Key Players, 2023
6.1. Company market share of key players, 2023
6.2. Competitive Benchmarking
6.3. Market Positioning of Key Vendors
6.4. Geographical Presence Analysis
6.5. Major Strategies Adopted by Key Players
6.5.1. Key Strategies Analysis
6.5.2. Mergers and Acquisitions
6.5.3. Partnerships
6.5.4. Product Launch
6.5.5. Geographical Expansion
6.5.6. Others
7. Impact Analysis of COVID 19 and Russia – Ukraine War on Diabetic Retinopathy Market
7.1. Ukraine-Russia War Impact
7.1.1. Uncertainty and Economic Instability
7.1.2. Supply chain disruptions
7.1.3. Regional market shifts
7.1.4. Shift in government priorities
7.2. COVID-19 Impact Analysis
7.2.1. Supply Chain Disruptions
7.2.2. Demand Fluctuations
7.2.3. Shift in Product Mix
7.2.4. Reduced Industrial Activity
7.2.5. Regional Impact Analysis
7.2.5.1. North America
7.2.5.2. Europe
7.2.5.3. Asia Pacific
7.2.5.4. Latin America
7.2.5.5. Middle East and Africa
8. Global Diabetic Retinopathy Market, By Type
8.1. Global Diabetic Retinopathy Market Overview, by Type
8.1.1. Global Diabetic Retinopathy Market Revenue Share, By Type, 2023 Vs 2032 (in %)
8.2. Non-Proliferative Diabetic Retinopathy (NPDR)
8.2.1. Global Diabetic Retinopathy Market, By Non-Proliferative Diabetic Retinopathy (NPDR), By Region, 2019-2032 (US$ Mn)
8.2.2. Market Dynamics for Non-Proliferative Diabetic Retinopathy (NPDR)
8.2.2.1. Drivers
8.2.2.2. Restraints
8.2.2.3. Opportunities
8.2.2.4. Trends
8.3. Proliferative Diabetic Retinopathy (PDR)
8.3.1. Global Diabetic Retinopathy Market, By Proliferative Diabetic Retinopathy (PDR), By Region, 2019-2032 (US$ Mn)
8.3.2. Market Dynamics for Proliferative Diabetic Retinopathy (PDR)
8.3.2.1. Drivers
8.3.2.2. Restraints
8.3.2.3. Opportunities
8.3.2.4. Trends
9. Global Diabetic Retinopathy Market, By Treatment Type
9.1. Global Diabetic Retinopathy Market Overview, by Treatment Type
9.1.1. Global Diabetic Retinopathy Market Revenue Share, By Treatment Type, 2023 Vs 2032 (in %)
9.2. Anti-VEGF (Vascular Endothelial Growth Factor) Drugs
9.2.1. Global Diabetic Retinopathy Market, By Anti-VEGF (Vascular Endothelial Growth Factor) Drugs, By Region, 2019-2032 (US$ Mn)
9.2.2. Market Dynamics for Anti-VEGF (Vascular Endothelial Growth Factor) Drugs
9.2.2.1. Drivers
9.2.2.2. Restraints
9.2.2.3. Opportunities
9.2.2.4. Trends
9.3. Steroids
9.3.1. Global Diabetic Retinopathy Market, By Steroids, By Region, 2019-2032 (US$ Mn)
9.3.2. Market Dynamics for Steroids
9.3.2.1. Drivers
9.3.2.2. Restraints
9.3.2.3. Opportunities
9.3.2.4. Trends
9.4. Laser Surgery
9.4.1. Global Diabetic Retinopathy Market, By Laser Surgery, By Region, 2019-2032 (US$ Mn)
9.4.2. Market Dynamics for Laser Surgery
9.4.2.1. Drivers
9.4.2.2. Restraints
9.4.2.3. Opportunities
9.4.2.4. Trends
9.5. Vitrectomy
9.5.1. Global Diabetic Retinopathy Market, By Vitrectomy, By Region, 2019-2032 (US$ Mn)
9.5.2. Market Dynamics for Vitrectomy
9.5.2.1. Drivers
9.5.2.2. Restraints
9.5.2.3. Opportunities
9.5.2.4. Trends
9.6. Intraocular Implants
9.6.1. Global Diabetic Retinopathy Market, By Intraocular Implants, By Region, 2019-2032 (US$ Mn)
9.6.2. Market Dynamics for Intraocular Implants
9.6.2.1. Drivers
9.6.2.2. Restraints
9.6.2.3. Opportunities
9.6.2.4. Trends
9.7. Others
9.7.1. Global Diabetic Retinopathy Market, By Others, By Region, 2019-2032 (US$ Mn)
9.7.2. Market Dynamics for Others
9.7.2.1. Drivers
9.7.2.2. Restraints
9.7.2.3. Opportunities
9.7.2.4. Trends
10. Global Diabetic Retinopathy Market, By End-User
10.1. Global Diabetic Retinopathy Market Overview, by End-User
10.1.1. Global Diabetic Retinopathy Market Revenue Share, By End-User, 2023 Vs 2032 (in %)
10.2. Hospitals
10.2.1. Global Diabetic Retinopathy Market, By Hospitals, By Region, 2019-2032 (US$ Mn)
10.2.2. Market Dynamics for Hospitals
10.2.2.1. Drivers
10.2.2.2. Restraints
10.2.2.3. Opportunities
10.2.2.4. Trends
10.3. Ophthalmic Clinics
10.3.1. Global Diabetic Retinopathy Market, By Ophthalmic Clinics, By Region, 2019-2032 (US$ Mn)
10.3.2. Market Dynamics for Ophthalmic Clinics
10.3.2.1. Drivers
10.3.2.2. Restraints
10.3.2.3. Opportunities
10.3.2.4. Trends
10.4. Ambulatory Surgical Centers
10.4.1. Global Diabetic Retinopathy Market, By Ambulatory Surgical Centers, By Region, 2019-2032 (US$ Mn)
10.4.2. Market Dynamics for Ambulatory Surgical Centers
10.4.2.1. Drivers
10.4.2.2. Restraints
10.4.2.3. Opportunities
10.4.2.4. Trends
10.5. Others
10.5.1. Global Diabetic Retinopathy Market, By Others, By Region, 2019-2032 (US$ Mn)
10.5.2. Market Dynamics for Others
10.5.2.1. Drivers
10.5.2.2. Restraints
10.5.2.3. Opportunities
10.5.2.4. Trends
11. Global Diabetic Retinopathy Market, By Diabetes Type
11.1. Global Diabetic Retinopathy Market Overview, by Diabetes Type
11.1.1. Global Diabetic Retinopathy Market Revenue Share, By Diabetes Type, 2023 Vs 2032 (in %)
11.2. Type 1 Diabetes
11.2.1. Global Diabetic Retinopathy Market, By Type 1 Diabetes, By Region, 2019-2032 (US$ Mn)
11.2.2. Market Dynamics for Type 1 Diabetes
11.2.2.1. Drivers
11.2.2.2. Restraints
11.2.2.3. Opportunities
11.2.2.4. Trends
11.3. Type 2 Diabetes
11.3.1. Global Diabetic Retinopathy Market, By Type 2 Diabetes, By Region, 2019-2032 (US$ Mn)
11.3.2. Market Dynamics for Type 2 Diabetes
11.3.2.1. Drivers
11.3.2.2. Restraints
11.3.2.3. Opportunities
11.3.2.4. Trends
12. Global Diabetic Retinopathy Market, By Distribution Channel
12.1. Global Diabetic Retinopathy Market Overview, by Distribution Channel:
12.1.1. Global Diabetic Retinopathy Market Revenue Share, By Distribution Channel, 2023 Vs 2032 (in %)
12.2. Hospital Pharmacies
12.2.1. Global Diabetic Retinopathy Market, By Hospital Pharmacies, By Region, 2019-2032 (US$ Mn)
12.2.2. Market Dynamics for Hospital Pharmacies
12.2.2.1. Drivers
12.2.2.2. Restraints
12.2.2.3. Opportunities
12.2.2.4. Trends
12.3. Online Pharmacies
12.3.1. Global Diabetic Retinopathy Market, By Online Pharmacies, By Region, 2019-2032 (US$ Mn)
12.3.2. Market Dynamics for Online Pharmacies
12.3.2.1. Drivers
12.3.2.2. Restraints
12.3.2.3. Opportunities
12.3.2.4. Trends
12.4. Retail Pharmacies
12.4.1. Global Diabetic Retinopathy Market, By Retail Pharmacies, By Region, 2019-2032 (US$ Mn)
12.4.2. Market Dynamics for Retail Pharmacies
12.4.2.1. Drivers
12.4.2.2. Restraints
12.4.2.3. Opportunities
12.4.2.4. Trends
13. Global Diabetic Retinopathy Market, By Product Type
13.1. Global Diabetic Retinopathy Market Overview, by Product Type
13.1.1. Global Diabetic Retinopathy Market Revenue Share, By Product Type, 2023 Vs 2032 (in %)
13.2. Therapeutics
13.2.1. Global Diabetic Retinopathy Market, By Therapeutics, By Region, 2019-2032 (US$ Mn)
13.2.2. Market Dynamics for Therapeutics
13.2.2.1. Drivers
13.2.2.2. Restraints
13.2.2.3. Opportunities
13.2.2.4. Trends
13.3. Diagnostic Equipment
13.3.1. Global Diabetic Retinopathy Market, By Diagnostic Equipment, By Region, 2019-2032 (US$ Mn)
13.3.2. Market Dynamics for Diagnostic Equipment
13.3.2.1. Drivers
13.3.2.2. Restraints
13.3.2.3. Opportunities
13.3.2.4. Trends
13.4. Surgery Devices
13.4.1. Global Diabetic Retinopathy Market, By Surgery Devices, By Region, 2019-2032 (US$ Mn)
13.4.2. Market Dynamics for Surgery Devices
13.4.2.1. Drivers
13.4.2.2. Restraints
13.4.2.3. Opportunities
13.4.2.4. Trends
13.5. Others
13.5.1. Global Diabetic Retinopathy Market, By Others, By Region, 2019-2032 (US$ Mn)
13.5.2. Market Dynamics for Others
13.5.2.1. Drivers
13.5.2.2. Restraints
13.5.2.3. Opportunities
13.5.2.4. Trends
14. Global Diabetic Retinopathy Market, By Stage of Diabetic Retinopathy
14.1. Global Diabetic Retinopathy Market Overview, by Stage of Diabetic Retinopathy
14.1.1. Global Diabetic Retinopathy Market Revenue Share, By Stage of Diabetic Retinopathy, 2023 Vs 2032 (in %)
14.2. Mild to Moderate Non-Proliferative Diabetic Retinopathy (NPDR)
14.2.1. Global Diabetic Retinopathy Market, By Mild to Moderate Non-Proliferative Diabetic Retinopathy (NPDR), By Region, 2019-2032 (US$ Mn)
14.2.2. Market Dynamics for Mild to Moderate Non-Proliferative Diabetic Retinopathy (NPDR)
14.2.2.1. Drivers
14.2.2.2. Restraints
14.2.2.3. Opportunities
14.2.2.4. Trends
14.3. Severe Non-Proliferative Diabetic Retinopathy (NPDR)
14.3.1. Global Diabetic Retinopathy Market, By Severe Non-Proliferative Diabetic Retinopathy (NPDR), By Region, 2019-2032 (US$ Mn)
14.3.2. Market Dynamics for Severe Non-Proliferative Diabetic Retinopathy (NPDR)
14.3.2.1. Drivers
14.3.2.2. Restraints
14.3.2.3. Opportunities
14.3.2.4. Trends
14.4. Proliferative Diabetic Retinopathy (PDR)
14.4.1. Global Diabetic Retinopathy Market, By Proliferative Diabetic Retinopathy (PDR), By Region, 2019-2032 (US$ Mn)
14.4.2. Market Dynamics for Proliferative Diabetic Retinopathy (PDR)
14.4.2.1. Drivers
14.4.2.2. Restraints
14.4.2.3. Opportunities
14.4.2.4. Trends
15. Global Diabetic Retinopathy Market, By Region
15.1. Global Diabetic Retinopathy Market Overview, by Region
15.1.1. Global Diabetic Retinopathy Market, By Region, 2023 Vs 2032 (in%)
15.2. Type
15.2.1. Global Diabetic Retinopathy Market, By Type, 2019-2032 (US$ Mn)
15.3. Treatment Type
15.3.1. Global Diabetic Retinopathy Market, By Treatment Type, 2019-2032 (US$ Mn)
15.4. End-User
15.4.1. Global Diabetic Retinopathy Market, By End-User, 2019-2032 (US$ Mn)
15.5. Diabetes Type
15.5.1. Global Diabetic Retinopathy Market, By Diabetes Type, 2019-2032 (US$ Mn)
15.6. Distribution Channel:
15.6.1. Global Diabetic Retinopathy Market, By Distribution Channel:, 2019-2032 (US$ Mn)
15.7. Product Type
15.7.1. Global Diabetic Retinopathy Market, By Product Type, 2019-2032 (US$ Mn)
15.8. Stage of Diabetic Retinopathy
15.8.1. Global Diabetic Retinopathy Market, By Stage of Diabetic Retinopathy, 2019-2032 (US$ Mn)
16. North America Diabetic Retinopathy Market Analysis
16.1. Overview
16.1.1. Market Dynamics for North America
16.1.1.1. Drivers
16.1.1.2. Restraints
16.1.1.3. Opportunities
16.1.1.4. Trends
16.2. North America Diabetic Retinopathy Market, by Type, 2019-2032(US$ Mn)
16.2.1. Overview
16.2.2. SRC Analysis
16.3. North America Diabetic Retinopathy Market, by Treatment Type, 2019-2032(US$ Mn)
16.3.1. Overview
16.3.2. SRC Analysis
16.4. North America Diabetic Retinopathy Market, by End-User, 2019-2032(US$ Mn)
16.4.1. Overview
16.4.2. SRC Analysis
16.5. North America Diabetic Retinopathy Market, by Diabetes Type, 2019-2032(US$ Mn)
16.5.1. Overview
16.5.2. SRC Analysis
16.6. North America Diabetic Retinopathy Market, by Distribution Channel:, 2019-2032(US$ Mn)
16.6.1. Overview
16.6.2. SRC Analysis
16.7. North America Diabetic Retinopathy Market, by Product Type, 2019-2032(US$ Mn)
16.7.1. Overview
16.7.2. SRC Analysis
16.8. North America Diabetic Retinopathy Market, by Stage of Diabetic Retinopathy, 2019-2032(US$ Mn)
16.8.1. Overview
16.8.2. SRC Analysis
16.9. North America Diabetic Retinopathy Market, by Country, 2019-2032 (US$ Mn)
16.9.1. North America Diabetic Retinopathy Market, by Country, 2023 Vs 2032 (in%)
16.9.2. U.S.
16.9.3. Canada
16.9.4. Mexico
17. Europe Diabetic Retinopathy Market Analysis
17.1. Overview
17.1.1. Market Dynamics for Europe
17.1.1.1. Drivers
17.1.1.2. Restraints
17.1.1.3. Opportunities
17.1.1.4. Trends
17.2. Europe Diabetic Retinopathy Market, by Type, 2019-2032(US$ Mn)
17.2.1. Overview
17.2.2. SRC Analysis
17.3. Europe Diabetic Retinopathy Market, by Treatment Type, 2019-2032(US$ Mn)
17.3.1. Overview
17.3.2. SRC Analysis
17.4. Europe Diabetic Retinopathy Market, by End-User, 2019-2032(US$ Mn)
17.4.1. Overview
17.4.2. SRC Analysis
17.5. Europe Diabetic Retinopathy Market, by Diabetes Type, 2019-2032(US$ Mn)
17.5.1. Overview
17.5.2. SRC Analysis
17.6. Europe Diabetic Retinopathy Market, by Distribution Channel:, 2019-2032(US$ Mn)
17.6.1. Overview
17.6.2. SRC Analysis
17.7. Europe Diabetic Retinopathy Market, by Product Type, 2019-2032(US$ Mn)
17.7.1. Overview
17.7.2. SRC Analysis
17.8. Europe Diabetic Retinopathy Market, by Stage of Diabetic Retinopathy, 2019-2032(US$ Mn)
17.8.1. Overview
17.8.2. SRC Analysis
17.9. Europe Diabetic Retinopathy Market, by Country, 2019-2032 (US$ Mn)
17.9.1. Europe Diabetic Retinopathy Market, by Country, 2023 Vs 2032 (in%)
17.9.2. UK
17.9.3. France
17.9.4. Germany
17.9.5. Italy
17.9.6. Spain
17.9.7. Benelux
17.9.8. Russia
17.9.9. Rest of Europe
18. Asia Pacific Diabetic Retinopathy Market Analysis
18.1. Overview
18.1.1. Market Dynamics for Asia Pacific
18.1.1.1. Drivers
18.1.1.2. Restraints
18.1.1.3. Opportunities
18.1.1.4. Trends
18.2. Asia Pacific Diabetic Retinopathy Market, by Type, 2019-2032(US$ Mn)
18.2.1. Overview
18.2.2. SRC Analysis
18.3. Asia Pacific Diabetic Retinopathy Market, by Treatment Type, 2019-2032(US$ Mn)
18.3.1. Overview
18.3.2. SRC Analysis
18.4. Asia Pacific Diabetic Retinopathy Market, by End-User, 2019-2032(US$ Mn)
18.4.1. Overview
18.4.2. SRC Analysis
18.5. Asia Pacific Diabetic Retinopathy Market, by Diabetes Type, 2019-2032(US$ Mn)
18.5.1. Overview
18.5.2. SRC Analysis
18.6. Asia Pacific Diabetic Retinopathy Market, by Distribution Channel:, 2019-2032(US$ Mn)
18.6.1. Overview
18.6.2. SRC Analysis
18.7. Asia Pacific Diabetic Retinopathy Market, by Product Type, 2019-2032(US$ Mn)
18.7.1. Overview
18.7.2. SRC Analysis
18.8. Asia Pacific Diabetic Retinopathy Market, by Stage of Diabetic Retinopathy, 2019-2032(US$ Mn)
18.8.1. Overview
18.8.2. SRC Analysis
18.9. Asia Pacific Diabetic Retinopathy Market, by Country, 2019-2032 (US$ Mn)
18.9.1. Asia Pacific Diabetic Retinopathy Market, by Country, 2023 Vs 2032 (in%)
18.9.2. China
18.9.3. Japan
18.9.4. India
18.9.5. South Korea
18.9.6. South East Asia
18.9.7. Rest of Asia Pacific
19. Latin America Diabetic Retinopathy Market Analysis
19.1. Overview
19.1.1. Market Dynamics for Latin America
19.1.1.1. Drivers
19.1.1.2. Restraints
19.1.1.3. Opportunities
19.1.1.4. Trends
19.2. Latin America Diabetic Retinopathy Market, by Type, 2019-2032(US$ Mn)
19.2.1. Overview
19.2.2. SRC Analysis
19.3. Latin America Diabetic Retinopathy Market, by Treatment Type, 2019-2032(US$ Mn)
19.3.1. Overview
19.3.2. SRC Analysis
19.4. Latin America Diabetic Retinopathy Market, by End-User, 2019-2032(US$ Mn)
19.4.1. Overview
19.4.2. SRC Analysis
19.5. Latin America Diabetic Retinopathy Market, by Diabetes Type, 2019-2032(US$ Mn)
19.5.1. Overview
19.5.2. SRC Analysis
19.6. Latin America Diabetic Retinopathy Market, by Distribution Channel:, 2019-2032(US$ Mn)
19.6.1. Overview
19.6.2. SRC Analysis
19.7. Latin America Diabetic Retinopathy Market, by Product Type, 2019-2032(US$ Mn)
19.7.1. Overview
19.7.2. SRC Analysis
19.8. Latin America Diabetic Retinopathy Market, by Stage of Diabetic Retinopathy, 2019-2032(US$ Mn)
19.8.1. Overview
19.8.2. SRC Analysis
19.9. Latin America Diabetic Retinopathy Market, by Country, 2019-2032 (US$ Mn)
19.9.1. Latin America Diabetic Retinopathy Market, by Country, 2023 Vs 2032 (in%)
19.9.2. Brazil
19.9.3. Argentina
19.9.4. Rest of Latin America
20. Middle East Diabetic Retinopathy Market Analysis
20.1. Overview
20.1.1. Market Dynamics for Middle East
20.1.1.1. Drivers
20.1.1.2. Restraints
20.1.1.3. Opportunities
20.1.1.4. Trends
20.2. Middle East Diabetic Retinopathy Market, by Type, 2019-2032(US$ Mn)
20.2.1. Overview
20.2.2. SRC Analysis
20.3. Middle East Diabetic Retinopathy Market, by Treatment Type, 2019-2032(US$ Mn)
20.3.1. Overview
20.3.2. SRC Analysis
20.4. Middle East Diabetic Retinopathy Market, by End-User, 2019-2032(US$ Mn)
20.4.1. Overview
20.4.2. SRC Analysis
20.5. Middle East Diabetic Retinopathy Market, by Diabetes Type, 2019-2032(US$ Mn)
20.5.1. Overview
20.5.2. SRC Analysis
20.6. Middle East Diabetic Retinopathy Market, by Distribution Channel:, 2019-2032(US$ Mn)
20.6.1. Overview
20.6.2. SRC Analysis
20.7. Middle East Diabetic Retinopathy Market, by Product Type, 2019-2032(US$ Mn)
20.7.1. Overview
20.7.2. SRC Analysis
20.8. Middle East Diabetic Retinopathy Market, by Stage of Diabetic Retinopathy, 2019-2032(US$ Mn)
20.8.1. Overview
20.8.2. SRC Analysis
20.9. Middle East Diabetic Retinopathy Market, by Country, 2019-2032 (US$ Mn)
20.9.1. Middle East Diabetic Retinopathy Market, by Country, 2023 Vs 2032 (in%)
20.9.2. UAE
20.9.3. Saudi Arabia
20.9.4. Rest of Middle East
21. Africa Diabetic Retinopathy Market Analysis
21.1. Overview
21.1.1. Market Dynamics for Africa
21.1.1.1. Drivers
21.1.1.2. Restraints
21.1.1.3. Opportunities
21.1.1.4. Trends
21.2. Africa Diabetic Retinopathy Market, by Type, 2019-2032(US$ Mn)
21.2.1. Overview
21.2.2. SRC Analysis
21.3. Africa Diabetic Retinopathy Market, by Treatment Type, 2019-2032(US$ Mn)
21.3.1. Overview
21.3.2. SRC Analysis
21.4. Africa Diabetic Retinopathy Market, by End-User, 2019-2032(US$ Mn)
21.4.1. Overview
21.4.2. SRC Analysis
21.5. Africa Diabetic Retinopathy Market, by Diabetes Type, 2019-2032(US$ Mn)
21.5.1. Overview
21.5.2. SRC Analysis
21.6. Africa Diabetic Retinopathy Market, by Distribution Channel:, 2019-2032(US$ Mn)
21.6.1. Overview
21.6.2. SRC Analysis
21.7. Africa Diabetic Retinopathy Market, by Product Type, 2019-2032(US$ Mn)
21.7.1. Overview
21.7.2. SRC Analysis
21.8. Africa Diabetic Retinopathy Market, by Stage of Diabetic Retinopathy, 2019-2032(US$ Mn)
21.8.1. Overview
21.8.2. SRC Analysis
21.9. Africa Diabetic Retinopathy Market, by Country, 2019-2032 (US$ Mn)
21.9.1. Africa Diabetic Retinopathy Market, by Country, 2023 Vs 2032 (in%)
21.9.2. South Africa
21.9.3. Egypt
21.9.4. Rest of Africa
22. Company Profiles
22.1. Alimera Science, Inc.
22.1.1. Company Overview
22.1.2. Products/Services Portfolio
22.1.3. Geographical Presence
22.1.4. SWOT Analysis
22.1.5. Financial Summary
22.1.5.1. Market Revenue and Net Profit (2019-2023)
22.1.5.2. Business Segment Revenue Analysis
22.1.5.3. Geographical Revenue Analysis
22.2. Abbvie, Inc.
22.3. Ampio Pharmaceuticals, Inc.
22.4. Bayer AG
22.5. Kowa Co., Ltd.
22.6. Novartis
22.7. Pfizer, Inc.
22.8. Regeneron Pharmaceuticals, Inc.
22.9. F-Hoffmann-La Roche Ltd
22.10. Valeant Pharmaceuticals International, Inc.
22.11. Bausch Health Companies Inc.
22.12. Others
23. Research Methodology
23.1. Research Methodology
23.2. Phase I – Secondary Research
23.3. Phase II – Data Modelling
23.3.1. Company Share Analysis Model
23.3.2. Revenue Based Modelling
23.4. Phase III – Primary Research
23.5. Research Limitations
23.5.1. Assumptions

List of Figures
FIG. 1 Global Diabetic Retinopathy Market: Research Methodology
FIG. 2 Market Size Estimation – Top Down & Bottom up Approach
FIG. 3 Global Diabetic Retinopathy Market Segmentation
FIG. 4 Global Diabetic Retinopathy Market, by Type, 2023 (US$ Mn)
FIG. 5 Global Diabetic Retinopathy Market, by Treatment Type, 2023 (US$ Mn)
FIG. 6 Global Diabetic Retinopathy Market, by End-User, 2023 (US$ Mn)
FIG. 7 Global Diabetic Retinopathy Market, by Diabetes Type, 2023 (US$ Mn)
FIG. 8 Global Diabetic Retinopathy Market, by Distribution Channel, 2023 (US$ Mn)
FIG. 9 Global Diabetic Retinopathy Market, by Product Type, 2023 (US$ Mn)
FIG. 10 Global Diabetic Retinopathy Market, by Stage of Diabetic Retinopathy, 2023 (US$ Mn)
FIG. 11 Global Diabetic Retinopathy Market, by Geography, 2023 (US$ Mn)
FIG. 12 Attractive Investment Proposition, by Type, 2023
FIG. 13 Attractive Investment Proposition, by Treatment Type, 2023
FIG. 14 Attractive Investment Proposition, by End-User, 2023
FIG. 15 Attractive Investment Proposition, by Diabetes Type, 2023
FIG. 16 Attractive Investment Proposition, by Distribution Channel, 2023
FIG. 17 Attractive Investment Proposition, by Product Type, 2023
FIG. 18 Attractive Investment Proposition, by Stage of Diabetic Retinopathy, 2023
FIG. 19 Attractive Investment Proposition, by Geography, 2023
FIG. 20 Global Market Share Analysis of Key Diabetic Retinopathy Market Manufacturers, 2023
FIG. 21 Global Market Positioning of Key Diabetic Retinopathy Market Manufacturers, 2023
FIG. 22 Global Diabetic Retinopathy Market Value Contribution, By Type, 2023 & 2032 (Value %)
FIG. 23 Global Diabetic Retinopathy Market, by Non-Proliferative Diabetic Retinopathy (NPDR), Value, 2019-2032 (US$ Mn)
FIG. 24 Global Diabetic Retinopathy Market, by Proliferative Diabetic Retinopathy (PDR), Value, 2019-2032 (US$ Mn)
FIG. 25 Global Diabetic Retinopathy Market Value Contribution, By Treatment Type, 2023 & 2032 (Value %)
FIG. 26 Global Diabetic Retinopathy Market, by Anti-VEGF (Vascular Endothelial Growth Factor) Drugs, Value, 2019-2032 (US$ Mn)
FIG. 27 Global Diabetic Retinopathy Market, by Steroids, Value, 2019-2032 (US$ Mn)
FIG. 28 Global Diabetic Retinopathy Market, by Laser Surgery, Value, 2019-2032 (US$ Mn)
FIG. 29 Global Diabetic Retinopathy Market, by Vitrectomy, Value, 2019-2032 (US$ Mn)
FIG. 30 Global Diabetic Retinopathy Market, by Intraocular Implants, Value, 2019-2032 (US$ Mn)
FIG. 31 Global Diabetic Retinopathy Market, by Others, Value, 2019-2032 (US$ Mn)
FIG. 32 Global Diabetic Retinopathy Market Value Contribution, By End-User, 2023 & 2032 (Value %)
FIG. 33 Global Diabetic Retinopathy Market, by Hospitals, Value, 2019-2032 (US$ Mn)
FIG. 34 Global Diabetic Retinopathy Market, by Ophthalmic Clinics, Value, 2019-2032 (US$ Mn)
FIG. 35 Global Diabetic Retinopathy Market, by Ambulatory Surgical Centers, Value, 2019-2032 (US$ Mn)
FIG. 36 Global Diabetic Retinopathy Market, by Others, Value, 2019-2032 (US$ Mn)
FIG. 37 Global Diabetic Retinopathy Market Value Contribution, By Diabetes Type, 2023 & 2032 (Value %)
FIG. 38 Global Diabetic Retinopathy Market, by Type 1 Diabetes, Value, 2019-2032 (US$ Mn)
FIG. 39 Global Diabetic Retinopathy Market, by Type 2 Diabetes, Value, 2019-2032 (US$ Mn)
FIG. 40 Global Diabetic Retinopathy Market Value Contribution, By Distribution Channel:, 2023 & 2032 (Value %)
FIG. 41 Global Diabetic Retinopathy Market, by Hospital Pharmacies, Value, 2019-2032 (US$ Mn)
FIG. 42 Global Diabetic Retinopathy Market, by Online Pharmacies, Value, 2019-2032 (US$ Mn)
FIG. 43 Global Diabetic Retinopathy Market, by Retail Pharmacies, Value, 2019-2032 (US$ Mn)
FIG. 44 Global Diabetic Retinopathy Market Value Contribution, By Product Type, 2023 & 2032 (Value %)
FIG. 45 Global Diabetic Retinopathy Market, by Therapeutics, Value, 2019-2032 (US$ Mn)
FIG. 46 Global Diabetic Retinopathy Market, by Diagnostic Equipment, Value, 2019-2032 (US$ Mn)
FIG. 47 Global Diabetic Retinopathy Market, by Surgery Devices, Value, 2019-2032 (US$ Mn)
FIG. 48 Global Diabetic Retinopathy Market, by Others, Value, 2019-2032 (US$ Mn)
FIG. 49 Global Diabetic Retinopathy Market Value Contribution, By Stage of Diabetic Retinopathy, 2023 & 2032 (Value %)
FIG. 50 Global Diabetic Retinopathy Market, by Mild to Moderate Non-Proliferative Diabetic Retinopathy (NPDR), Value, 2019-2032 (US$ Mn)
FIG. 51 Global Diabetic Retinopathy Market, by Severe Non-Proliferative Diabetic Retinopathy (NPDR), Value, 2019-2032 (US$ Mn)
FIG. 52 Global Diabetic Retinopathy Market, by Proliferative Diabetic Retinopathy (PDR)Value, 2019-2032 (US$ Mn)
FIG. 53 North America Diabetic Retinopathy Market, 2019-2032 (US$ Mn)
FIG. 54 U.S. Diabetic Retinopathy Market, 2019-2032 (US$ Mn)
FIG. 55 Canada Diabetic Retinopathy Market, 2019-2032 (US$ Mn)
FIG. 56 Mexico Diabetic Retinopathy Market, 2019-2032 (US$ Mn)
FIG. 57 Europe Diabetic Retinopathy Market, 2019-2032 (US$ Mn)
FIG. 58 Germany Diabetic Retinopathy Market, 2019-2032 (US$ Mn)
FIG. 59 France Diabetic Retinopathy Market, 2019-2032 (US$ Mn)
FIG. 60 U.K. Diabetic Retinopathy Market, 2019-2032 (US$ Mn)
FIG. 61 Italy Diabetic Retinopathy Market, 2019-2032 (US$ Mn)
FIG. 62 Spain Diabetic Retinopathy Market, 2019-2032 (US$ Mn)
FIG. 63 Benelux Diabetic Retinopathy Market, 2019-2032 (US$ Mn)
FIG. 64 Russia Diabetic Retinopathy Market, 2019-2032 (US$ Mn)
FIG. 65 Rest of Europe Diabetic Retinopathy Market, 2019-2032 (US$ Mn)
FIG. 66 Asia Pacific Diabetic Retinopathy Market, 2019-2032 (US$ Mn)
FIG. 67 China Diabetic Retinopathy Market, 2019-2032 (US$ Mn)
FIG. 68 Japan Diabetic Retinopathy Market, 2019-2032 (US$ Mn)
FIG. 69 India Diabetic Retinopathy Market, 2019-2032 (US$ Mn)
FIG. 70 South Korea Diabetic Retinopathy Market, 2019-2032 (US$ Mn)
FIG. 71 South-East Asia Diabetic Retinopathy Market, 2019-2032 (US$ Mn)
FIG. 72 Rest of Asia Pacific Diabetic Retinopathy Market, 2019-2032 (US$ Mn)
FIG. 73 Latin America Diabetic Retinopathy Market, 2019-2032 (US$ Mn)
FIG. 74 Brazil Diabetic Retinopathy Market, 2019-2032 (US$ Mn)
FIG. 75 Argentina Diabetic Retinopathy Market, 2019-2032 (US$ Mn)
FIG. 76 Rest of Latin America Diabetic Retinopathy Market, 2019-2032 (US$ Mn)
FIG. 77 Middle East Diabetic Retinopathy Market, 2019-2032 (US$ Mn)
FIG. 78 UAE Diabetic Retinopathy Market, 2019-2032 (US$ Mn)
FIG. 79 Saudi Arabia Diabetic Retinopathy Market, 2019-2032 (US$ Mn)
FIG. 80 Rest of Middle East Diabetic Retinopathy Market, 2019-2032 (US$ Mn)
FIG. 81 Africa Diabetic Retinopathy Market, 2019-2032 (US$ Mn)
FIG. 82 South Africa Diabetic Retinopathy Market, 2019-2032 (US$ Mn)
FIG. 83 Egypt Diabetic Retinopathy Market, 2019-2032 (US$ Mn)
FIG. 84 Rest of Africa Diabetic Retinopathy Market, 2019-2032 (US$ Mn)

List of Tables
TABLE 1 Market Snapshot: Global Diabetic Retinopathy Market
TABLE 2 Global Diabetic Retinopathy Market: Market Drivers Impact Analysis
TABLE 3 Global Diabetic Retinopathy Market: Market Restraints Impact Analysis
TABLE 4 Global Diabetic Retinopathy Market, by Competitive Benchmarking, 2023
TABLE 5 Global Diabetic Retinopathy Market, by Geographical Presence Analysis, 2023
TABLE 6 Global Diabetic Retinopathy Market, by Key Strategies Analysis, 2023
TABLE 7 Global Diabetic Retinopathy Market, by Non-Proliferative Diabetic Retinopathy (NPDR), By Region, 2019-2023 (US$ Mn)
TABLE 8 Global Diabetic Retinopathy Market, by Non-Proliferative Diabetic Retinopathy (NPDR), By Region, 2024-2032 (US$ Mn)
TABLE 9 Global Diabetic Retinopathy Market, by Proliferative Diabetic Retinopathy (PDR), By Region, 2019-2023 (US$ Mn)
TABLE 10 Global Diabetic Retinopathy Market, by Proliferative Diabetic Retinopathy (PDR), By Region, 2024-2032 (US$ Mn)
TABLE 11 Global Diabetic Retinopathy Market, by Anti-VEGF (Vascular Endothelial Growth Factor) Drugs, By Region, 2019-2023 (US$ Mn)
TABLE 12 Global Diabetic Retinopathy Market, by Anti-VEGF (Vascular Endothelial Growth Factor) Drugs, By Region, 2024-2032 (US$ Mn)
TABLE 13 Global Diabetic Retinopathy Market, by Steroids, By Region, 2019-2023 (US$ Mn)
TABLE 14 Global Diabetic Retinopathy Market, by Steroids, By Region, 2024-2032 (US$ Mn)
TABLE 15 Global Diabetic Retinopathy Market, by Laser Surgery, By Region, 2019-2023 (US$ Mn)
TABLE 16 Global Diabetic Retinopathy Market, by Laser Surgery, By Region, 2024-2032 (US$ Mn)
TABLE 17 Global Diabetic Retinopathy Market, by Vitrectomy, By Region, 2019-2023 (US$ Mn)
TABLE 18 Global Diabetic Retinopathy Market, by Vitrectomy, By Region, 2024-2032 (US$ Mn)
TABLE 19 Global Diabetic Retinopathy Market, by Intraocular Implants, By Region, 2019-2023 (US$ Mn)
TABLE 20 Global Diabetic Retinopathy Market, by Intraocular Implants, By Region, 2024-2032 (US$ Mn)
TABLE 21 Global Diabetic Retinopathy Market, by Others, By Region, 2019-2023 (US$ Mn)
TABLE 22 Global Diabetic Retinopathy Market, by Others, By Region, 2024-2032 (US$ Mn)
TABLE 23 Global Diabetic Retinopathy Market, by Hospitals, By Region, 2019-2023 (US$ Mn)
TABLE 24 Global Diabetic Retinopathy Market, by Hospitals, By Region, 2024-2032 (US$ Mn)
TABLE 25 Global Diabetic Retinopathy Market, by Ophthalmic Clinics, By Region, 2019-2023 (US$ Mn)
TABLE 26 Global Diabetic Retinopathy Market, by Ophthalmic Clinics, By Region, 2024-2032 (US$ Mn)
TABLE 27 Global Diabetic Retinopathy Market, by Ambulatory Surgical Centers, By Region, 2019-2023 (US$ Mn)
TABLE 28 Global Diabetic Retinopathy Market, by Ambulatory Surgical Centers, By Region, 2024-2032 (US$ Mn)
TABLE 29 Global Diabetic Retinopathy Market, by Others, By Region, 2019-2023 (US$ Mn)
TABLE 30 Global Diabetic Retinopathy Market, by Others, By Region, 2024-2032 (US$ Mn)
TABLE 31 Global Diabetic Retinopathy Market, by Type 1 Diabetes, By Region, 2019-2023 (US$ Mn)
TABLE 32 Global Diabetic Retinopathy Market, by Type 1 Diabetes, By Region, 2024-2032 (US$ Mn)
TABLE 33 Global Diabetic Retinopathy Market, by Type 2 Diabetes, By Region, 2019-2023 (US$ Mn)
TABLE 34 Global Diabetic Retinopathy Market, by Type 2 Diabetes, By Region, 2024-2032 (US$ Mn)
TABLE 35 Global Diabetic Retinopathy Market, by Hospital Pharmacies, By Region, 2019-2023 (US$ Mn)
TABLE 36 Global Diabetic Retinopathy Market, by Hospital Pharmacies, By Region, 2024-2032 (US$ Mn)
TABLE 37 Global Diabetic Retinopathy Market, by Online Pharmacies, By Region, 2019-2023 (US$ Mn)
TABLE 38 Global Diabetic Retinopathy Market, by Online Pharmacies, By Region, 2024-2032 (US$ Mn)
TABLE 39 Global Diabetic Retinopathy Market, by Retail Pharmacies, By Region, 2019-2023 (US$ Mn)
TABLE 40 Global Diabetic Retinopathy Market, by Retail Pharmacies, By Region, 2024-2032 (US$ Mn)
TABLE 41 Global Diabetic Retinopathy Market, by Therapeutics, By Region, 2019-2023 (US$ Mn)
TABLE 42 Global Diabetic Retinopathy Market, by Therapeutics, By Region, 2024-2032 (US$ Mn)
TABLE 43 Global Diabetic Retinopathy Market, by Diagnostic Equipment, By Region, 2019-2023 (US$ Mn)
TABLE 44 Global Diabetic Retinopathy Market, by Diagnostic Equipment, By Region, 2024-2032 (US$ Mn)
TABLE 45 Global Diabetic Retinopathy Market, by Surgery Devices, By Region, 2019-2023 (US$ Mn)
TABLE 46 Global Diabetic Retinopathy Market, by Surgery Devices, By Region, 2024-2032 (US$ Mn)
TABLE 47 Global Diabetic Retinopathy Market, by Others, By Region, 2019-2023 (US$ Mn)
TABLE 48 Global Diabetic Retinopathy Market, by Others, By Region, 2024-2032 (US$ Mn)
TABLE 49 Global Diabetic Retinopathy Market, by Mild to Moderate Non-Proliferative Diabetic Retinopathy (NPDR), By Region, 2019-2023 (US$ Mn)
TABLE 50 Global Diabetic Retinopathy Market, by Mild to Moderate Non-Proliferative Diabetic Retinopathy (NPDR), By Region, 2024-2032 (US$ Mn)
TABLE 51 Global Diabetic Retinopathy Market, by Severe Non-Proliferative Diabetic Retinopathy (NPDR), By Region, 2019-2023 (US$ Mn)
TABLE 52 Global Diabetic Retinopathy Market, by Severe Non-Proliferative Diabetic Retinopathy (NPDR), By Region, 2024-2032 (US$ Mn)
TABLE 53 Global Diabetic Retinopathy Market, by Proliferative Diabetic Retinopathy (PDR), By Region, 2019-2023 (US$ Mn)
TABLE 54 Global Diabetic Retinopathy Market, by Proliferative Diabetic Retinopathy (PDR), By Region, 2024-2032 (US$ Mn)
TABLE 55 Global Diabetic Retinopathy Market, by Type, 2019-2023 (US$ Mn)
TABLE 56 Global Diabetic Retinopathy Market, by Type, 2024-2032 (US$ Mn)
TABLE 57 Global Diabetic Retinopathy Market, by Treatment Type, 2019-2023 (US$ Mn)
TABLE 58 Global Diabetic Retinopathy Market, by Treatment Type, 2024-2032 (US$ Mn)
TABLE 59 Global Diabetic Retinopathy Market, by End-User, 2019-2023 (US$ Mn)
TABLE 60 Global Diabetic Retinopathy Market, by End-User, 2024-2032 (US$ Mn)
TABLE 61 Global Diabetic Retinopathy Market, by Diabetes Type, 2019-2023 (US$ Mn)
TABLE 62 Global Diabetic Retinopathy Market, by Diabetes Type, 2024-2032 (US$ Mn)
TABLE 63 Global Diabetic Retinopathy Market, by Distribution Channel, 2019-2023 (US$ Mn)
TABLE 64 Global Diabetic Retinopathy Market, by Distribution Channel, 2024-2032 (US$ Mn)
TABLE 65 Global Diabetic Retinopathy Market, by Product Type, 2019-2023 (US$ Mn)
TABLE 66 Global Diabetic Retinopathy Market, by Product Type, 2024-2032 (US$ Mn)
TABLE 67 Global Diabetic Retinopathy Market, by Stage of Diabetic Retinopathy, 2019-2023 (US$ Mn)
TABLE 68 Global Diabetic Retinopathy Market, by Stage of Diabetic Retinopathy, 2024-2032 (US$ Mn)
TABLE 69 Global Diabetic Retinopathy Market, by Region, 2019-2023 (US$ Mn)
TABLE 70 Global Diabetic Retinopathy Market, by Region, 2024-2032 (US$ Mn)
TABLE 71 North America Diabetic Retinopathy Market, by Type, 2019-2023 (US$ Mn)
TABLE 72 North America Diabetic Retinopathy Market, by Type, 2024-2032 (US$ Mn)
TABLE 73 North America Diabetic Retinopathy Market, by Treatment Type, 2019-2023 (US$ Mn)
TABLE 74 North America Diabetic Retinopathy Market, by Treatment Type, 2024-2032 (US$ Mn)
TABLE 75 North America Diabetic Retinopathy Market, by End-User, 2019-2023 (US$ Mn)
TABLE 76 North America Diabetic Retinopathy Market, by End-User, 2024-2032 (US$ Mn)
TABLE 77 North America Diabetic Retinopathy Market, by Diabetes Type, 2019-2023 (US$ Mn)
TABLE 78 North America Diabetic Retinopathy Market, by Diabetes Type, 2024-2032 (US$ Mn)
TABLE 79 North America Diabetic Retinopathy Market, by Distribution Channel:, 2019-2023 (US$ Mn)
TABLE 80 North America Diabetic Retinopathy Market, by Distribution Channel:, 2024-2032 (US$ Mn)
TABLE 81 North America Diabetic Retinopathy Market, by Product Type, 2019-2023 (US$ Mn)
TABLE 82 North America Diabetic Retinopathy Market, by Product Type, 2024-2032 (US$ Mn)
TABLE 83 North America Diabetic Retinopathy Market, by Stage of Diabetic Retinopathy, 2019-2023 (US$ Mn)
TABLE 84 North America Diabetic Retinopathy Market, by Stage of Diabetic Retinopathy, 2024-2032 (US$ Mn)
TABLE 85 North America Diabetic Retinopathy Market, by Country, 2019-2023 (US$ Mn)
TABLE 86 North America Diabetic Retinopathy Market, by Country, 2024-2032 (US$ Mn)
TABLE 87 United States Diabetic Retinopathy Market, by Type, 2019-2023 (US$ Mn)
TABLE 88 United States Diabetic Retinopathy Market, by Type, 2024-2032 (US$ Mn)
TABLE 89 United States Diabetic Retinopathy Market, by Treatment Type, 2019-2023 (US$ Mn)
TABLE 90 United States Diabetic Retinopathy Market, by Treatment Type, 2024-2032 (US$ Mn)
TABLE 91 United States Diabetic Retinopathy Market, by End-User, 2019-2023 (US$ Mn)
TABLE 92 United States Diabetic Retinopathy Market, by End-User, 2024-2032 (US$ Mn)
TABLE 93 United States Diabetic Retinopathy Market, by Diabetes Type, 2019-2023 (US$ Mn)
TABLE 94 United States Diabetic Retinopathy Market, by Diabetes Type, 2024-2032 (US$ Mn)
TABLE 95 United States Diabetic Retinopathy Market, by Distribution Channel:, 2019-2023 (US$ Mn)
TABLE 96 United States Diabetic Retinopathy Market, by Distribution Channel:, 2024-2032 (US$ Mn)
TABLE 97 United States Diabetic Retinopathy Market, by Product Type, 2019-2023 (US$ Mn)
TABLE 98 United States Diabetic Retinopathy Market, by Product Type, 2024-2032 (US$ Mn)
TABLE 99 United States Diabetic Retinopathy Market, by Stage of Diabetic Retinopathy, 2019-2023 (US$ Mn)
TABLE 100 United States Diabetic Retinopathy Market, by Stage of Diabetic Retinopathy, 2024-2032 (US$ Mn)
TABLE 101 Canada Diabetic Retinopathy Market, by Type, 2019-2023 (US$ Mn)
TABLE 102 Canada Diabetic Retinopathy Market, by Type, 2024-2032 (US$ Mn)
TABLE 103 Canada Diabetic Retinopathy Market, by Treatment Type, 2019-2023 (US$ Mn)
TABLE 104 Canada Diabetic Retinopathy Market, by Treatment Type, 2024-2032 (US$ Mn)
TABLE 105 Canada Diabetic Retinopathy Market, by End-User, 2019-2023 (US$ Mn)
TABLE 106 Canada Diabetic Retinopathy Market, by End-User, 2024-2032 (US$ Mn)
TABLE 107 Canada Diabetic Retinopathy Market, by Diabetes Type, 2019-2023 (US$ Mn)
TABLE 108 Canada Diabetic Retinopathy Market, by Diabetes Type, 2024-2032 (US$ Mn)
TABLE 109 Canada Diabetic Retinopathy Market, by Distribution Channel:, 2019-2023 (US$ Mn)
TABLE 110 Canada Diabetic Retinopathy Market, by Distribution Channel:, 2024-2032 (US$ Mn)
TABLE 111 Canada Diabetic Retinopathy Market, by Product Type, 2019-2023 (US$ Mn)
TABLE 112 Canada Diabetic Retinopathy Market, by Product Type, 2024-2032 (US$ Mn)
TABLE 113 Canada Diabetic Retinopathy Market, by Stage of Diabetic Retinopathy, 2019-2023 (US$ Mn)
TABLE 114 Canada Diabetic Retinopathy Market, by Stage of Diabetic Retinopathy, 2024-2032 (US$ Mn)
TABLE 115 Mexico Diabetic Retinopathy Market, by Type, 2019-2023 (US$ Mn)
TABLE 116 Mexico Diabetic Retinopathy Market, by Type, 2024-2032 (US$ Mn)
TABLE 117 Mexico Diabetic Retinopathy Market, by Treatment Type, 2019-2023 (US$ Mn)
TABLE 118 Mexico Diabetic Retinopathy Market, by Treatment Type, 2024-2032 (US$ Mn)
TABLE 119 Mexico Diabetic Retinopathy Market, by End-User, 2019-2023 (US$ Mn)
TABLE 120 Mexico Diabetic Retinopathy Market, by End-User, 2024-2032 (US$ Mn)
TABLE 121 Mexico Diabetic Retinopathy Market, by Diabetes Type, 2019-2023 (US$ Mn)
TABLE 122 Mexico Diabetic Retinopathy Market, by Diabetes Type, 2024-2032 (US$ Mn)
TABLE 123 Mexico Diabetic Retinopathy Market, by Distribution Channel:, 2019-2023 (US$ Mn)
TABLE 124 Mexico Diabetic Retinopathy Market, by Distribution Channel:, 2024-2032 (US$ Mn)
TABLE 125 Mexico Diabetic Retinopathy Market, by Product Type, 2019-2023 (US$ Mn)
TABLE 126 Mexico Diabetic Retinopathy Market, by Product Type, 2024-2032 (US$ Mn)
TABLE 127 Mexico Diabetic Retinopathy Market, by Stage of Diabetic Retinopathy, 2019-2023 (US$ Mn)
TABLE 128 Mexico Diabetic Retinopathy Market, by Stage of Diabetic Retinopathy, 2024-2032 (US$ Mn)
TABLE 129 Europe Diabetic Retinopathy Market, by Type, 2019-2023 (US$ Mn)
TABLE 130 Europe Diabetic Retinopathy Market, by Type, 2024-2032 (US$ Mn)
TABLE 131 Europe Diabetic Retinopathy Market, by Treatment Type, 2019-2023 (US$ Mn)
TABLE 132 Europe Diabetic Retinopathy Market, by Treatment Type, 2024-2032 (US$ Mn)
TABLE 133 Europe Diabetic Retinopathy Market, by End-User, 2019-2023 (US$ Mn)
TABLE 134 Europe Diabetic Retinopathy Market, by End-User, 2024-2032 (US$ Mn)
TABLE 135 Europe Diabetic Retinopathy Market, by Diabetes Type, 2019-2023 (US$ Mn)
TABLE 136 Europe Diabetic Retinopathy Market, by Diabetes Type, 2024-2032 (US$ Mn)
TABLE 137 Europe Diabetic Retinopathy Market, by Distribution Channel:, 2019-2023 (US$ Mn)
TABLE 138 Europe Diabetic Retinopathy Market, by Distribution Channel:, 2024-2032 (US$ Mn)
TABLE 139 Europe Diabetic Retinopathy Market, by Product Type, 2019-2023 (US$ Mn)
TABLE 140 Europe Diabetic Retinopathy Market, by Product Type, 2024-2032 (US$ Mn)
TABLE 141 Europe Diabetic Retinopathy Market, by Stage of Diabetic Retinopathy, 2019-2023 (US$ Mn)
TABLE 142 Europe Diabetic Retinopathy Market, by Stage of Diabetic Retinopathy, 2024-2032 (US$ Mn)
TABLE 143 Europe Diabetic Retinopathy Market, by Country, 2019-2023 (US$ Mn)
TABLE 144 Europe Diabetic Retinopathy Market, by Country, 2024-2032 (US$ Mn)
TABLE 145 Germany Diabetic Retinopathy Market, by Type, 2019-2023 (US$ Mn)
TABLE 146 Germany Diabetic Retinopathy Market, by Type, 2024-2032 (US$ Mn)
TABLE 147 Germany Diabetic Retinopathy Market, by Treatment Type, 2019-2023 (US$ Mn)
TABLE 148 Germany Diabetic Retinopathy Market, by Treatment Type, 2024-2032 (US$ Mn)
TABLE 149 Germany Diabetic Retinopathy Market, by End-User, 2019-2023 (US$ Mn)
TABLE 150 Germany Diabetic Retinopathy Market, by End-User, 2024-2032 (US$ Mn)
TABLE 151 Germany Diabetic Retinopathy Market, by Diabetes Type, 2019-2023 (US$ Mn)
TABLE 152 Germany Diabetic Retinopathy Market, by Diabetes Type, 2024-2032 (US$ Mn)
TABLE 153 Germany Diabetic Retinopathy Market, by Distribution Channel:, 2019-2023 (US$ Mn)
TABLE 154 Germany Diabetic Retinopathy Market, by Distribution Channel:, 2024-2032 (US$ Mn)
TABLE 155 Germany Diabetic Retinopathy Market, by Product Type, 2019-2023 (US$ Mn)
TABLE 156 Germany Diabetic Retinopathy Market, by Product Type, 2024-2032 (US$ Mn)
TABLE 157 Germany Diabetic Retinopathy Market, by Stage of Diabetic Retinopathy, 2019-2023 (US$ Mn)
TABLE 158 Germany Diabetic Retinopathy Market, by Stage of Diabetic Retinopathy, 2024-2032 (US$ Mn)
TABLE 159 France Diabetic Retinopathy Market, by Type, 2019-2023 (US$ Mn)
TABLE 160 France Diabetic Retinopathy Market, by Type, 2024-2032 (US$ Mn)
TABLE 161 France Diabetic Retinopathy Market, by Treatment Type, 2019-2023 (US$ Mn)
TABLE 162 France Diabetic Retinopathy Market, by Treatment Type, 2024-2032 (US$ Mn)
TABLE 163 France Diabetic Retinopathy Market, by End-User, 2019-2023 (US$ Mn)
TABLE 164 France Diabetic Retinopathy Market, by End-User, 2024-2032 (US$ Mn)
TABLE 165 France Diabetic Retinopathy Market, by Diabetes Type, 2019-2023 (US$ Mn)
TABLE 166 France Diabetic Retinopathy Market, by Diabetes Type, 2024-2032 (US$ Mn)
TABLE 167 France Diabetic Retinopathy Market, by Distribution Channel:, 2019-2023 (US$ Mn)
TABLE 168 France Diabetic Retinopathy Market, by Distribution Channel:, 2024-2032 (US$ Mn)
TABLE 169 France Diabetic Retinopathy Market, by Product Type, 2019-2023 (US$ Mn)
TABLE 170 France Diabetic Retinopathy Market, by Product Type, 2024-2032 (US$ Mn)
TABLE 171 France Diabetic Retinopathy Market, by Stage of Diabetic Retinopathy, 2019-2023 (US$ Mn)
TABLE 172 France Diabetic Retinopathy Market, by Stage of Diabetic Retinopathy, 2024-2032 (US$ Mn)
TABLE 173 United Kingdom Diabetic Retinopathy Market, by Type, 2019-2023 (US$ Mn)
TABLE 174 United Kingdom Diabetic Retinopathy Market, by Type, 2024-2032 (US$ Mn)
TABLE 175 United Kingdom Diabetic Retinopathy Market, by Treatment Type, 2019-2023 (US$ Mn)
TABLE 176 United Kingdom Diabetic Retinopathy Market, by Treatment Type, 2024-2032 (US$ Mn)
TABLE 177 United Kingdom Diabetic Retinopathy Market, by End-User, 2019-2023 (US$ Mn)
TABLE 178 United Kingdom Diabetic Retinopathy Market, by End-User, 2024-2032 (US$ Mn)
TABLE 179 United Kingdom Diabetic Retinopathy Market, by Diabetes Type, 2019-2023 (US$ Mn)
TABLE 180 United Kingdom Diabetic Retinopathy Market, by Diabetes Type, 2024-2032 (US$ Mn)
TABLE 181 United Kingdom Diabetic Retinopathy Market, by Distribution Channel:, 2019-2023 (US$ Mn)
TABLE 182 United Kingdom Diabetic Retinopathy Market, by Distribution Channel:, 2024-2032 (US$ Mn)
TABLE 183 United Kingdom Diabetic Retinopathy Market, by Product Type, 2019-2023 (US$ Mn)
TABLE 184 United Kingdom Diabetic Retinopathy Market, by Product Type, 2024-2032 (US$ Mn)
TABLE 185 United Kingdom Diabetic Retinopathy Market, by Stage of Diabetic Retinopathy, 2019-2023 (US$ Mn)
TABLE 186 United Kingdom Diabetic Retinopathy Market, by Stage of Diabetic Retinopathy, 2024-2032 (US$ Mn)
TABLE 187 Italy Diabetic Retinopathy Market, by Type, 2019-2023 (US$ Mn)
TABLE 188 Italy Diabetic Retinopathy Market, by Type, 2024-2032 (US$ Mn)
TABLE 189 Italy Diabetic Retinopathy Market, by Treatment Type, 2019-2023 (US$ Mn)
TABLE 190 Italy Diabetic Retinopathy Market, by Treatment Type, 2024-2032 (US$ Mn)
TABLE 191 Italy Diabetic Retinopathy Market, by End-User, 2019-2023 (US$ Mn)
TABLE 192 Italy Diabetic Retinopathy Market, by End-User, 2024-2032 (US$ Mn)
TABLE 193 Italy Diabetic Retinopathy Market, by Diabetes Type, 2019-2023 (US$ Mn)
TABLE 194 Italy Diabetic Retinopathy Market, by Diabetes Type, 2024-2032 (US$ Mn)
TABLE 195 Italy Diabetic Retinopathy Market, by Distribution Channel:, 2019-2023 (US$ Mn)
TABLE 196 Italy Diabetic Retinopathy Market, by Distribution Channel:, 2024-2032 (US$ Mn)
TABLE 197 Italy Diabetic Retinopathy Market, by Product Type, 2019-2023 (US$ Mn)
TABLE 198 Italy Diabetic Retinopathy Market, by Product Type, 2024-2032 (US$ Mn)
TABLE 199 Italy Diabetic Retinopathy Market, by Stage of Diabetic Retinopathy, 2019-2023 (US$ Mn)
TABLE 200 Italy Diabetic Retinopathy Market, by Stage of Diabetic Retinopathy, 2024-2032 (US$ Mn)
TABLE 201 Spain Diabetic Retinopathy Market, by Type, 2019-2023 (US$ Mn)
TABLE 202 Spain Diabetic Retinopathy Market, by Type, 2024-2032 (US$ Mn)
TABLE 203 Spain Diabetic Retinopathy Market, by Treatment Type, 2019-2023 (US$ Mn)
TABLE 204 Spain Diabetic Retinopathy Market, by Treatment Type, 2024-2032 (US$ Mn)
TABLE 205 Spain Diabetic Retinopathy Market, by End-User, 2019-2023 (US$ Mn)
TABLE 206 Spain Diabetic Retinopathy Market, by End-User, 2024-2032 (US$ Mn)
TABLE 207 Spain Diabetic Retinopathy Market, by Diabetes Type, 2019-2023 (US$ Mn)
TABLE 208 Spain Diabetic Retinopathy Market, by Diabetes Type, 2024-2032 (US$ Mn)
TABLE 209 Spain Diabetic Retinopathy Market, by Distribution Channel:, 2019-2023 (US$ Mn)
TABLE 210 Spain Diabetic Retinopathy Market, by Distribution Channel:, 2024-2032 (US$ Mn)
TABLE 211 Spain Diabetic Retinopathy Market, by Product Type, 2019-2023 (US$ Mn)
TABLE 212 Spain Diabetic Retinopathy Market, by Product Type, 2024-2032 (US$ Mn)
TABLE 213 Spain Diabetic Retinopathy Market, by Stage of Diabetic Retinopathy, 2019-2023 (US$ Mn)
TABLE 214 Spain Diabetic Retinopathy Market, by Stage of Diabetic Retinopathy, 2024-2032 (US$ Mn)
TABLE 215 Benelux Diabetic Retinopathy Market, by Type, 2019-2023 (US$ Mn)
TABLE 216 Benelux Diabetic Retinopathy Market, by Type, 2024-2032 (US$ Mn)
TABLE 217 Benelux Diabetic Retinopathy Market, by Treatment Type, 2019-2023 (US$ Mn)
TABLE 218 Benelux Diabetic Retinopathy Market, by Treatment Type, 2024-2032 (US$ Mn)
TABLE 219 Benelux Diabetic Retinopathy Market, by End-User, 2019-2023 (US$ Mn)
TABLE 220 Benelux Diabetic Retinopathy Market, by End-User, 2024-2032 (US$ Mn)
TABLE 221 Benelux Diabetic Retinopathy Market, by Diabetes Type, 2019-2023 (US$ Mn)
TABLE 222 Benelux Diabetic Retinopathy Market, by Diabetes Type, 2024-2032 (US$ Mn)
TABLE 223 Benelux Diabetic Retinopathy Market, by Distribution Channel:, 2019-2023 (US$ Mn)
TABLE 224 Benelux Diabetic Retinopathy Market, by Distribution Channel:, 2024-2032 (US$ Mn)
TABLE 225 Benelux Diabetic Retinopathy Market, by Product Type, 2019-2023 (US$ Mn)
TABLE 226 Benelux Diabetic Retinopathy Market, by Product Type, 2024-2032 (US$ Mn)
TABLE 227 Benelux Diabetic Retinopathy Market, by Stage of Diabetic Retinopathy, 2019-2023 (US$ Mn)
TABLE 228 Benelux Diabetic Retinopathy Market, by Stage of Diabetic Retinopathy, 2024-2032 (US$ Mn)
TABLE 229 Russia Diabetic Retinopathy Market, by Type, 2019-2023 (US$ Mn)
TABLE 230 Russia Diabetic Retinopathy Market, by Type, 2024-2032 (US$ Mn)
TABLE 231 Russia Diabetic Retinopathy Market, by Treatment Type, 2019-2023 (US$ Mn)
TABLE 232 Russia Diabetic Retinopathy Market, by Treatment Type, 2024-2032 (US$ Mn)
TABLE 233 Russia Diabetic Retinopathy Market, by End-User, 2019-2023 (US$ Mn)
TABLE 234 Russia Diabetic Retinopathy Market, by End-User, 2024-2032 (US$ Mn)
TABLE 235 Russia Diabetic Retinopathy Market, by Diabetes Type, 2019-2023 (US$ Mn)
TABLE 236 Russia Diabetic Retinopathy Market, by Diabetes Type, 2024-2032 (US$ Mn)
TABLE 237 Russia Diabetic Retinopathy Market, by Distribution Channel:, 2019-2023 (US$ Mn)
TABLE 238 Russia Diabetic Retinopathy Market, by Distribution Channel:, 2024-2032 (US$ Mn)
TABLE 239 Russia Diabetic Retinopathy Market, by Product Type, 2019-2023 (US$ Mn)
TABLE 240 Russia Diabetic Retinopathy Market, by Product Type, 2024-2032 (US$ Mn)
TABLE 241 Russia Diabetic Retinopathy Market, by Stage of Diabetic Retinopathy, 2019-2023 (US$ Mn)
TABLE 242 Russia Diabetic Retinopathy Market, by Stage of Diabetic Retinopathy, 2024-2032 (US$ Mn)
TABLE 243 Rest of Europe Diabetic Retinopathy Market, by Type, 2019-2023 (US$ Mn)
TABLE 244 Rest of Europe Diabetic Retinopathy Market, by Type, 2024-2032 (US$ Mn)
TABLE 245 Rest of Europe Diabetic Retinopathy Market, by Treatment Type, 2019-2023 (US$ Mn)
TABLE 246 Rest of Europe Diabetic Retinopathy Market, by Treatment Type, 2024-2032 (US$ Mn)
TABLE 247 Rest of Europe Diabetic Retinopathy Market, by End-User, 2019-2023 (US$ Mn)
TABLE 248 Rest of Europe Diabetic Retinopathy Market, by End-User, 2024-2032 (US$ Mn)
TABLE 249 Rest of Europe Diabetic Retinopathy Market, by Diabetes Type, 2019-2023 (US$ Mn)
TABLE 250 Rest of Europe Diabetic Retinopathy Market, by Diabetes Type, 2024-2032 (US$ Mn)
TABLE 251 Rest of Europe Diabetic Retinopathy Market, by Distribution Channel:, 2019-2023 (US$ Mn)
TABLE 252 Rest of Europe Diabetic Retinopathy Market, by Distribution Channel:, 2024-2032 (US$ Mn)
TABLE 253 Rest of Europe Diabetic Retinopathy Market, by Product Type, 2019-2023 (US$ Mn)
TABLE 254 Rest of Europe Diabetic Retinopathy Market, by Product Type, 2024-2032 (US$ Mn)
TABLE 255 Rest of Europe Diabetic Retinopathy Market, by Stage of Diabetic Retinopathy, 2019-2023 (US$ Mn)
TABLE 256 Rest of Europe Diabetic Retinopathy Market, by Stage of Diabetic Retinopathy, 2024-2032 (US$ Mn)
TABLE 257 Asia Pacific Diabetic Retinopathy Market, by Type, 2019-2023 (US$ Mn)
TABLE 258 Asia Pacific Diabetic Retinopathy Market, by Type, 2024-2032 (US$ Mn)
TABLE 259 Asia Pacific Diabetic Retinopathy Market, by Treatment Type, 2019-2023 (US$ Mn)
TABLE 260 Asia Pacific Diabetic Retinopathy Market, by Treatment Type, 2024-2032 (US$ Mn)
TABLE 261 Asia Pacific Diabetic Retinopathy Market, by End-User, 2019-2023 (US$ Mn)
TABLE 262 Asia Pacific Diabetic Retinopathy Market, by End-User, 2024-2032 (US$ Mn)
TABLE 263 Asia Pacific Diabetic Retinopathy Market, by Diabetes Type, 2019-2023 (US$ Mn)
TABLE 264 Asia Pacific Diabetic Retinopathy Market, by Diabetes Type, 2024-2032 (US$ Mn)
TABLE 265 Asia Pacific Diabetic Retinopathy Market, by Distribution Channel:, 2019-2023 (US$ Mn)
TABLE 266 Asia Pacific Diabetic Retinopathy Market, by Distribution Channel:, 2024-2032 (US$ Mn)
TABLE 267 Asia Pacific Diabetic Retinopathy Market, by Product Type, 2019-2023 (US$ Mn)
TABLE 268 Asia Pacific Diabetic Retinopathy Market, by Product Type, 2024-2032 (US$ Mn)
TABLE 269 Asia Pacific Diabetic Retinopathy Market, by Stage of Diabetic Retinopathy, 2019-2023 (US$ Mn)
TABLE 270 Asia Pacific Diabetic Retinopathy Market, by Stage of Diabetic Retinopathy, 2024-2032 (US$ Mn)
TABLE 271 China Diabetic Retinopathy Market, by Type, 2019-2023 (US$ Mn)
TABLE 272 China Diabetic Retinopathy Market, by Type, 2024-2032 (US$ Mn)
TABLE 273 China Diabetic Retinopathy Market, by Treatment Type, 2019-2023 (US$ Mn)
TABLE 274 China Diabetic Retinopathy Market, by Treatment Type, 2024-2032 (US$ Mn)
TABLE 275 China Diabetic Retinopathy Market, by End-User, 2019-2023 (US$ Mn)
TABLE 276 China Diabetic Retinopathy Market, by End-User, 2024-2032 (US$ Mn)
TABLE 277 China Diabetic Retinopathy Market, by Diabetes Type, 2019-2023 (US$ Mn)
TABLE 278 China Diabetic Retinopathy Market, by Diabetes Type, 2024-2032 (US$ Mn)
TABLE 279 China Diabetic Retinopathy Market, by Distribution Channel:, 2019-2023 (US$ Mn)
TABLE 280 China Diabetic Retinopathy Market, by Distribution Channel:, 2024-2032 (US$ Mn)
TABLE 281 China Diabetic Retinopathy Market, by Product Type, 2019-2023 (US$ Mn)
TABLE 282 China Diabetic Retinopathy Market, by Product Type, 2024-2032 (US$ Mn)
TABLE 283 China Diabetic Retinopathy Market, by Stage of Diabetic Retinopathy, 2019-2023 (US$ Mn)
TABLE 284 China Diabetic Retinopathy Market, by Stage of Diabetic Retinopathy, 2024-2032 (US$ Mn)
TABLE 285 Japan Diabetic Retinopathy Market, by Type, 2019-2023 (US$ Mn)
TABLE 286 Japan Diabetic Retinopathy Market, by Type, 2024-2032 (US$ Mn)
TABLE 287 Japan Diabetic Retinopathy Market, by Treatment Type, 2019-2023 (US$ Mn)
TABLE 288 Japan Diabetic Retinopathy Market, by Treatment Type, 2024-2032 (US$ Mn)
TABLE 289 Japan Diabetic Retinopathy Market, by End-User, 2019-2023 (US$ Mn)
TABLE 290 Japan Diabetic Retinopathy Market, by End-User, 2024-2032 (US$ Mn)
TABLE 291 Japan Diabetic Retinopathy Market, by Diabetes Type, 2019-2023 (US$ Mn)
TABLE 292 Japan Diabetic Retinopathy Market, by Diabetes Type, 2024-2032 (US$ Mn)
TABLE 293 Japan Diabetic Retinopathy Market, by Distribution Channel:, 2019-2023 (US$ Mn)
TABLE 294 Japan Diabetic Retinopathy Market, by Distribution Channel:, 2024-2032 (US$ Mn)
TABLE 295 Japan Diabetic Retinopathy Market, by Product Type, 2019-2023 (US$ Mn)
TABLE 296 Japan Diabetic Retinopathy Market, by Product Type, 2024-2032 (US$ Mn)
TABLE 297 Japan Diabetic Retinopathy Market, by Stage of Diabetic Retinopathy, 2019-2023 (US$ Mn)
TABLE 298 Japan Diabetic Retinopathy Market, by Stage of Diabetic Retinopathy, 2024-2032 (US$ Mn)
TABLE 299 India Diabetic Retinopathy Market, by Type, 2019-2023 (US$ Mn)
TABLE 300 India Diabetic Retinopathy Market, by Type, 2024-2032 (US$ Mn)
TABLE 301 India Diabetic Retinopathy Market, by Treatment Type, 2019-2023 (US$ Mn)
TABLE 302 India Diabetic Retinopathy Market, by Treatment Type, 2024-2032 (US$ Mn)
TABLE 303 India Diabetic Retinopathy Market, by End-User, 2019-2023 (US$ Mn)
TABLE 304 India Diabetic Retinopathy Market, by End-User, 2024-2032 (US$ Mn)
TABLE 305 India Diabetic Retinopathy Market, by Diabetes Type, 2019-2023 (US$ Mn)
TABLE 306 India Diabetic Retinopathy Market, by Diabetes Type, 2024-2032 (US$ Mn)
TABLE 307 India Diabetic Retinopathy Market, by Distribution Channel:, 2019-2023 (US$ Mn)
TABLE 308 India Diabetic Retinopathy Market, by Distribution Channel:, 2024-2032 (US$ Mn)
TABLE 309 India Diabetic Retinopathy Market, by Product Type, 2019-2023 (US$ Mn)
TABLE 310 India Diabetic Retinopathy Market, by Product Type, 2024-2032 (US$ Mn)
TABLE 311 India Diabetic Retinopathy Market, by Stage of Diabetic Retinopathy, 2019-2023 (US$ Mn)
TABLE 312 India Diabetic Retinopathy Market, by Stage of Diabetic Retinopathy, 2024-2032 (US$ Mn)
TABLE 313 South Korea Diabetic Retinopathy Market, by Type, 2019-2023 (US$ Mn)
TABLE 314 South Korea Diabetic Retinopathy Market, by Type, 2024-2032 (US$ Mn)
TABLE 315 South Korea Diabetic Retinopathy Market, by Treatment Type, 2019-2023 (US$ Mn)
TABLE 316 South Korea Diabetic Retinopathy Market, by Treatment Type, 2024-2032 (US$ Mn)
TABLE 317 South Korea Diabetic Retinopathy Market, by End-User, 2019-2023 (US$ Mn)
TABLE 318 South Korea Diabetic Retinopathy Market, by End-User, 2024-2032 (US$ Mn)
TABLE 319 South Korea Diabetic Retinopathy Market, by Diabetes Type, 2019-2023 (US$ Mn)
TABLE 320 South Korea Diabetic Retinopathy Market, by Diabetes Type, 2024-2032 (US$ Mn)
TABLE 321 South Korea Diabetic Retinopathy Market, by Distribution Channel:, 2019-2023 (US$ Mn)
TABLE 322 South Korea Diabetic Retinopathy Market, by Distribution Channel:, 2024-2032 (US$ Mn)
TABLE 323 South Korea Diabetic Retinopathy Market, by Product Type, 2019-2023 (US$ Mn)
TABLE 324 South Korea Diabetic Retinopathy Market, by Product Type, 2024-2032 (US$ Mn)
TABLE 325 South Korea Diabetic Retinopathy Market, by Stage of Diabetic Retinopathy, 2019-2023 (US$ Mn)
TABLE 326 South Korea Diabetic Retinopathy Market, by Stage of Diabetic Retinopathy, 2024-2032 (US$ Mn)
TABLE 327 South-East Asia Diabetic Retinopathy Market, by Type, 2019-2023 (US$ Mn)
TABLE 328 South-East Asia Diabetic Retinopathy Market, by Type, 2024-2032 (US$ Mn)
TABLE 329 South-East Asia Diabetic Retinopathy Market, by Treatment Type, 2019-2023 (US$ Mn)
TABLE 330 South-East Asia Diabetic Retinopathy Market, by Treatment Type, 2024-2032 (US$ Mn)
TABLE 331 South-East Asia Diabetic Retinopathy Market, by End-User, 2019-2023 (US$ Mn)
TABLE 332 South-East Asia Diabetic Retinopathy Market, by End-User, 2024-2032 (US$ Mn)
TABLE 333 South-East Asia Diabetic Retinopathy Market, by Diabetes Type, 2019-2023 (US$ Mn)
TABLE 334 South-East Asia Diabetic Retinopathy Market, by Diabetes Type, 2024-2032 (US$ Mn)
TABLE 335 South-East Asia Diabetic Retinopathy Market, by Distribution Channel:, 2019-2023 (US$ Mn)
TABLE 336 South-East Asia Diabetic Retinopathy Market, by Distribution Channel:, 2024-2032 (US$ Mn)
TABLE 337 South-East Asia Diabetic Retinopathy Market, by Product Type, 2019-2023 (US$ Mn)
TABLE 338 South-East Asia Diabetic Retinopathy Market, by Product Type, 2024-2032 (US$ Mn)
TABLE 339 South-East Asia Diabetic Retinopathy Market, by Stage of Diabetic Retinopathy, 2019-2023 (US$ Mn)
TABLE 340 South-East Asia Diabetic Retinopathy Market, by Stage of Diabetic Retinopathy, 2024-2032 (US$ Mn)
TABLE 341 Rest of Asia Pacific Diabetic Retinopathy Market, by Type, 2019-2023 (US$ Mn)
TABLE 342 Rest of Asia Pacific Diabetic Retinopathy Market, by Type, 2024-2032 (US$ Mn)
TABLE 343 Rest of Asia Pacific Diabetic Retinopathy Market, by Treatment Type, 2019-2023 (US$ Mn)
TABLE 344 Rest of Asia Pacific Diabetic Retinopathy Market, by Treatment Type, 2024-2032 (US$ Mn)
TABLE 345 Rest of Asia Pacific Diabetic Retinopathy Market, by End-User, 2019-2023 (US$ Mn)
TABLE 346 Rest of Asia Pacific Diabetic Retinopathy Market, by End-User, 2024-2032 (US$ Mn)
TABLE 347 Rest of Asia Pacific Diabetic Retinopathy Market, by Diabetes Type, 2019-2023 (US$ Mn)
TABLE 348 Rest of Asia Pacific Diabetic Retinopathy Market, by Diabetes Type, 2024-2032 (US$ Mn)
TABLE 349 Rest of Asia Pacific Diabetic Retinopathy Market, by Distribution Channel:, 2019-2023 (US$ Mn)
TABLE 350 Rest of Asia Pacific Diabetic Retinopathy Market, by Distribution Channel:, 2024-2032 (US$ Mn)
TABLE 351 Rest of Asia Pacific Diabetic Retinopathy Market, by Product Type, 2019-2023 (US$ Mn)
TABLE 352 Rest of Asia Pacific Diabetic Retinopathy Market, by Product Type, 2024-2032 (US$ Mn)
TABLE 353 Rest of Asia Pacific Diabetic Retinopathy Market, by Stage of Diabetic Retinopathy, 2019-2023 (US$ Mn)
TABLE 354 Rest of Asia Pacific Diabetic Retinopathy Market, by Stage of Diabetic Retinopathy, 2024-2032 (US$ Mn)
TABLE 355 Latin America Diabetic Retinopathy Market, by Type, 2019-2023 (US$ Mn)
TABLE 356 Latin America Diabetic Retinopathy Market, by Type, 2024-2032 (US$ Mn)
TABLE 357 Latin America Diabetic Retinopathy Market, by Treatment Type, 2019-2023 (US$ Mn)
TABLE 358 Latin America Diabetic Retinopathy Market, by Treatment Type, 2024-2032 (US$ Mn)
TABLE 359 Latin America Diabetic Retinopathy Market, by End-User, 2019-2023 (US$ Mn)
TABLE 360 Latin America Diabetic Retinopathy Market, by End-User, 2024-2032 (US$ Mn)
TABLE 361 Latin America Diabetic Retinopathy Market, by Diabetes Type, 2019-2023 (US$ Mn)
TABLE 362 Latin America Diabetic Retinopathy Market, by Diabetes Type, 2024-2032 (US$ Mn)
TABLE 363 Latin America Diabetic Retinopathy Market, by Distribution Channel:, 2019-2023 (US$ Mn)
TABLE 364 Latin America Diabetic Retinopathy Market, by Distribution Channel:, 2024-2032 (US$ Mn)
TABLE 365 Latin America Diabetic Retinopathy Market, by Product Type, 2019-2023 (US$ Mn)
TABLE 366 Latin America Diabetic Retinopathy Market, by Product Type, 2024-2032 (US$ Mn)
TABLE 367 Latin America Diabetic Retinopathy Market, by Stage of Diabetic Retinopathy, 2019-2023 (US$ Mn)
TABLE 368 Latin America Diabetic Retinopathy Market, by Stage of Diabetic Retinopathy, 2024-2032 (US$ Mn)
TABLE 369 Brazil Diabetic Retinopathy Market, by Type, 2019-2023 (US$ Mn)
TABLE 370 Brazil Diabetic Retinopathy Market, by Type, 2024-2032 (US$ Mn)
TABLE 371 Brazil Diabetic Retinopathy Market, by Treatment Type, 2019-2023 (US$ Mn)
TABLE 372 Brazil Diabetic Retinopathy Market, by Treatment Type, 2024-2032 (US$ Mn)
TABLE 373 Brazil Diabetic Retinopathy Market, by End-User, 2019-2023 (US$ Mn)
TABLE 374 Brazil Diabetic Retinopathy Market, by End-User, 2024-2032 (US$ Mn)
TABLE 375 Brazil Diabetic Retinopathy Market, by Diabetes Type, 2019-2023 (US$ Mn)
TABLE 376 Brazil Diabetic Retinopathy Market, by Diabetes Type, 2024-2032 (US$ Mn)
TABLE 377 Brazil Diabetic Retinopathy Market, by Distribution Channel:, 2019-2023 (US$ Mn)
TABLE 378 Brazil Diabetic Retinopathy Market, by Distribution Channel:, 2024-2032 (US$ Mn)
TABLE 379 Brazil Diabetic Retinopathy Market, by Product Type, 2019-2023 (US$ Mn)
TABLE 380 Brazil Diabetic Retinopathy Market, by Product Type, 2024-2032 (US$ Mn)
TABLE 381 Brazil Diabetic Retinopathy Market, by Stage of Diabetic Retinopathy, 2019-2023 (US$ Mn)
TABLE 382 Brazil Diabetic Retinopathy Market, by Stage of Diabetic Retinopathy, 2024-2032 (US$ Mn)
TABLE 383 Argentina Diabetic Retinopathy Market, by Type, 2019-2023 (US$ Mn)
TABLE 384 Argentina Diabetic Retinopathy Market, by Type, 2024-2032 (US$ Mn)
TABLE 385 Argentina Diabetic Retinopathy Market, by Treatment Type, 2019-2023 (US$ Mn)
TABLE 386 Argentina Diabetic Retinopathy Market, by Treatment Type, 2024-2032 (US$ Mn)
TABLE 387 Argentina Diabetic Retinopathy Market, by End-User, 2019-2023 (US$ Mn)
TABLE 388 Argentina Diabetic Retinopathy Market, by End-User, 2024-2032 (US$ Mn)
TABLE 389 Argentina Diabetic Retinopathy Market, by Diabetes Type, 2019-2023 (US$ Mn)
TABLE 390 Argentina Diabetic Retinopathy Market, by Diabetes Type, 2024-2032 (US$ Mn)
TABLE 391 Argentina Diabetic Retinopathy Market, by Distribution Channel:, 2019-2023 (US$ Mn)
TABLE 392 Argentina Diabetic Retinopathy Market, by Distribution Channel:, 2024-2032 (US$ Mn)
TABLE 393 Argentina Diabetic Retinopathy Market, by Product Type, 2019-2023 (US$ Mn)
TABLE 394 Argentina Diabetic Retinopathy Market, by Product Type, 2024-2032 (US$ Mn)
TABLE 395 Argentina Diabetic Retinopathy Market, by Stage of Diabetic Retinopathy, 2019-2023 (US$ Mn)
TABLE 396 Argentina Diabetic Retinopathy Market, by Stage of Diabetic Retinopathy, 2024-2032 (US$ Mn)
TABLE 397 Rest of Latin America Diabetic Retinopathy Market, by Type, 2019-2023 (US$ Mn)
TABLE 398 Rest of Latin America Diabetic Retinopathy Market, by Type, 2024-2032 (US$ Mn)
TABLE 399 Rest of Latin America Diabetic Retinopathy Market, by Treatment Type, 2019-2023 (US$ Mn)
TABLE 400 Rest of Latin America Diabetic Retinopathy Market, by Treatment Type, 2024-2032 (US$ Mn)
TABLE 401 Rest of Latin America Diabetic Retinopathy Market, by End-User, 2019-2023 (US$ Mn)
TABLE 402 Rest of Latin America Diabetic Retinopathy Market, by End-User, 2024-2032 (US$ Mn)
TABLE 403 Rest of Latin America Diabetic Retinopathy Market, by Diabetes Type, 2019-2023 (US$ Mn)
TABLE 404 Rest of Latin America Diabetic Retinopathy Market, by Diabetes Type, 2024-2032 (US$ Mn)
TABLE 405 Rest of Latin America Diabetic Retinopathy Market, by Distribution Channel:, 2019-2023 (US$ Mn)
TABLE 406 Rest of Latin America Diabetic Retinopathy Market, by Distribution Channel:, 2024-2032 (US$ Mn)
TABLE 407 Rest of Latin America Diabetic Retinopathy Market, by Product Type, 2019-2023 (US$ Mn)
TABLE 408 Rest of Latin America Diabetic Retinopathy Market, by Product Type, 2024-2032 (US$ Mn)
TABLE 409 Rest of Latin America Diabetic Retinopathy Market, by Stage of Diabetic Retinopathy, 2019-2023 (US$ Mn)
TABLE 410 Rest of Latin America Diabetic Retinopathy Market, by Stage of Diabetic Retinopathy, 2024-2032 (US$ Mn)
TABLE 411 Middle East Diabetic Retinopathy Market, by Type, 2019-2023 (US$ Mn)
TABLE 412 Middle East Diabetic Retinopathy Market, by Type, 2024-2032 (US$ Mn)
TABLE 413 Middle East Diabetic Retinopathy Market, by Treatment Type, 2019-2023 (US$ Mn)
TABLE 414 Middle East Diabetic Retinopathy Market, by Treatment Type, 2024-2032 (US$ Mn)
TABLE 415 Middle East Diabetic Retinopathy Market, by End-User, 2019-2023 (US$ Mn)
TABLE 416 Middle East Diabetic Retinopathy Market, by End-User, 2024-2032 (US$ Mn)
TABLE 417 Middle East Diabetic Retinopathy Market, by Diabetes Type, 2019-2023 (US$ Mn)
TABLE 418 Middle East Diabetic Retinopathy Market, by Diabetes Type, 2024-2032 (US$ Mn)
TABLE 419 Middle East Diabetic Retinopathy Market, by Distribution Channel:, 2019-2023 (US$ Mn)
TABLE 420 Middle East Diabetic Retinopathy Market, by Distribution Channel:, 2024-2032 (US$ Mn)
TABLE 421 Middle East Diabetic Retinopathy Market, by Product Type, 2019-2023 (US$ Mn)
TABLE 422 Middle East Diabetic Retinopathy Market, by Product Type, 2024-2032 (US$ Mn)
TABLE 423 Middle East Diabetic Retinopathy Market, by Stage of Diabetic Retinopathy, 2019-2023 (US$ Mn)
TABLE 424 Middle East Diabetic Retinopathy Market, by Stage of Diabetic Retinopathy, 2024-2032 (US$ Mn)
TABLE 425 UAE Diabetic Retinopathy Market, by Type, 2019-2023 (US$ Mn)
TABLE 426 UAE Diabetic Retinopathy Market, by Type, 2024-2032 (US$ Mn)
TABLE 427 UAE Diabetic Retinopathy Market, by Treatment Type, 2019-2023 (US$ Mn)
TABLE 428 UAE Diabetic Retinopathy Market, by Treatment Type, 2024-2032 (US$ Mn)
TABLE 429 UAE Diabetic Retinopathy Market, by End-User, 2019-2023 (US$ Mn)
TABLE 430 UAE Diabetic Retinopathy Market, by End-User, 2024-2032 (US$ Mn)
TABLE 431 UAE Diabetic Retinopathy Market, by Diabetes Type, 2019-2023 (US$ Mn)
TABLE 432 UAE Diabetic Retinopathy Market, by Diabetes Type, 2024-2032 (US$ Mn)
TABLE 433 UAE Diabetic Retinopathy Market, by Distribution Channel:, 2019-2023 (US$ Mn)
TABLE 434 UAE Diabetic Retinopathy Market, by Distribution Channel:, 2024-2032 (US$ Mn)
TABLE 435 UAE Diabetic Retinopathy Market, by Product Type, 2019-2023 (US$ Mn)
TABLE 436 UAE Diabetic Retinopathy Market, by Product Type, 2024-2032 (US$ Mn)
TABLE 437 UAE Diabetic Retinopathy Market, by Stage of Diabetic Retinopathy, 2019-2023 (US$ Mn)
TABLE 438 UAE Diabetic Retinopathy Market, by Stage of Diabetic Retinopathy, 2024-2032 (US$ Mn)
TABLE 439 Saudi Arabia Diabetic Retinopathy Market, by Type, 2019-2023 (US$ Mn)
TABLE 440 Saudi Arabia Diabetic Retinopathy Market, by Type, 2024-2032 (US$ Mn)
TABLE 441 Saudi Arabia Diabetic Retinopathy Market, by Treatment Type, 2019-2023 (US$ Mn)
TABLE 442 Saudi Arabia Diabetic Retinopathy Market, by Treatment Type, 2024-2032 (US$ Mn)
TABLE 443 Saudi Arabia Diabetic Retinopathy Market, by End-User, 2019-2023 (US$ Mn)
TABLE 444 Saudi Arabia Diabetic Retinopathy Market, by End-User, 2024-2032 (US$ Mn)
TABLE 445 Saudi Arabia Diabetic Retinopathy Market, by Diabetes Type, 2019-2023 (US$ Mn)
TABLE 446 Saudi Arabia Diabetic Retinopathy Market, by Diabetes Type, 2024-2032 (US$ Mn)
TABLE 447 Saudi Arabia Diabetic Retinopathy Market, by Distribution Channel:, 2019-2023 (US$ Mn)
TABLE 448 Saudi Arabia Diabetic Retinopathy Market, by Distribution Channel:, 2024-2032 (US$ Mn)
TABLE 449 Saudi Arabia Diabetic Retinopathy Market, by Product Type, 2019-2023 (US$ Mn)
TABLE 450 Saudi Arabia Diabetic Retinopathy Market, by Product Type, 2024-2032 (US$ Mn)
TABLE 451 Saudi Arabia Diabetic Retinopathy Market, by Stage of Diabetic Retinopathy, 2019-2023 (US$ Mn)
TABLE 452 Saudi Arabia Diabetic Retinopathy Market, by Stage of Diabetic Retinopathy, 2024-2032 (US$ Mn)
TABLE 453 Rest of Middle East Diabetic Retinopathy Market, by Type, 2019-2023 (US$ Mn)
TABLE 454 Rest of Middle East Diabetic Retinopathy Market, by Type, 2024-2032 (US$ Mn)
TABLE 455 Rest of Middle East Diabetic Retinopathy Market, by Treatment Type, 2019-2023 (US$ Mn)
TABLE 456 Rest of Middle East Diabetic Retinopathy Market, by Treatment Type, 2024-2032 (US$ Mn)
TABLE 457 Rest of Middle East Diabetic Retinopathy Market, by End-User, 2019-2023 (US$ Mn)
TABLE 458 Rest of Middle East Diabetic Retinopathy Market, by End-User, 2024-2032 (US$ Mn)
TABLE 459 Rest of Middle East Diabetic Retinopathy Market, by Diabetes Type, 2019-2023 (US$ Mn)
TABLE 460 Rest of Middle East Diabetic Retinopathy Market, by Diabetes Type, 2024-2032 (US$ Mn)
TABLE 461 Rest of Middle East Diabetic Retinopathy Market, by Distribution Channel:, 2019-2023 (US$ Mn)
TABLE 462 Rest of Middle East Diabetic Retinopathy Market, by Distribution Channel:, 2024-2032 (US$ Mn)
TABLE 463 Rest of Middle East Diabetic Retinopathy Market, by Product Type, 2019-2023 (US$ Mn)
TABLE 464 Rest of Middle East Diabetic Retinopathy Market, by Product Type, 2024-2032 (US$ Mn)
TABLE 465 Rest of Middle East Diabetic Retinopathy Market, by Stage of Diabetic Retinopathy, 2019-2023 (US$ Mn)
TABLE 466 Rest of Middle East Diabetic Retinopathy Market, by Stage of Diabetic Retinopathy, 2024-2032 (US$ Mn)
TABLE 467 Africa Diabetic Retinopathy Market, by Type, 2019-2023 (US$ Mn)
TABLE 468 Africa Diabetic Retinopathy Market, by Type, 2024-2032 (US$ Mn)
TABLE 469 Africa Diabetic Retinopathy Market, by Treatment Type, 2019-2023 (US$ Mn)
TABLE 470 Africa Diabetic Retinopathy Market, by Treatment Type, 2024-2032 (US$ Mn)
TABLE 471 Africa Diabetic Retinopathy Market, by End-User, 2019-2023 (US$ Mn)
TABLE 472 Africa Diabetic Retinopathy Market, by End-User, 2024-2032 (US$ Mn)
TABLE 473 Africa Diabetic Retinopathy Market, by Diabetes Type, 2019-2023 (US$ Mn)
TABLE 474 Africa Diabetic Retinopathy Market, by Diabetes Type, 2024-2032 (US$ Mn)
TABLE 475 Africa Diabetic Retinopathy Market, by Distribution Channel:, 2019-2023 (US$ Mn)
TABLE 476 Africa Diabetic Retinopathy Market, by Distribution Channel:, 2024-2032 (US$ Mn)
TABLE 477 Africa Diabetic Retinopathy Market, by Product Type, 2019-2023 (US$ Mn)
TABLE 478 Africa Diabetic Retinopathy Market, by Product Type, 2024-2032 (US$ Mn)
TABLE 479 Africa Diabetic Retinopathy Market, by Stage of Diabetic Retinopathy, 2019-2023 (US$ Mn)
TABLE 480 Africa Diabetic Retinopathy Market, by Stage of Diabetic Retinopathy, 2024-2032 (US$ Mn)
TABLE 481 South Africa Diabetic Retinopathy Market, by Type, 2019-2023 (US$ Mn)
TABLE 482 South Africa Diabetic Retinopathy Market, by Type, 2024-2032 (US$ Mn)
TABLE 483 South Africa Diabetic Retinopathy Market, by Treatment Type, 2019-2023 (US$ Mn)
TABLE 484 South Africa Diabetic Retinopathy Market, by Treatment Type, 2024-2032 (US$ Mn)
TABLE 485 South Africa Diabetic Retinopathy Market, by End-User, 2019-2023 (US$ Mn)
TABLE 486 South Africa Diabetic Retinopathy Market, by End-User, 2024-2032 (US$ Mn)
TABLE 487 South Africa Diabetic Retinopathy Market, by Diabetes Type, 2019-2023 (US$ Mn)
TABLE 488 South Africa Diabetic Retinopathy Market, by Diabetes Type, 2024-2032 (US$ Mn)
TABLE 489 South Africa Diabetic Retinopathy Market, by Distribution Channel:, 2019-2023 (US$ Mn)
TABLE 490 South Africa Diabetic Retinopathy Market, by Distribution Channel:, 2024-2032 (US$ Mn)
TABLE 491 South Africa Diabetic Retinopathy Market, by Product Type, 2019-2023 (US$ Mn)
TABLE 492 South Africa Diabetic Retinopathy Market, by Product Type, 2024-2032 (US$ Mn)
TABLE 493 South Africa Diabetic Retinopathy Market, by Stage of Diabetic Retinopathy, 2019-2023 (US$ Mn)
TABLE 494 South Africa Diabetic Retinopathy Market, by Stage of Diabetic Retinopathy, 2024-2032 (US$ Mn)
TABLE 495 Egypt Diabetic Retinopathy Market, by Type, 2019-2023 (US$ Mn)
TABLE 496 Egypt Diabetic Retinopathy Market, by Type, 2024-2032 (US$ Mn)
TABLE 497 Egypt Diabetic Retinopathy Market, by Treatment Type, 2019-2023 (US$ Mn)
TABLE 498 Egypt Diabetic Retinopathy Market, by Treatment Type, 2024-2032 (US$ Mn)
TABLE 499 Egypt Diabetic Retinopathy Market, by End-User, 2019-2023 (US$ Mn)
TABLE 500 Egypt Diabetic Retinopathy Market, by End-User, 2024-2032 (US$ Mn)
TABLE 501 Egypt Diabetic Retinopathy Market, by Diabetes Type, 2019-2023 (US$ Mn)
TABLE 502 Egypt Diabetic Retinopathy Market, by Diabetes Type, 2024-2032 (US$ Mn)
TABLE 503 Egypt Diabetic Retinopathy Market, by Distribution Channel:, 2019-2023 (US$ Mn)
TABLE 504 Egypt Diabetic Retinopathy Market, by Distribution Channel:, 2024-2032 (US$ Mn)
TABLE 505 Egypt Diabetic Retinopathy Market, by Product Type, 2019-2023 (US$ Mn)
TABLE 506 Egypt Diabetic Retinopathy Market, by Product Type, 2024-2032 (US$ Mn)
TABLE 507 Egypt Diabetic Retinopathy Market, by Stage of Diabetic Retinopathy, 2019-2023 (US$ Mn)
TABLE 508 Egypt Diabetic Retinopathy Market, by Stage of Diabetic Retinopathy, 2024-2032 (US$ Mn)
TABLE 509 Rest of Africa Diabetic Retinopathy Market, by Type, 2019-2023 (US$ Mn)
TABLE 510 Rest of Africa Diabetic Retinopathy Market, by Type, 2024-2032 (US$ Mn)
TABLE 511 Rest of Africa Diabetic Retinopathy Market, by Treatment Type, 2019-2023 (US$ Mn)
TABLE 512 Rest of Africa Diabetic Retinopathy Market, by Treatment Type, 2024-2032 (US$ Mn)
TABLE 513 Rest of Africa Diabetic Retinopathy Market, by End-User, 2019-2023 (US$ Mn)
TABLE 514 Rest of Africa Diabetic Retinopathy Market, by End-User, 2024-2032 (US$ Mn)
TABLE 515 Rest of Africa Diabetic Retinopathy Market, by Diabetes Type, 2019-2023 (US$ Mn)
TABLE 516 Rest of Africa Diabetic Retinopathy Market, by Diabetes Type, 2024-2032 (US$ Mn)
TABLE 517 Rest of Africa Diabetic Retinopathy Market, by Distribution Channel:, 2019-2023 (US$ Mn)
TABLE 518 Rest of Africa Diabetic Retinopathy Market, by Distribution Channel:, 2024-2032 (US$ Mn)
TABLE 519 Rest of Africa Diabetic Retinopathy Market, by Product Type, 2019-2023 (US$ Mn)
TABLE 520 Rest of Africa Diabetic Retinopathy Market, by Product Type, 2024-2032 (US$ Mn)
TABLE 521 Rest of Africa Diabetic Retinopathy Market, by Stage of Diabetic Retinopathy, 2019-2023 (US$ Mn)
TABLE 522 Rest of Africa Diabetic Retinopathy Market, by Stage of Diabetic Retinopathy, 2024-2032 (US$ Mn)

Frequently Asked Questions

How big is the global diabetic retinopathy market right now?

In 2023, the diabetic retinopathy market was estimated to be worth USD 3158.2 million.

What is the projected growth rate of the diabetic retinopathy market between 2024 and 2032?

The diabetic retinopathy market is anticipated to increase at a CAGR of 14.50% from 2024 to 2032, reaching USD 10682.89 million in 2032.

Which market segment is leading in terms of type?

Non-proliferative diabetic retinopathy (NPDR) is the most popular category.

Which end-user segment is estimated to have the highest CAGR throughout the forecast period?

The category with the highest predicted CAGR is expected to be hospitals during the projected period.

Who are the key participants in the global market for diabetic retinopathy?

The top players include Alimera Science, Inc., Abbvie, Inc., Ampio Pharmaceuticals, Inc., Bayer AG, Kowa Co., Ltd., Novartis, Pfizer, Inc., Regeneron Pharmaceuticals, Inc., F-Hoffmann-La Roche Ltd, Valeant Pharmaceuticals International, Inc., Bausch Health Companies Inc., and others.

Clinical Rollators Market

Published:
Report ID: 35120

Automated Microscopy Market

Published:
Report ID: 35117

Anastomosis Devices Market

Published:
Report ID: 35112

Orthopedic Navigation Systems Market

Published:
Report ID: 35108

Laryngeal Stents Market

Published:
Report ID: 35102

Medical Copper Tubing Market

Published:
Report ID: 35098

Molecular Transport Medium Market

Published:
Report ID: 35092

Neurovascular Thrombectomy Device Market

Published:
Report ID: 35073

Diagnostic Imaging Centers Market

Published:
Report ID: 35050

Electric Stimulation Devices Market

Published:
Report ID: 35047

Angiotensin Converting Enzyme (ACE) Inhibitors Market

Published:
Report ID: 12832

Venipuncture Procedure Market

Published:
Report ID: 34886

Purchase Options

$2999
Delivery Format: Excel.
$4999
Designed for the individual purchaser.
$6999
Users located at a single corporate site or regional office.
$7999
Allowed for unlimited sharing globally within one company.
Smallform of Sample request

Have a question?

User Profile

Don’t settle for less – trust Mitul to help you find the best solution.

Report delivery within 24 to 48 hours

– Other Info –

What people say?-

User Review

I am very impressed with the information in this report. The author clearly did their research when they came up with this product and it has already given me a lot of ideas.

Jana Schmidt
CEDAR CX Technologies

– Connect with us –

Phone

+91 6232 49 3207


support

24/7 Research Support


sales@credenceresearch.com

– Research Methodology –

Going beyond the basics: advanced techniques in research methodology

– Trusted By –

Pepshi, LG, Nestle
Motorola, Honeywell, Johnson and johnson
LG Chem, SIEMENS, Pfizer
Unilever, Samsonite, QIAGEN