
Mall play venues anchor Filipino leisure spending
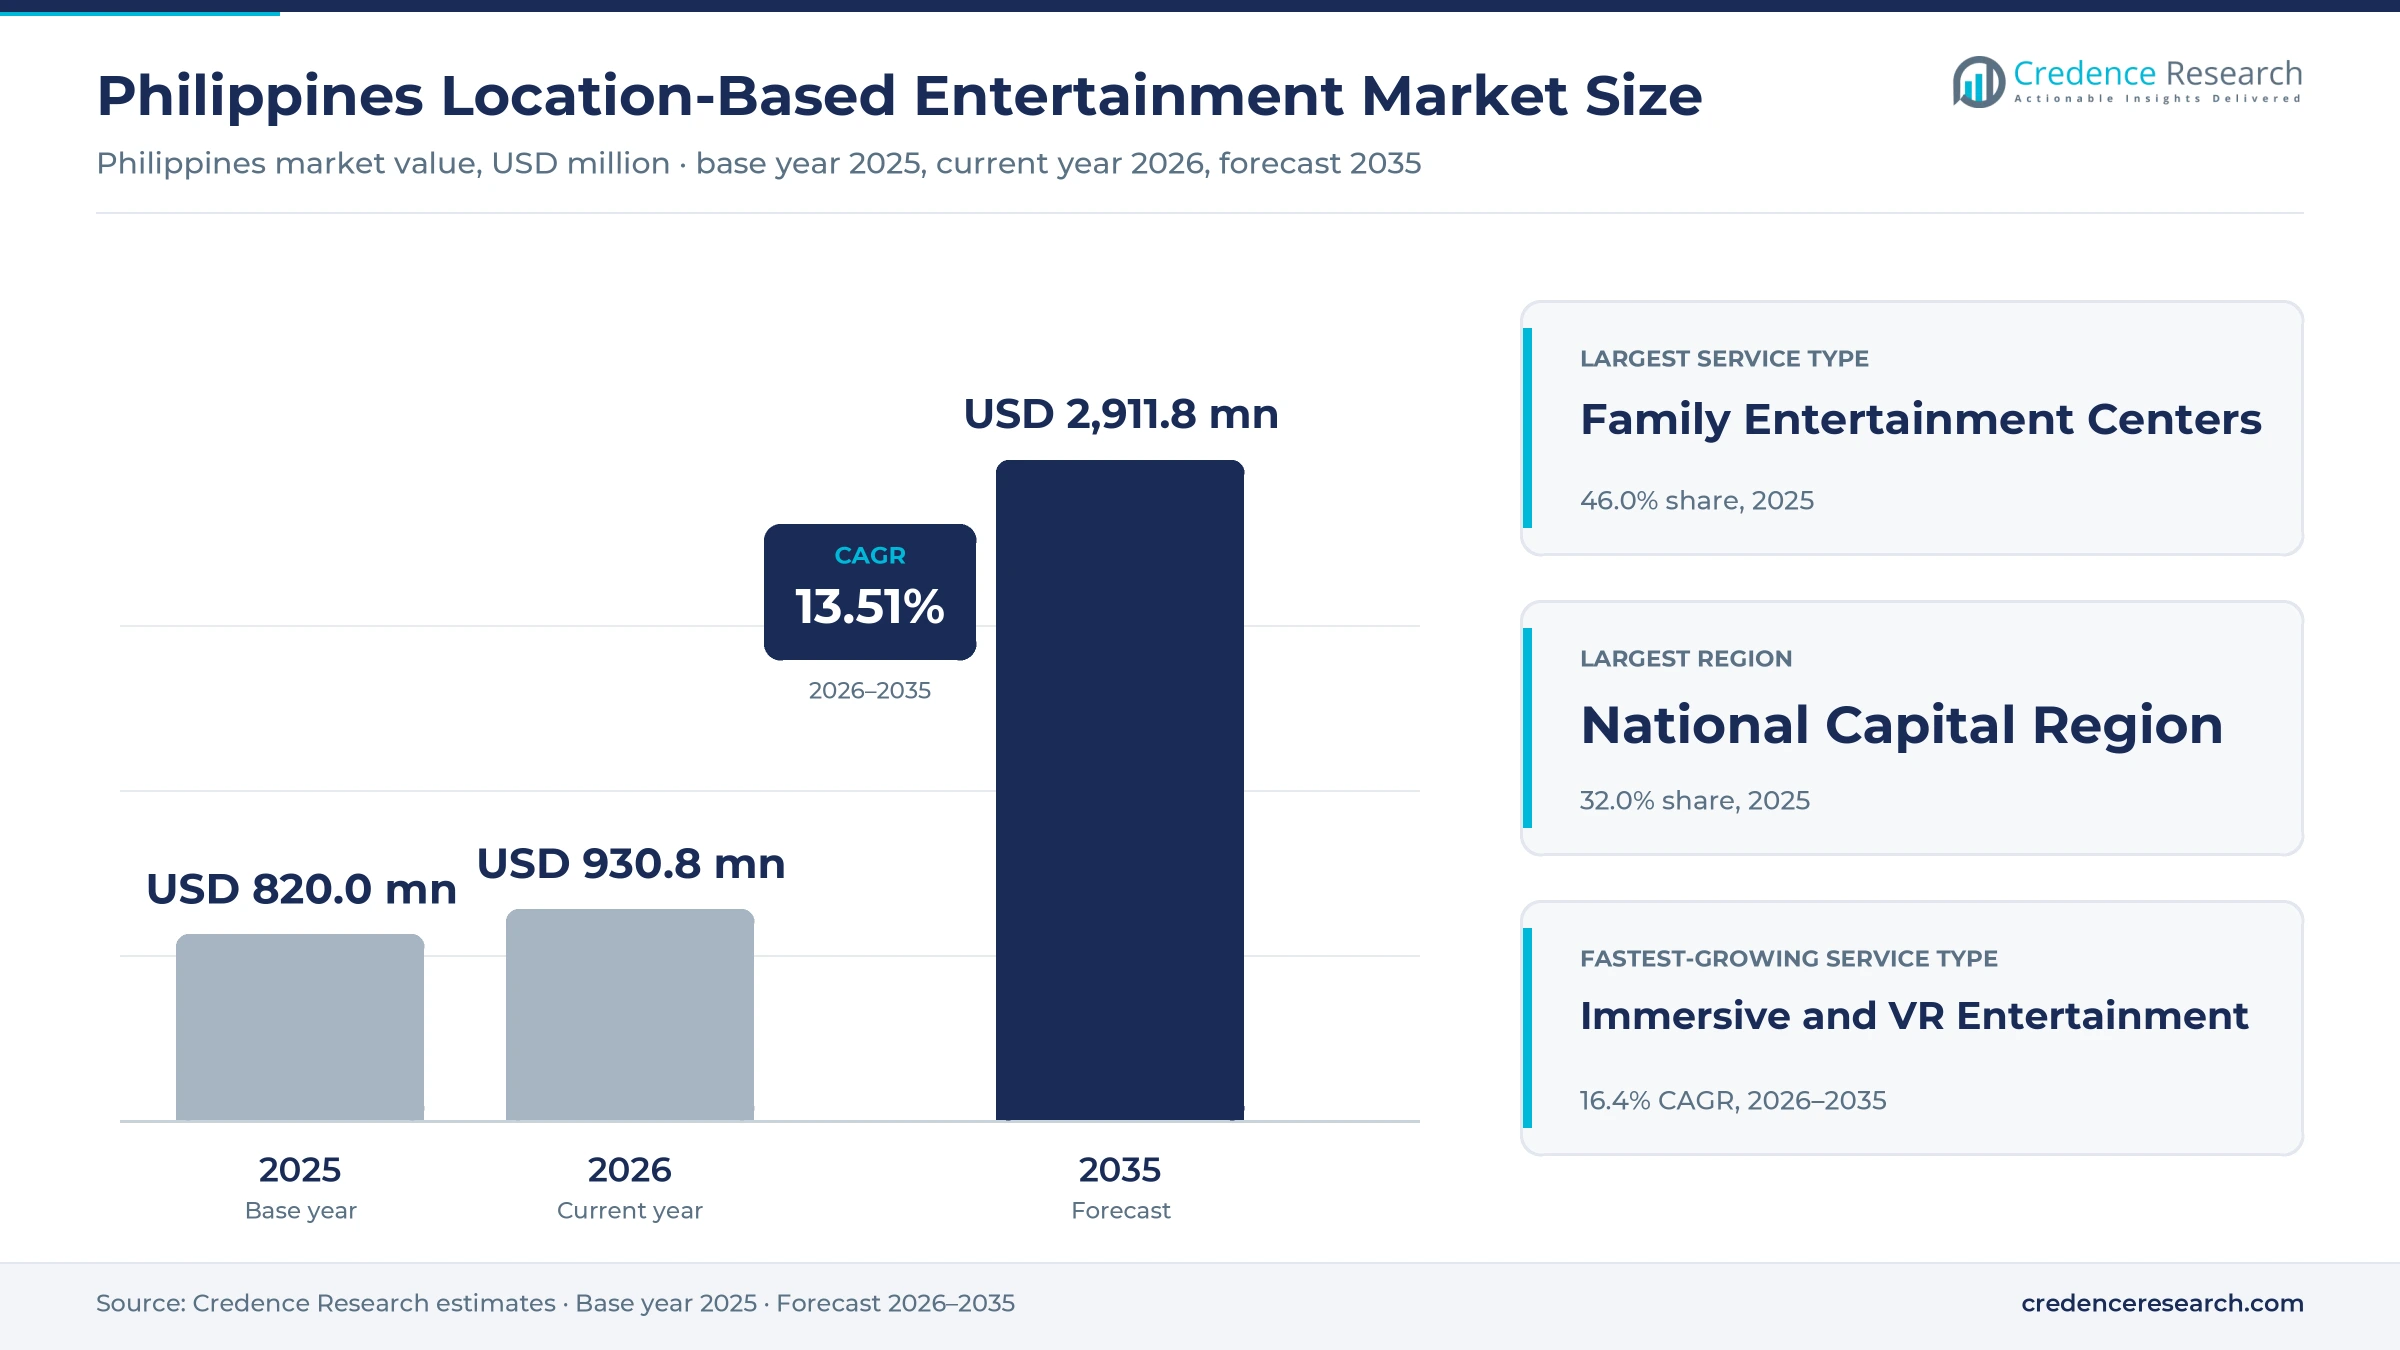
The Philippines location-based entertainment market was valued at USD 820.0 million in 2025 and is projected to increase from USD 930.8 million in 2026 to USD 2.91 billion by 2035, registering a CAGR of 13.51% during 2026–2035. Spending comes from families on weekend mall trips, from students and young adults who play in groups, and from companies that book parties and team outings. The National Capital Region held the largest regional share, 32.0% in 2025, because Metro Manila combines the densest mall network with the highest household incomes. Mindanao is the fastest-growing region at 14.1% a year, as mall play centers in Davao, Cagayan de Oro and General Santos serve families with few large parks nearby. Meanwhile, leading operators are converting coin-operated arcades into larger multi-attraction venues with bowling, karaoke rooms and virtual reality bays. This shift raises the spend per visit and lengthens dwell time, which makes play venues more valuable tenants for mall landlords.
Ticketed play inside malls makes up most of the value
The estimate counts consumer and corporate spending at venues where people pay to play, ride or explore in person. This covers arcade and family entertainment centers, theme and amusement parks, virtual reality arenas, oceanariums and discovery attractions, and active venues such as trampoline parks, skating rinks and bowling centers. Revenue includes admission, game credits, ride passes, party packages and food, beverage and merchandise sold inside the venue.
The estimate excludes cinemas, casinos, live concerts, sports events and home or mobile gaming. It also excludes the sale of machines and rides to operators, which belongs to equipment suppliers. The value chain runs from game and ride makers through venue operators and mall landlords to families, students, companies and tourists.
Philippines Location-Based Entertainment Market Insights
- The market was valued at USD 820.0 million in 2025 and is projected to reach USD 2.91 billion by 2035, registering a CAGR of 13.51% during 2026–2035.
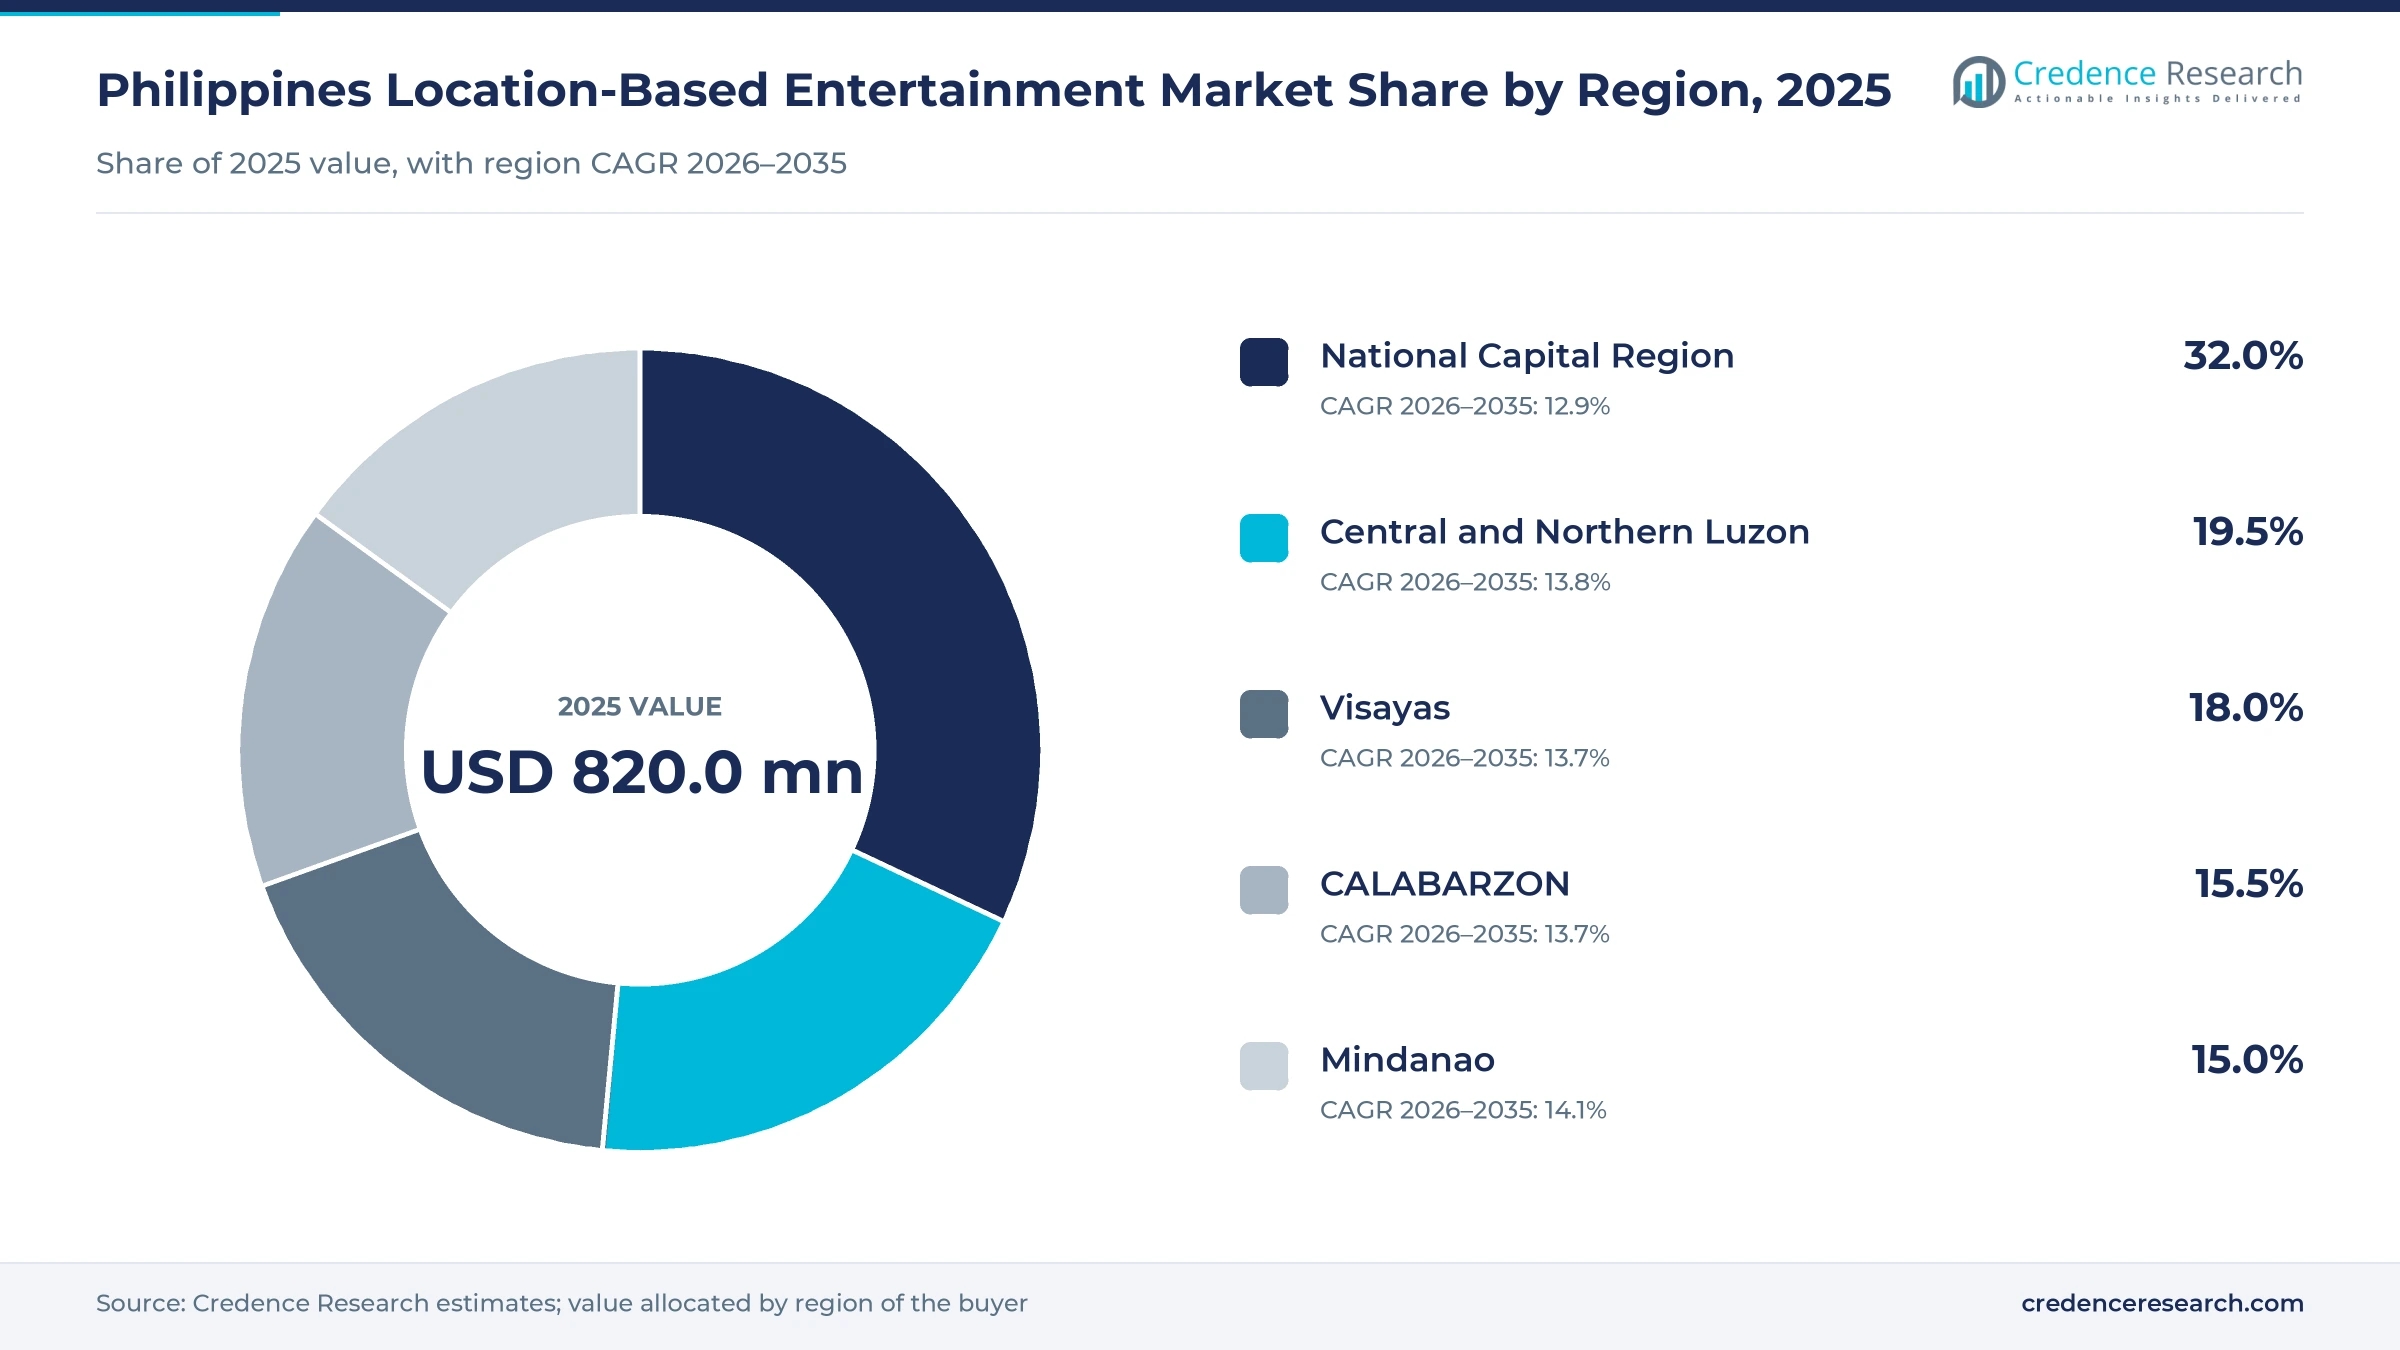
- The National Capital Region held 32.0% of 2025 value, because Metro Manila has the densest mall network and highest incomes.
- Family entertainment centers led with 46.0% of 2025 value, while immersive and VR entertainment grows fastest at 16.4% a year.
- Timezone reported 51 full-size venues and more than 50 smaller sites in December 2025, with over two-thirds of the network in multi-attraction formats.
- Dave & Buster's opened its first Philippine venue in Quezon City in October 2025, a sign that global eatertainment brands now see scale in the country.
Arcade-led centers lead while VR venues grow fastest
Why do arcade-led centers hold the largest share?
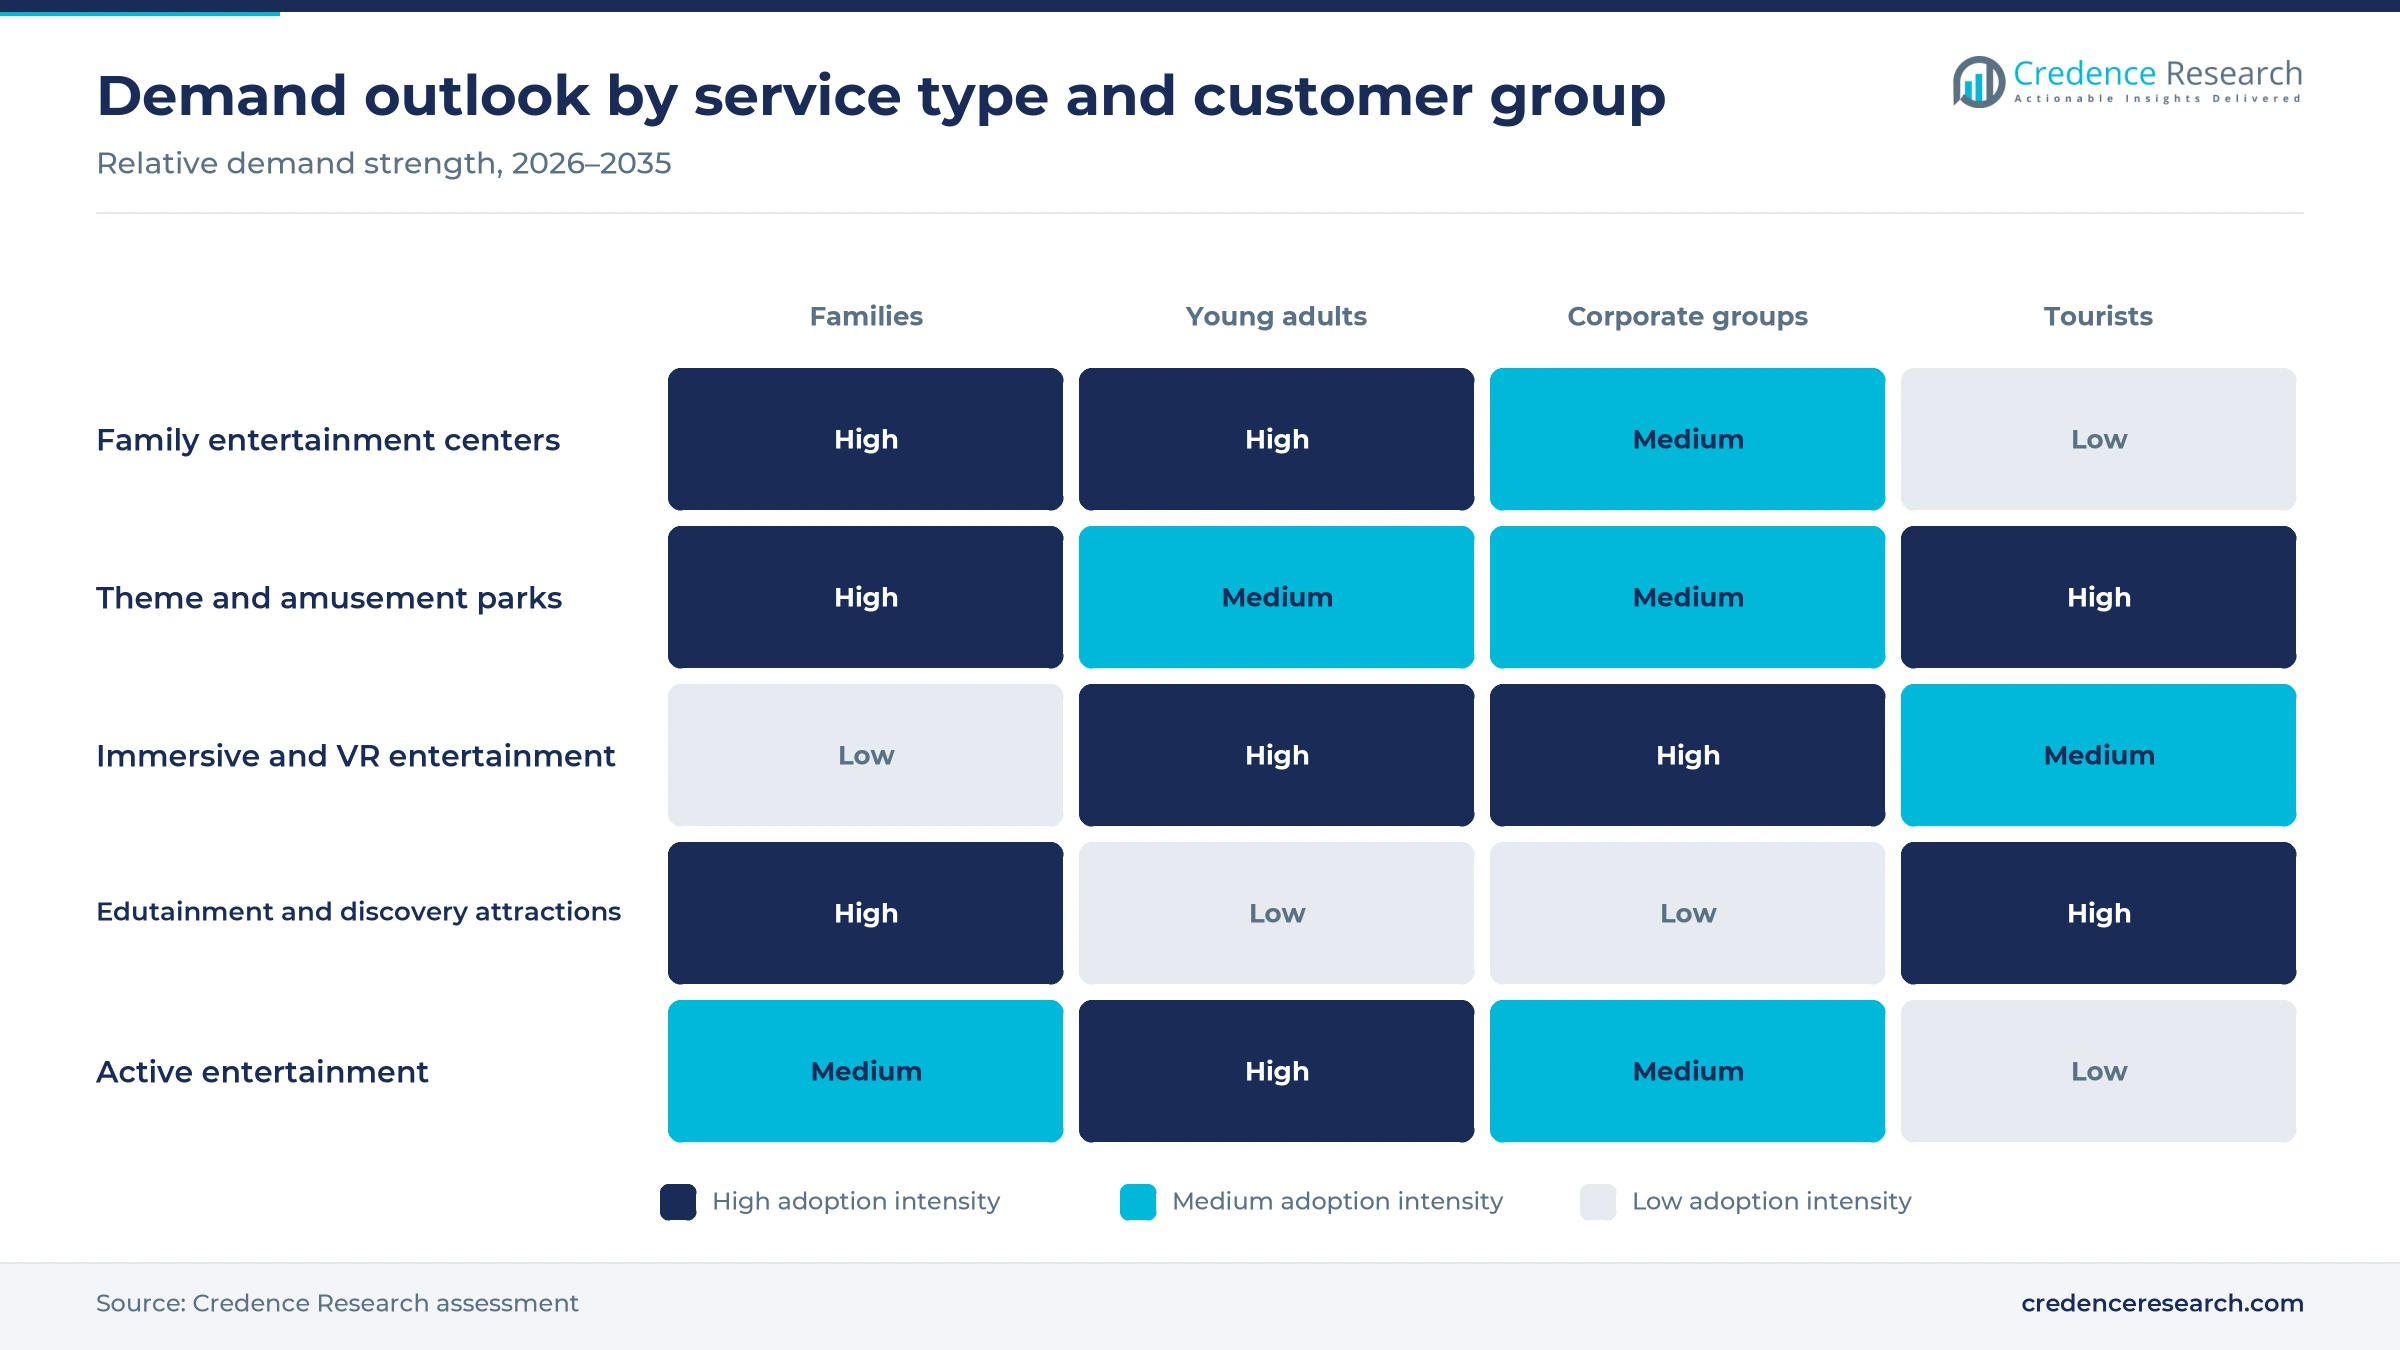
Based on service type, the market is categorized into family entertainment centers, theme and amusement parks, immersive and VR entertainment, edutainment and discovery attractions, and active entertainment. Family Entertainment Centers led with 46.0% of 2025 value, because they sit inside malls that families already visit every weekend. Timezone alone draws about 2.5 million visitors a month across 47,000 square meters of mall space, according to the Inquirer in November 2025. Immersive and VR Entertainment grows fastest at 16.4% a year, as Zero Latency plans its first Philippine arena at Ayala Malls Circuit in Makati for July 2026, with partner Third Culture Entertainment.
Which visitors spend the most per trip?
Based on customer type, the market is categorized into families with children, teenagers and young adults, corporate and organized groups, and domestic and international tourists. Families with Children led with 48.0% of 2025 value, because play centers price around the child and the guardian. kidzooona charges by the hour and admits one guardian free, so the child's ticket carries the visit, as the pricing table shows. Corporate and Organized Groups grow fastest at 14.7% a year, as Timezone reported strong holiday demand for corporate party rooms in December 2025.
Why do shopping malls host most venues?
Based on end-use industry, the market is categorized into shopping malls, tourism attractions, hospitality and integrated developments, and standalone leisure developments. Shopping Malls led with 58.0% of 2025 value, because SM Supermalls alone runs 90 malls in the Philippines, according to an August 2026 company release, and landlords use play venues to lift footfall. Hospitality and Integrated Developments grow fastest at 14.6% a year, as township developers bundle venues into mixed-use estates, such as the SuperPark sites in Megaworld townships of 18.5 and 50 hectares.
How fast is digital booking replacing the ticket counter?
Based on channel, the market is categorized into walk-in and on-site, direct digital booking, mall and corporate partnerships, and travel and experience platforms. Walk-In and On-Site led with 62.0% of 2025 value, because most arcade and play-center visits are unplanned stops during a mall trip. Direct Digital Booking grows fastest at 15.5% a year, as the Timezone Fun App passed one million Philippine downloads by December 2025, letting players reload cards and collect vouchers before they arrive.
| Segment Group | Leading Sub-segment | Share, 2025 | Fastest-growing Sub-segment | CAGR, 2026–2035 |
|---|---|---|---|---|
| By Service Type | Family Entertainment Centers | 46.0% | Immersive and VR Entertainment | 16.4% |
| By Customer Type | Families with Children | 48.0% | Corporate and Organized Groups | 14.7% |
| By End-Use Industry | Shopping Malls | 58.0% | Hospitality and Integrated Developments | 14.6% |
| By Channel | Walk-In and On-Site | 62.0% | Direct Digital Booking | 15.5% |
Ride passes and timed play set the price ladder
Pricing in the market follows two distinct models across venue types. Parks sell an all-day pass that bundles rides, while mall venues sell timed play or game credits that players reload during the visit. Destination parks charge the most per ticket but see each family only a few times a year, whereas mall play centers charge less and win repeat visits. Weekend and holiday premiums of about PHP 100 are common, and online channels sell below the gate. Food, party packages and prize redemption lift spend beyond the ticket, which is where operators earn much of their margin.
| Offer | Typical price or fee | Basis |
|---|---|---|
| Enchanted Kingdom regular day pass | PHP 800 weekday, PHP 900 weekend | The Poor Traveler lists, September 2024 |
| Star City Star Pass, ride all you can | PHP 849 at the gate, about PHP 764 online | Lakbay Pinas lists, 2026 |
| Skyranch and SM by the Bay ride-all-you-can | PHP 350 per person | SM Prime release |
| SuperPark McKinley two-hour pass | PHP 650 weekday, PHP 750 weekend, PHP 200 junior | GMA News lists |
| kidzooona mall play center | PHP 220-240 per hour, PHP 320-350 for two hours | theAsianparent lists, June 2023 |
| Skyranch Tagaytay Cartoonville pass | PHP 499 all-in-one, PHP 799 VIP | SM Supermalls, September 2025 |
Request a Free Sample
Fill in your details and we'll send you a free sample report.
- Sample data tables & charts
- Research methodology
Dense cities, mall reinvention and tourism lift demand
Urbanization widens catchments for entertainment venues
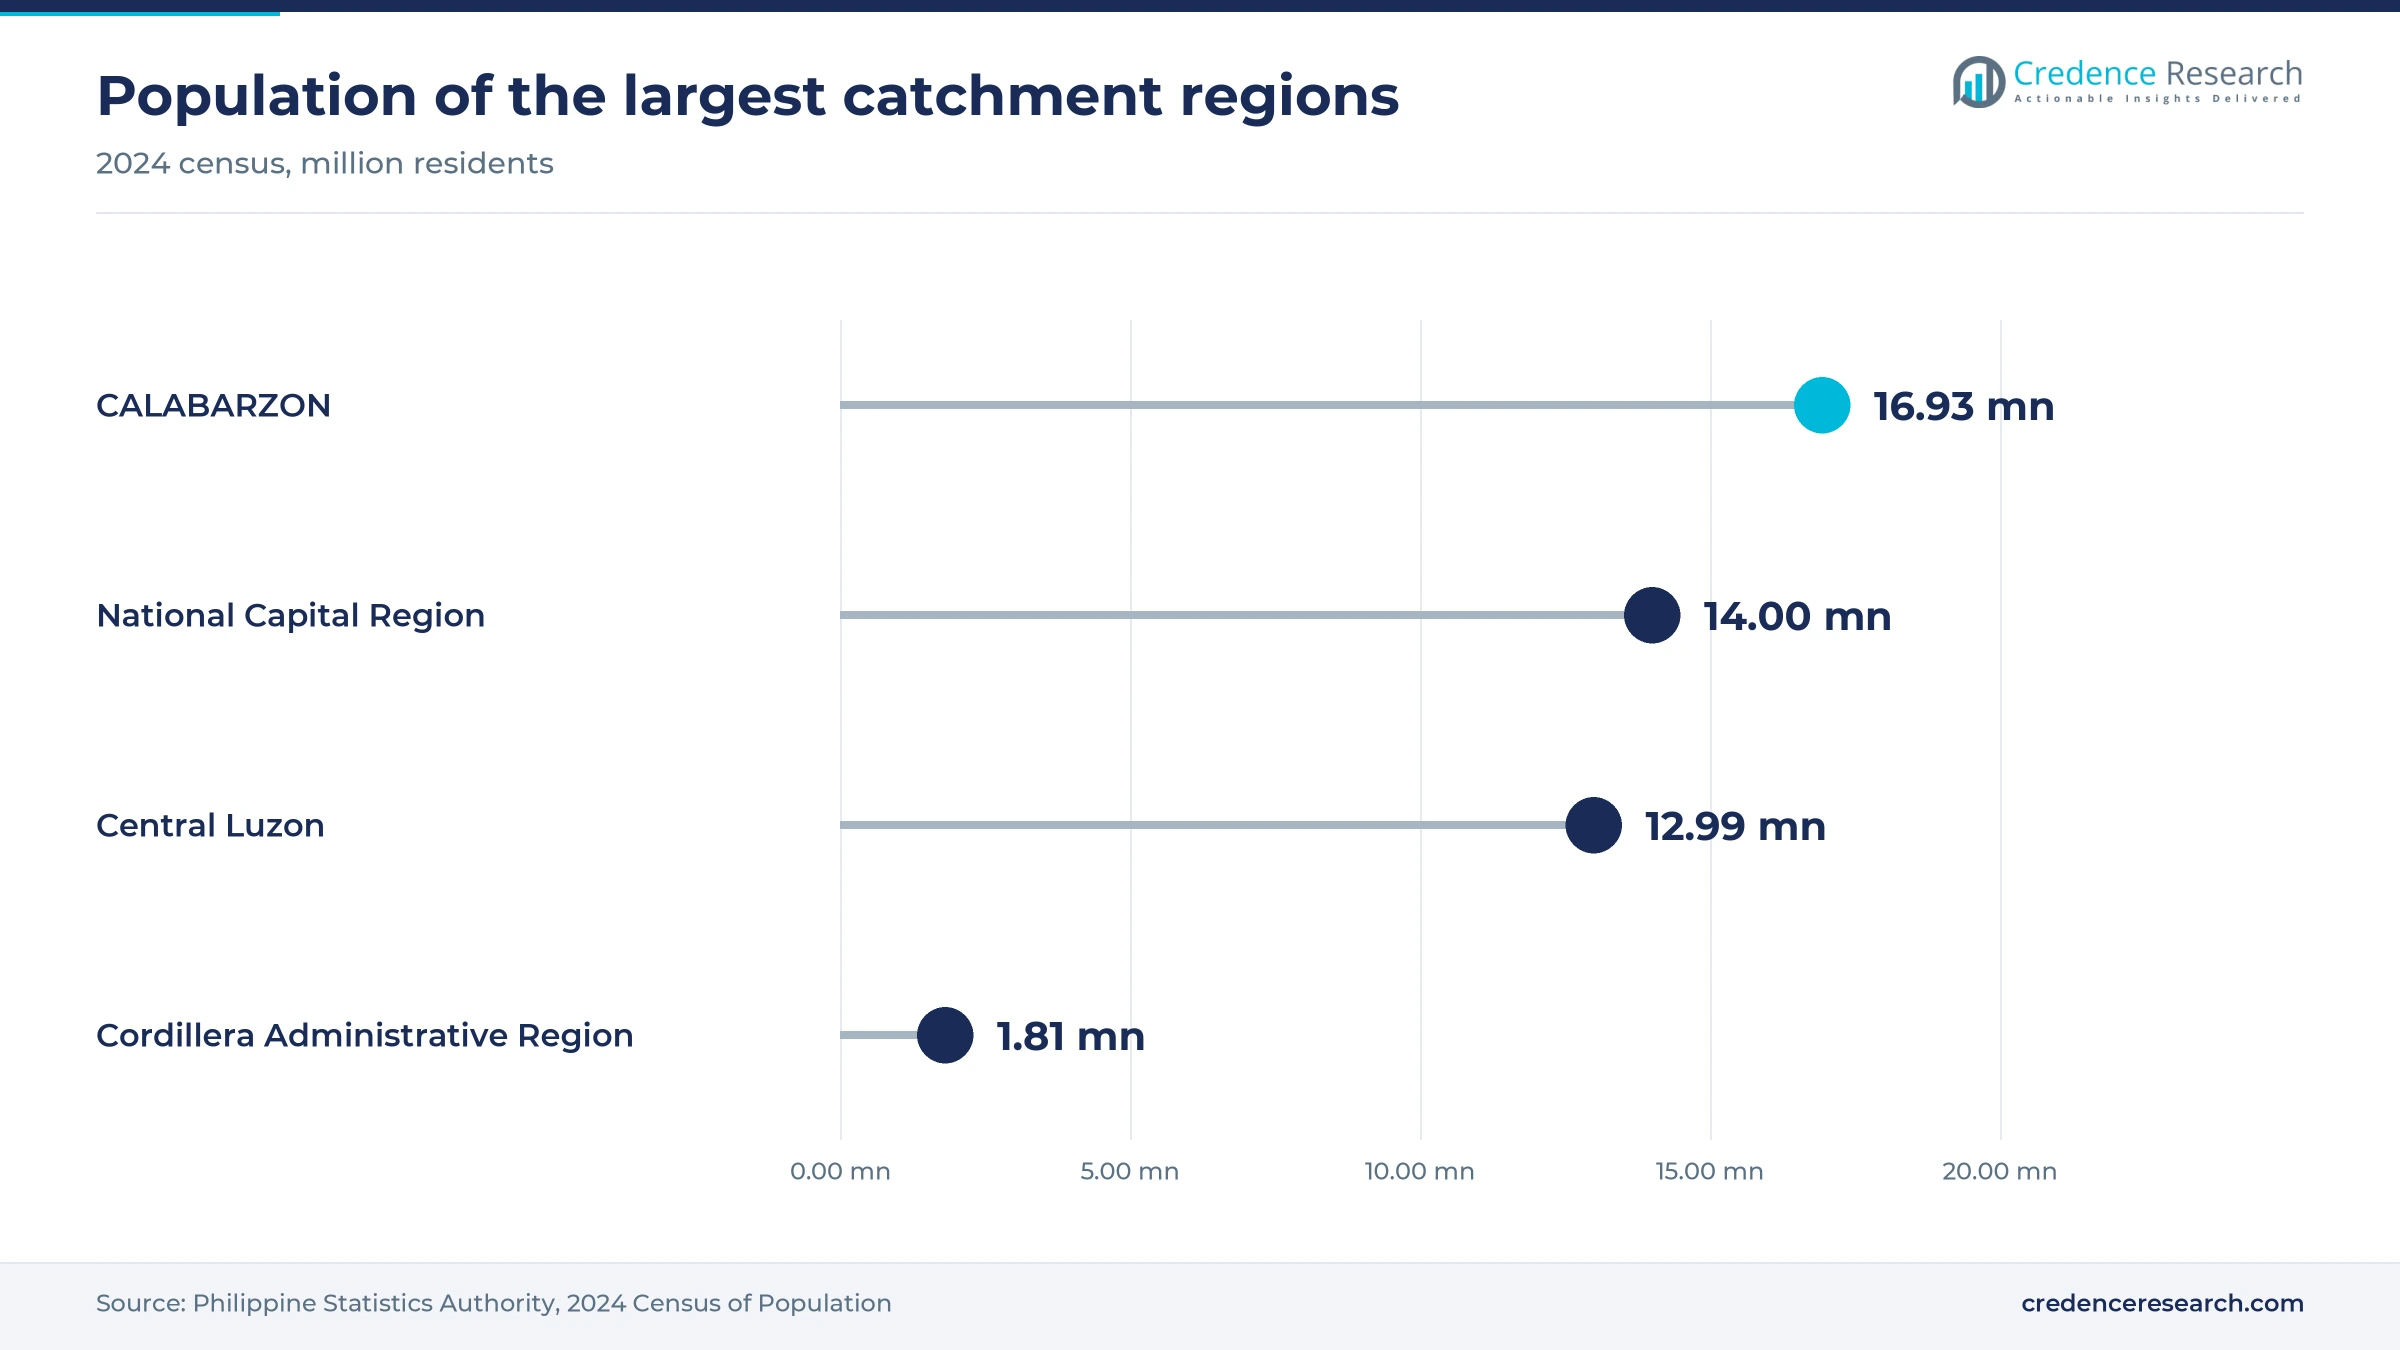
Dense urban corridors create the footfall that indoor venues need, which makes urbanization the first driver of demand. The 2024 census counted 112,729,484 Filipinos, with CALABARZON at 16.93 million, the National Capital Region at 14 million and Central Luzon at 12.99 million, according to the Philippine Statistics Authority. The three regions together hold about 39% of the population, which explains why most large venues cluster around Metro Manila. The World Bank also found in December 2025 that over 60% of urban local government units across Luzon, Visayas and Mindanao sit in high-potential urban corridors. For operators, these corridors mark the next cities where a mall venue can fill on weekdays as well as weekends.
Malls are becoming experience-led distribution platforms
Mall landlords now treat play venues as anchors rather than filler tenants, so the mall itself has become the main distribution channel. New retail space in the Philippines tripled to 265,000 square meters in 2025 from 86,900 square meters a year earlier, according to Colliers data cited by BusinessWorld. Timezone chief executive Sonaal Chopra said visit frequency rose 23% in 2025 and described a shift toward demand for experiences over products. In December 2024, Colliers also pointed to SM Fairview's Fantasy World, a 3,000-square-meter indoor park, as a model for experiential tenants. This matters for suppliers, because every redeveloped mall needs a leisure anchor that can draw families for hours.
Tourism broadens the addressable visitor pool
Tourists add a second demand stream that peaks during school breaks and holidays, when local families also travel. The country recorded about 6.48 million international arrivals in 2025 with an estimated PHP 694 billion in visitor spending, according to SunStar. Domestic travel is far larger, with domestic tourism expenditure reaching PHP 3.16 trillion in 2024, based on Tourism Satellite Account figures reported by The Philippine Star. The Department of Tourism also cited 19 new international direct routes launched in 2025, according to Daily Tribune in January 2026. Attractions in Laguna, Cebu and Pasay gain most, because they sit on routes that tourists already use.
Group and corporate outings raise spend per visit
Groups spend more per visit than walk-in players, because they book rooms, packages and food in one bill. Timezone said corporate party rooms are in strong demand, especially during the holidays, and it now builds karaoke rooms for up to 12 people. Dave & Buster's built its Quezon City venue around private rooms, VIP areas and a billiard hall, according to Daily Tribune. Its 1,560-square-meter venue also carries a 40-foot sports wall for group viewing, according to MarketechAPAC. Corporate and organized groups grow at 14.7% a year, which pushes operators to design venues with event space rather than more game rows.
Multi-attraction formats and foreign brands reshape play
Shift from coin arcades to multi-attraction venues
Operators are shifting from rows of coin-operated machines to larger venues that combine games, bowling, billiards and karaoke. Timezone relaunched its Glorietta 4 flagship in Makati in November 2025, enlarging it from 900 to nearly 1,400 square meters with more than 120 games and attractions, according to BusinessWorld. The company also refreshes 25% to 30% of its game offering each year to keep regular players returning. Its president, Rafael Prats Jr., said revenue roughly doubled after malls reopened from pandemic lockdowns, according to the Inquirer. This shift lifts demand for arcade machines with prize redemption and social play, while single-player cabinets lose floor space.
Rise of global eatertainment and VR brands
Foreign venue brands are rising in Metro Manila, as global operators now see enough spending power to enter the country. Dave & Buster's chose Opus Mall for its first Southeast Asian branch, with the local franchisee The Bistro Group planning further rollouts. Zero Latency announced in May 2026 that its Makati arena will host two groups of up to six players at once in 30-minute missions. Earlier, Megaworld Lifestyle Malls signed a multimillion-peso deal in August 2023 to bring SuperPark from Finland to Eastwood City and McKinley Hill. Immersive and VR entertainment grows at 16.4% a year, which widens demand for virtual reality hardware built for commercial use.
Opportunity in secondary cities beyond Metro Manila
Provincial cities offer an opening, because mall traffic there is growing while few large venues exist. Timezone planned openings at Venice Grand Canal Mall in Taguig and Ayala Capital Central in Bacolod before end-2025, plus six more venues in 2026, five of them in new locations. The group targets about 30 to 40 openings a year across seven markets, and its Philippine pipeline covers Solenad in Laguna, Baguio and Pampanga, according to BusinessWorld in December 2025. Colliers also expects about 111,000 square meters of new retail supply through 2028. SM Prime is also investing PHP 3.6 billion in SMX Seaside Cebu, due in 2026. Operators that enter these cities early can lock in the best mall positions before rivals follow.
Opportunity in edutainment and school field trips
School trips and learning attractions are a steady opening, because they fill parks on weekdays when families are at work. Enchanted Kingdom said its AGILA flying theater serves over half a million students each year, according to Daily Tribune in June 2025. The park also upgraded AGILA and its Space Shuttle coaster from July to September 2025 ahead of its 30th anniversary. Manila Ocean Park opened what it called the first biodome in the Philippines in December 2024, while SM Lifestyle Entertainment runs SM Science Center. These programs give amusement parks and discovery attractions a more stable weekday base than leisure visits alone.
Power, wages and fragile spending squeeze operators
Why do power costs weigh on venue margins?
Air-conditioned arcades, ice rinks and ride systems use power all day, so electricity is one of the largest operating costs. Meralco raised its rate by PHP 0.6268 per kWh in August 2025 to PHP 13.2703 for a typical household, citing higher pass-through charges and a weaker peso, according to Manila Bulletin. Mall-based operators pay these costs through common-area and tenant charges. Many respond with LED lighting and efficient cooling, but ice rinks and large rides remain exposed.
How do rising wages affect staffing models?
Venues need attendants, ride operators, party hosts and redemption counter staff, which makes labor a fixed cost. The Metro Manila wage board raised the non-agriculture minimum wage by PHP 50 to PHP 695 a day from July 18, 2025, according to GMA News. Operators with long opening hours and many small venues feel this most. The response is more self-service, such as cashless cards, app reloads and kiosks, which cuts cashier time but needs upfront investment.
Can household budgets keep pace with ticket prices?
Play venues depend on discretionary spending, which is the first item households cut when prices rise. Household consumption grew 4.6% in 2025 but slowed to 3.8% in the fourth quarter, according to Philippine Statistics Authority data reported by DZRH. Colliers also warned in 2026 that higher fuel costs make discretionary mall trips less attractive. Operators therefore lean on weekday promos, bundles and loyalty rewards to protect visit frequency without cutting headline prices.
How do site risks threaten large outdoor parks?
Large parks need big sites and long leases, so a single loss or lease decision can remove a major attraction. A fire on Oct. 2, 2019 destroyed about 80% of the main Star City building in Pasay, and the park only reopened on Feb. 24, 2022 with 25 rides. The park sits on reclaimed government land in the Cultural Center of the Philippines Complex, so its future rests on lease terms. Investors in new parks therefore seek owned land or long concessions before committing ride capital.
Metro Manila leads as provincial malls add venues
| Region | Value, 2025 (USD million) | Share, 2025 | CAGR, 2026–2035 |
|---|---|---|---|
| National Capital Region | 262.4 | 32.0% | 12.9% |
| Central and Northern Luzon | 159.9 | 19.5% | 13.8% |
| Visayas | 147.6 | 18.0% | 13.7% |
| CALABARZON | 127.1 | 15.5% | 13.7% |
| Mindanao | 123.0 | 15.0% | 14.1% |
Why does the National Capital Region lead spending?
The National Capital Region held 32.0% of 2025 value and grows at 12.9% a year. Metro Manila hosts the largest venues, including the Fantasy World indoor park at SM Fairview, Star City in Pasay and Manila Ocean Park, so foreign brands test the market here before they open in provincial malls. New formats also start here, such as Dave & Buster's in Quezon City and the Zero Latency arena in Makati. Growth is slower than in other zones, because many malls already have an anchor venue.
How do Central and Northern Luzon add capacity?
Central and Northern Luzon held 19.5% of 2025 value and grows at 13.8% a year. SM operates Skyranch parks in Pampanga and Baguio, which sell the ride-all-you-can passes listed in the pricing table. Play centers also reach smaller cities, with kidzooona branches listed in Bulacan, Pampanga, Nueva Ecija, Isabela and Pangasinan malls. Timezone lists Baguio and Pampanga in its pipeline, which shows the zone is still gaining venues.
What makes the Visayas a tourism-led market?
The Visayas held 18.0% of 2025 value and grows at 13.7% a year. Cebu is the hub, because tourists and residents share the same attractions. Cebu Ocean Park sits beside SM Seaside City Cebu, where the same complex also holds Cebu Fun Park, SM Skating and SM Bowling, so one mall trip covers several paid attractions. Mall arcades have operated in Cebu longer than anywhere outside Metro Manila, so growth there comes from venue upgrades rather than first entries.
Why is CALABARZON home to destination parks?
CALABARZON held 15.5% of 2025 value and grows at 13.7% a year. The region holds the largest population noted above and the country's best-known destination park, Enchanted Kingdom in Santa Rosa, Laguna. The park expected a little over 2 million visitors in 2025, according to the Inquirer. Skyranch Tagaytay added the 3,000-square-meter Cartoonville zone in September 2025. Its location within a short drive of Metro Manila lets the region capture weekend day trips from the capital's families.
Why is Mindanao the fastest-growing zone?
Mindanao held 15.0% of 2025 value and grows at 14.1% a year, the fastest of the five zones. Mall play centers now cover the main cities, with kidzooona branches listed at SM City Lanang in Davao, General Santos, Cagayan de Oro, Butuan and Zamboanga. Timezone also runs a venue at Centrio Mall in Cagayan de Oro. Few large outdoor parks operate on the island, so mall venues capture most paid play and gain share as new malls open.
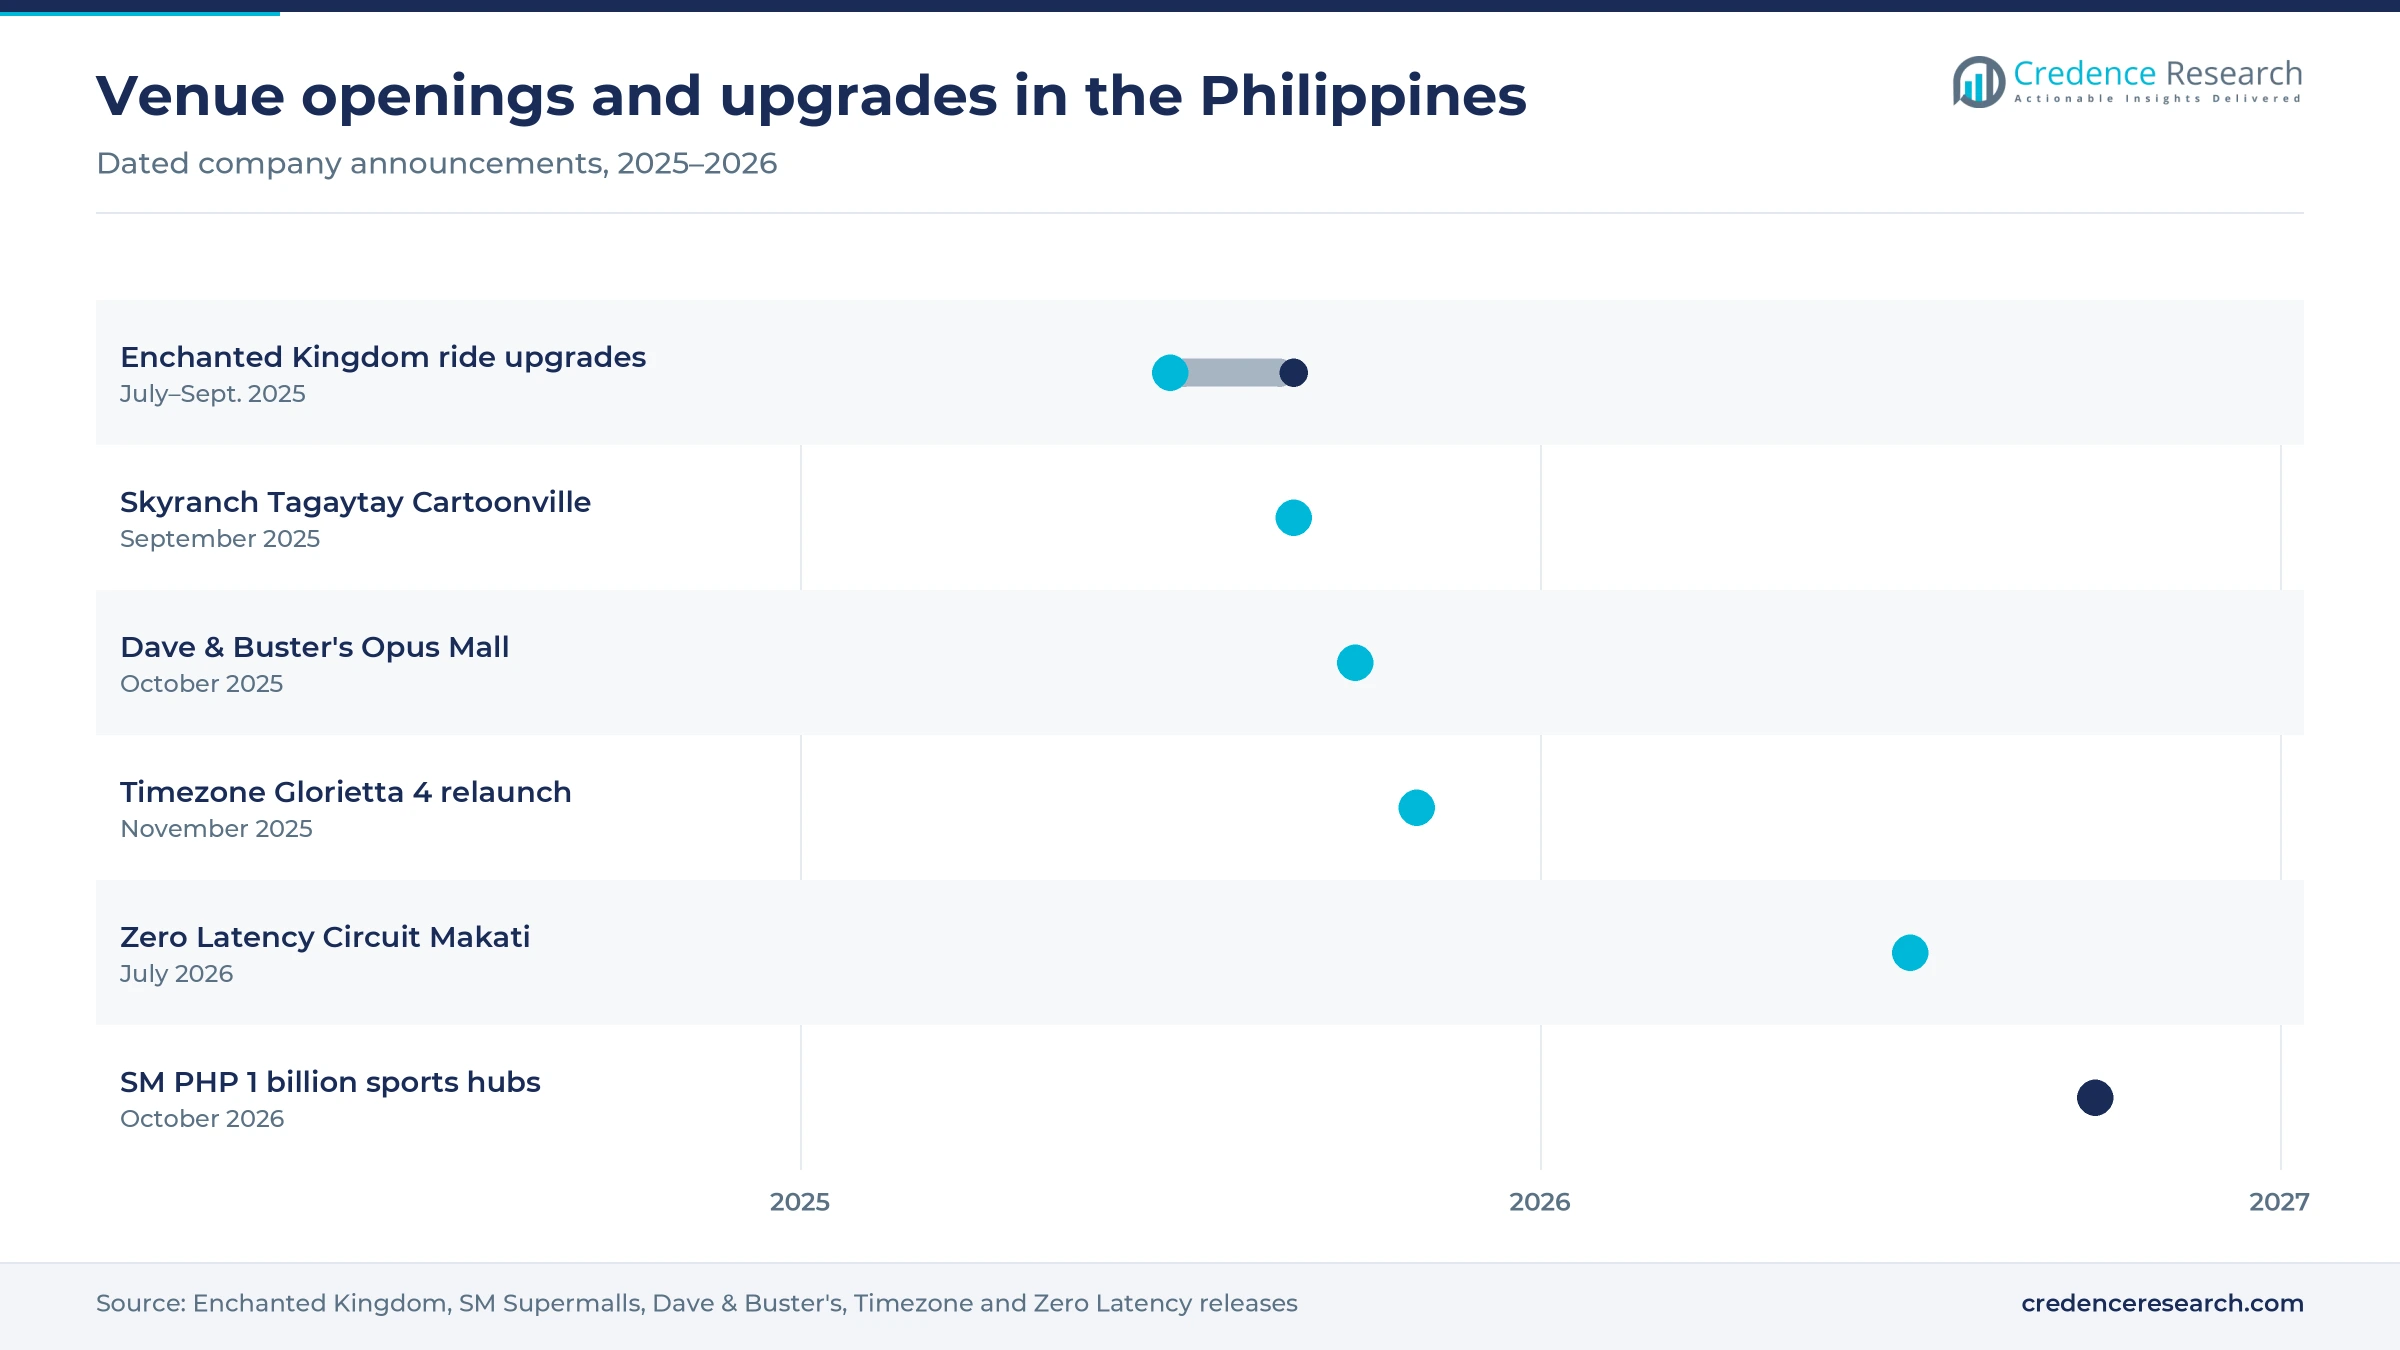
Venue openings and park upgrades from 2025 to 2026
| Development | Status and market relevance |
|---|---|
| In September 2025, SM Supermalls opened the 3,000-square-meter Cartoonville zone and the Sky Spin ride at Skyranch Tagaytay. | Cartoonville All-in-One Pass priced at PHP 499 |
| In October 2025, Dave & Buster's opened its first Philippine venue at Opus Mall in Quezon City with franchisee The Bistro Group. | 1,560-square-meter eatertainment venue; more rollouts planned |
| In November 2025, Timezone relaunched its Glorietta 4 flagship in Makati at nearly 1,400 square meters with more than 120 attractions. | Six more Timezone venues planned for 2026 |
| In May 2026, Zero Latency and Third Culture Entertainment announced a VR arena at Ayala Malls Circuit in Makati. | Opening targeted for July 2026 |
| In October 2026, SM Supermalls announced a PHP 1 billion investment in multi-sport facilities and active social hubs. | Builds on 176 bowling lanes and three Olympic-size rinks |
Cashless cards, VR arenas and apps change the floor
- Cashless game cards replace tokens with reloadable cards, which lets venues track spending per player and run targeted promos.
- Mobile apps let players reload credit, collect vouchers and book parties before arriving, which shifts sales to direct digital channels.
- Free-roam VR arenas let groups of up to six players move through a shared virtual space, which raises the price of a session.
- Interactive play floors add projected games and digital scoring to trampolines and climbing walls, which keeps repeat visits fresh.
Need a Custom Version of This Report?
Tailor the scope, geography, or segments to your exact requirements.
- Custom geography or segment scope
- Direct access to our analyst team
Mall operators and park owners compete for footfall
Competition combines mall-based chains, destination parks and newer foreign brands. Timezone runs the largest arcade network and is converting venues to multi-attraction formats. Tom's World, World of Fun and Quantum compete for space in SM and Robinsons malls, while AEON Fantasy's kidzooona focuses on young children. Enchanted Kingdom and Star City lead ride parks, and China Oceanis runs Manila Ocean Park. MegaPark Philippines operates SuperPark in Megaworld townships, and SM Lifestyle Entertainment runs SM Skating and SM Bowling. Operators compete on mall location, the freshness of games and rides, party packages and app-based loyalty, rather than on headline price alone. Newer entrants such as Dave & Buster's and Zero Latency raise the bar for venue design in Metro Manila, which pushes local chains to reinvest in larger floors and group formats.
A few mall-linked chains face many single-site parks
The supply side of Philippine location-based entertainment splits into mall-based chains and single-site destinations. Timezone, Tom's World, World of Fun, Quantum and kidzooona run dozens of venues each inside SM, Ayala and Robinsons malls, and Timezone is a joint venture with Ayala Land, which gives it first access to new Ayala space. Destination parks such as Enchanted Kingdom, Star City and Manila Ocean Park each depend on one large site. Entry barriers are mall access and capital for rides, while margins are highest on food, parties and game credits rather than admission.
Companies profiled and their roles in this market
| Company | Type | Role in the market |
|---|---|---|
| Timezone Philippines | Arcade and FEC chain | Runs 51 full-size venues and over 50 smaller sites in malls nationwide |
| Tom's World Philippines | Arcade chain | Operates mall arcades in Metro Manila and is expanding into provincial cities |
| Quantum Amusement Corporation | Arcade chain | Runs Quantum, Q Power Station and Funplex Station amusement centers |
| World of Fun (KC Wonderland Corporation) | Arcade chain | Operates World of Fun arcades and family rides in major malls nationwide |
| Enchanted Kingdom, Inc. | Theme park operator | Runs the 15-hectare Enchanted Kingdom park in Santa Rosa, Laguna |
| Star Parks Corporation (Star City) | Amusement park operator | Operates Star City rides, Snow World and attractions in Pasay |
| China Oceanis Philippines, Inc. (Manila Ocean Park) | Oceanarium operator | Runs Manila Ocean Park and its biodome in Manila |
| AEON Fantasy Group Philippines, Inc. (kidzooona) | Children play center chain | Runs kidzooona play centers in SM and Robinsons malls |
| MegaPark Philippines, Inc. (SuperPark Philippines) | Active play operator | Operates SuperPark activity parks in Eastwood City and McKinley Hill |
| SM Lifestyle Entertainment, Inc. | Active and edutainment operator | Runs SM Skating, SM Bowling and SM Science Center in SM malls |
Credence Research view on venue-led growth
Credence Research's view is that location-based entertainment growth will come from mall venues that sell an outing, not a single game. The leading chains are already enlarging venues, adding karaoke, bowling and VR, and pricing parties and group packages. Destination parks will remain important for school trips and holidays, but their growth depends on reinvestment in rides. The strongest openings sit in provincial malls in Mindanao, Central Luzon and the Visayas, where demand is ahead of supply. Power and wage costs will reward operators that combine cashless systems, efficient cooling and high spend per visit.
Venue revenue model built from public operator data
The report uses 2025 as the base year on a calendar basis, with peso revenue converted to U.S. dollars at average annual exchange rates. Market values come from the Credence Research model, which links venue counts, visitor volumes and typical spend per visit, and checks the result against official revenue data for amusement and recreation establishments. Regional shares, regional growth rates and segment splits are Credence Research estimates. Sources used are Philippine Statistics Authority releases, World Bank material, Department of Tourism figures, company releases and business press, and no interviews or surveys were used.
Secondary cities and group play shape growth to 2035
Spending is expected to reach USD 2.91 billion by 2035, a 13.51% CAGR during 2026–2035, as chains add venues in provincial malls and convert older arcades into larger social venues. Growth should be fastest in the late 2020s, when Timezone, foreign eatertainment brands and VR arenas complete their current pipelines. After that, group bookings, school programs and digital loyalty will decide how much each visitor spends. Weak household budgets or higher power costs could slow openings, but the shift toward paid experiences in malls keeps the long-term outlook positive.
Mall openings and household budgets set the range of outcomes
In the base case, location-based entertainment spending grows from USD 930.8 million in 2026 at the forecast rate. The outcome depends mainly on how many new and redeveloped malls add leisure anchors, and on whether household budgets keep pace with ticket prices. The downside case assumes weak consumption and slower provincial openings. The upside case adds faster VR and eatertainment rollouts and a full tourism recovery.
| Scenario | CAGR, 2026–2035 | Value, 2035 | What has to hold |
|---|---|---|---|
| Downside | 10.5% | USD 2.29 billion | Household spending stays soft, provincial openings slip and electricity costs keep rising |
| Base | 13.51% | USD 2.91 billion | Chains roll out planned venues and tourist arrivals recover steadily |
| Upside | 15.5% | USD 3.41 billion | Foreign VR and eatertainment brands expand nationwide and arrivals return to pre-pandemic levels |
Frequently Asked Questions
How big is the Philippines location-based entertainment market?
Which region leads spending on play venues?
Which service type holds the largest share?
How large is the Timezone network in the Philippines?
How much does a theme park day pass cost?
Which region grows fastest through 2035?
Which companies compete in this market?
What is the main challenge for venue operators?
Table of Content
Chapter 1 Market Segmentation
- 1.1 Segmentation Framework
- 1.1.1 Product and Service Classification
- 1.1.2 Application and End-Use Classification
- 1.1.3 Technology and Solution Classification
- 1.1.4 Customer and Distribution Channel Classification
- 1.1.5 Geographic Segmentation
- 1.1.6 Market Segment Definitions and Boundaries
- 1.2 By Service Type
- 1.2.1 Family Entertainment Centers
- 1.2.2 Theme and Amusement Parks
- 1.2.3 Immersive and VR Entertainment
- 1.2.4 Edutainment and Discovery Attractions
- 1.2.5 Active Entertainment
- 1.3 By Customer Type
- 1.3.1 Families with Children
- 1.3.2 Teenagers and Young Adults
- 1.3.3 Corporate and Organized Groups
- 1.3.4 Domestic and International Tourists
- 1.4 By End-Use Industry
- 1.4.1 Shopping Malls
- 1.4.2 Tourism Attractions
- 1.4.3 Hospitality and Integrated Developments
- 1.4.4 Standalone Leisure Developments
- 1.5 By Channel
- 1.5.1 Walk-In and On-Site
- 1.5.2 Direct Digital Booking
- 1.5.3 Mall and Corporate Partnerships
- 1.5.4 Travel and Experience Platforms
Chapter 2 Introduction
- 2.1 Report Objectives and Scope
- 2.2 Product Definition and Industry Terminology
- 2.3 Market Inclusions and Exclusions
- 2.4 Research Process
- 2.4.1 Primary Research and Expert Interviews
- 2.4.2 Secondary Research and Source Review
- 2.4.3 Top-Down and Bottom-Up Estimation
- 2.4.4 Data Triangulation and Verification
- 2.5 Market Size Measurement Basis
- 2.5.1 2025: USD 820.0 million → 2035: USD 2.91 billion
- 2.6 Historical and Forecast Reference Periods
- 2.6.1 Historical Period: 2018-2025
- 2.6.2 Base Year: 2025
- 2.6.3 Forecast Period: 2025-2035
- 2.7 Research Assumptions and Limitations
Chapter 3 Executive Summary
- 3.1 Market Snapshot and Key Findings
- 3.2 Base-Year Market Size, 2025
- 3.3 Forecast Market Size, 2035
- 3.4 Revenue and Volume Growth Outlook
- 3.5 Key Demand and Supply Indicators
- 3.6 Leading Market Segments
- 3.7 Fastest-Growing Market Opportunities
- 3.8 Regional Performance Highlights
- 3.9 Technology and Industry Transformation
- 3.10 Competitive Landscape Summary
- 3.11 Analyst View and Strategic Implications
Chapter 4 Philippines Location-Based Entertainment Market Trends and Developments
- 4.1 Historical Industry Development, 2018-2025
- 4.2 Recent Market Trends and Developments
- 4.3 Demand and Customer Behavior Trends
- 4.4 Technology and Product Innovation
- 4.5 Artificial Intelligence, Automation and Digitalization
- 4.6 Local Manufacturing and Supply Chain Realignment
- 4.7 Industry Partnerships, Mergers and Acquisitions
- 4.8 Sustainability and Circular Economy Developments
- 4.9 Government and Private Sector Investment Trends
- 4.10 Emerging Business Models and Commercialization
- 4.11 Industry Developments and Announcements
Chapter 5 Philippines Location-Based Entertainment Market Supply and Demand Analysis
- 5.1 Demand Trend and Consumption Analysis, 2018-2025
- 5.2 Demand Forecast, 2025-2035
- 5.3 Supply Chain Structure and Procurement Trends
- 5.4 Supply-Demand Gap and Bottlenecks
- 5.5 Import Dependence and Sourcing Structure
- 5.6 Regional Supply and Demand Concentration
Chapter 6 Philippines Location-Based Entertainment Market Pricing Analysis
- 6.1 Pricing Structure and Measurement
- 6.2 Historical Pricing Trends, 2018-2025
- 6.3 Pricing Outlook, 2025-2035
- 6.4 Pricing by Product and Market Segment
- 6.5 Geographic Pricing Differences
- 6.6 Key Input, Energy, Labor and Logistics Costs
- 6.7 Contract Pricing and Purchasing Models
- 6.8 Pricing Sensitivity and Competitive Positioning
- 6.9 Price, Margin and Profitability Implications
Chapter 7 Philippines Location-Based Entertainment Market Dynamics
- 7.1 Market Growth Drivers
- 7.1.1 Demand-Side Drivers
- 7.1.2 Technology and Innovation Drivers
- 7.1.3 Infrastructure and Investment Drivers
- 7.1.4 Regulatory and Policy Drivers
- 7.2 Market Restraints
- 7.2.1 Cost and Affordability Constraints
- 7.2.2 Technology and Adoption Barriers
- 7.2.3 Supply Chain and Operational Constraints
- 7.3 Market Challenges
- 7.3.1 Competitive Pressure and Margin Erosion
- 7.3.2 Skills, Infrastructure and Implementation Gaps
- 7.4 Emerging Market Opportunities
- 7.5 Market Dynamics Impact and Time-Horizon Assessment
Chapter 8 Philippines Location-Based Entertainment Value Chain Analysis
- 8.1 Industry Value Chain Overview
- 8.2 Upstream Suppliers and Critical Inputs
- 8.3 Technology and Component Providers
- 8.4 Manufacturing or Service Delivery
- 8.5 Distribution, Channel Partners and Integrators
- 8.6 Downstream Applications and End Users
- 8.7 Value Addition and Profit Pools
- 8.8 Vertical Integration and Outsourcing
- 8.9 Supplier Concentration and Risk
- 8.10 Supply Chain Localization and Resilience
Chapter 9 Philippines Location-Based Entertainment Market Regulations and Policies
- 9.1 Relevant Laws, Standards and Compliance Frameworks
- 9.2 Product, Service, Safety and Quality Requirements
- 9.3 Government Policies, Incentives and Subsidies
- 9.4 Imports, Exports and Trade Barriers
- 9.5 Public Procurement and Local Content Requirements
- 9.6 Data Protection, AI and Cybersecurity Compliance
- 9.7 Upcoming Policy Changes and Market Implications
Chapter 10 Philippines Location-Based Entertainment Market Hotspots and Opportunities
- 10.1 Market Opportunity Mapping and Growth Hotspots
- 10.2 High-Growth Applications and Customer Groups
- 10.3 Underserved Markets and White-Space Opportunities
- 10.4 Emerging Technology and Product Opportunities
- 10.5 New Capacity and Investment Hotspots
- 10.6 Market Entry and Expansion Opportunities
- 10.7 Distribution and Partnership Opportunities
- 10.8 Near-Term and Long-Term Commercial Potential
- 10.9 Opportunity Attractiveness and Execution Risks
Chapter 11 Philippines Location-Based Entertainment Market Outlook, 2025-2035
- 11.1 Market Size and Analysis
- 11.1.1 Revenue (Market Measurement: 2025: USD 820.0 million → 2035: USD 2.91 billion)
- 11.1.2 Historical Market Size, 2018-2025
- 11.1.3 Base-Year Market Size, 2025
- 11.2 Market Forecast, 2025-2035
- 11.2.1 Revenue Forecast to 2035
- 11.2.2 CAGR and Year-on-Year Growth
- 11.2.3 Incremental Revenue Opportunity
- 11.3 Forecast Assumptions and Scenario Analysis
- 11.3.1 Base-Case Forecast
- 11.3.2 Optimistic and Conservative Scenarios
- 11.3.3 Technology, Pricing and Policy Sensitivities
- 11.4 Market Attractiveness and Growth Outlook
Chapter 12 Philippines Location-Based Entertainment Market Segmentation and Outlook
- 12.1 Segmentation Summary and Market Shares, 2025
- 12.2 Largest and Fastest-Growing Segments
- 12.3 By Service Type - Market Size and Forecast, 2025-2035
- 12.3.1 Segment Definition and Scope
- 12.3.2 Historical Market Size, 2018-2025
- 12.3.3 Revenue Forecast, 2025-2035
- 12.3.4 Base-Year Market Share, 2025
- 12.3.5 Segment CAGR and Growth Drivers
- 12.3.6 Subsegment Market Size and Forecast
- 12.3.6.1 Family Entertainment Centers
- 12.3.6.2 Theme and Amusement Parks
- 12.3.6.3 Immersive and VR Entertainment
- 12.3.6.4 Edutainment and Discovery Attractions
- 12.3.6.5 Active Entertainment
- 12.3.7 Subsegment Pricing and Adoption Trends
- 12.3.8 Leading Suppliers and Competition
- 12.3.9 Regional Demand and Opportunities
- 12.4 By Customer Type - Market Size and Forecast, 2025-2035
- 12.4.1 Segment Definition and Scope
- 12.4.2 Historical Market Size, 2018-2025
- 12.4.3 Revenue Forecast, 2025-2035
- 12.4.4 Base-Year Market Share, 2025
- 12.4.5 Segment CAGR and Growth Drivers
- 12.4.6 Subsegment Market Size and Forecast
- 12.4.6.1 Families with Children
- 12.4.6.2 Teenagers and Young Adults
- 12.4.6.3 Corporate and Organized Groups
- 12.4.6.4 Domestic and International Tourists
- 12.4.7 Subsegment Pricing and Adoption Trends
- 12.4.8 Leading Suppliers and Competition
- 12.4.9 Regional Demand and Opportunities
- 12.5 By End-Use Industry - Market Size and Forecast, 2025-2035
- 12.5.1 Segment Definition and Scope
- 12.5.2 Historical Market Size, 2018-2025
- 12.5.3 Revenue Forecast, 2025-2035
- 12.5.4 Base-Year Market Share, 2025
- 12.5.5 Segment CAGR and Growth Drivers
- 12.5.6 Subsegment Market Size and Forecast
- 12.5.6.1 Shopping Malls
- 12.5.6.2 Tourism Attractions
- 12.5.6.3 Hospitality and Integrated Developments
- 12.5.6.4 Standalone Leisure Developments
- 12.5.7 Subsegment Pricing and Adoption Trends
- 12.5.8 Leading Suppliers and Competition
- 12.5.9 Regional Demand and Opportunities
- 12.6 By Channel - Market Size and Forecast, 2025-2035
- 12.6.1 Segment Definition and Scope
- 12.6.2 Historical Market Size, 2018-2025
- 12.6.3 Revenue Forecast, 2025-2035
- 12.6.4 Base-Year Market Share, 2025
- 12.6.5 Segment CAGR and Growth Drivers
- 12.6.6 Subsegment Market Size and Forecast
- 12.6.6.1 Walk-In and On-Site
- 12.6.6.2 Direct Digital Booking
- 12.6.6.3 Mall and Corporate Partnerships
- 12.6.6.4 Travel and Experience Platforms
- 12.6.7 Subsegment Pricing and Adoption Trends
- 12.6.8 Leading Suppliers and Competition
- 12.6.9 Regional Demand and Opportunities
- 12.7 Segment Growth Comparison
- 12.8 Segment Attractiveness and Priority Matrix
Chapter 13 Philippines Location-Based Entertainment End-Use and Application Market Outlook
- 13.1 End-Use Industry and Customer Demand Structure
- 13.2 Leading Applications and Customer Groups
- 13.3 End-Use Market Size, Share and Forecast
- 13.4 Major End-Use Industry Deep Dives
- 13.4.1 Customer Requirements and Use Cases
- 13.4.2 Demand and Replacement Cycles
- 13.4.3 Technical and Regulatory Considerations
- 13.4.4 Purchasing and Procurement Models
- 13.4.5 Leading Vendors and Distribution Channels
- 13.4.6 Forecast and Commercial Opportunities
- 13.5 Emerging Applications and Cross-Segment Demand
- 13.6 End-Use Industry Investment Priorities
Chapter 14 Philippines Location-Based Entertainment Geographic Market Outlook, 2025-2035
- 14.1 Domestic Market Distribution and Demand Clusters
- 14.2 State- or Province-Wise Market Size and Forecast, 2025-2035
- 14.3 City and Metropolitan Market Outlook
- 14.4 Industrial, Manufacturing and Commercial Clusters
- 14.5 Geographic Concentration of Key End Users
- 14.6 Local Pricing and Purchasing Differences
- 14.7 Domestic Production Facilities and Capacity Map
- 14.8 Local Infrastructure and Project Pipeline
- 14.9 State-Level Policy and Incentive Differences
- 14.10 Subnational Investment Hotspots and Opportunities
- 14.11 Distribution and Logistics Networks
- 14.12 Domestic Competitive Footprint
Chapter 15 Philippines Location-Based Entertainment Technology, Innovation and Sustainability Outlook
- 15.1 Technology Landscape and Maturity
- 15.2 Product, Process and Service Innovation
- 15.3 AI, Automation and Digital Tools in the Industry
- 15.4 Technology Adoption and Performance Benchmarking
- 15.5 Innovation Pipeline and R&D Investment
- 15.6 Energy Efficiency and Resource Management
- 15.7 Sustainability, Recycling and Circularity
- 15.8 Technology Roadmap, 2025-2035
- 15.9 Risks of Obsolescence and Technology Substitution
Chapter 16 Philippines Location-Based Entertainment Market Key Strategic Imperatives
- 16.1 Growth and Market Entry Priorities
- 16.2 High-Return Products and Segments
- 16.3 Pricing, Profitability and Cost Optimization
- 16.4 Technology Investment and Product Differentiation
- 16.5 Supply Chain Localization and Resilience
- 16.6 Distribution and Customer Acquisition
- 16.7 Partnership, Acquisition and Capacity Strategy
- 16.8 Regional Expansion Priorities
- 16.9 Short-, Medium- and Long-Term Actions
Chapter 17 Competition Outlook
- 17.1 Industry Competition Characteristics
- 17.2 Market Structure and Concentration
- 17.3 Market Share and Competitive Positioning, 2025
- 17.4 Company-Wise Revenue and Product Benchmarking
- 17.5 Production and Service Capacity Benchmarking
- 17.6 Technology, Pricing and Differentiation
- 17.7 Regional Footprint and Distribution Strength
- 17.8 Mergers, Acquisitions and Strategic Alliances
- 17.9 New Entrants and Competitive Threats
- 17.10 Porter's Five Forces and Industry Attractiveness
- 17.11 Competitive Outlook, 2025-2035
Chapter 18 Company Profiles
- 18.1 Company Coverage and Selection Criteria
- 18.2 Timezone Philippines
- 18.2.1 Business Description
- 18.2.2 Company Ownership and Geographic Presence
- 18.2.3 Product and Service Portfolio
- 18.2.4 Manufacturing and Operating Footprint
- 18.2.5 Financial Performance and Investment
- 18.2.6 Market Share and Competitive Position
- 18.2.7 Technology and Innovation Capabilities
- 18.2.8 Strategic Alliances or Partnerships
- 18.2.9 Recent Developments
- 18.2.10 Growth Strategy and Outlook
- 18.3 Tom's World Philippines
- 18.4 Quantum Amusement Corporation
- 18.5 World of Fun (KC Wonderland Corporation)
- 18.6 Enchanted Kingdom, Inc.
- 18.7 Star Parks Corporation (Star City)
- 18.8 China Oceanis Philippines, Inc. (Manila Ocean Park)
- 18.9 AEON Fantasy Group Philippines, Inc. (kidzooona)
- 18.10 MegaPark Philippines, Inc. (SuperPark Philippines)
- 18.11 SM Lifestyle Entertainment, Inc.
- 18.12 Other Relevant Market Participants
Note: Every listed company is profiled on the structure shown under the first company. The company list is preliminary and may change based on research findings, market developments, data availability and client requirements.
Chapter 19 Disclaimer
- 19.1 Research and Forecast Disclaimer
- 19.2 Data Source and Estimation Limitations
Note: The depth of individual sections depends on data availability for this market. Volume, capacity, trade and other unit-based metrics are included where applicable.

