
Market Overview
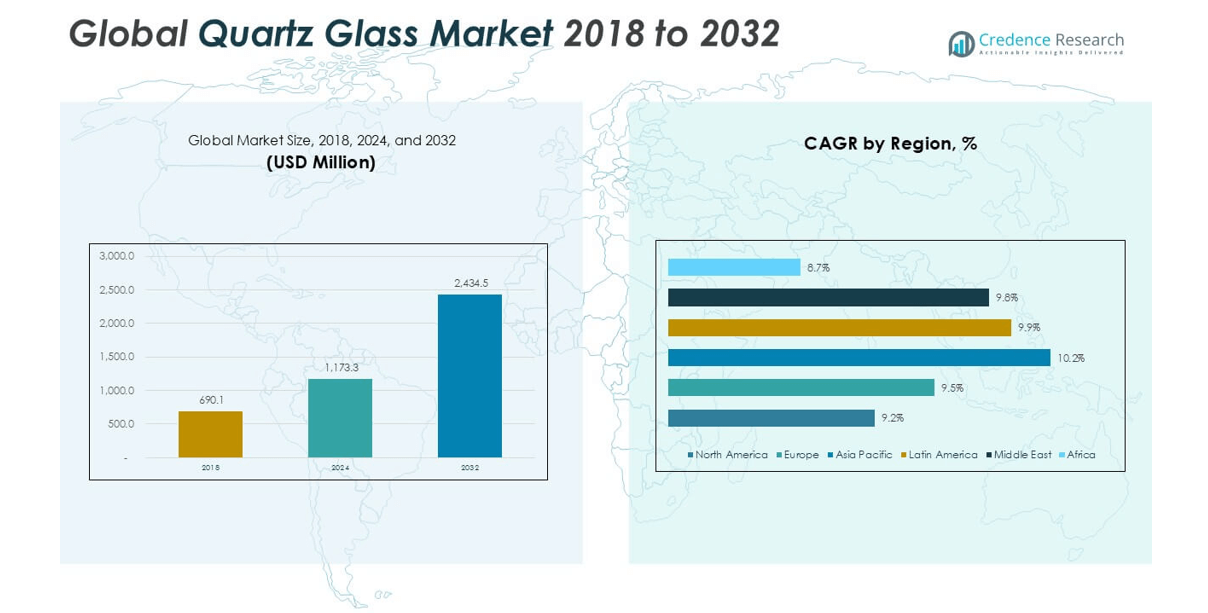
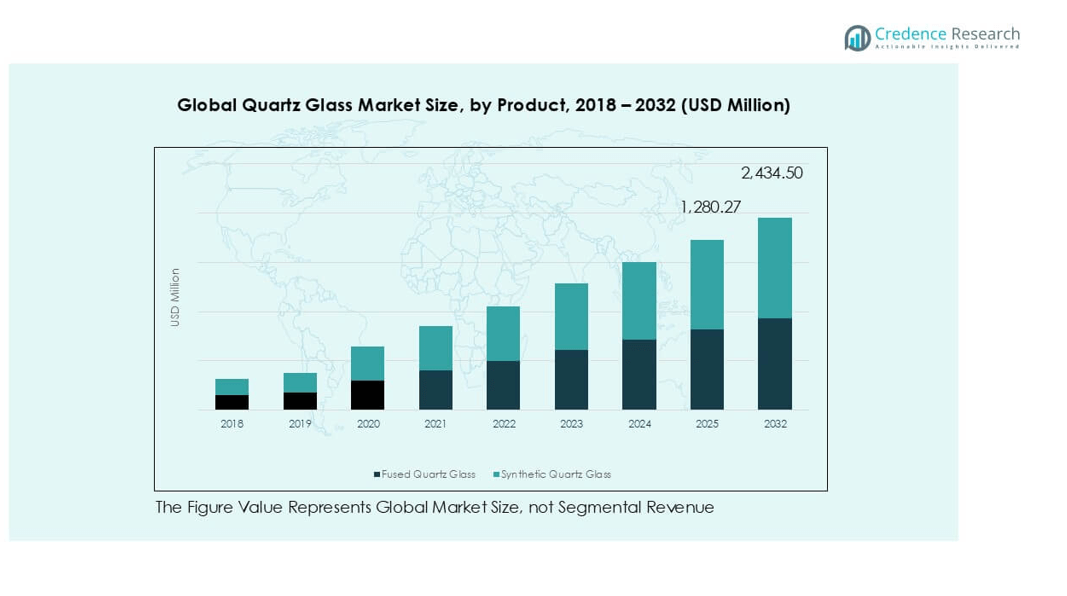
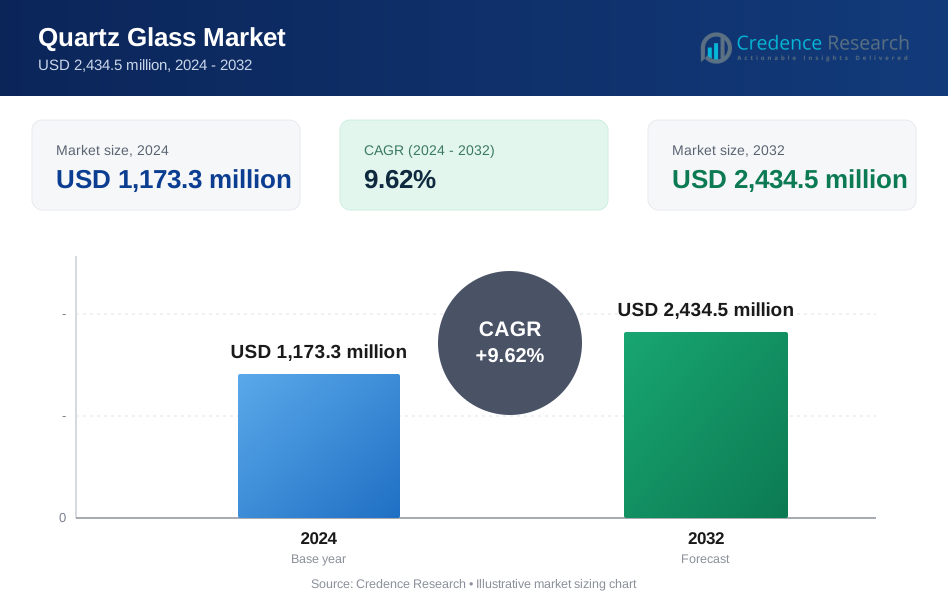
Global Quartz Glass Market size was valued at USD 690.1 million in 2018 and increased to USD 1,173.3 million in 2024. It is anticipated to reach USD 2,434.5 million by 2032, growing at a CAGR of 9.62% during the forecast period.
| REPORT ATTRIBUTE | DETAILS |
|---|---|
| Historical Period | 2020-2023 |
| Base Year | 2024 |
| Forecast Period | 2025-2032 |
| Quartz Glass Market Size 2024 | USD 1,173.3 million |
| Quartz Glass Market, CAGR | 9.62% |
| Quartz Glass Market Size 2032 | USD 2,434.5 million |
The global quartz glass market is driven by leading players such as Tosoh, Saint-Gobain S.A., Heraeus Holding, LabQuartz, Kedar Scientific, Insaco Inc., American Precision Glass Corp, S & S Optical Company, Quartz Solutions Inc., Zhong Cheng Quartz Glass Co., Ltd., and Feilihua Quartz Glass Company. These companies focus on advanced manufacturing, product innovation, and strategic partnerships to serve high-growth sectors including semiconductors, solar energy, and medical applications. Regionally, North America led the market with 33% share in 2024, supported by strong semiconductor and research industries, while Asia Pacific followed with 27% share, driven by rapid solar adoption and electronics manufacturing. Europe accounted for 22% share, underpinned by renewable energy projects and advanced laboratory infrastructure. This regional distribution highlights the dominance of developed economies in market growth, while Latin America, the Middle East, and Africa are emerging with increasing investments in solar energy and healthcare applications.
Market Insights
- The global quartz glass market was valued at USD 690.1 million in 2018, reached USD 1,173.3 million in 2024, and is projected to hit USD 2,434.5 million by 2032, growing at a CAGR of 9.62%.
- Key drivers include rising demand in semiconductors and electronics, where quartz glass ensures high thermal stability, along with increasing use in solar energy systems and advanced medical devices.
- Trends highlight growing adoption in optics and photonics, particularly in lasers, fiber optics, and LiDAR, while sustainable manufacturing practices are becoming a competitive differentiator.
- The competitive landscape is moderately fragmented, with companies like Tosoh, Saint-Gobain S.A., Heraeus Holding, and Feilihua Quartz Glass focusing on innovation, capacity expansion, and eco-friendly production to strengthen their market share.
- Regionally, North America led with 33% share in 2024, followed by Asia Pacific at 27% and Europe at 22%, while quartz tubes held the dominant share among form segments.
Market Segmentation Analysis:
By Product
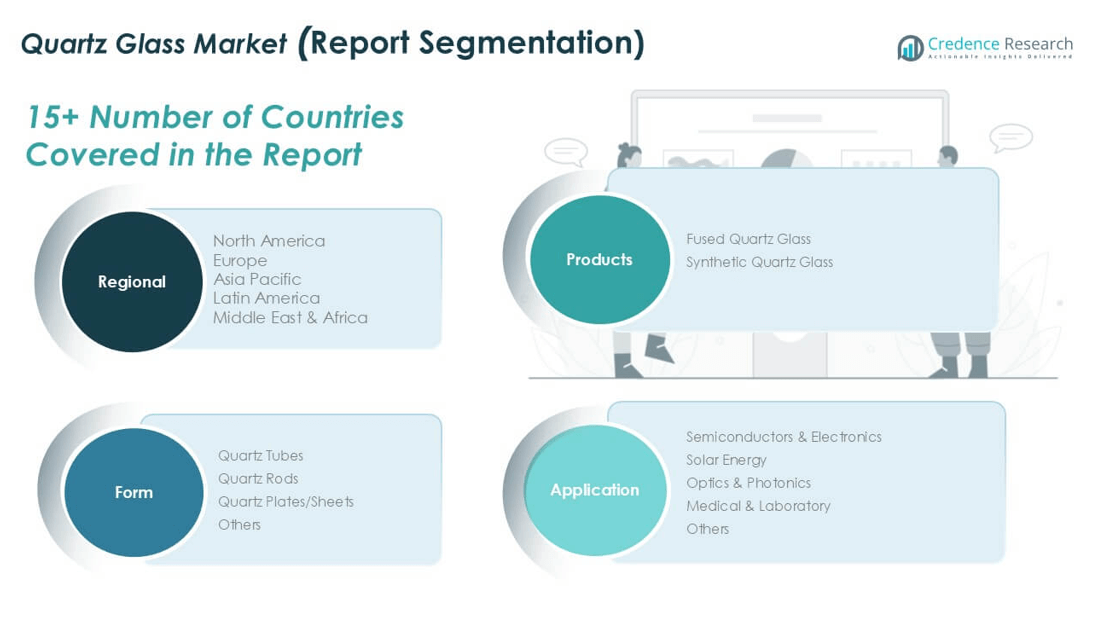
The product segment of the global quartz glass market is divided into fused quartz glass and synthetic quartz glass. Fused quartz glass held the dominant share in 2024, accounting for over 60% of total revenue, driven by its superior thermal resistance, purity, and durability in high-performance applications. Its extensive use in semiconductors, optics, and photonics makes it the preferred material for advanced industries. Synthetic quartz glass is steadily growing, supported by demand in electronics and laboratory applications where low hydroxyl content and higher optical performance are critical.
- For instance, Heraeus produces fused quartz tubes with dimensional tolerances of ±0.02 mm for semiconductor diffusion furnaces, enabling stable 300 mm wafer processing.
By Application
Among applications, semiconductors and electronics emerged as the largest segment in 2024, holding more than 45% market share. Rising demand for wafers, photomasks, and diffusion tubes fueled this dominance, as quartz glass provides high-temperature stability and excellent chemical resistance. The solar energy sector also showed strong growth, supported by increasing investments in photovoltaic cells and panels. Optics and photonics applications benefited from rising use in lasers and fiber optics. Medical and laboratory applications, though smaller in share, gained traction due to the material’s biocompatibility and chemical inertness.
- For instance, ASML’s EUV lithography systems require synthetic quartz photomask blanks with surface flatness ≤15 nm over 150 mm, relying on ultra-pure quartz suppliers.
By Form
In terms of form, quartz tubes held the leading position in 2024, representing nearly 50% of total sales. Their widespread adoption in semiconductor production, UV lamps, and optical devices ensures consistent demand. Quartz rods followed as a significant contributor, particularly in photonics and precision optics. Quartz plates and sheets gained relevance in laboratory setups and optical windows, driven by their superior transmission properties. The “others” category, including customized components, is expanding as industries seek tailored solutions. Growth across all forms is supported by rising R&D and advanced manufacturing techniques enhancing material performance.
Key Growth Drivers
Rising Demand in Semiconductors and Electronics
The semiconductor and electronics sector is the leading growth driver for the quartz glass market, accounting for a large share of global consumption. Quartz glass is essential in wafer production, diffusion tubes, and photomasks due to its thermal stability and high purity. With the proliferation of advanced technologies such as 5G, AI, and IoT, semiconductor demand has surged, boosting the need for reliable materials like quartz glass. Additionally, miniaturization of electronic devices requires precision components that quartz glass can deliver, further driving adoption. Expanding fabrication facilities in Asia-Pacific, particularly in China, Taiwan, and South Korea, reinforce this trend, as regional governments and companies invest heavily in chip production. These factors together ensure that semiconductor-driven growth will remain a cornerstone of market expansion through 2032.
- For instance, Heraeus supplies high-purity fused quartz tubes with tight dimensional tolerances for semiconductor diffusion processes, which is a critical requirement for ensuring uniformity during the fabrication of modern 300 mm wafers.
Expansion of Solar Energy Installations
Another major driver is the rapid growth of the solar energy sector, which increasingly relies on quartz glass for photovoltaic and concentrated solar power applications. Quartz tubes, plates, and crucibles are vital in manufacturing solar cells and panels, thanks to their resistance to extreme temperatures and superior light transmission. As countries accelerate renewable energy adoption to meet decarbonization targets, demand for solar panels has multiplied. For instance, large-scale solar projects in Asia-Pacific and Europe require vast quantities of high-performance quartz glass materials to ensure efficiency and longevity. Government incentives and climate policies, including tax credits and clean energy mandates, further strengthen the solar sector’s expansion. This creates a consistent and expanding demand pipeline for quartz glass, making solar energy one of the most dynamic growth contributors in the global market.
- For instance, Momentive’s fused quartz crucibles are used for pulling monocrystalline silicon ingots at 1420 °C for over 6000 hours, supporting solar wafer production in Asia-Pacific and Europe.
Rising Use in Medical and Laboratory Applications
The growing need for high-purity, biocompatible, and durable materials in medical and laboratory settings is driving demand for quartz glass. Its superior chemical resistance and transparency make it indispensable in diagnostic equipment, high-temperature laboratory vessels, and sterilization tools. Rising healthcare spending worldwide, along with a focus on advanced research and diagnostics, creates strong demand for quartz glass components in lab testing, imaging, and surgical equipment. Additionally, the growing biotechnology and pharmaceutical industries use quartz glass in specialized applications requiring high thermal and chemical stability. As personalized medicine and molecular diagnostics gain momentum, precision tools built with quartz glass are becoming essential. The COVID-19 pandemic also highlighted the need for reliable lab materials, accelerating investment in research infrastructure. These dynamics establish medical and laboratory applications as a significant driver of long-term growth for the quartz glass market.
Key Trends & Opportunities
Growing Adoption in Optics and Photonics
A notable trend is the increasing use of quartz glass in optics and photonics, driven by demand for lasers, fiber optics, and precision lenses. The material’s exceptional optical clarity and low thermal expansion make it ideal for high-intensity light applications. With industries such as telecommunications, aerospace, and defense integrating photonics technologies, quartz glass demand continues to rise. Emerging applications in LiDAR systems, used in autonomous vehicles and smart infrastructure, present strong opportunities for market expansion. Additionally, the medical imaging sector’s reliance on photonics strengthens this trend. Companies are also investing in innovations to improve the performance of quartz glass in optical systems, opening new avenues for growth.
- For instance, Corning manufactures ultra-pure fused silica fiber preforms for telecom networks, supporting global deployment of over 1 billion km of optical fiber as of 2023.
Shift Toward Sustainable Manufacturing Practices
Sustainability is becoming a critical opportunity in the quartz glass market, as industries focus on reducing energy use and emissions during production. Manufacturers are investing in eco-friendly processes, such as low-carbon smelting and recycling of quartz components, to align with global green initiatives. Growing customer preference for sustainable products, coupled with regulatory pressures in Europe and North America, is accelerating this trend. Moreover, quartz glass is inherently recyclable, providing opportunities for companies to strengthen their environmental footprint while reducing costs. Firms adopting greener production practices are gaining a competitive edge, particularly in high-regulation markets. This focus on sustainability not only enhances brand value but also creates long-term growth opportunities as industries prioritize environmentally responsible supply chains.
Key Challenges
High Production Costs and Energy Intensity
One of the primary challenges in the quartz glass market is the high cost associated with its production. Manufacturing requires extremely high temperatures and specialized equipment, making the process energy-intensive and costly compared to alternatives. This restricts adoption in price-sensitive applications, particularly in developing regions. Fluctuating energy prices further add to operational uncertainties for producers. Additionally, raw material quality and processing standards must remain exceptionally high, increasing overall expenses. For smaller companies, this cost structure limits entry into the market, consolidating power among large players. Unless manufacturers develop cost-efficient production techniques, high costs will remain a key barrier to broader quartz glass adoption.
Availability of Substitutes in Certain Applications
Another significant challenge is the availability of substitute materials in specific applications, which can limit quartz glass adoption. For example, advanced ceramics, borosilicate glass, and sapphire provide similar thermal and optical properties in some use cases at lower costs. In industries with strong price competition, such as laboratory equipment or basic optics, these substitutes can erode quartz glass demand. The challenge intensifies in regions where budget constraints drive preference for cheaper alternatives. Additionally, technological advancements in substitute materials are narrowing the performance gap. While quartz glass maintains dominance in high-purity, high-performance applications, overcoming the competitive threat from substitutes will be critical for sustained growth.
Regional Analysis
North America
North America accounted for USD 233.87 million in 2018, growing to USD 388.12 million in 2024 and is projected to reach USD 779.04 million by 2032 at a CAGR of 9.2%. The region represented nearly 33% of global revenue in 2024, supported by strong semiconductor and electronics industries in the U.S. and Canada. Rising investment in photonics and advanced medical research further drives adoption. Increasing government incentives for renewable energy projects also expand solar applications, positioning North America as a key growth hub for the quartz glass market.
Europe
Europe generated USD 152.58 million in 2018, expanding to USD 257.75 million in 2024, and is expected to reach USD 530.23 million by 2032 at a CAGR of 9.5%. The region captured around 22% of global market share in 2024, driven by strong solar adoption in Germany and Spain, along with significant demand from semiconductor industries. The presence of advanced research laboratories and pharmaceutical firms enhances the use of quartz glass in laboratory and medical devices. Europe’s sustainability focus also encourages adoption of eco-friendly manufacturing and high-performance quartz glass materials.
Asia Pacific
Asia Pacific held USD 180.18 million in 2018, increasing to USD 315.85 million in 2024, and is projected to achieve USD 681.66 million by 2032 at a CAGR of 10.2%, the fastest among all regions. With 27% share of global revenue in 2024, the region’s dominance is driven by rapid expansion in semiconductor manufacturing in China, Japan, Taiwan, and South Korea. Strong growth in solar installations and increasing investment in photonics research add momentum. Favorable government policies for renewable energy adoption and electronics manufacturing further establish Asia Pacific as the leading growth engine.
Latin America
Latin America’s market stood at USD 74.39 million in 2018, rose to USD 128.74 million in 2024, and is anticipated to reach USD 273.39 million by 2032 at a CAGR of 9.9%. The region captured about 9% of global share in 2024, with growth supported by rising renewable energy investments in Brazil, Mexico, and Chile. Expanding solar energy projects drive demand for quartz glass tubes and plates. Although smaller in semiconductor capacity compared to Asia and North America, Latin America benefits from infrastructure growth and increasing adoption of laboratory-grade quartz glass in healthcare.
Middle East
The Middle East quartz glass market was valued at USD 32.99 million in 2018, grew to USD 56.69 million in 2024, and is forecasted to reach USD 119.29 million by 2032 at a CAGR of 9.8%. It accounted for nearly 5% of global share in 2024, supported by rapid adoption of solar projects across the UAE and Saudi Arabia. Regional investments in optics and photonics research also contribute to demand. Expanding healthcare infrastructure further supports the medical and laboratory application segment, making the Middle East an emerging but promising market for quartz glass.
Africa
Africa recorded USD 16.08 million in 2018, rising to USD 26.13 million in 2024, and is projected to reach USD 50.88 million by 2032 at a CAGR of 8.7%. Holding a modest 4% market share in 2024, Africa’s growth is fueled by increasing renewable energy projects, particularly solar power in South Africa and North African nations. While the semiconductor industry remains underdeveloped, demand for quartz glass is growing in laboratory and medical applications. Supportive government policies for energy diversification and infrastructure modernization provide opportunities for gradual expansion across the region.
Market Segmentations:
By Product
- Fused Quartz Glass
- Synthetic Quartz Glass
By Application
- Semiconductors & Electronics
- Solar Energy
- Optics & Photonics
- Medical & Laboratory
- Others
By Form
- Quartz Tubes
- Quartz Rods
- Quartz Plates/Sheets
- Others
By Geography
- North America
- U.S.
- Canada
- Mexico
- Europe
- Germany
- France
- U.K.
- Italy
- Spain
- Rest of Europe
- Asia Pacific
- China
- Japan
- India
- South Korea
- South-east Asia
- Rest of Asia Pacific
- Latin America
- Brazil
- Argentina
- Rest of Latin America
- Middle East & Africa
- GCC Countries
- South Africa
- Rest of the Middle East and Africa
Competitive Landscape
The global quartz glass market is moderately fragmented, with leading players focusing on advanced product development, strategic collaborations, and regional expansion to strengthen their positions. Major companies such as Tosoh, Saint-Gobain S.A., Heraeus Holding, LabQuartz, Kedar Scientific, Insaco Inc., American Precision Glass Corp, S & S Optical Company, Quartz Solutions Inc., Zhong Cheng Quartz Glass Co., Ltd., and Feilihua Quartz Glass Company dominate the industry. These firms emphasize innovation in fused and synthetic quartz glass to cater to high-demand sectors like semiconductors, solar energy, and medical applications. Financially strong players leverage large-scale production and R&D investments, while regional manufacturers focus on niche applications and cost competitiveness. Recent developments highlight capacity expansions and partnerships to meet rising demand in Asia-Pacific and Europe. The competitive landscape is further shaped by sustainability efforts, with companies increasingly adopting eco-friendly production processes to align with global green standards, giving them a strategic advantage in regulated markets.
Key Player Analysis
- Tosoh
- Saint-Gobain S.A.
- Heraeus Holding
- LabQuartz
- Kedar Scientific
- Insaco Inc
- American Precision Glass Corp
- S & S Optical Company, Inc
- Quartz Solutions Inc.
- Zhong Cheng Quartz Glass Co., Ltd
- Feilihua Quartz Glass Company
- Other Key Players
Recent Developments
- In July 2025, QSIL inaugurated (opened) an expansion building at its ceramics site in Auma-Weidatal for the metallization process. While this is not directly quartz glass, it is part of its high-performance materials / production footprint.
- In March 2025, Heraeus (Heraeus Covantics) launches a new quartz manufacturing plant in Shenyang, China.The facility cost is ~600 million yuan (≈ USD 83.6 million). It focuses on high-purity and ultra-high-purity synthetic quartz products.
- In January 2025, Heraeus Covantics is formed (reorganization). Heraeus combined its high-performance materials units, Heraeus Conamic and Heraeus Comvance, into a new operating company under the name.
- In December 2024 / January 2025, QSIL GmbH Quarzschmelze Ilmenau is acquired by SCHOTT AG. Effective early 2025, SCHOTT acquired the quartz glass production facility in Ilmenau, Germany, including about 275 employees. The acquisition is seen as strategic for SCHOTT to bolster its semiconductor materials portfolio and ensure supply chain resilience
Report Coverage
The research report offers an in-depth analysis based on Product, Application, Form and Geography. It details leading market players, providing an overview of their business, product offerings, investments, revenue streams, and key applications. Additionally, the report includes insights into the competitive environment, SWOT analysis, current market trends, as well as the primary drivers and constraints. Furthermore, it discusses various factors that have driven market expansion in recent years. The report also explores market dynamics, regulatory scenarios, and technological advancements that are shaping the industry. It assesses the impact of external factors and global economic changes on market growth. Lastly, it provides strategic recommendations for new entrants and established companies to navigate the complexities of the market.
Future Outlook
- The quartz glass market will grow steadily with strong demand from semiconductors.
- Solar energy expansion will drive adoption of quartz glass in photovoltaic applications.
- Optics and photonics will emerge as a key growth area worldwide.
- Medical and laboratory applications will see rising demand for high-purity quartz glass.
- Asia Pacific will remain the fastest-growing regional market due to electronics manufacturing.
- North America will sustain leadership supported by semiconductor and research industries.
- Europe will expand steadily, driven by renewable energy and advanced laboratories.
- Sustainability initiatives will push manufacturers toward eco-friendly production methods.
- Competition will intensify as global players invest in R&D and capacity expansions.
- Rising substitutes in low-end applications will encourage innovation in premium quartz glass.
Request a Free Sample
Fill in your details and we'll send you a free sample report.
- Sample data tables & charts
- Research methodology
Need a Custom Version of This Report?
Tailor the scope, geography, or segments to your exact requirements.
- Custom geography or segment scope
- Direct access to our analyst team
Frequently Asked Questions
What is the current market size for Global Quartz Glass Market, and what is its projected size in 2032?
At what Compound Annual Growth Rate is the Global Quartz Glass Market projected to grow between 2025 and 2032?
Which Global Quartz Glass Market segment held the largest share in 2024?
What are the primary factors fueling the growth of the Global Quartz Glass Market?
Who are the leading companies in the Global Quartz Glass Market?
Table of Content
Chapter 1. Report Introduction
- 1.1 Report Description & Purpose
- 1.1.1 Report Title & Market Definition
- 1.1.2 Unique Selling Propositions (USP) & Key Differentiators
- 1.1.3 Value Proposition for Stakeholders
- 1.2 Research Objectives
- 1.2.1 Market Sizing Objectives (Volume & Revenue)
- 1.2.2 Segmentation Objectives
- 1.2.3 Competitive Intelligence Objectives
- 1.2.4 Forecast & Scenario Objectives
- 1.3 Report Scope
- 1.3.1 Quartz Glass Scope – Types & Subtypes Covered
- 1.3.2 Geographic Scope – Regions & Countries Covered
- 1.3.3 Historical Period, Base Year & Forecast Period (2024; forecast to 2032)
- 1.3.4 Inclusions & Exclusions
- 1.4 HS Code & Classification Framework
- 1.5 Currency, Units & Pricing Basis
- 1.6 Target Stakeholders
- 1.7 Limitations & Assumptions
Chapter 2. Executive Summary
- 2.1 Global Quartz Glass Market Snapshot
- 2.1.1 Market Size – Historical (2024) & Forecast (2024-2032) (2024: USD 1,173.3 million → 2032: USD 2,434.5 million)
- 2.1.2 Volume & Revenue – Global Totals
- 2.1.3 Key Market Highlights – Top Five Facts
- 2.2 Quartz Glass Market Segmentation Snapshot
- 2.2.1 Market Split by Region – 2024 vs. 2032
- 2.3 Competitive Snapshot
- 2.3.1 Top 10 Players by Revenue Share – 2024
- 2.3.2 Top 10 Players by Volume Share – 2024
- 2.3.3 Recent Strategic Developments (18-Month Summary)
- 2.4 Key Investment Highlights & Strategic Conclusions
Chapter 3. Quartz Glass Market Dynamics & Industry Analysis
- 3.1 Market Overview & Context
- 3.1.1 Quartz Glass Market Position in the Broader Automotive Value Chain
- 3.1.2 OEM vs. Replacement Market Dynamics
- 3.1.3 Market Maturity & Development Stage by Region
- 3.2 Quartz Glass Market Drivers
- 3.3 Quartz Glass Market Restraints & Challenges
- 3.4 Quartz Glass Market Opportunities
- 3.5 Porter's Five Forces Analysis
- 3.5.1 Threat of New Entrants
- 3.5.2 Bargaining Power of Suppliers
- 3.5.3 Bargaining Power of Buyers
- 3.5.4 Threat of Substitutes
- 3.5.5 Competitive Rivalry – Intensity Assessment
- 3.6 Quartz Glass Value Chain Analysis
- 3.6.1 Upstream – Raw Material/Input Suppliers
- 3.6.1.1 Raw Material/Input 1
- 3.6.1.2 Raw Material/Input 2
- 3.6.1.3 Raw Material/Input 3
- 3.6.2 Midstream – Production/Manufacturing/Service Delivery
- 3.6.2.1 Production/Process Overview
- 3.6.2.2 Key Facility Locations & Capacity by Manufacturer
- 3.6.3 Downstream – Distribution & End Consumer
- 3.6.3.1 Primary Channel – B2B/OEM
- 3.6.3.2 Secondary Channels – Dealer, Retail, Online, Direct
- 3.6.4 Value Chain Profitability Analysis
- 3.6.1 Upstream – Raw Material/Input Suppliers
- 3.7 PESTEL Analysis
- 3.7.1 Political Factors
- 3.7.2 Economic Factors
- 3.7.3 Social Factors
- 3.7.4 Technological Factors
- 3.7.5 Environmental Factors
- 3.7.6 Legal Factors
- 3.8 Quartz Glass Supply Chain Analysis
- 3.8.1 Raw Material/Input Supply Risk Assessment
- 3.8.2 Manufacturing Concentration Risk (Geographic Exposure)
- 3.8.3 Trade Disruption Impact Analysis
- 3.9 Regulatory & Policy Landscape
Note: The regulatory and policy landscape section covers regulations based on their applicability to the market, Quartz Glass category, geography, and scope of the study. Only regulatory frameworks with a material impact on operations, compliance, trade, sustainability, or market access are analyzed in detail.
Chapter 4. Key Investment Pockets & Opportunity Analysis
- 4.1 Quartz Glass Market Attractiveness Analysis
- 4.1.1 By Region – Investment Attractiveness Matrix (Volume × CAGR)
- 4.2 Absolute Revenue Growth Opportunity
- 4.2.1 By Region – Absolute USD Growth Through 2032
- 4.3 Incremental Volume Opportunity
- 4.3.1 By Region – Incremental Volume Through 2032
- 4.3.2 Segment – Incremental Volume
- 4.4 Emerging Submarket Opportunity Deep Dive (Subject to Applicability)
- 4.5 Emerging Market Opportunity Scorecards
- 4.5.1 United States
- 4.5.2 Europe
- 4.5.3 Asia
- 4.5.4 Middle East & Africa
Note: Emerging Market Opportunity Scorecards will be included based on relevance and strategic importance. Regions listed are indicative and may vary depending on data availability and market dynamics.
Chapter 5. Quartz Glass Import-Export Analysis & Trade Flows
- 5.1 Global Trade Overview
- 5.1.1 Global Export Value by Country (2024)
- 5.1.2 Global Export Volume by Country (2024)
- 5.1.3 Global Import Value by Country (2024)
- 5.1.4 Global Import Volume by Country (2024)
- 5.1.5 Net Trade Balance by Country (2024)
- 5.2 Export Analysis – Segment
- 5.2.1 Type 1 (HS Code)
- 5.2.2 Type 2 (HS Code)
- 5.2.3 Type 3 (HS Code)
- 5.2.4 Type 4 (HS Code)
- 5.2.5 Type 5 (HS Code)
- 5.3 Import Analysis – Segment
- 5.3.1 Type 1 (HS Code)
- 5.3.2 Type 2 (HS Code)
- 5.3.3 Type 3 (HS Code)
- 5.3.4 Type 4 (HS Code)
- 5.3.5 Type 5 (HS Code)
- 5.4 Average Unit Trade Prices
- 5.4.1 Average Export Price – Segment & Country
- 5.4.2 Average Import Price – Segment & Source Country
- 5.4.3 Price Trends (2024)
- 5.5 Key Trade Route Analysis
- 5.5.1 Trade Route 1
- 5.5.2 Trade Route 2
- 5.5.3 Trade Route 3
- 5.5.4 Trade Route 4
- 5.5.5 Trade Route 5
- 5.6 Trade Policy Impact Assessment
- 5.6.1 US Anti-Dumping & Section 301 Tariffs
- 5.6.2 EU Customs Union Impact
- 5.6.3 Major Free Trade Agreements
- 5.6.4 USMCA Rules of Origin
Note: Trade policy analysis will be included only where relevant to the Quartz Glass market.
Chapter 6. Competitive Landscape & Company Benchmarking
- 6.1 Quartz Glass Market Concentration & Structure
- 6.1.1 Herfindahl-Hirschman Index (HHI) – vs. 2024
- 6.1.2 Tier 1, Tier 2 & Tier 3 Market Structure
- 6.1.3 Global, Regional & Local Player Dynamics
- 6.2 Quartz Glass Market Share Analysis – 2024
- 6.2.1 Global Revenue Share by Company
- 6.2.2 Global Volume Share by Company
- 6.2.3 Regional Revenue Share
- 6.2.4 Market Share Evolution ( vs. 2024)
- 6.2.5 OEM Segment Share by Company
- 6.2.6 Replacement Segment Share by Company
- 6.3 Production/Delivery Capacity & Facility Analysis
- 6.3.1 Global Installed Capacity
- 6.3.2 Capacity Utilization Rates
- 6.3.3 Production/Output Volume
- 6.3.4 Facility Locations & Capacity Map
- 6.3.5 Planned Capacity Additions
- 6.4 Quartz Glass Competitive Benchmarking Matrix
- 6.4.1 Revenue, Volume, CAGR & Profitability Comparison
- 6.4.2 Channel Revenue Mix
- 6.4.3 Geographic Revenue Exposure
- 6.4.4 R&D Intensity
- 6.4.5 Sustainability Maturity
- 6.5 Strategic Developments in Quartz Glass (Last 24 Months)
- 6.5.1 Mergers, Acquisitions & Divestments
- 6.5.2 New Quartz Glass Launches
- 6.5.3 Facility Expansions
- 6.5.4 Strategic Alliances, Joint Ventures & Partnerships
- 6.5.5 Distribution Expansion & Market Entry
- 6.5.6 Sustainability & ESG Initiatives
- 6.6 Competitive Strategy Mapping
- 6.6.1 Leader, Challenger, Follower & Niche Classification
- 6.6.2 Pricing Strategy Comparison
- 6.6.3 Channel Strategy Matrix
Note: Strategic developments are included based on their materiality and the availability of reliable information.
Chapter 7. Global Quartz Glass Market – By Distribution Channel
- 7.1 Segment Overview
- 7.1.1 Volume & Revenue Split by Channel (2024 & 2032)
- 7.1.2 Channel Mix Evolution (2024-2032)
Chapter 8. Regional Market Analysis – Global Overview
- 8.1 Global Regional Overview
- 8.1.1 Regional Volume Share
- 8.1.2 Regional Revenue Share
- 8.1.3 Regional Volume by Region
- 8.1.4 Regional Revenue by Region
- 8.1.5 Regional Forecast Through 2032
- 8.2 Cross-Regional Segment Analysis
- 8.2.1 By Distribution Channel
- 8.2.2 By Brand/Price Tier
Chapter 9. North America Quartz Glass Market
- 9.1 United States
- 9.2 Canada
- 9.3 Mexico
Chapter 10. Europe Quartz Glass Market
- 10.1 Germany
- 10.2 France
- 10.3 Italy
- 10.4 United Kingdom
- 10.5 Spain
- 10.6 Poland
- 10.7 Russia
- 10.8 Netherlands
- 10.9 Belgium
- 10.10 Sweden
- 10.11 Denmark
- 10.12 Norway
- 10.13 Rest of Europe
Chapter 11. Asia Pacific Quartz Glass Market
- 11.1 China
- 11.2 India
- 11.3 Japan
- 11.4 South Korea
- 11.5 Thailand
- 11.6 Indonesia
- 11.7 Vietnam
- 11.8 Malaysia
- 11.9 Australia
- 11.10 Rest of Asia Pacific
Chapter 12. Latin America Quartz Glass Market
- 12.1 Brazil
- 12.2 Argentina
- 12.3 Colombia
- 12.4 Chile
- 12.5 Rest of Latin America
Chapter 13. Middle East Quartz Glass Market
- 13.1 Saudi Arabia
- 13.2 United Arab Emirates
- 13.3 Turkey
- 13.4 Israel
- 13.5 Iran
- 13.6 Rest of the Middle East
Chapter 14. Africa Quartz Glass Market
- 14.1 South Africa
- 14.2 Egypt
- 14.3 Nigeria
- 14.4 Morocco
- 14.5 Rest of Africa
Chapter 15. Quartz Glass Company Profiles
- 15.1 [Company 01]
- 15.1.1 Company Overview
- 15.1.2 Key Management Personnel
- 15.1.3 Products & Services Portfolio
- 15.1.4 Financial Performance
- 15.1.5 Key Market Focus & Geographic Presence
- 15.1.6 Recent Developments & Strategic Initiatives
Note: The company profile list is preliminary and may change based on research findings, market developments, data availability, and client requirements.
Chapter 16. Appendices
- Appendix A – List of Abbreviations & Acronyms
- Appendix B – Industry Classification Code Reference – Full Series
- Appendix C – Production & Capacity Data Tables
- Appendix D – End-Use & Demand Base Tables
- Appendix E – Consumption & Replacement Rate Assumptions
- Appendix F – ASP Reference Tables
- Appendix G – Manufacturing & Facility Database
- Appendix H – Import-Export Data Tables
- Appendix I – Regulatory Summary Tables
- Appendix J – Primary Research Participant List (Anonymized)
- Appendix K – Primary Research Questionnaire Framework
- Appendix L – Data Sources & Bibliography
- Appendix M – Market Size Divergence & Source Comparison
Chapter 17. Research Methodology
- 17.1 Research Framework & Philosophy
- 17.2 Secondary Research – Sources, Hierarchy & Data Extraction
- 17.3 Data Modeling – Bottom-Up & Top-Down Market Sizing
- 17.4 Primary Research – Stakeholder Framework, LOI & Sample Sizes
- 17.5 Forecast Methodology – Regression, Scenario & Sensitivity Analysis
- 17.6 Quality Control – Four-Layer Validation Framework
- 17.7 Limitations & Standard Assumptions
- 17.8 Disclaimer
