
| REPORT ATTRIBUTE | DETAILS |
|---|---|
| Historical Period | 2019-2022 |
| Base Year | 2023 |
| Forecast Period | 2024-2032 |
| Environmental Remediation Technology Market Size 2024 | USD 116,505 million |
| Environmental Remediation Technology Market, CAGR | 7.6% |
| Environmental Remediation Technology Market Size 2032 | USD 209,335.42 million |
Market Overview:
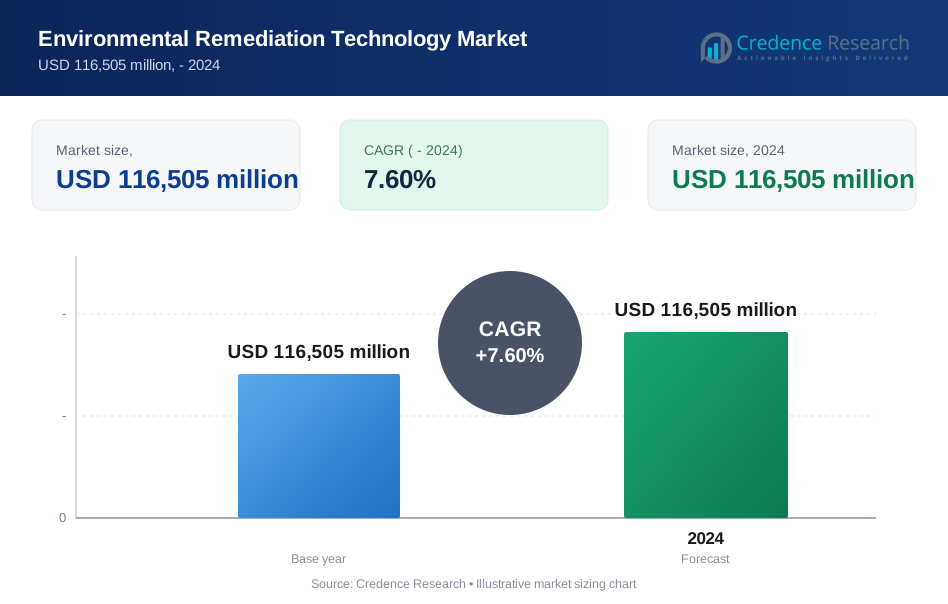
The Environmental Remediation Technology Market is poised to grow from USD 116,505 million in 2024 to USD 209,335.42 million by 2032 at a compound annual growth rate (CAGR) of 7.6% during the forecast period, 2024-2032.
This growth reflects the urgent need for effective environmental management and pollution control, as well as the adoption of advanced remediation technologies. Market drivers include technological advancements such as bioremediation, nanoremediation, and advanced oxidation processes. These innovations enhance the efficiency and effectiveness of environmental cleanup by addressing a wider range of contaminants, including emerging pollutants like pharmaceuticals and microplastics. Stricter environmental regulations and standards mandate the cleanup of hazardous waste sites, further driving market expansion. Additionally, the growing awareness of the harmful effects of pollution and the focus on sustainability are significant factors contributing to the demand for environmental remediation solutions.
Regionally, the Environmental Remediation Technology Market is experiencing growth across various regions. North America and Europe are leading the market due to stringent environmental regulations and high investments in remediation technologies. The United States, in particular, is focusing on cleaning up Superfund sites and brownfields, driving demand for advanced remediation solutions. The Asia-Pacific region is expected to witness rapid growth, driven by industrialization, increasing environmental awareness, and government initiatives promoting environmental sustainability. Countries like China, India, and Japan are investing heavily in advanced remediation technologies to address pollution and ensure compliance with environmental standards. Overall, the Environmental Remediation Technology Market is poised for significant expansion, driven by the increasing need for efficient and effective environmental cleanup solutions across various regions and industries. The market's growth trajectory highlights the importance of innovative technologies in addressing environmental challenges and promoting sustainability.
Market Insights:
- The Environmental Remediation Technology market is projected to grow from USD 116,505 million in 2024 to USD 209,335.42 million by 2032, at a CAGR of 7.6%.
- Rising environmental concerns and stringent regulations are driving the adoption of advanced remediation technologies globally.
- Innovations such as bioremediation, phytoremediation, and nanoremediation are gaining traction due to their cost-effectiveness and efficiency.
- High implementation costs and technical complexity act as significant restraints, particularly for small-scale projects.
- North America leads the market, supported by stringent regulatory frameworks and substantial investments in environmental sustainability.
- The Asia-Pacific region is the fastest-growing market, driven by rapid industrialization and urbanization in countries like China and India.
- Government-backed initiatives and integration of AI and IoT in remediation processes offer new growth opportunities across regions.
Market Drivers:
Stringent Environmental Regulations:
The implementation of rigorous environmental protection legislation is driving significant market growth. For instance, government regulations imposed on oil and gas businesses and mining firms have led to increase in remediation projects since 2022. For instance, the Environment Act 2021 has established legally binding targets for environmental improvement, with 23 specific targets set for 2030, including 30% conservation of land and sea and restoration of degraded ecosystems. For instance, rising safety standards for groundwater and soil have resulted in extensive site reclassification, with 61% of monitored areas now designated as contaminated.
Technological Advancements:
The emergence of innovative remediation technologies is revolutionizing the industry landscape. For instance, nanoremediation techniques have demonstrated exceptional results, with iron nanoparticles achieving removal effectiveness for hexavalent chromium. For instance, advanced nanomaterials like magnetic mesoporous silica NPs (MMSNPs) have shown remarkable efficiency, reaching adsorption capacities of 133g of uranium per gram of MMSNPs in contaminated groundwater treatment across pH ranges of 3.5-9.6.
Industrial Expansion and Urbanization:
The rapid pace of industrialization and urban development has intensified the need for remediation services. For instance, manufacturing facilities generate between 1-2 terabytes of environmental monitoring data daily through 350,000 to 500,000 sensors in a single facility. For instance, the implementation of biochar-nZVI technology has shown significant improvements in chlorinated solvent removal from groundwater, maintaining effectiveness for up to 42 days post-treatment.
Digital Innovation and AI Integration:
The integration of artificial intelligence and big data analytics is transforming remediation strategies. For instance, AI-driven tools are revolutionizing aerial image analysis for automatic identification of construction sites and environmental hazards, while predictive modeling optimizes remediation techniques. For instance, remote sensing capabilities enhanced by AI are enabling advanced site characterization through satellite and drone data, with automated remediation tools like pump and treat systems achieving real-time optimization through AI-controlled adjustments.
Market Trends:
Advanced Nanotechnology Solutions:
Nanotechnology applications are revolutionizing environmental remediation through enhanced contamination removal capabilities. For instance, recent studies show polyurethane foam impregnated with zero-valent iron nanoparticles achieving 99.98% chromium removal from tap water and 96.81% from industrial effluent. For instance, magnetic mesoporous silica nanoparticles demonstrate remarkable efficiency in uranium removal, reaching adsorption capacities of 820.7 mg/g at pH 8, making them ideal for treating neutral solutions like seawater.
Digital Innovation and AI Integration:
Artificial intelligence and machine learning technologies are transforming remediation strategies through advanced monitoring and predictive capabilities. For instance, remote sensing technologies enhanced by AI enable comprehensive site characterization through satellite and drone data analysis. For instance, AECOM's DE-FLUORO technology, developed through six years of research and deployed across the United States, Australia, and Europe, provides complete PFAS destruction through electrochemical oxidation for various waste streams.
Sustainable Bioremediation Solutions:
The industry is witnessing a significant shift toward eco-friendly bioremediation approaches. For instance, Allonnia's 1,4 D-Stroy solution uses specialized microbes delivered through an 18-liter stainless steel dispersion vessel, achieving 99% degradation of 1,4-dioxane in contaminated groundwater. For instance, initial pilot programs in Orange County, California, eliminated over 90% of contamination from two wells within just 11 weeks.
Green Technology Integration:
Environmental remediation is increasingly embracing sustainable and green technologies for contamination treatment. For instance, field studies demonstrate that biochar-nZVI technology significantly improves chlorinated solvent removal from groundwater, maintaining effectiveness for up to 42 days post-treatment, despite initial concentration rebounds in the first two weeks. For instance, these innovations represent a crucial shift toward more sustainable remediation practices while maintaining high efficiency standards.
Market Challenges Analysis:
High Implementation and Equipment Costs:
The substantial capital requirements for environmental remediation projects present a significant barrier, particularly in large-scale operations. For instance, the Environmental Protection Agency (EPA) reports that excavation and disposal costs can reach up to 40% of total project expenses when contaminated soil must be treated as hazardous waste. For instance, heavy equipment such as excavators, bulldozers, and treatment systems require significant investment, with maintenance costs adding considerable operational overhead. For instance, the cost of equipment rental for remediation projects can range from $1,000 to $5,000 per day, depending on the complexity of the machinery needed.
Technical Complexity and Project Duration:
The National Environmental Policy Act (NEPA) oversight reveals that complex contamination scenarios often lead to unpredictable project timelines and escalating costs. For instance, the intricate nature of remediation projects, particularly those involving multiple contaminants, requires specialized expertise and sophisticated technology integration. For instance, projects typically extend 20-30% beyond initial timeline estimates due to unforeseen technical challenges. For instance, the remediation of a site in Oregon involving multiple contaminants took 18 months longer than initially planned due to the need for additional feasibility studies and interim remedial measures.
Regulatory Compliance and Documentation:
Meeting stringent requirements set by the Department of Environmental Quality (DEQ) and state-specific environmental agencies poses significant challenges. For instance, the compliance process involves extensive documentation, permits, and regular monitoring, adding layers of complexity to remediation projects. For instance, the regulatory framework requires companies to maintain detailed records of remediation activities, with non-compliance penalties reaching up to USD 50,000 per day. For instance, in Oregon, the DEQ's oversight of remediation projects includes a two-step investigation process, which can significantly extend project timelines and costs due to the need for thorough documentation and public comment periods.
Skilled Workforce Shortage:
The Bureau of Labor Statistics highlights a critical shortage of qualified environmental remediation specialists. For instance, the industry faces a 15% gap between available positions and qualified professionals, particularly in specialized areas such as nanoremediation and advanced oxidation processes. For instance, this shortage leads to increased labor costs and potential project delays, with training and certification requirements adding to operational expenses. For instance, a study by the Information and Communications Technology Council (ICTC) indicates that skilled talent shortages are expected to persist in the clean energy sector, which includes environmental remediation, particularly for mid and senior-level roles.
Market Opportunities:
The Environmental Remediation Technology market presents significant opportunities fueled by increasing global awareness of environmental sustainability and the rising need to address contamination in soil, water, and air. As industrialization and urbanization intensify worldwide, governments and private organizations are prioritizing investments in remediation technologies to comply with stringent environmental regulations and ensure ecological balance. The growing adoption of advanced methods such as bioremediation, nanoremediation, and chemical treatments underscores the market's potential. Furthermore, the integration of cutting-edge technologies like artificial intelligence (AI) and Internet of Things (IoT) into remediation processes offers enhanced efficiency, precision, and cost-effectiveness, opening avenues for innovation and market expansion.
Emerging economies in Asia-Pacific, Latin America, and Africa represent untapped markets for environmental remediation technologies. These regions are experiencing rapid industrial growth and urbanization, often accompanied by environmental degradation. Government-backed initiatives and funding for sustainable development projects are expected to bolster the demand for remediation technologies in these areas. Additionally, the global push for renewable energy and green technologies presents an indirect opportunity for remediation technologies, as industries transition toward sustainable practices and strive to remediate historical pollution. Collaboration between public and private sectors, coupled with technological advancements, is poised to further catalyze market growth, making the Environmental Remediation Technology market a cornerstone in the global effort to combat pollution and safeguard natural resources.
Market Segmentation Analysis:
By Technology Type, the market includes bioremediation, chemical treatment, thermal treatment, and physical treatment. Bioremediation uses microorganisms to degrade pollutants, making it an environmentally friendly option. Chemical treatment involves using chemical agents to neutralize contaminants. Thermal treatment employs heat to destroy pollutants, while physical treatment includes methods like soil vapor extraction and pump-and-treat systems to remove contaminants from soil and groundwater.
By Application, the market is divided into soil remediation, water remediation, air remediation, and waste remediation. Soil remediation focuses on removing contaminants from soil to restore its health and usability. Water remediation involves treating polluted water bodies to make them safe for use. Air remediation targets the removal of pollutants from the air, and waste remediation deals with the cleanup of hazardous waste sites.
These segments collectively contribute to the growth and evolution of the Environmental Remediation Technology Market, addressing the diverse needs of organizations across various industries and regions.
Segmentations:
By Technology Type:
- Thermal Desorption
- Excavation or Dredging
- Surfactant Enhanced Aquifer Remediation (SEAR)
- Pump and Treat
- Solidification and Stabilization
- In Situ Oxidation
- Soil Vapor Extraction
- Bioremediation
- Nonoremediation
By Application:
- Oil and Gas
- Mining and Forestry
- Waste Disposal Sites
- Agriculture
- Automotive
- Others
By Region:
- North America
- The U.S.
- Canada
- Mexico
- Europe
- Germany
- France
- The U.K.
- Italy
- Spain
- Rest of Europe
- Asia Pacific
- China
- Japan
- India
- South Korea
- South-east Asia
- Rest of Asia Pacific
- Latin America
- Brazil
- Argentina
- Rest of Latin America
- Middle East & Africa
- GCC Countries
- South Africa
- Rest of the Middle East and Africa
Regional Analysis:
North American
The North American market dominates the Environmental Remediation Technology sector, accounting for 35% of global revenue in 2024. For instance, the United States, contributing nearly 80% of the regional revenue, and Canada lead the region, driven by stringent environmental regulations such as the Clean Water Act and the Superfund programs, which have funded over 40,000 remediation projects since inception. For instance, substantial investments, including $1.2 billion allocated by the U.S. government in 2023 for cleanup initiatives, underscore the region's focus on mitigating industrial pollution. For instance, key industries, such as oil and gas, which contribute over 20% of regional emissions, and mining, which adds significantly to soil and water contamination, drive demand for remediation technologies. For instance, North America’s emphasis on adopting innovative methods like nanoremediation and AI-powered monitoring systems has led to over 30% of remediation projects integrating advanced technologies, solidifying its leadership.
Europe
Europe holds a 28% share of the global market, underscored by its commitment to sustainability and strict compliance with environmental directives such as the European Green Deal, which has allocated €1 trillion toward green initiatives by 2030. For instance, Germany, the UK, and France drive growth, with Germany alone addressing contamination across 300,000 brownfield sites. For instance, significant government funding supports large-scale remediation projects, including initiatives like the UK’s £600 million soil cleanup program. For instance, the region also emphasizes bioremediation techniques, which account for over 40% of its remediation projects, reflecting a strong preference for eco-friendly and sustainable solutions.
Asia-Pacific
The Asia-Pacific region is the fastest-growing market, capturing 23% of the global share in 2024. For instance, countries such as China, which invested $63 billion in environmental cleanup efforts in 2023, India, and Japan drive growth through rapid industrialization and urbanization. For instance, government initiatives, including India’s “Clean Ganga Project” with $4 billion allocated for river remediation, and China’s “Blue Sky” policies targeting air quality improvement, highlight strong commitments to environmental restoration. For instance, over 50% of regional projects utilize cutting-edge technologies like nanotechnology and IoT-based solutions, further amplifying growth.
Latin America
Latin America represents 9% of the market, with Brazil and Mexico leading regional initiatives. For instance, Brazil’s remediation projects are concentrated in the agriculture sector, addressing contamination from pesticide use that affects 20% of its arable land. For instance, Mexico’s oil and gas industry, contributing 18% of its GDP, drives demand for soil and water remediation solutions. For instance, limited technological infrastructure, with digital penetration below 40%, and funding constraints continue to pose challenges.
Middle East & Africa
The Middle East & Africa (MEA) accounts for the 5% of the market. For instance, growth is driven by oil and gas remediation projects, such as Saudi Arabia’s $500 million initiative to address contamination in petroleum production sites. For instance, the UAE’s adoption of green technologies in industrial sectors has led to a 25% increase in remediation efforts. For instance, however, infrastructural and economic limitations hinder broader adoption of advanced technologies in the region.
Key Player Analysis
- Clean Harbors
- Tetra Tech
- Jacobs
- AECOM
- URS Corporation
- Earth Tech
- Golder Associates
- Antea Group
- WSP
- Arcadis
Competitive Analysis:
The Environmental Remediation Technology market exhibits a moderately fragmented competitive landscape with several key players dominating regional markets. For instance, major companies like Clean Harbors Inc., AECOM, and Jacobs Solutions Inc. maintain significant market presence through technological innovation and strategic partnerships. For instance, the public sector dominates with a 68.5% market share, driven by regulatory compliance and environmental standards. For instance, leading companies are focusing on advanced remediation technologies and sustainable solutions to maintain competitive advantage. For instance, AECOM's DE-FLUORO technology launch in March 2021 demonstrates the industry's commitment to eco-friendly PFAS elimination, while Allonnia's breakthrough in May 2023 with their 1,4 D-Stroy solution achieved 99% degradation of contaminants in groundwater. For instance, the competitive landscape is further shaped by increasing private sector involvement, with companies investing in environmental remediation as part of their corporate social responsibility initiatives and sustainability goals.
Recent Developments:
- In May 2024 AECOM secured a five-year contract with the U.S. Army Environmental Command to provide environmental remediation services, focusing on per- and polyfluoroalkyl substances (PFAS) across various U.S. locations.
- In March 2023 AECOM introduced its Nature-Based Remediation (NBR) practice, emphasizing sustainable remediation methods that offer net benefits to human health and the environment.
- In May 2022 Arcadis launched the Thermal In-Situ Sustainable Remediation (TISR®) method, utilizing renewable energy sources like solar power to expedite subsurface remediation processes, thereby reducing costs and emissions.
- In April 2022 WSP released preliminary results on PFAS destruction in soil using ball milling technology, demonstrating effective PFAS degradation and offering a potential alternative to conventional remediation methods.
Market Concentration & Characteristics:
The Environmental Remediation Technology market exhibits a moderately fragmented structure, characterized by the presence of both global leaders and regional players offering specialized solutions. Established companies like Clean Harbors, Tetra Tech, and AECOM dominate the competitive landscape by leveraging extensive expertise, technological advancements, and a broad portfolio of services. These firms invest heavily in research and development to integrate innovative technologies such as nanoremediation, AI-powered systems, and sustainable practices. Regional players, on the other hand, focus on niche applications and cater to specific local environmental challenges. The market's competitive dynamics are shaped by stringent regulatory frameworks, increasing environmental awareness, and the growing demand for cost-effective and sustainable solutions. Strategic collaborations, acquisitions, and government partnerships are key strategies employed by major players to expand their footprint. The emphasis on technological differentiation and eco-friendly approaches further defines the market's characteristics and growth trajectory.
Report Coverage:
The research report offers an in-depth analysis based on Technology Type, Application, and Region. It details leading market players, providing an overview of their business, product offerings, investments, revenue streams, and key applications. Additionally, the report includes insights into the competitive environment, SWOT analysis, current market trends, as well as the primary drivers and constraints. Furthermore, it discusses various factors that have driven market expansion in recent years. The report also explores market dynamics, regulatory scenarios, and technological advancements that are shaping the industry. It assesses the impact of external factors and global economic changes on market growth. Lastly, it provides strategic recommendations for new entrants and established companies to navigate the complexities of the market.
Future Outlook:
- The adoption of advanced remediation technologies such as nanoremediation and bioremediation is expected to increase, driven by their cost-effectiveness and efficiency in addressing complex contamination issues.
- Integration of artificial intelligence (AI) and Internet of Things (IoT) in environmental monitoring and remediation processes will enhance precision and operational efficiency.
- The rising focus on sustainability and circular economy principles will drive the demand for eco-friendly remediation solutions globally.
- Governments worldwide are likely to increase funding and regulatory support for large-scale remediation projects to address growing environmental concerns.
- Emerging economies in Asia-Pacific, Latin America, and Africa will present untapped growth opportunities due to rapid industrialization and urbanization.
- Collaborative efforts between public and private sectors will accelerate innovation and expand the adoption of remediation technologies.
- Technological advancements, such as the use of renewable energy in remediation processes, will contribute to reducing the environmental footprint of these technologies.
- Growing public awareness about the harmful impacts of pollution will drive demand for remediation solutions in both developed and developing regions.
- Industries such as oil and gas, mining, and manufacturing will remain key drivers of market growth due to their significant environmental impacts.
- Expanding research and development efforts will lead to the introduction of more efficient and scalable remediation technologies, tailored to diverse environmental challenges.
Request a Free Sample
Fill in your details and we'll send you a free sample report.
- Sample data tables & charts
- Research methodology
Market Dynamics
Stringent Environmental Regulations
Governments worldwide are enforcing stricter environmental protection laws, compelling industries to remediate contaminated sites and comply with higher safety standards. This regulatory pressure is driving significant investments in advanced remediation technologies to meet compliance requirements.
Technological Advancements in Remediation
Innovations such as bioremediation, nanoremediation, and advanced oxidation processes are increasing the efficiency and effectiveness of environmental cleanup. These technologies enable the treatment of a broader range of contaminants, including emerging pollutants like pharmaceuticals and microplastics.
Industrial Expansion and Urbanization
Rapid industrialization and urban growth, especially in emerging economies, are leading to increased pollution and environmental degradation. This trend is fueling demand for remediation technologies to restore contaminated soil, water, and air in heavily industrialized and urbanized areas.
Integration of Digital Technologies (AI and IoT)
The adoption of artificial intelligence and IoT in remediation processes is enhancing site monitoring, predictive modeling, and process optimization. These digital innovations improve the precision and cost-effectiveness of remediation projects, making advanced solutions more attractive to both public and private sector clients.
Growing Focus on Sustainability and Green Technologies
There is a rising emphasis on sustainable and eco-friendly remediation solutions, such as bioremediation and renewable energy-powered processes. This shift is driven by public awareness, corporate social responsibility, and global initiatives to reduce the environmental footprint of industrial activities.
Need a Custom Version of This Report?
Tailor the scope, geography, or segments to your exact requirements.
- Custom geography or segment scope
- Direct access to our analyst team
Frequently Asked Questions
What is the current size of the Environmental Remediation Technology Market?
What factors are driving the growth of the Environmental Remediation Technology Market?
What are some challenges faced by the Environmental Remediation Technology Market?
Which segment is leading the market share?
Table of Content
Chapter 1 Market Segmentation
- 1.1 Segmentation Framework
- 1.1.1 Product and Service Classification
- 1.1.2 Application and End-Use Classification
- 1.1.3 Technology and Solution Classification
- 1.1.4 Customer and Distribution Channel Classification
- 1.1.5 Geographic Segmentation
- 1.1.6 Market Segment Definitions and Boundaries
- 1.2 By Application
- 1.2.1 Oil and Gas
- 1.2.2 Mining and Forestry
- 1.2.3 Waste Disposal Sites
- 1.2.4 Agriculture
- 1.2.5 Automotive
- 1.2.6 Others
- 1.3 By Technology Type
- 1.3.1 Thermal Desorption
- 1.3.2 Excavation or Dredging
- 1.3.3 Surfactant Enhanced Aquifer Remediation (SEAR)
- 1.3.4 Pump and Treat
- 1.3.5 Solidification and Stabilization
- 1.3.6 In Situ Oxidation
- 1.3.7 Soil Vapor Extraction
- 1.3.8 Bioremediation
- 1.3.9 Nanoremediation
Chapter 2 Introduction
- 2.1 Report Objectives and Scope
- 2.2 Product Definition and Industry Terminology
- 2.3 Market Inclusions and Exclusions
- 2.4 Research Process
- 2.4.1 Primary Research and Expert Interviews
- 2.4.2 Secondary Research and Source Review
- 2.4.3 Top-Down and Bottom-Up Estimation
- 2.4.4 Data Triangulation and Verification
- 2.5 Market Size Measurement Basis
- 2.5.1 2024: USD 116,505 million → 2024: USD 116,505 million
- 2.6 Historical and Forecast Reference Periods
- 2.6.1 Base Year: 2024
- 2.6.2 Forecast Period: 2024-2024
- 2.7 Research Assumptions and Limitations
Chapter 3 Executive Summary
- 3.1 Market Snapshot and Key Findings
- 3.2 Base-Year Market Size, 2024
- 3.3 Forecast Market Size, 2024
- 3.4 Revenue and Volume Growth Outlook
- 3.5 Key Demand and Supply Indicators
- 3.6 Leading Market Segments
- 3.7 Fastest-Growing Market Opportunities
- 3.8 Regional Performance Highlights
- 3.9 Technology and Industry Transformation
- 3.10 Competitive Landscape Summary
- 3.11 Analyst View and Strategic Implications
Chapter 4 Global Environmental Remediation Technology Market Trends and Developments
- 4.1 Historical Industry Development
- 4.2 Recent Market Trends and Developments
- 4.3 Demand and Customer Behavior Trends
- 4.4 Technology and Product Innovation
- 4.5 Artificial Intelligence, Automation and Digitalization
- 4.6 Local Manufacturing and Supply Chain Realignment
- 4.7 Industry Partnerships, Mergers and Acquisitions
- 4.8 Sustainability and Circular Economy Developments
- 4.9 Government and Private Sector Investment Trends
- 4.10 Emerging Business Models and Commercialization
- 4.11 Industry Developments and Announcements
Chapter 5 Global Environmental Remediation Technology Market Production, Supply and Demand Analysis
- 5.1 Demand Trend and Consumption Analysis
- 5.2 Demand Forecast, 2024-2024
- 5.3 Production and Output Trend
- 5.4 Production and Output Forecast, 2024-2024
- 5.5 Installed Capacity and Capacity Utilization
- 5.6 Company-Wise Production Plants and Statistics
- 5.6.1 Installed Production Capacity
- 5.6.2 Actual Production
- 5.6.3 Planned Capacity and Expansion Targets
- 5.7 Supply Chain Structure and Procurement Trends
- 5.8 Supply-Demand Gap and Bottlenecks
- 5.9 Import Dependence and Sourcing Structure
- 5.10 Contract Manufacturing and Outsourcing
- 5.11 Regional Supply and Demand Concentration
Chapter 6 Global Environmental Remediation Technology Market Pricing Analysis
- 6.1 Pricing Structure and Measurement
- 6.2 Historical Pricing Trends
- 6.3 Pricing Outlook, 2024-2024
- 6.4 Average Selling Price and Unit Economics
- 6.5 Pricing by Product and Market Segment
- 6.6 Geographic Pricing Differences
- 6.7 Key Input, Energy, Labor and Logistics Costs
- 6.8 Contract Pricing and Purchasing Models
- 6.9 Pricing Sensitivity and Competitive Positioning
- 6.10 Price, Margin and Profitability Implications
Chapter 7 Global Environmental Remediation Technology Market Dynamics
- 7.1 Market Growth Drivers
- 7.1.1 Demand-Side Drivers
- 7.1.2 Technology and Innovation Drivers
- 7.1.3 Infrastructure and Investment Drivers
- 7.1.4 Regulatory and Policy Drivers
- 7.2 Market Restraints
- 7.2.1 Cost and Affordability Constraints
- 7.2.2 Technology and Adoption Barriers
- 7.2.3 Supply Chain and Operational Constraints
- 7.3 Market Challenges
- 7.3.1 Competitive Pressure and Margin Erosion
- 7.3.2 Skills, Infrastructure and Implementation Gaps
- 7.4 Emerging Market Opportunities
- 7.5 Market Dynamics Impact and Time-Horizon Assessment
Chapter 8 Global Environmental Remediation Technology Value Chain Analysis
- 8.1 Industry Value Chain Overview
- 8.2 Upstream Suppliers and Critical Inputs
- 8.3 Technology and Component Providers
- 8.4 Manufacturing or Service Delivery
- 8.5 Distribution, Channel Partners and Integrators
- 8.6 Downstream Applications and End Users
- 8.7 Value Addition and Profit Pools
- 8.8 Vertical Integration and Outsourcing
- 8.9 Supplier Concentration and Risk
- 8.10 Supply Chain Localization and Resilience
Chapter 9 Global Environmental Remediation Technology Market Regulations and Policies
- 9.1 Relevant Laws, Standards and Compliance Frameworks
- 9.2 Product, Service, Safety and Quality Requirements
- 9.3 Government Policies, Incentives and Subsidies
- 9.4 Imports, Exports and Trade Barriers
- 9.5 Public Procurement and Local Content Requirements
- 9.6 Environmental and Sustainability Compliance
- 9.7 Upcoming Policy Changes and Market Implications
Chapter 10 Global Environmental Remediation Technology Market Hotspots and Opportunities
- 10.1 Market Opportunity Mapping and Growth Hotspots
- 10.2 High-Growth Applications and Customer Groups
- 10.3 Underserved Markets and White-Space Opportunities
- 10.4 Emerging Technology and Product Opportunities
- 10.5 New Capacity and Investment Hotspots
- 10.6 Market Entry and Expansion Opportunities
- 10.7 Distribution and Partnership Opportunities
- 10.8 Near-Term and Long-Term Commercial Potential
- 10.9 Opportunity Attractiveness and Execution Risks
Chapter 11 Global Environmental Remediation Technology Market Outlook, 2024-2024
- 11.1 Market Size and Analysis
- 11.1.1 Revenue (Market Measurement: 2024: USD 116,505 million → 2024: USD 116,505 million)
- 11.1.2 Market Volume and Quantity Sold
- 11.1.3 Historical Market Size
- 11.1.4 Base-Year Market Size, 2024
- 11.2 Market Forecast, 2024-2024
- 11.2.1 Revenue Forecast to 2024
- 11.2.2 Volume Forecast to 2024
- 11.2.3 CAGR and Year-on-Year Growth
- 11.2.4 Incremental Revenue Opportunity
- 11.3 Forecast Assumptions and Scenario Analysis
- 11.3.1 Base-Case Forecast
- 11.3.2 Optimistic and Conservative Scenarios
- 11.3.3 Technology, Pricing and Policy Sensitivities
- 11.4 Market Attractiveness and Growth Outlook
Chapter 12 Global Environmental Remediation Technology Market Segmentation and Outlook
- 12.1 Segmentation Summary and Market Shares, 2024
- 12.2 Largest and Fastest-Growing Segments
- 12.3 By Application - Market Size and Forecast, 2024-2024
- 12.3.1 Segment Definition and Scope
- 12.3.2 Historical Market Size
- 12.3.3 Revenue Forecast, 2024-2024
- 12.3.4 Volume Forecast, 2024-2024
- 12.3.5 Base-Year Market Share, 2024
- 12.3.6 Segment CAGR and Growth Drivers
- 12.3.7 Subsegment Market Size and Forecast
- 12.3.7.1 Oil and Gas
- 12.3.7.2 Mining and Forestry
- 12.3.7.3 Waste Disposal Sites
- 12.3.7.4 Agriculture
- 12.3.7.5 Automotive
- 12.3.7.6 Others
- 12.3.8 Subsegment Pricing and Adoption Trends
- 12.3.9 Leading Suppliers and Competition
- 12.3.10 Regional Demand and Opportunities
- 12.4 By Technology Type - Market Size and Forecast, 2024-2024
- 12.4.1 Segment Definition and Scope
- 12.4.2 Historical Market Size
- 12.4.3 Revenue Forecast, 2024-2024
- 12.4.4 Volume Forecast, 2024-2024
- 12.4.5 Base-Year Market Share, 2024
- 12.4.6 Segment CAGR and Growth Drivers
- 12.4.7 Subsegment Market Size and Forecast
- 12.4.7.1 Thermal Desorption
- 12.4.7.2 Excavation or Dredging
- 12.4.7.3 Surfactant Enhanced Aquifer Remediation (SEAR)
- 12.4.7.4 Pump and Treat
- 12.4.7.5 Solidification and Stabilization
- 12.4.7.6 In Situ Oxidation
- 12.4.7.7 Soil Vapor Extraction
- 12.4.7.8 Bioremediation
- 12.4.7.9 Nanoremediation
- 12.4.8 Subsegment Pricing and Adoption Trends
- 12.4.9 Leading Suppliers and Competition
- 12.4.10 Regional Demand and Opportunities
- 12.5 Segment Growth Comparison
- 12.6 Segment Attractiveness and Priority Matrix
Chapter 13 Global Environmental Remediation Technology End-Use and Application Market Outlook
- 13.1 End-Use Industry and Customer Demand Structure
- 13.2 Leading Applications and Customer Groups
- 13.3 End-Use Market Size, Share and Forecast
- 13.4 Major End-Use Industry Deep Dives
- 13.4.1 Customer Requirements and Use Cases
- 13.4.2 Demand and Replacement Cycles
- 13.4.3 Technical and Regulatory Considerations
- 13.4.4 Purchasing and Procurement Models
- 13.4.5 Leading Vendors and Distribution Channels
- 13.4.6 Forecast and Commercial Opportunities
- 13.5 Emerging Applications and Cross-Segment Demand
- 13.6 End-Use Industry Investment Priorities
Chapter 14 Global Environmental Remediation Technology Geographic Market Outlook, 2024-2024
- 14.1 Regional Market Size and Share, 2024
- 14.2 Regional Market Forecast, 2024-2024
- 14.3 Regional Pricing, Production and Demand Differences
- 14.4 North America
- 14.4.1 United States
- 14.4.2 Canada
- 14.4.3 Mexico
- 14.5 Europe
- 14.5.1 Germany
- 14.5.2 France
- 14.5.3 Italy
- 14.5.4 United Kingdom
- 14.5.5 Spain
- 14.5.6 Poland
- 14.5.7 Russia
- 14.5.8 Netherlands
- 14.5.9 Belgium
- 14.5.10 Sweden
- 14.5.11 Denmark
- 14.5.12 Norway
- 14.5.13 Rest of Europe
- 14.6 Asia Pacific
- 14.6.1 China
- 14.6.2 India
- 14.6.3 Japan
- 14.6.4 South Korea
- 14.6.5 Thailand
- 14.6.6 Indonesia
- 14.6.7 Vietnam
- 14.6.8 Malaysia
- 14.6.9 Australia
- 14.6.10 Rest of Asia Pacific
- 14.7 Latin America
- 14.7.1 Brazil
- 14.7.2 Argentina
- 14.7.3 Colombia
- 14.7.4 Chile
- 14.7.5 Rest of Latin America
- 14.8 Middle East
- 14.8.1 Saudi Arabia
- 14.8.2 United Arab Emirates
- 14.8.3 Turkey
- 14.8.4 Israel
- 14.8.5 Iran
- 14.8.6 Rest of the Middle East
- 14.9 Africa
- 14.9.1 South Africa
- 14.9.2 Egypt
- 14.9.3 Nigeria
- 14.9.4 Morocco
- 14.9.5 Rest of Africa
- 14.10 Regional Investment, Policy and Supply Chain Differences
- 14.11 Regional Competitive Landscape
- 14.12 Geographic Growth Hotspots
Chapter 15 Global Environmental Remediation Technology Technology, Innovation and Sustainability Outlook
- 15.1 Technology Landscape and Maturity
- 15.2 Product, Process and Service Innovation
- 15.3 AI, Automation and Digital Tools in the Industry
- 15.4 Technology Adoption and Performance Benchmarking
- 15.5 Innovation Pipeline and R&D Investment
- 15.6 Patent and Intellectual Property Trends
- 15.7 Energy Efficiency and Resource Management
- 15.8 Sustainability, Recycling and Circularity
- 15.9 Technology Roadmap, 2024-2024
- 15.10 Risks of Obsolescence and Technology Substitution
Chapter 16 Global Environmental Remediation Technology Market Key Strategic Imperatives
- 16.1 Growth and Market Entry Priorities
- 16.2 High-Return Products and Segments
- 16.3 Pricing, Profitability and Cost Optimization
- 16.4 Technology Investment and Product Differentiation
- 16.5 Supply Chain Localization and Resilience
- 16.6 Distribution and Customer Acquisition
- 16.7 Partnership, Acquisition and Capacity Strategy
- 16.8 Regional Expansion Priorities
- 16.9 Short-, Medium- and Long-Term Actions
Chapter 17 Competition Outlook
- 17.1 Industry Competition Characteristics
- 17.2 Market Structure and Concentration
- 17.3 Market Share and Competitive Positioning, 2024
- 17.4 Company-Wise Revenue and Product Benchmarking
- 17.5 Production and Service Capacity Benchmarking
- 17.6 Technology, Pricing and Differentiation
- 17.7 Regional Footprint and Distribution Strength
- 17.8 Mergers, Acquisitions and Strategic Alliances
- 17.9 New Entrants and Competitive Threats
- 17.10 Porter's Five Forces and Industry Attractiveness
- 17.11 Competitive Outlook, 2024-2024
Chapter 18 Company Profiles
- 18.1 Company Coverage and Selection Criteria
- 18.2 Clean Harbors
- 18.2.1 Business Description
- 18.2.2 Company Ownership and Geographic Presence
- 18.2.3 Product and Service Portfolio
- 18.2.4 Manufacturing and Operating Footprint
- 18.2.5 Production Capacity and Expansion Plans
- 18.2.6 Financial Performance and Investment
- 18.2.7 Market Share and Competitive Position
- 18.2.8 Technology and Innovation Capabilities
- 18.2.9 Strategic Alliances or Partnerships
- 18.2.10 Recent Developments
- 18.2.11 Growth Strategy and Outlook
- 18.3 Tetra Tech
- 18.4 Jacobs
- 18.5 AECOM
- 18.6 URS Corporation
- 18.7 Earth Tech
- 18.8 Golder Associates
- 18.9 Antea Group
- 18.10 WSP
- 18.11 Arcadis
- 18.12 Other Relevant Market Participants
Note: Every listed company is profiled on the structure shown under the first company. The company list is preliminary and may change based on research findings, market developments, data availability and client requirements.
Chapter 19 Disclaimer
- 19.1 Research and Forecast Disclaimer
- 19.2 Data Source and Estimation Limitations
Note: The depth of individual sections depends on data availability for this market. Volume, capacity, trade and other unit-based metrics are included where applicable.

