Household support transfers carry most of the value moved
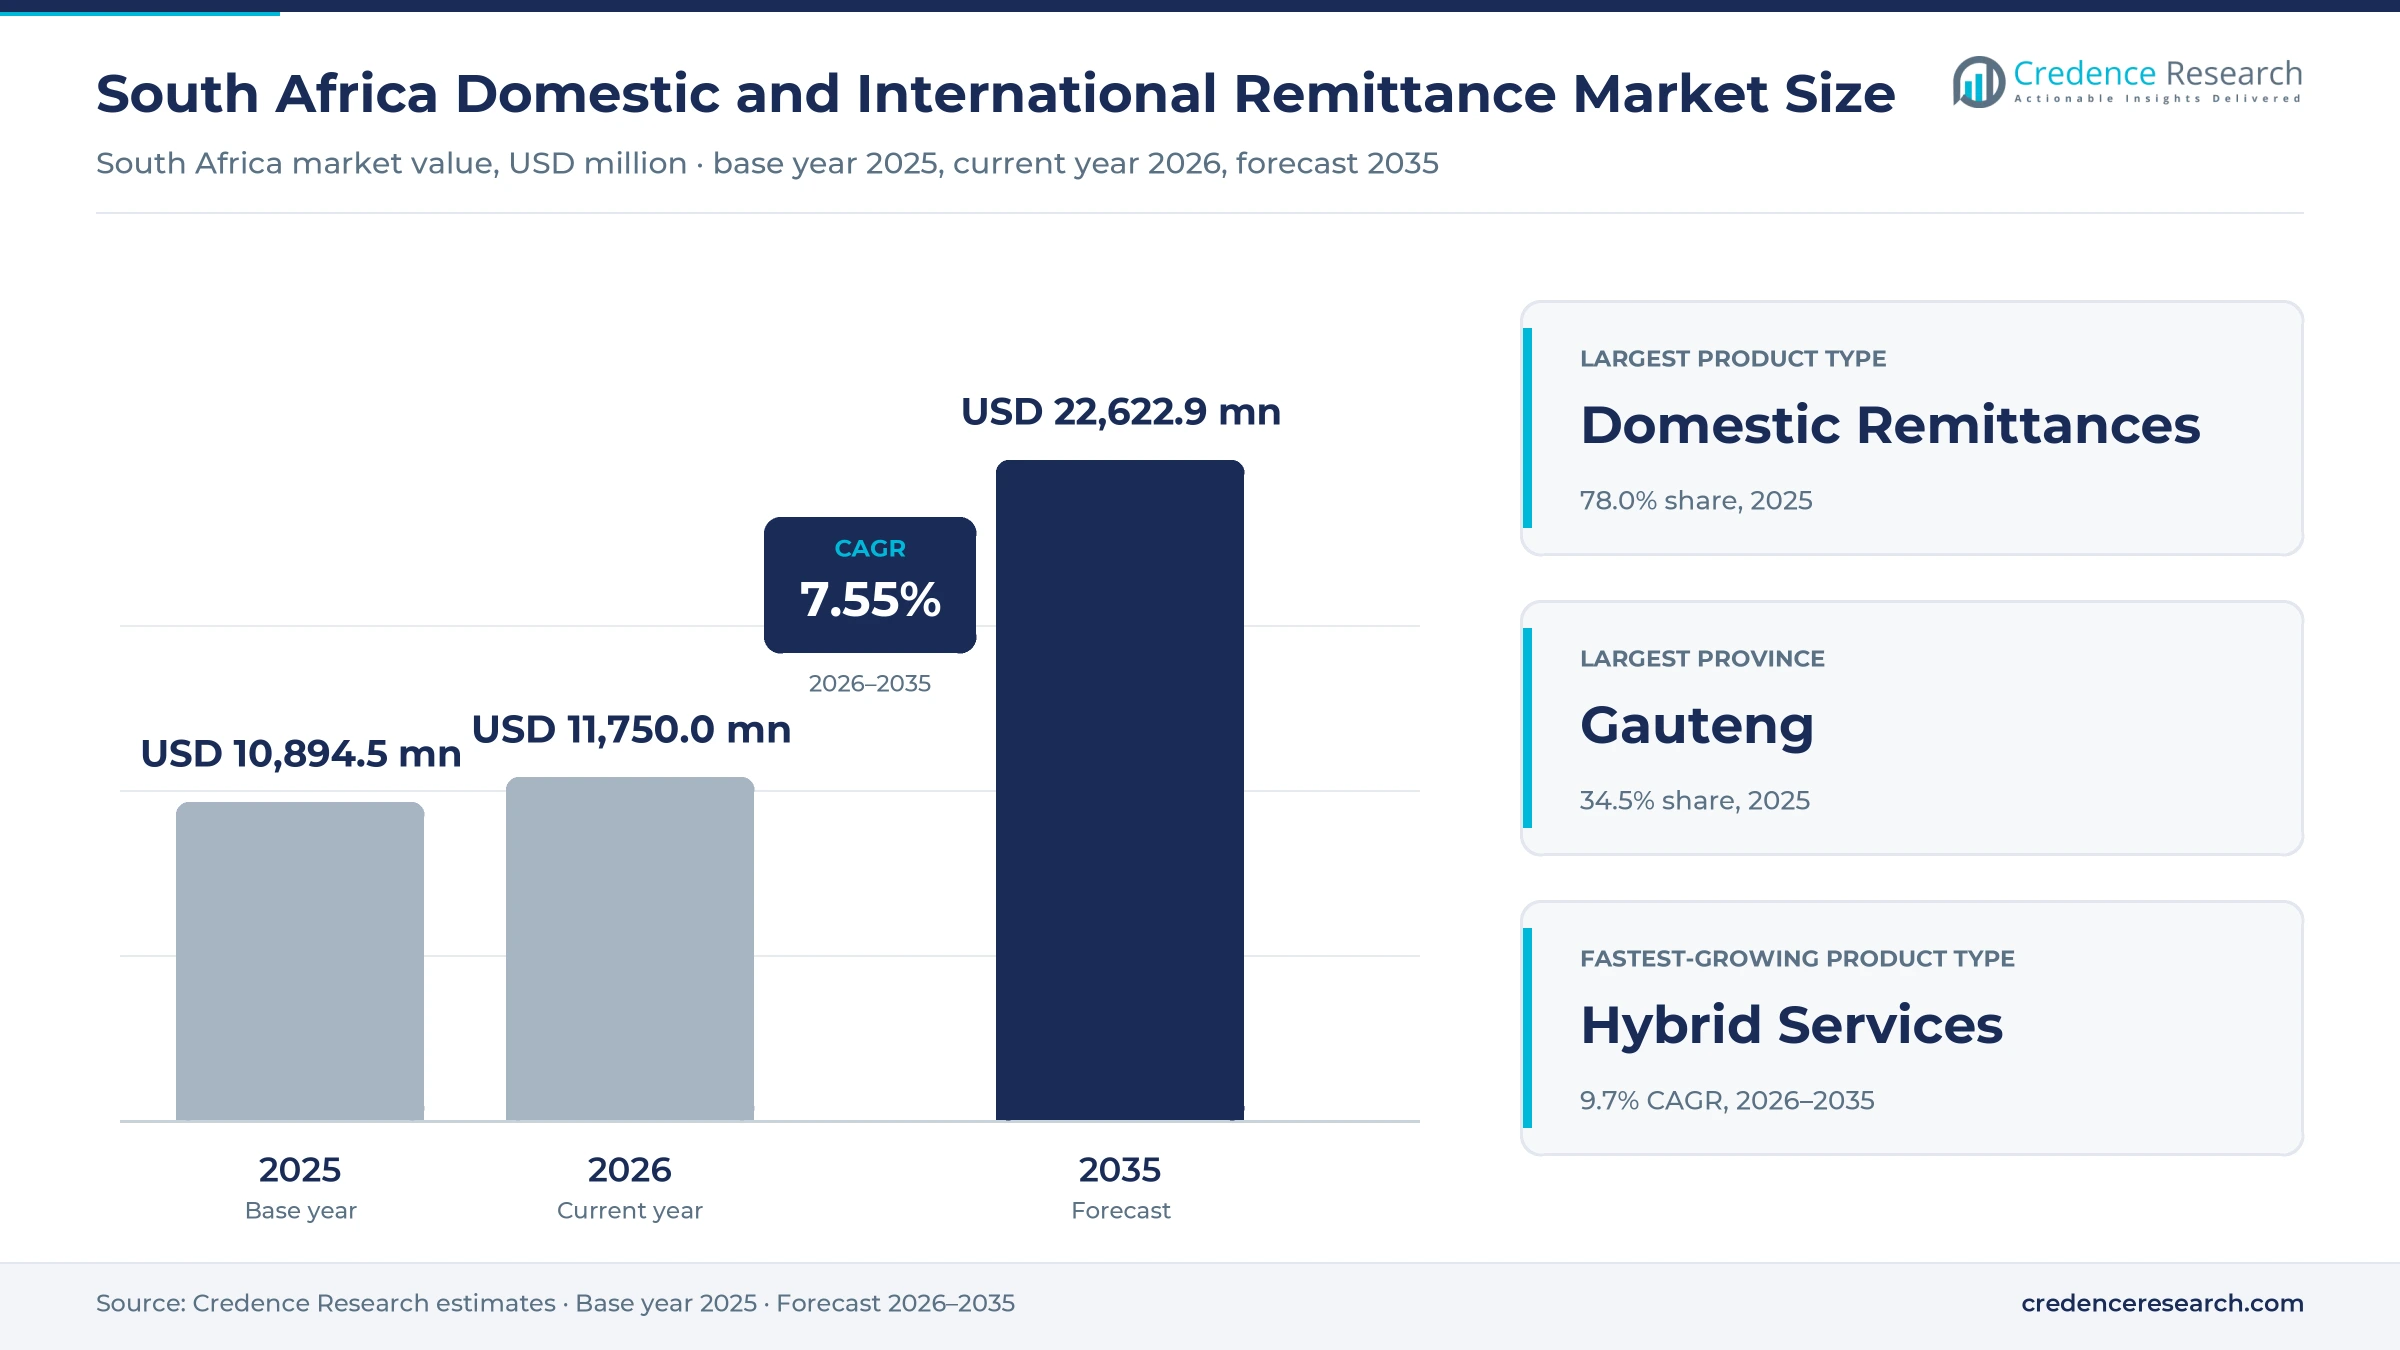
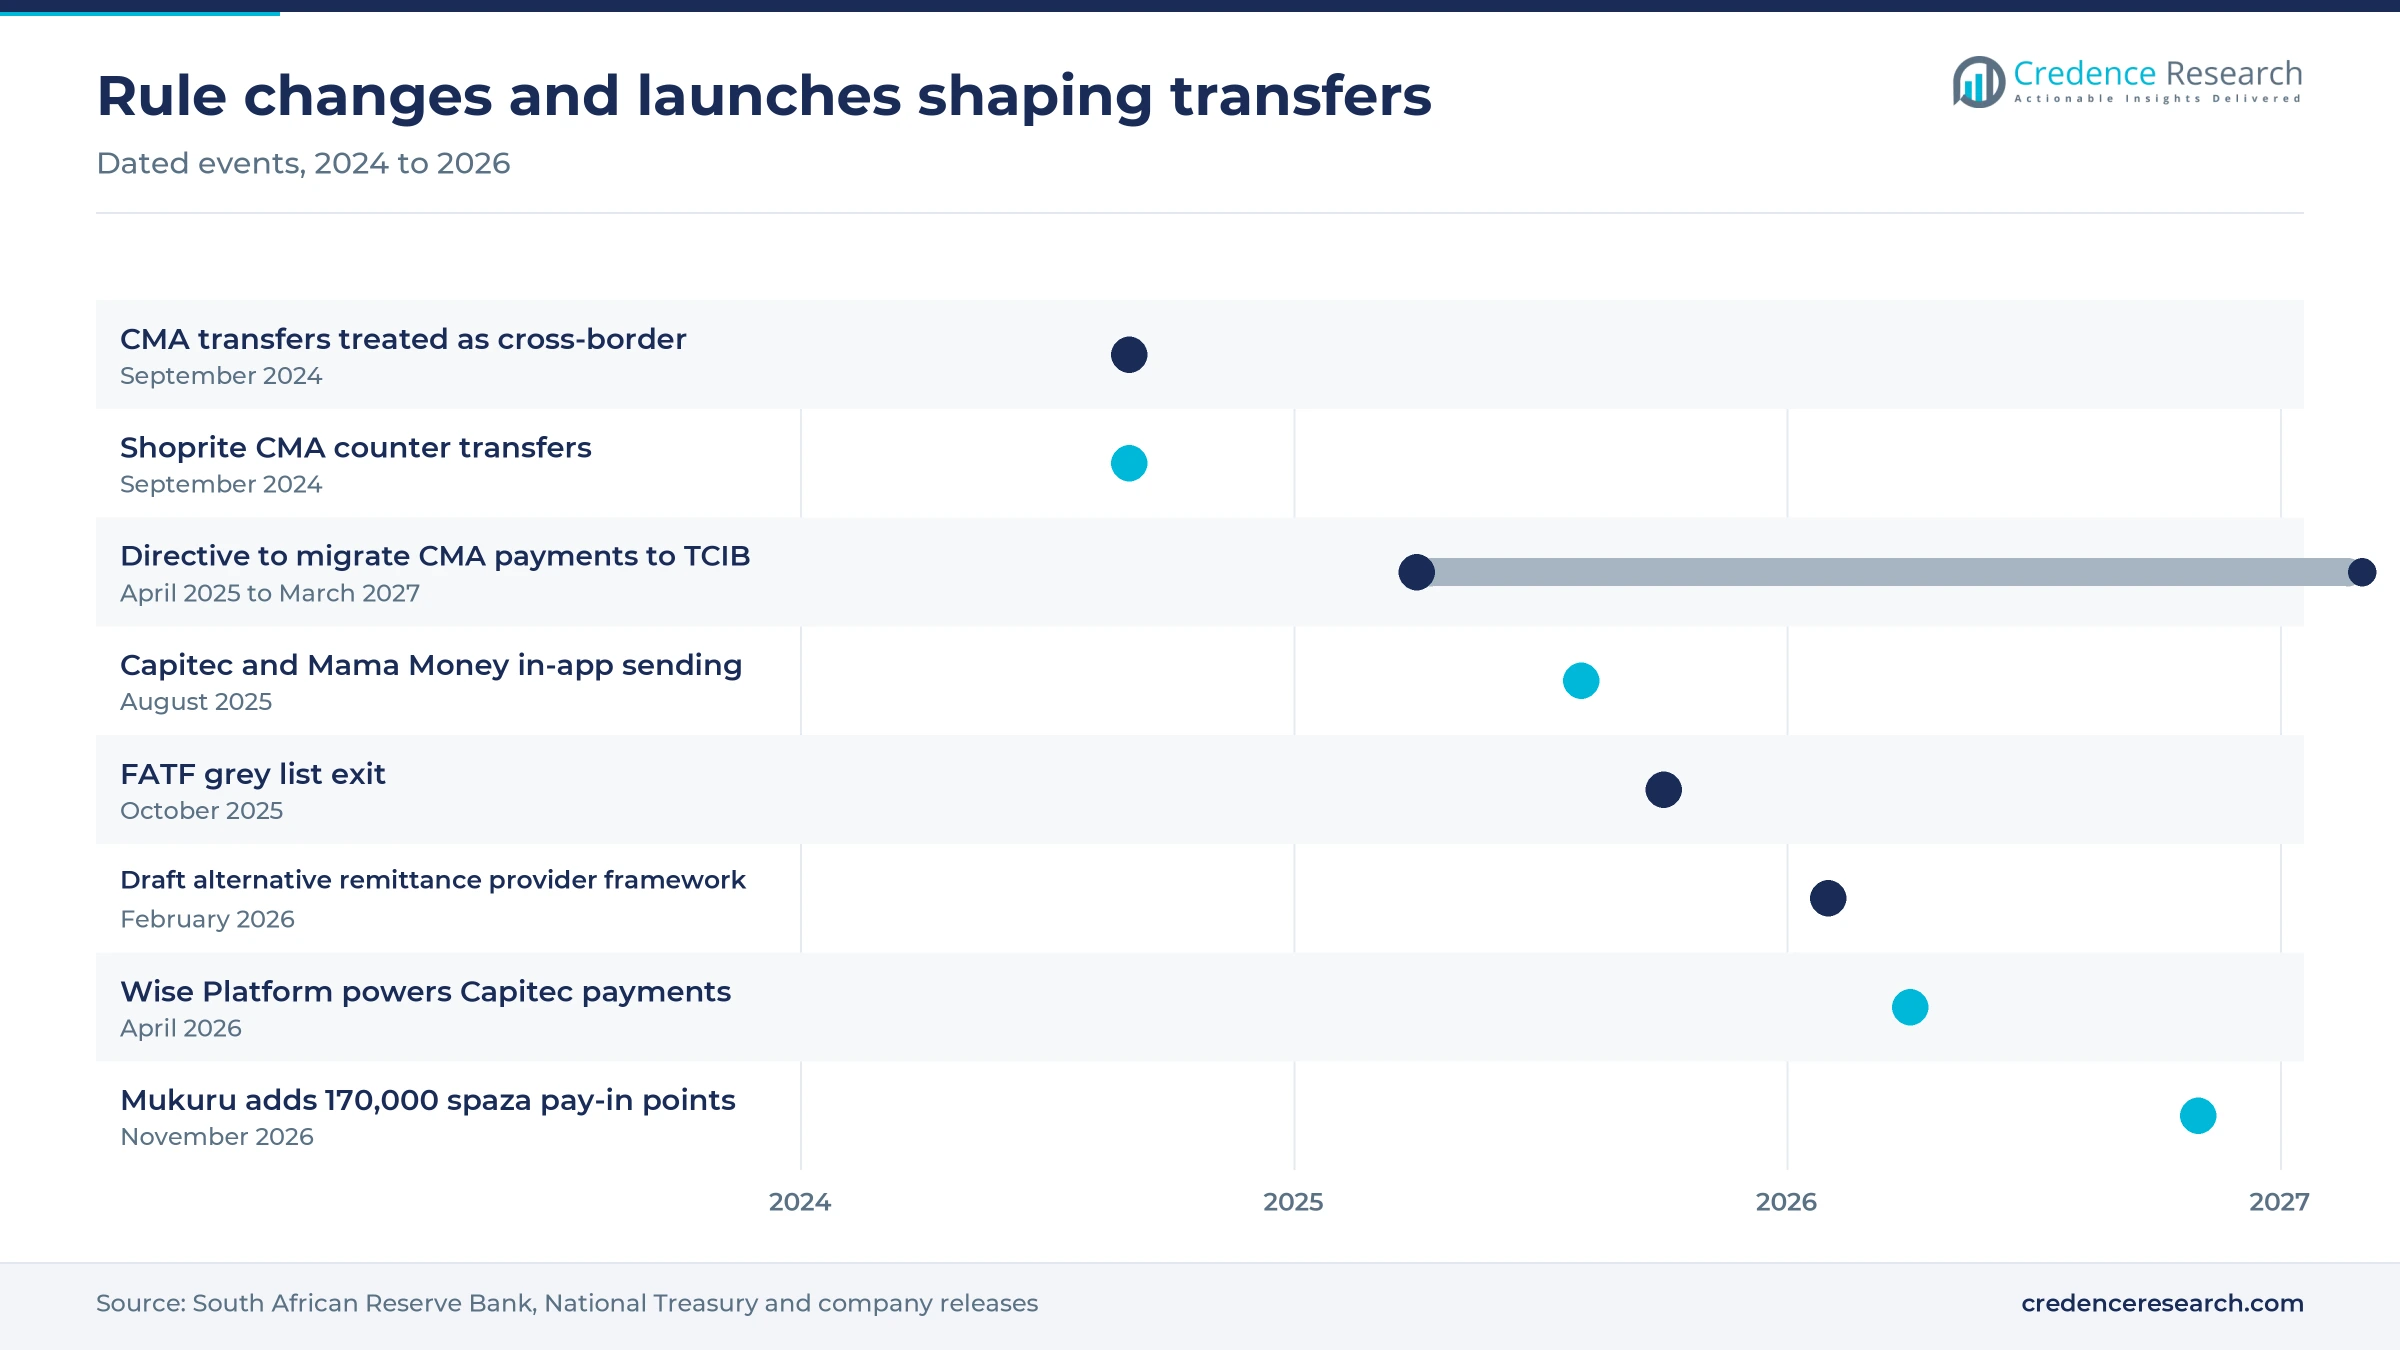
The South Africa domestic and international remittance market was valued at USD 10.89 billion in 2025 and is projected to increase from USD 11.75 billion in 2026 to USD 22.62 billion by 2035, registering a CAGR of 7.55% during 2026–2035. These values measure the money customers move, not the fees providers earn from it. Demand comes mainly from workers who send part of each wage to family in another province, and from about 2.4 million immigrants counted in Census 2022 who support households across the region. Gauteng held the largest single provincial share, 34.5% in 2025, while the six provinces outside Gauteng, the Western Cape and KwaZulu-Natal together accounted for 35.1%. Western Cape is the fastest-growing province at 8.0% a year. The most significant regulatory change came on Sept. 30, 2024, when the Reserve Bank began treating low-value transfers within the Common Monetary Area as cross-border payments, with stricter customer checks.
Which transfers make up South African remittance value?
This report sizes the domestic and international remittance flows of South Africa, meaning the U.S. dollar value of personal transfers to family and dependants that are sent within South Africa, sent from South Africa abroad or received from abroad each year. It covers transfers between provinces, transfers from South Africa to other countries, money received from abroad and retail services that work on both sides of a border. Bank voucher products, retail counter transfers, licensed operator apps and digital wallets are all included, whichever institution carries the payment.
General payments for goods, rent and salaries are excluded, even when they move through the same instant payment rails, because their purpose is commercial rather than household support. Business remittances, investment flows and hand-carried cash are also excluded. Provider revenue is a small fraction of the value shown, since customers pay a flat fee on local transfers and a fee plus an exchange margin on cross-border ones.
South Africa Domestic and International Remittance Market Insights
- South African remittance value was USD 10.89 billion in 2025 and is forecast to reach USD 22.62 billion by 2035, growing at 7.55% a year during 2026–2035.
- Gauteng held 34.5% of 2025 transfer value, the largest single province, while Western Cape grows fastest at 8.0% a year.
- Domestic Remittances made up 78.0% of 2025 value, because most transfers move wages from urban provinces to rural households.
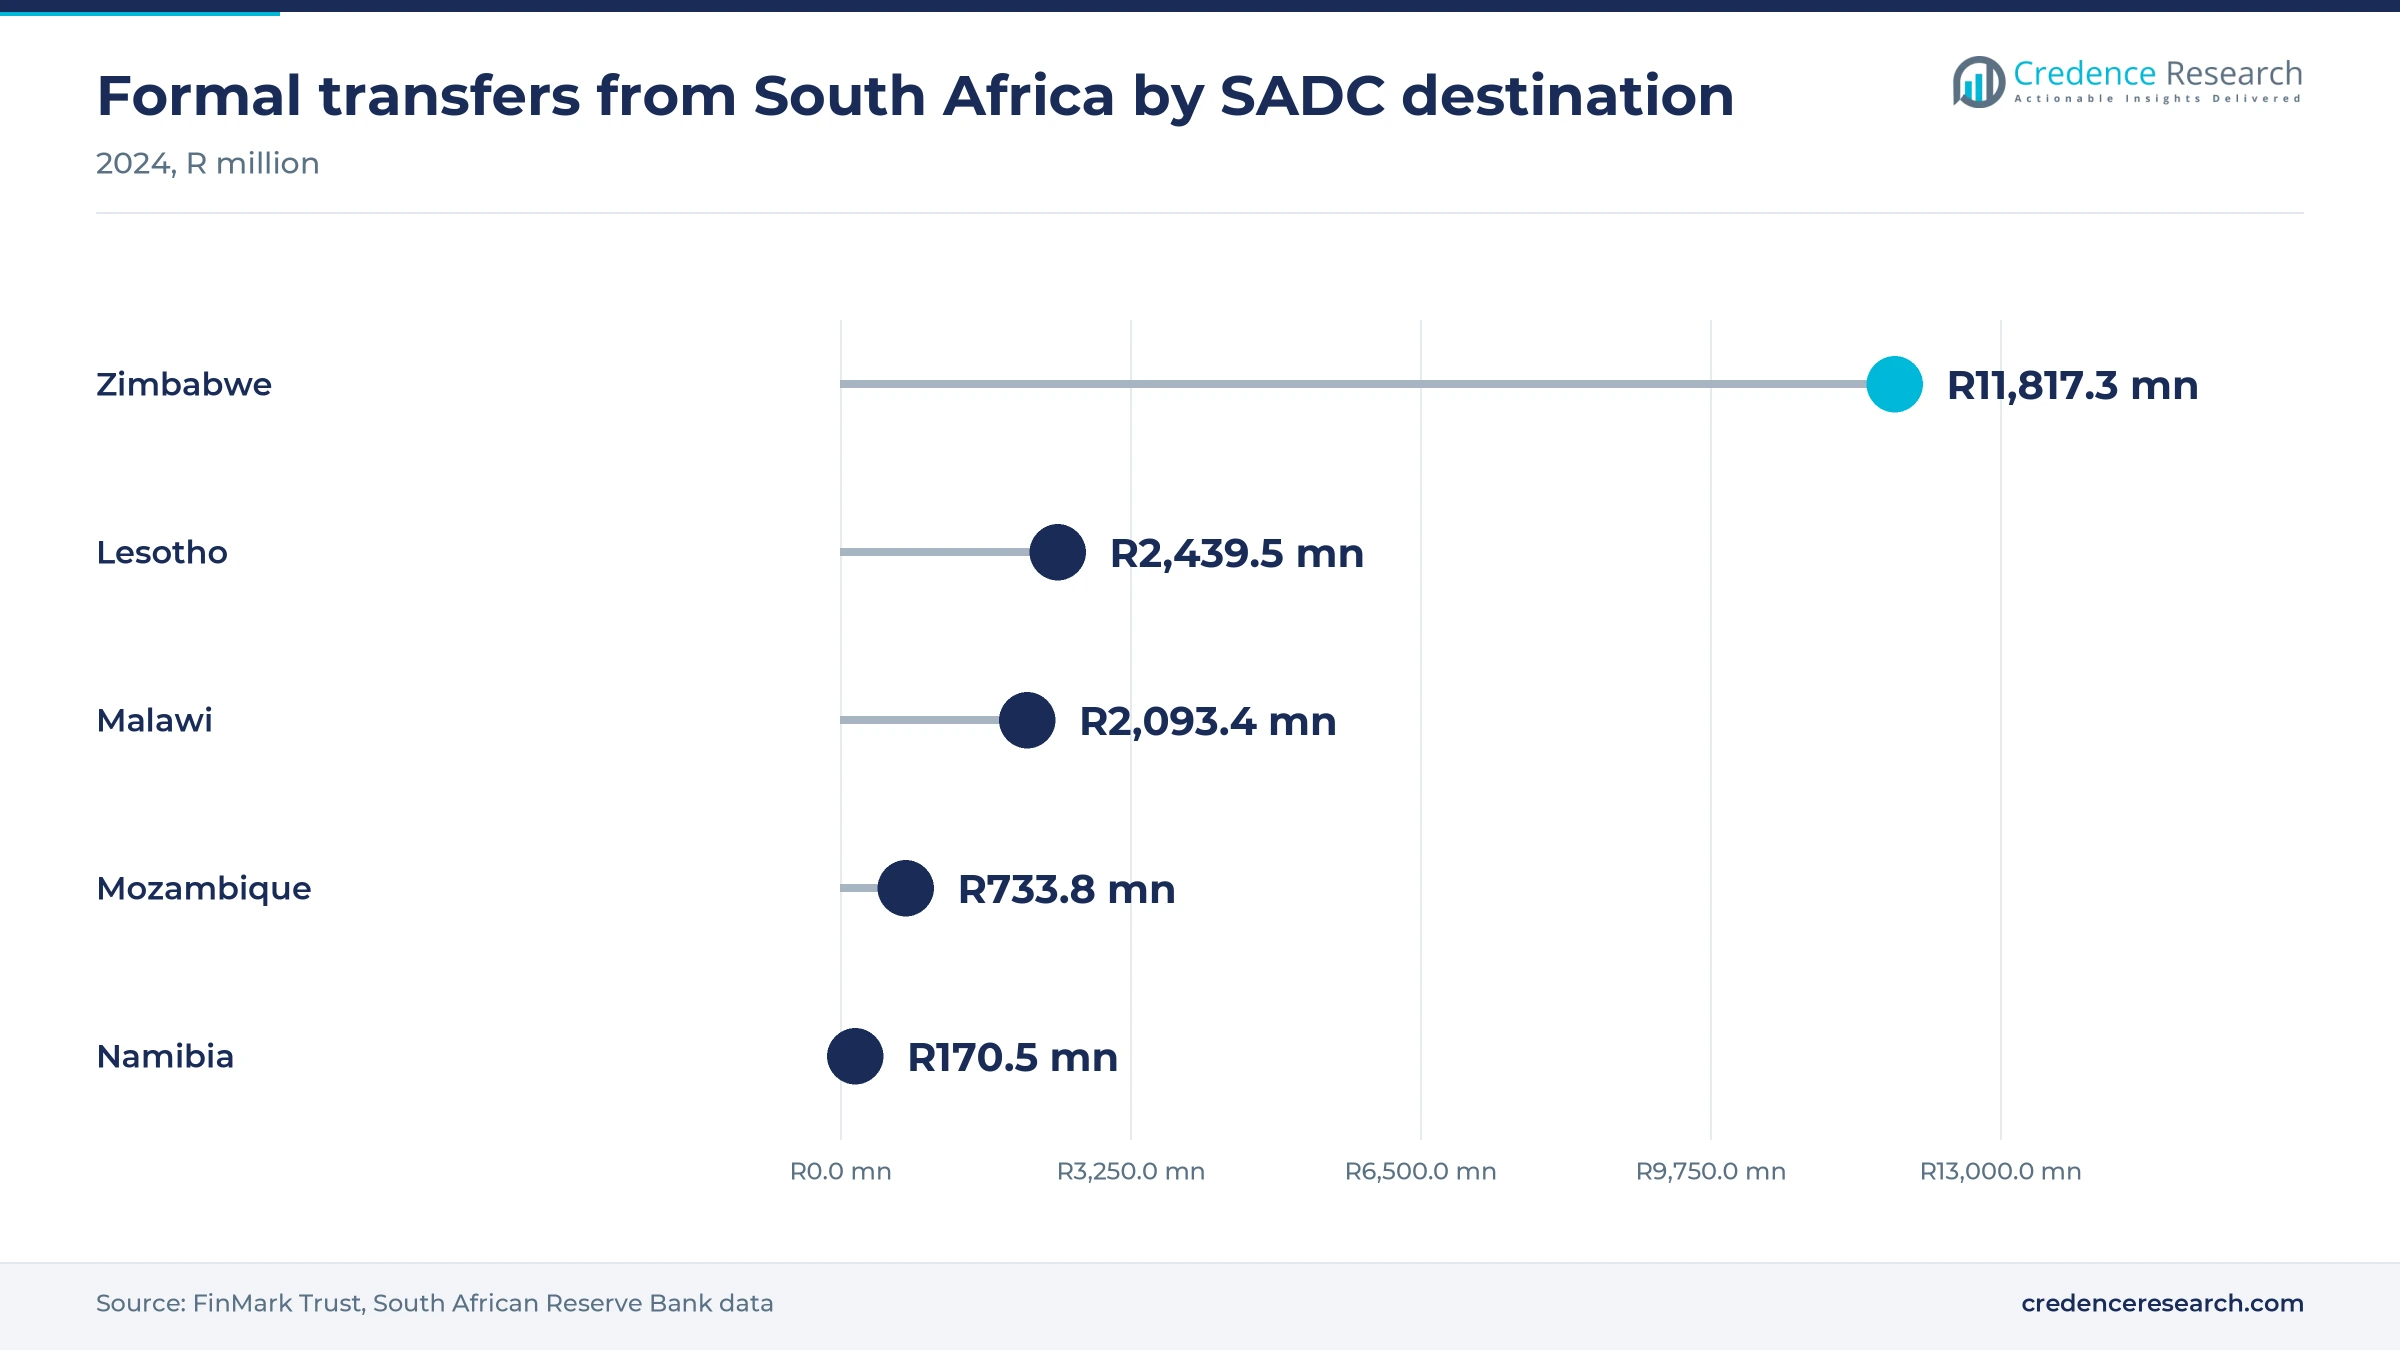
- FinMark Trust reported that formal transfers from South Africa to other SADC countries rose from about R6 billion in 2016 to R19.4 billion in 2024.
- Mukuru added 170,000 cash pay-in points in spaza shops through Flash in November 2026, bringing formal sending closer to cash-paid workers.
Domestic transfers lead while hybrid services grow fastest
Why do domestic transfers carry most of the value?
Based on product type, the market is categorized into domestic remittances, international outbound remittances, international inbound remittances and hybrid domestic-cross-border remittance services. Domestic Remittances led with 78.0% of 2025 value, because a 2016 TechnoServe study, the latest national survey, found that 41.5% of adults had sent money within the country, while FinMark Trust recorded formal transfers to SADC countries of R19.4 billion in 2024. The domestic value is a Credence Research estimate scaled from that survey, so it is less certain than recorded cross-border flows. Hybrid Domestic-Cross-Border Remittance Services grow fastest at 9.7% a year as Shoprite opened transfers to Lesotho and Eswatini at more than 1,400 Money Market counters in September 2024.
Which senders and receivers account for the most value?
Based on customer segment, the market is categorized into internal migrant households, foreign migrant workers in South Africa, South African diaspora-linked households, and students and temporary workers. Internal Migrant Households led with 70.0% of 2025 value because the same TechnoServe study counted 24.3 million people who send or receive domestic remittances, and 47% of them do both. Those flows follow workers who moved to cities while dependants stayed behind. Foreign Migrant Workers in South Africa grow fastest at 8.8% a year as FinMark Trust estimated 3.86 million SADC migrants living in South Africa, up from 3.7 million in its 2018 estimate.
How do senders reach the people they support?
Based on distribution channel, the market is categorized into bank apps and online banking, ADLA and MTO digital platforms, retail agent networks and branch and assisted cash counters. Bank Apps and Online Banking led with 46.0% of 2025 value because TechnoServe found that banks carry about half of domestic transfers. TechCentral reported that more than 90% of FNB eWallet users were already on WhatsApp when the bank moved the wallet onto that channel in March 2026. ADLA and MTO Digital Platforms grow fastest at 9.8% a year as Mukuru and MoneyGram connected their networks in September 2025 through an integration that customers reach through money transfer apps, WhatsApp, USSD and web.
Which institutions carry the largest share of value?
Based on institution type, the market is categorized into commercial banks, ADLAs and independent MTOs, retail-led money transfer providers, and digital wallet and fintech operators. Commercial Banks led with 55.0% of 2025 value because banks run the main cash voucher products, and Standard Bank says its customers complete 169% more Instant Money transactions a month than five years ago. Absa CashSend vouchers can also be collected at Pick n Pay, Boxer and Shoprite tills. Digital Wallet and Fintech Operators grow fastest at 10.1% a year as Mukuru launched a transactional account and Mastercard card in October 2026, with Bank Zero as sponsor bank.
| Segment Group | Leading Sub-segment | Share, 2025 | Fastest-growing Sub-segment | CAGR, 2026–2035 |
|---|---|---|---|---|
| By Product Type | Domestic Remittances | 78.0% | Hybrid Domestic-Cross-Border Remittance Services | 9.7% |
| By Customer Segment | Internal Migrant Households | 70.0% | Foreign Migrant Workers in South Africa | 8.8% |
| By Distribution Channel | Bank Apps and Online Banking | 46.0% | ADLA and MTO Digital Platforms | 9.8% |
| By Institution Type | Commercial Banks | 55.0% | Digital Wallet and Fintech Operators | 10.1% |
Flat local fees contrast with cross-border percentage fees
Pricing for South African transfers splits sharply by the direction of the payment. Domestic voucher and counter transfers carry flat fees of about R10 to R25, which makes them cheap for wage-sized amounts and leaves providers competing on reach rather than price. Cross-border transfers are priced as a percentage plus an exchange margin, and South Africa remains the costliest G20 country to send from, according to the World Bank. That gap is the main reason bank apps and digital operators can win share abroad, since a lower fee on a typical monthly amount is visible to the sender. Margins sit in cross-border spreads, while local transfers are a volume business.
| Service | Typical price or fee | Basis |
|---|---|---|
| Standard Bank Instant Money voucher from bank channels | R10 for R50 to R499, R15 for R500 to R999, R19 for R1,000 to R5,000 | Standard Bank pricing guide, 2025 |
| Instant Money voucher created at a retailer | R9.95 per voucher | Standard Bank pricing guide, 2025 |
| Checkers and Shoprite domestic money transfer | R9.99 per transaction, up to R5,000 a day | Checkers, accessed November 2026 |
| Shoprite transfer to Lesotho or Eswatini | R25 to send, no charge on collection | Shoprite Holdings, September 2024 |
| Mama Money transfer to Zimbabwe | R50 on R1,000 (5%), R250 on R10,000 (2.5%) | Mama Money, accessed November 2026 |
| Average cost of sending USD 200 from South Africa | 10.8% in Q4 2024, against a 6.26% global average | World Bank Remittance Prices Worldwide, Q4 2024 |
Request a Free Sample
Fill in your details and we'll send you a free sample report.
- Sample data tables & charts
- Research methodology
Instant rails and formal channels lift recorded transfers
Expansion of real-time digital payment rails
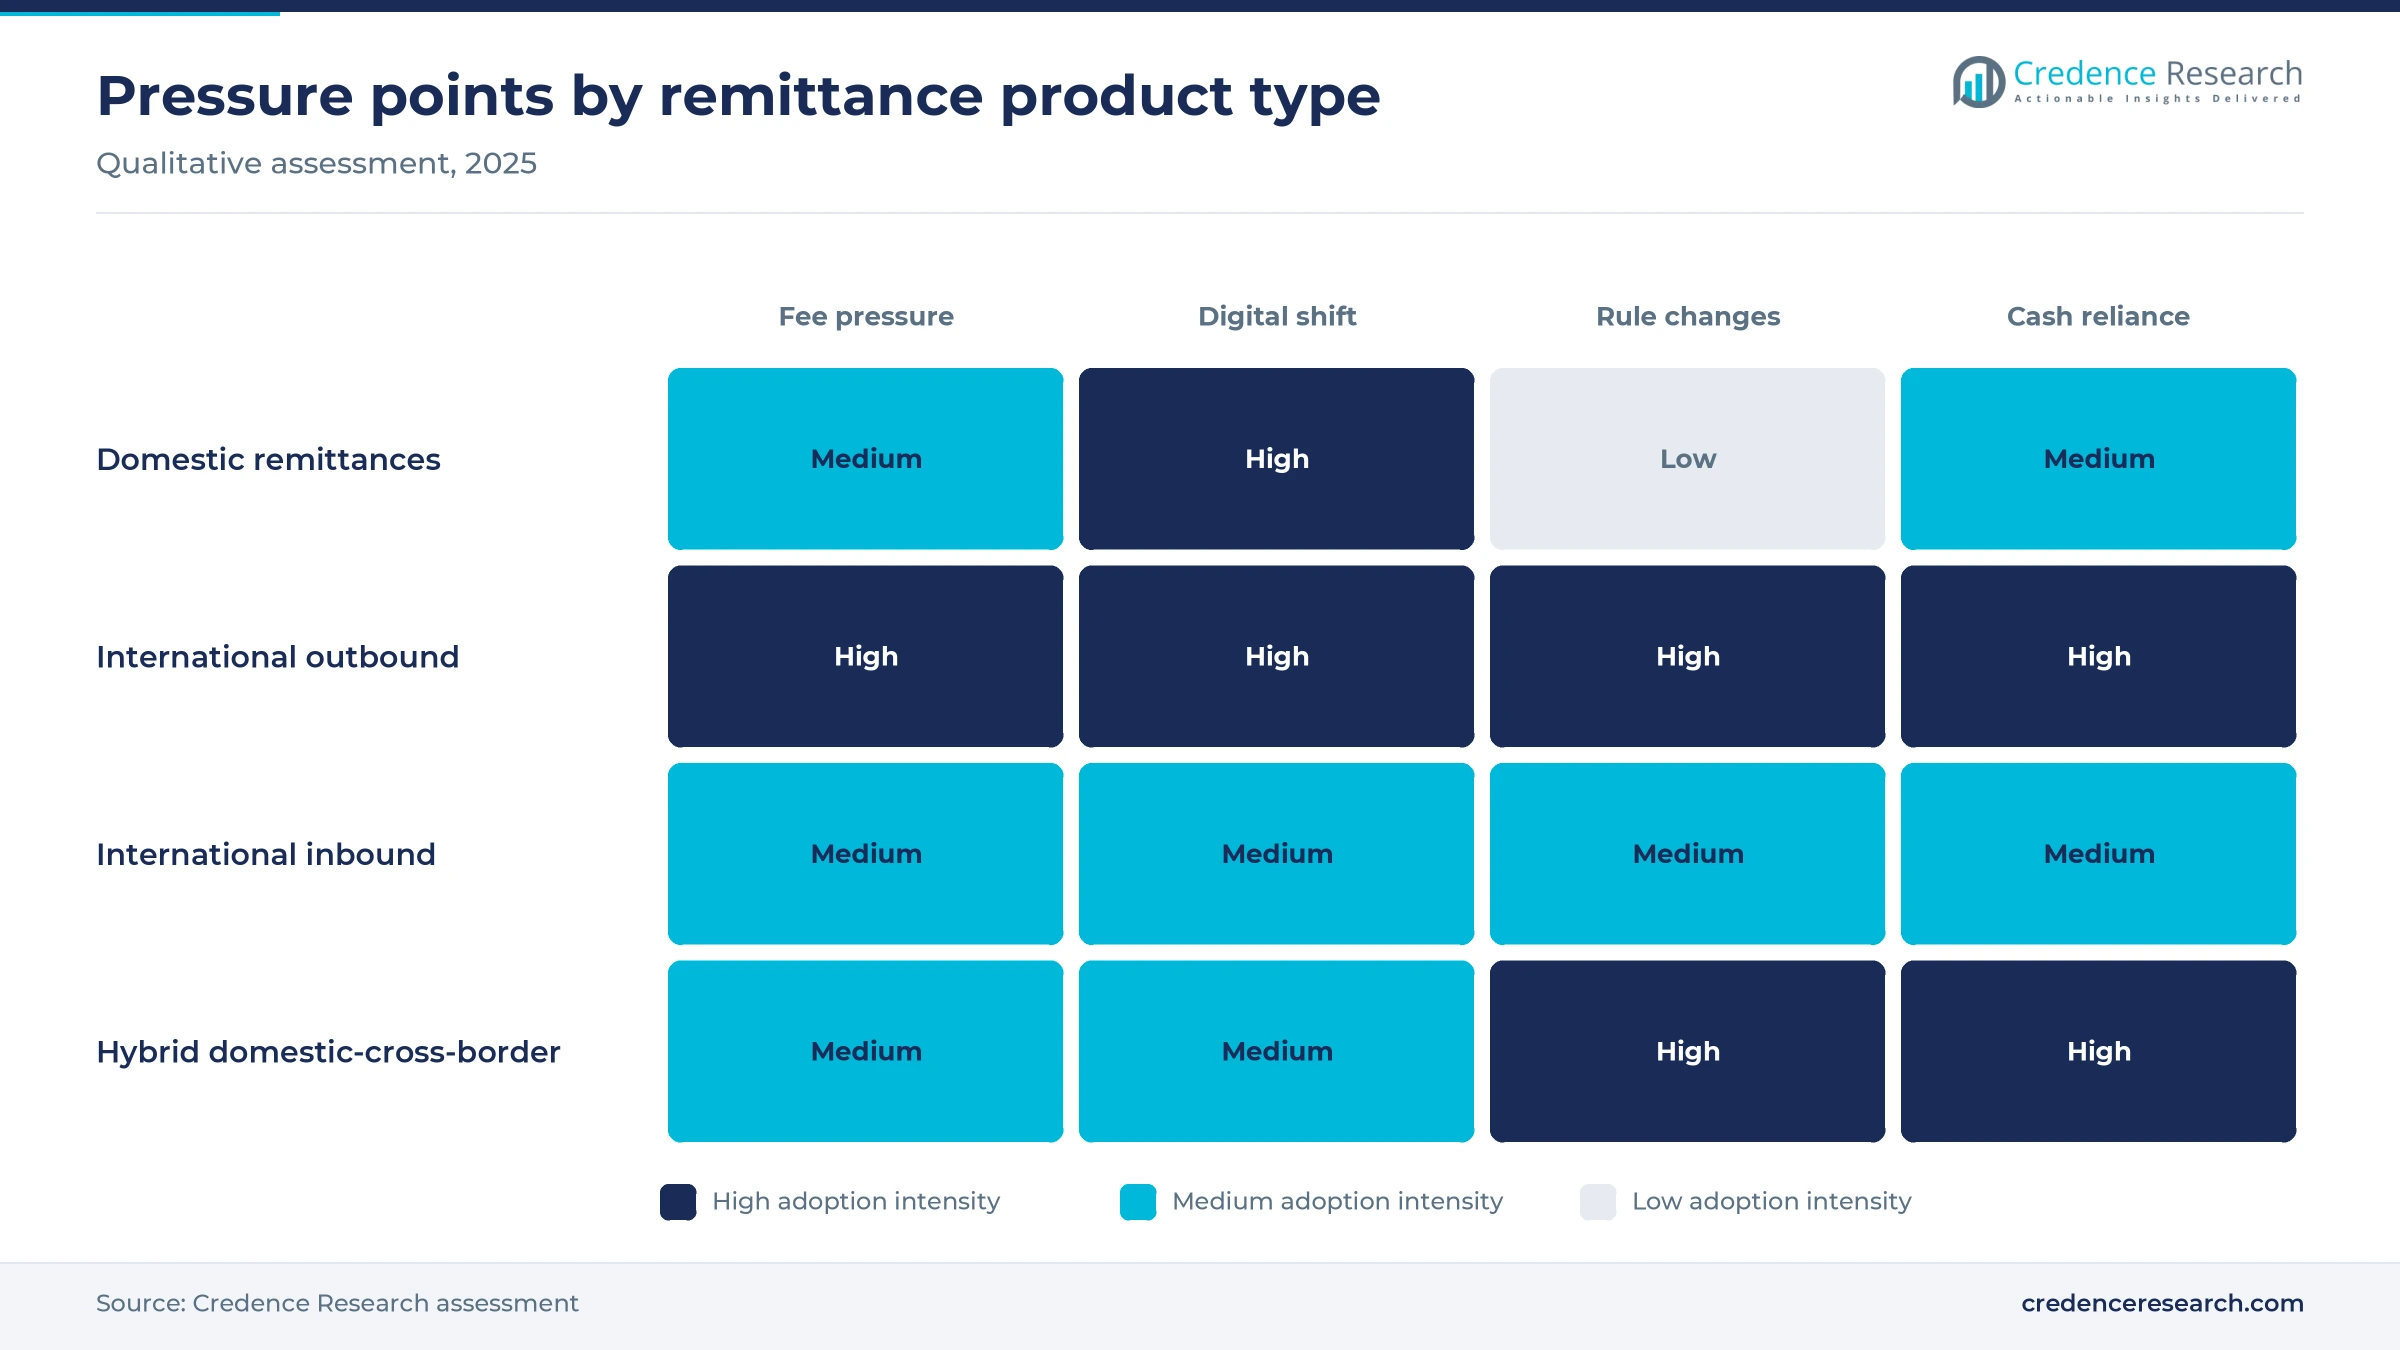
Instant account-to-account rails are cutting the cost and delay of sending wages home. PayInc said PayShap had processed 905 million transactions since launch by May 2026, nearly double the 461 million cited in a December 2025 analysis that put their value at R403 billion. Stitch reported in July 2026 that 80% of monthly PayShap transactions were under R500, which matches the size of typical family-support payments. FNB's eWallet can also send and receive through PayShap, so unbanked recipients connect to the same rail that carries wider digital payments. As a result, senders who once bought cash vouchers can now pay a relative directly from a banking app, and Bank Apps and Online Banking keep 46.0% of value.
Recurring household and family-support transfers
Regular family support is the base load of the market, because many households depend on money earned elsewhere. FinScope data reported by Business Day in October 2026 showed that about 13 million adults mainly used their accounts to receive money and withdraw it immediately. The same survey found 9.5 million people earning income from informal work in 2025, an increase of 1.5 million on a year earlier, which widens the group of senders paid in cash. Standard Bank says more than 200,000 of its new digital customers sent an Instant Money voucher in 2025. These transfers recur each month, so demand holds even when spending elsewhere slows, and Internal Migrant Households keep 70.0% of value.
Formalization of regional migrant remittances
More migrant transfers now move through licensed channels instead of buses, couriers and informal agents. FinMark Trust data supported by the Reserve Bank shows formal transfers to SADC countries more than tripled from about R6 billion in 2016 to the 2024 level noted above, while transactions rose from 4.7 million to 15.6 million. The same assessment estimated the informal market at about R3.4 billion in 2024, against about R19 billion of formal transfers. Licensed remittance entities rose from 48 in 2021 to 55 in 2024. For licensed providers, this means a recorded pool that still has room to grow as cash senders switch, and Foreign Migrant Workers in South Africa gain value at 8.8% a year.
Large banks entering cross-border sending
Entry by the largest retail banks gives migrants a cheaper route from the account where their wages already land. Capitec began offering in-app transfers through Mama Money in August 2025, with recipients collecting cash by token without a bank account, and expanded to 26 markets by April 2026, according to TimesLive. In April 2026, Wise Platform agreed to power Capitec international payments for a bank that reports more than 25 million customers. Mama Money reported more than 720,000 users when the Capitec deal was announced. Bank distribution lowers the cost of reaching senders, which helps international outbound remittances grow faster than domestic flows.
Cash points, new rules and bank entry reshape transfers
Shift of low-value CMA transfers onto regional rails
Transfers to Lesotho, Eswatini and Namibia are moving from domestic treatment to regulated cross-border payments processing. A Reserve Bank release of July 26, 2024 said low-value transfers within the Common Monetary Area would be treated as cross-border from Sept. 30, 2024, with greater due diligence. A further directive reported by TimesLive in April 2025 requires banks to migrate these payments to the TCIB regional scheme by March 2027. FinMark Trust notes that monthly outflows to Namibia rose sharply after the change, reaching R170.5 million in 2024. As these payments become measurable, regional transfers that were hidden in domestic data appear as Hybrid Domestic-Cross-Border Remittance Services, which grow at 9.7% a year.
Rise of cash pay-in points in informal retail
Providers are extending cash acceptance into spaza shops so that cash-paid workers can use formal transfers. Mukuru added 170,000 pay-in points through a partnership with Flash in November 2026, citing about 190,000 traditional trade outlets that move R170 billion of consumer goods a year. Standard Bank says its Instant Money network has more than 400,000 cashout points, most of them in peri-urban, rural and remote areas. Sasai brought more than 150,000 retail funding outlets to its Western Union app in March 2026. This matters because the sender's nearest shop now decides which provider wins the transfer, which keeps retail agent networks central even as banking apps gain share.
Opportunity in licensing alternative remittance providers
A new authorization path for informal operators creates an opening for banks and licensed operators that can sponsor them. In February 2026, the Reserve Bank's Financial Surveillance Department released a draft framework for Authorised Alternative Remittance Providers, covering hawala-type networks, according to Moonstone. Client transfers would be capped at R5,000 per transaction a day and R15,000 a month, with capital of the higher of R50,000 or 10% of projected monthly volume. Comments on the draft framework were due by March 31, 2026. If adopted, part of the informal value noted above would enter recorded channels, and settlement banks would gain new business from operators that need accounts and compliance support.
Opportunity in inbound payouts from the region
Inbound transfers offer a smaller but faster-growing opening, because money now flows back into South Africa more often. FinMark Trust data shows inflows from SADC countries of R5.13 billion in 2024, up from R3.76 billion in 2023, with inflow transactions rising from 154,000 in 2016 to 599,100 in 2024. Mukuru added 46 Travelex branches as payout points in January 2026 to handle collections. The World Bank's Q2 2024 report also ranked South Africa as the most expensive G20 country to send money to, at 7.37% for USD 200. Lower-cost payout has room to win share, so international inbound remittances can grow faster than domestic transfers.
High cross-border costs and cash habits slow the shift
Cross-border fees still take a large share
High fees still push many low-income senders toward informal carriers and couriers. Mama Money co-founder Mathieu Coquillon said in August 2025 that some senders pay R150 in fees on every thousand rand they send home, according to TechCentral. FinMark Trust found the weighted cost of sending USD 200 to the CMA rose from 2.9% in 2021 to 6.5% in 2024 after the cross-border rule change. Migrants sending small monthly amounts feel this most, so providers must cut fees before informal value moves into recorded channels.
Cash habits dominate the largest corridors
Cash dependence limits how far digital channels can lower costs in the biggest corridors. FinMark Trust reported that cash makes up about 80% to 90% of transactions to Zimbabwe and Malawi, which together receive most formal outflows. Malawi's formal receipts also fell 49% from their 2021 peak, and its currency was devalued by 30% in November 2023. Providers serving these routes must fund physical payout networks, so their costs stay high and the shift slows toward wallet and account credit.
Identity rules exclude many migrant senders
Documentation rules keep many foreign workers outside formal transfer channels altogether. FinMark Trust estimated that 89% of SADC migrants in South Africa are undocumented, which blocks standard onboarding. TechCabal reported in June 2025 that a Congolese driver had to stop using WorldRemit after applying for asylum. Low-tier products also carry caps, and FNB's eWallet limits each transaction to R3,000 to meet FIC Act requirements. Providers that accept a wider range of permits can reach this group, but each step adds compliance cost.
Compliance scrutiny continues after the FATF exit
Leaving the FATF grey list did not end compliance pressure on transfer providers. South Africa exited on Oct. 24, 2025, but National Treasury said the next mutual evaluation would begin in the first half of 2026 and conclude in October 2027, according to SAnews. Treasury warned that monitoring and enforcement gaps must close by then to avoid relisting. Licensed operators therefore keep investing in customer checks and reporting, adding fixed costs that favor larger providers over small entrants.
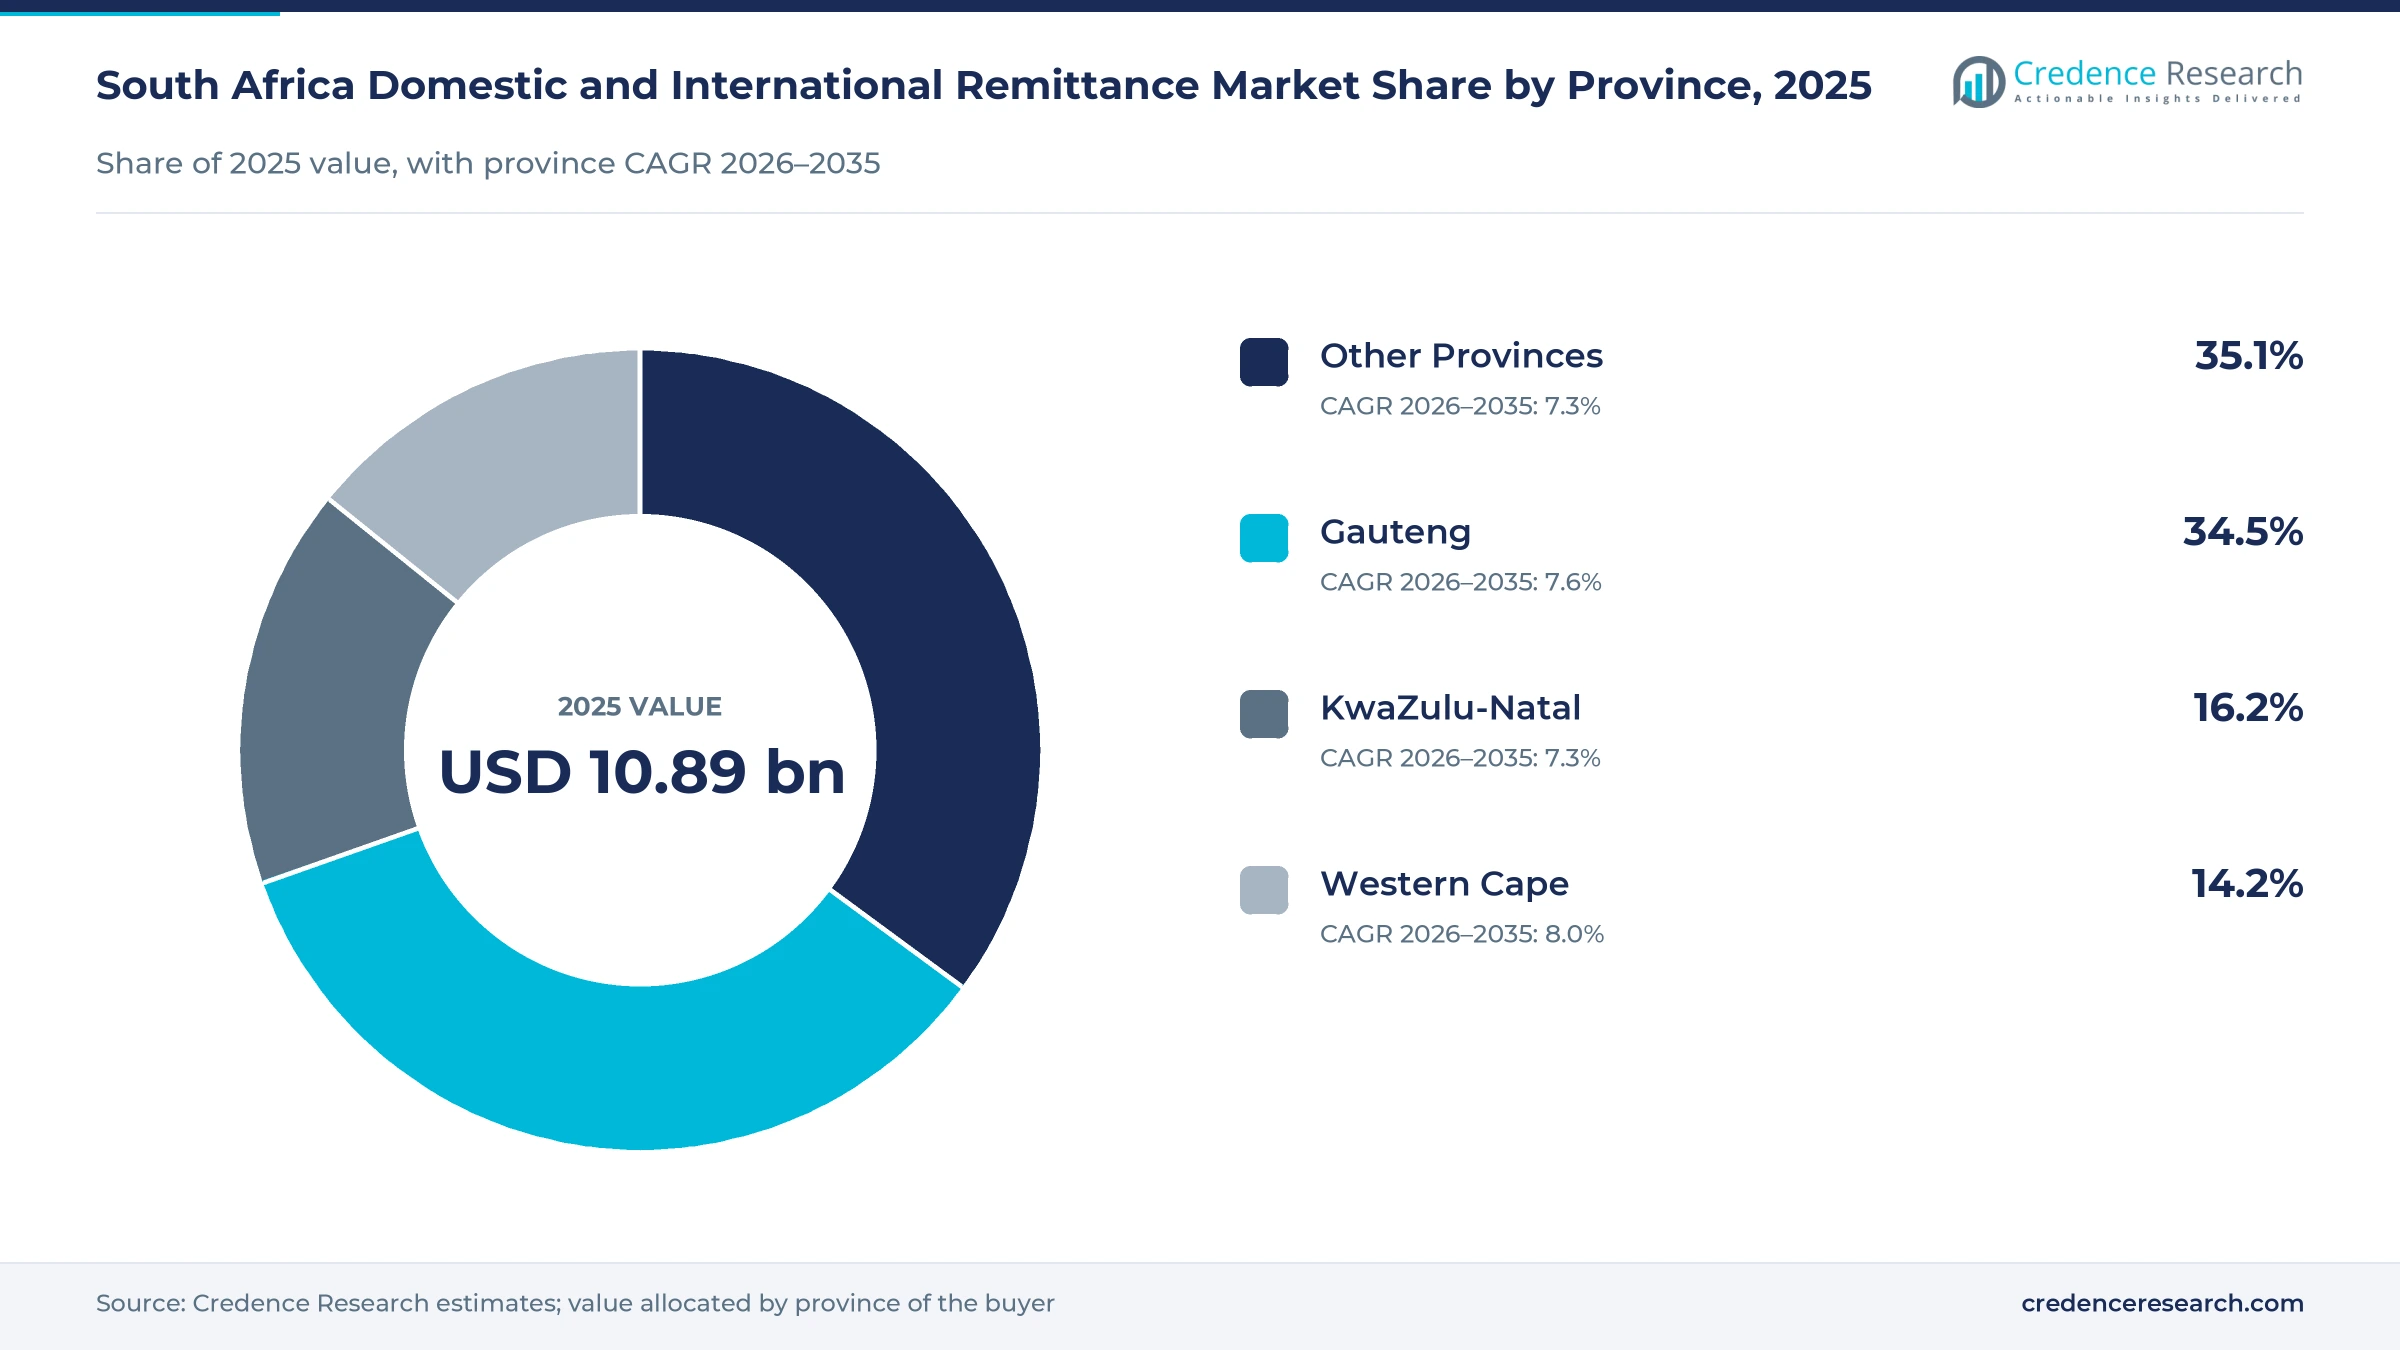
Gauteng sends most while the Western Cape grows fastest
| Province | Value, 2025 (USD billion) | Share, 2025 | CAGR, 2026–2035 |
|---|---|---|---|
| Other Provinces | 3.82 | 35.1% | 7.3% |
| Gauteng | 3.76 | 34.5% | 7.6% |
| KwaZulu-Natal | 1.76 | 16.2% | 7.3% |
| Western Cape | 1.55 | 14.2% | 8.0% |
Gauteng holds the largest base of wage senders
Gauteng held 34.5% of 2025 value and grows at 7.6% a year, the largest share of any single province. Census 2022 showed that Gauteng received more than a third of all internal migrants, and Statistics South Africa says the province produces about one-third of national output. It is also the top destination for immigrants from the wider region, holding 28.4% of male immigrants in Census 2022. Johannesburg is where many migrant workers earn and send, so most provider pay-in networks are densest here.
Western Cape draws migrants and grows fastest
The Western Cape held 14.2% of 2025 value and is the fastest-growing province at 8.0% a year. Census 2022 showed that the province received 15% of internal migrants, second only to Gauteng, and it hosted 9.1% of male immigrants. Statistics South Africa ranked the Western Cape among the three fastest-growing provincial economies in 2024. That steady inflow of workers adds new senders each year, which supports transfer growth above the national pace.
KwaZulu-Natal both sends and receives large flows
KwaZulu-Natal held 16.2% of 2025 value and grows at 7.3% a year. Census 2022 counted 12.4 million residents, about 20% of the population, but the province recorded a net outflow of internal migrants. Credence Research assumes that Durban generates sending flows while rural districts receive money from Gauteng. Standard Bank names Umlazi among the communities where it has expanded Instant Money cashout points, which reflects the province's role as a receiving market.
Other provinces anchor the receiving end of transfers
Other provinces together held 35.1% of 2025 value and grow at 7.3% a year. Census 2022 showed net outflows of internal migrants from Limpopo, the Eastern Cape and the Free State, so many households here depend on money sent from cities. Standard Bank names Giyani, Tzaneen and Thohoyandou in Limpopo, along with Eastern Cape villages, as Instant Money cashout locations. Payout reach matters more than sending apps in this group of provinces.
Bank entry and new partnerships dated 2024 to 2026
| Development | Status and market relevance |
|---|---|
| In September 2024, Shoprite opened Money Market transfers to Lesotho and Eswatini at more than 1,400 counters in its stores. | Live; cash-only transfers within the CMA. |
| In August 2025, Capitec launched in-app cross-border transfers through Mama Money, with token-based cash collection. | Live; expanded to 26 markets by April 2026. |
| In September 2025, Mukuru and MoneyGram connected their networks for transfers across Africa and Asia. | Live; API-based settlement between digital and cash channels. |
| In April 2026, Wise Platform agreed to power international payments for Capitec customers. | Announced; part of the bank-led entry into cross-border sending. |
| In October 2026, Mukuru launched a transactional account and Mastercard card with Bank Zero as sponsor bank. | Launched; prepaid card holders are being migrated. |
Settlement rails and cash tokens decide transfer speed
- PayShap lets bank customers pay a mobile-number ShapID instantly, which suits the small, frequent payments that families send each month.
- TCIB clears low-value cross-border credit transfers immediately within the region, and banks must move CMA payments onto it by March 2027.
- Cash collection tokens such as the 12-digit Mama Money token let recipients without bank accounts collect transfers at partner banks and stores.
- WhatsApp and USSD banking brings mobile wallet sending and receiving to users without data-heavy apps, as FNB did with its eWallet in March 2026.
- Payment APIs connect operators such as Mukuru and MoneyGram so that one network can pay out through the other without new local agents.
Need a Custom Version of This Report?
Tailor the scope, geography, or segments to your exact requirements.
- Custom geography or segment scope
- Direct access to our analyst team
Banks, retailers and licensed operators split the routes
Competition in domestic and international remittance services depends on which part of the route each firm controls. Capitec, First National Bank, Absa Bank and Standard Bank hold the accounts and voucher products that carry most domestic value, and Capitec now also sells cross-border transfers through the bank partnerships described above. Mukuru, Mama Money and Hello Paisa are licensed non-bank operators focused on migrant corridors, and TechCabal reported that Zimbabwean senders in Johannesburg favor Mukuru and Hello Paisa. Western Union partnered with Sasai in March 2026 to launch a co-branded outbound app, while MoneyGram connected its payout network to Mukuru in September 2025. Bidvest Bank and Mastercard launched the BidSend WhatsApp transfer service to 103 countries in December 2023. Advantage increasingly depends on cash pay-in reach, low fees on small amounts and the compliance capacity to onboard migrants.
How is the supply side organized and where do margins sit?
Supply is split between four groups of providers with quite different economics. The large banks own the accounts and voucher products that carry most domestic value, while Shoprite, Checkers and other retailers provide the counters where cash senders pay in. Licensed operators such as Mukuru, Mama Money and Hello Paisa focus on migrant corridors, and global networks such as Western Union and MoneyGram supply payout reach abroad. Entry needs exchange control authorization and anti-money laundering systems, which limits new competitors. Margins sit mainly in cross-border fees and exchange spreads, because flat domestic fees leave little room.
Companies profiled and their roles in this market
| Company | Type | Role in the market |
|---|---|---|
| Mukuru | Licensed money transfer operator | Migrant corridor transfers, 170,000 spaza pay-in points and a new account and card |
| Capitec Bank | Commercial bank | Largest bank by customers; in-app cross-border sending through partner platforms |
| First National Bank | Commercial bank | eWallet transfers to cellphone numbers, available on WhatsApp and USSD since March 2026 |
| Absa Bank | Commercial bank | CashSend vouchers collectable at Absa ATMs and Pick n Pay, Boxer and Shoprite tills |
| Standard Bank | Commercial bank | Instant Money vouchers with more than 400,000 cashout points across the country |
| Mama Money | Licensed money transfer operator | Low-fee transfers to over 70 countries, including through a bank app partnership |
| Hello Paisa | Licensed money transfer operator | Non-bank authorized dealer serving migrant corridors, popular with Zimbabwean senders |
| Western Union | Global money transfer network | Co-branded outbound app with Sasai launched in South Africa in March 2026 |
| MoneyGram | Global money transfer network | Payout network linked to Mukuru for transfers to Asia, East and West Africa |
| Bidvest Bank | Commercial bank | BidSend WhatsApp transfers to 103 countries, launched with Mastercard in December 2023 |
Formal channels win when price and pay-in reach align
Credence Research's view is that the next decade of domestic and international remittance growth will reward providers that combine low fees with cash pay-in reach, rather than either alone. Domestic household transfers are large and stable, but flat fees leave little margin, so banks will use them mainly to keep salary accounts. The more profitable contest is cross-border, where South Africa's costs remain the highest in the G20 and cash still dominates the largest corridors. Bank apps, licensed operators and global networks are converging through partnerships, so pricing pressure should rise and the informal share should fall gradually, provided migrant documentation improves.
Transfer value built from flows, users and prices
The report uses 2025 as the base year and forecasts domestic and international remittance value for 2026 to 2035. Market values come from the Credence Research model, which estimates domestic transfers from the share of adults who send money, typical transfer sizes and wage growth, and cross-border transfers from Reserve Bank and FinMark Trust flow data. The domestic estimate rests on the 2016 TechnoServe survey of sending behavior, the latest national measure available, scaled to 2025 with FinScope adult counts and wage growth, so it carries a wider margin of error than the cross-border values. Segment and provincial splits are Credence Research estimates built from these inputs. Sources include Statistics South Africa, the South African Reserve Bank, National Treasury, the World Bank, FinMark Trust, company releases and business press, and no interviews or surveys were conducted for this edition.
Steady growth as digital channels gain share to 2035
Domestic and international remittance value should keep growing faster than household income to 2035, because recorded channels are absorbing cash and informal transfers. Domestic transfers will remain the largest product, while hybrid services and outbound transfers to the region gain share as the TCIB migration and bank entry lower costs. Digital wallets and licensed operator apps should grow fastest among channels, although retail counters stay important for cash-paid senders. The main risks are a weaker rand, slow progress on migrant documentation and compliance costs after the FATF exit, which would keep growth near the downside case.
How wide is the range of outcomes to 2035?
The outcome depends mainly on how quickly cash and informal value moves into recorded channels and on the rand. A weaker currency lowers U.S. dollar values even when rand transfers grow. Lower fees on instant rails, the TCIB migration and a final framework for alternative remittance providers would push growth toward the upside, while stalled migrant documentation and persistent cross-border costs would hold it near the downside.
| Scenario | CAGR, 2026–2035 | Value, 2035 | What has to hold |
|---|---|---|---|
| Downside | 5.9% | USD 19.77 billion | Rand weakens, cross-border fees stay high and informal carriers keep most cash senders |
| Base | 7.55% | USD 22.62 billion | Steady wage growth, gradual digital uptake and the TCIB migration completed on schedule |
| Upside | 8.8% | USD 25.21 billion | Instant payment fees fall and alternative remittance providers move into licensed channels |
Frequently Asked Questions
How big is the South Africa domestic and international remittance market?
Does the market value measure provider revenue?
Which product type leads the market?
Which province holds the largest share?
How much is sent formally from South Africa to SADC countries?
Why are cross-border transfers from South Africa expensive?
How are banks changing the market?
Which companies compete in the market?
Table of Content
Chapter 1 Market Segmentation
- 1.1 Segmentation Framework
- 1.1.1 Product and Service Classification
- 1.1.2 Application and End-Use Classification
- 1.1.3 Technology and Solution Classification
- 1.1.4 Customer and Distribution Channel Classification
- 1.1.5 Geographic Segmentation
- 1.1.6 Market Segment Definitions and Boundaries
- 1.2 By Product Type
- 1.2.1 Domestic Remittances
- 1.2.2 International Outbound Remittances
- 1.2.3 International Inbound Remittances
- 1.2.4 Hybrid Domestic-Cross-Border Remittance Services
- 1.3 By Customer Segment
- 1.3.1 Internal Migrant Households
- 1.3.2 Foreign Migrant Workers in South Africa
- 1.3.3 South African Diaspora-Linked Households
- 1.3.4 Students and Temporary Workers
- 1.4 By Institution Type
- 1.4.1 Commercial Banks
- 1.4.2 ADLAs and Independent MTOs
- 1.4.3 Retail-Led Money Transfer Providers
- 1.4.4 Digital Wallet and Fintech Operators
- 1.5 By Province
- 1.5.1 Gauteng
- 1.5.2 Western Cape
- 1.5.3 KwaZulu-Natal
- 1.5.4 Other Provinces
Chapter 2 Introduction
- 2.1 Report Objectives and Scope
- 2.2 Product Definition and Industry Terminology
- 2.3 Market Inclusions and Exclusions
- 2.4 Research Process
- 2.4.1 Primary Research and Expert Interviews
- 2.4.2 Secondary Research and Source Review
- 2.4.3 Top-Down and Bottom-Up Estimation
- 2.4.4 Data Triangulation and Verification
- 2.5 Market Size Measurement Basis
- 2.5.1 2025: USD 10.89 billion → 2035: USD 22.62 billion
- 2.6 Historical and Forecast Reference Periods
- 2.6.1 Historical Period: 2018-2025
- 2.6.2 Base Year: 2025
- 2.6.3 Forecast Period: 2025-2035
- 2.7 Research Assumptions and Limitations
Chapter 3 Executive Summary
- 3.1 Market Snapshot and Key Findings
- 3.2 Base-Year Market Size, 2025
- 3.3 Forecast Market Size, 2035
- 3.4 Revenue and Volume Growth Outlook
- 3.5 Key Demand and Supply Indicators
- 3.6 Leading Market Segments
- 3.7 Fastest-Growing Market Opportunities
- 3.8 Regional Performance Highlights
- 3.9 Technology and Industry Transformation
- 3.10 Competitive Landscape Summary
- 3.11 Analyst View and Strategic Implications
Chapter 4 South Africa Domestic and International Remittance Market Trends and Developments
- 4.1 Historical Industry Development, 2018-2025
- 4.2 Recent Market Trends and Developments
- 4.3 Demand and Customer Behavior Trends
- 4.4 Technology and Product Innovation
- 4.5 Artificial Intelligence, Automation and Digitalization
- 4.6 Local Manufacturing and Supply Chain Realignment
- 4.7 Industry Partnerships, Mergers and Acquisitions
- 4.8 Sustainability and Circular Economy Developments
- 4.9 Government and Private Sector Investment Trends
- 4.10 Emerging Business Models and Commercialization
- 4.11 Industry Developments and Announcements
Chapter 5 South Africa Domestic and International Remittance Market Supply and Demand Analysis
- 5.1 Demand Trend and Consumption Analysis, 2018-2025
- 5.2 Demand Forecast, 2025-2035
- 5.3 Supply Chain Structure and Procurement Trends
- 5.4 Supply-Demand Gap and Bottlenecks
- 5.5 Import Dependence and Sourcing Structure
- 5.6 Regional Supply and Demand Concentration
Chapter 6 South Africa Domestic and International Remittance Market Pricing Analysis
- 6.1 Pricing Structure and Measurement
- 6.2 Historical Pricing Trends, 2018-2025
- 6.3 Pricing Outlook, 2025-2035
- 6.4 Pricing by Product and Market Segment
- 6.5 Geographic Pricing Differences
- 6.6 Key Input, Energy, Labor and Logistics Costs
- 6.7 Contract Pricing and Purchasing Models
- 6.8 Pricing Sensitivity and Competitive Positioning
- 6.9 Price, Margin and Profitability Implications
Chapter 7 South Africa Domestic and International Remittance Market Dynamics
- 7.1 Market Growth Drivers
- 7.1.1 Demand-Side Drivers
- 7.1.2 Technology and Innovation Drivers
- 7.1.3 Infrastructure and Investment Drivers
- 7.1.4 Regulatory and Policy Drivers
- 7.2 Market Restraints
- 7.2.1 Cost and Affordability Constraints
- 7.2.2 Technology and Adoption Barriers
- 7.2.3 Supply Chain and Operational Constraints
- 7.3 Market Challenges
- 7.3.1 Competitive Pressure and Margin Erosion
- 7.3.2 Skills, Infrastructure and Implementation Gaps
- 7.4 Emerging Market Opportunities
- 7.5 Market Dynamics Impact and Time-Horizon Assessment
Chapter 8 South Africa Domestic and International Remittance Value Chain Analysis
- 8.1 Industry Value Chain Overview
- 8.2 Upstream Suppliers and Critical Inputs
- 8.3 Technology and Component Providers
- 8.4 Manufacturing or Service Delivery
- 8.5 Distribution, Channel Partners and Integrators
- 8.6 Downstream Applications and End Users
- 8.7 Value Addition and Profit Pools
- 8.8 Vertical Integration and Outsourcing
- 8.9 Supplier Concentration and Risk
- 8.10 Supply Chain Localization and Resilience
Chapter 9 South Africa Domestic and International Remittance Market Regulations and Policies
- 9.1 Relevant Laws, Standards and Compliance Frameworks
- 9.2 Product, Service, Safety and Quality Requirements
- 9.3 Government Policies, Incentives and Subsidies
- 9.4 Imports, Exports and Trade Barriers
- 9.5 Public Procurement and Local Content Requirements
- 9.6 Data Protection, AI and Cybersecurity Compliance
- 9.7 Upcoming Policy Changes and Market Implications
Chapter 10 South Africa Domestic and International Remittance Market Hotspots and Opportunities
- 10.1 Market Opportunity Mapping and Growth Hotspots
- 10.2 High-Growth Applications and Customer Groups
- 10.3 Underserved Markets and White-Space Opportunities
- 10.4 Emerging Technology and Product Opportunities
- 10.5 New Capacity and Investment Hotspots
- 10.6 Market Entry and Expansion Opportunities
- 10.7 Distribution and Partnership Opportunities
- 10.8 Near-Term and Long-Term Commercial Potential
- 10.9 Opportunity Attractiveness and Execution Risks
Chapter 11 South Africa Domestic and International Remittance Market Outlook, 2025-2035
- 11.1 Market Size and Analysis
- 11.1.1 Revenue (Market Measurement: 2025: USD 10.89 billion → 2035: USD 22.62 billion)
- 11.1.2 Historical Market Size, 2018-2025
- 11.1.3 Base-Year Market Size, 2025
- 11.2 Market Forecast, 2025-2035
- 11.2.1 Revenue Forecast to 2035
- 11.2.2 CAGR and Year-on-Year Growth
- 11.2.3 Incremental Revenue Opportunity
- 11.3 Forecast Assumptions and Scenario Analysis
- 11.3.1 Base-Case Forecast
- 11.3.2 Optimistic and Conservative Scenarios
- 11.3.3 Technology, Pricing and Policy Sensitivities
- 11.4 Market Attractiveness and Growth Outlook
Chapter 12 South Africa Domestic and International Remittance Market Segmentation and Outlook
- 12.1 Segmentation Summary and Market Shares, 2025
- 12.2 Largest and Fastest-Growing Segments
- 12.3 By Product Type - Market Size and Forecast, 2025-2035
- 12.3.1 Segment Definition and Scope
- 12.3.2 Historical Market Size, 2018-2025
- 12.3.3 Revenue Forecast, 2025-2035
- 12.3.4 Base-Year Market Share, 2025
- 12.3.5 Segment CAGR and Growth Drivers
- 12.3.6 Subsegment Market Size and Forecast
- 12.3.6.1 Domestic Remittances
- 12.3.6.2 International Outbound Remittances
- 12.3.6.3 International Inbound Remittances
- 12.3.6.4 Hybrid Domestic-Cross-Border Remittance Services
- 12.3.7 Subsegment Pricing and Adoption Trends
- 12.3.8 Leading Suppliers and Competition
- 12.3.9 Regional Demand and Opportunities
- 12.4 By Customer Segment - Market Size and Forecast, 2025-2035
- 12.4.1 Segment Definition and Scope
- 12.4.2 Historical Market Size, 2018-2025
- 12.4.3 Revenue Forecast, 2025-2035
- 12.4.4 Base-Year Market Share, 2025
- 12.4.5 Segment CAGR and Growth Drivers
- 12.4.6 Subsegment Market Size and Forecast
- 12.4.6.1 Internal Migrant Households
- 12.4.6.2 Foreign Migrant Workers in South Africa
- 12.4.6.3 South African Diaspora-Linked Households
- 12.4.6.4 Students and Temporary Workers
- 12.4.7 Subsegment Pricing and Adoption Trends
- 12.4.8 Leading Suppliers and Competition
- 12.4.9 Regional Demand and Opportunities
- 12.5 By Institution Type - Market Size and Forecast, 2025-2035
- 12.5.1 Segment Definition and Scope
- 12.5.2 Historical Market Size, 2018-2025
- 12.5.3 Revenue Forecast, 2025-2035
- 12.5.4 Base-Year Market Share, 2025
- 12.5.5 Segment CAGR and Growth Drivers
- 12.5.6 Subsegment Market Size and Forecast
- 12.5.6.1 Commercial Banks
- 12.5.6.2 ADLAs and Independent MTOs
- 12.5.6.3 Retail-Led Money Transfer Providers
- 12.5.6.4 Digital Wallet and Fintech Operators
- 12.5.7 Subsegment Pricing and Adoption Trends
- 12.5.8 Leading Suppliers and Competition
- 12.5.9 Regional Demand and Opportunities
- 12.6 By Province - Market Size and Forecast, 2025-2035
- 12.6.1 Segment Definition and Scope
- 12.6.2 Historical Market Size, 2018-2025
- 12.6.3 Revenue Forecast, 2025-2035
- 12.6.4 Base-Year Market Share, 2025
- 12.6.5 Segment CAGR and Growth Drivers
- 12.6.6 Subsegment Market Size and Forecast
- 12.6.6.1 Gauteng
- 12.6.6.2 Western Cape
- 12.6.6.3 KwaZulu-Natal
- 12.6.6.4 Other Provinces
- 12.6.7 Subsegment Pricing and Adoption Trends
- 12.6.8 Leading Suppliers and Competition
- 12.6.9 Regional Demand and Opportunities
- 12.7 Segment Growth Comparison
- 12.8 Segment Attractiveness and Priority Matrix
Chapter 13 South Africa Domestic and International Remittance End-Use and Application Market Outlook
- 13.1 End-Use Industry and Customer Demand Structure
- 13.2 Leading Applications and Customer Groups
- 13.3 End-Use Market Size, Share and Forecast
- 13.4 Major End-Use Industry Deep Dives
- 13.4.1 Customer Requirements and Use Cases
- 13.4.2 Demand and Replacement Cycles
- 13.4.3 Technical and Regulatory Considerations
- 13.4.4 Purchasing and Procurement Models
- 13.4.5 Leading Vendors and Distribution Channels
- 13.4.6 Forecast and Commercial Opportunities
- 13.5 Emerging Applications and Cross-Segment Demand
- 13.6 End-Use Industry Investment Priorities
Chapter 14 South Africa Domestic and International Remittance Geographic Market Outlook, 2025-2035
- 14.1 Domestic Market Distribution and Demand Clusters
- 14.2 State- or Province-Wise Market Size and Forecast, 2025-2035
- 14.3 City and Metropolitan Market Outlook
- 14.4 Industrial, Manufacturing and Commercial Clusters
- 14.5 Geographic Concentration of Key End Users
- 14.6 Local Pricing and Purchasing Differences
- 14.7 Domestic Production Facilities and Capacity Map
- 14.8 Local Infrastructure and Project Pipeline
- 14.9 State-Level Policy and Incentive Differences
- 14.10 Subnational Investment Hotspots and Opportunities
- 14.11 Distribution and Logistics Networks
- 14.12 Domestic Competitive Footprint
Chapter 15 South Africa Domestic and International Remittance Technology, Innovation and Sustainability Outlook
- 15.1 Technology Landscape and Maturity
- 15.2 Product, Process and Service Innovation
- 15.3 AI, Automation and Digital Tools in the Industry
- 15.4 Technology Adoption and Performance Benchmarking
- 15.5 Innovation Pipeline and R&D Investment
- 15.6 Energy Efficiency and Resource Management
- 15.7 Sustainability, Recycling and Circularity
- 15.8 Technology Roadmap, 2025-2035
- 15.9 Risks of Obsolescence and Technology Substitution
Chapter 16 South Africa Domestic and International Remittance Market Key Strategic Imperatives
- 16.1 Growth and Market Entry Priorities
- 16.2 High-Return Products and Segments
- 16.3 Pricing, Profitability and Cost Optimization
- 16.4 Technology Investment and Product Differentiation
- 16.5 Supply Chain Localization and Resilience
- 16.6 Distribution and Customer Acquisition
- 16.7 Partnership, Acquisition and Capacity Strategy
- 16.8 Regional Expansion Priorities
- 16.9 Short-, Medium- and Long-Term Actions
Chapter 17 Competition Outlook
- 17.1 Industry Competition Characteristics
- 17.2 Market Structure and Concentration
- 17.3 Market Share and Competitive Positioning, 2025
- 17.4 Company-Wise Revenue and Product Benchmarking
- 17.5 Production and Service Capacity Benchmarking
- 17.6 Technology, Pricing and Differentiation
- 17.7 Regional Footprint and Distribution Strength
- 17.8 Mergers, Acquisitions and Strategic Alliances
- 17.9 New Entrants and Competitive Threats
- 17.10 Porter's Five Forces and Industry Attractiveness
- 17.11 Competitive Outlook, 2025-2035
Chapter 18 Company Profiles
- 18.1 Company Coverage and Selection Criteria
- 18.2 Mukuru
- 18.2.1 Business Description
- 18.2.2 Company Ownership and Geographic Presence
- 18.2.3 Product and Service Portfolio
- 18.2.4 Manufacturing and Operating Footprint
- 18.2.5 Financial Performance and Investment
- 18.2.6 Market Share and Competitive Position
- 18.2.7 Technology and Innovation Capabilities
- 18.2.8 Strategic Alliances or Partnerships
- 18.2.9 Recent Developments
- 18.2.10 Growth Strategy and Outlook
- 18.3 Capitec Bank
- 18.4 First National Bank
- 18.5 Absa Bank
- 18.6 Standard Bank
- 18.7 Mama Money
- 18.8 Hello Paisa
- 18.9 Western Union
- 18.10 MoneyGram
- 18.11 Bidvest Bank
- 18.12 Other Relevant Market Participants
Note: Every listed company is profiled on the structure shown under the first company. The company list is preliminary and may change based on research findings, market developments, data availability and client requirements.
Chapter 19 Disclaimer
- 19.1 Research and Forecast Disclaimer
- 19.2 Data Source and Estimation Limitations
Note: The depth of individual sections depends on data availability for this market. Volume, capacity, trade and other unit-based metrics are included where applicable.