Market Overview
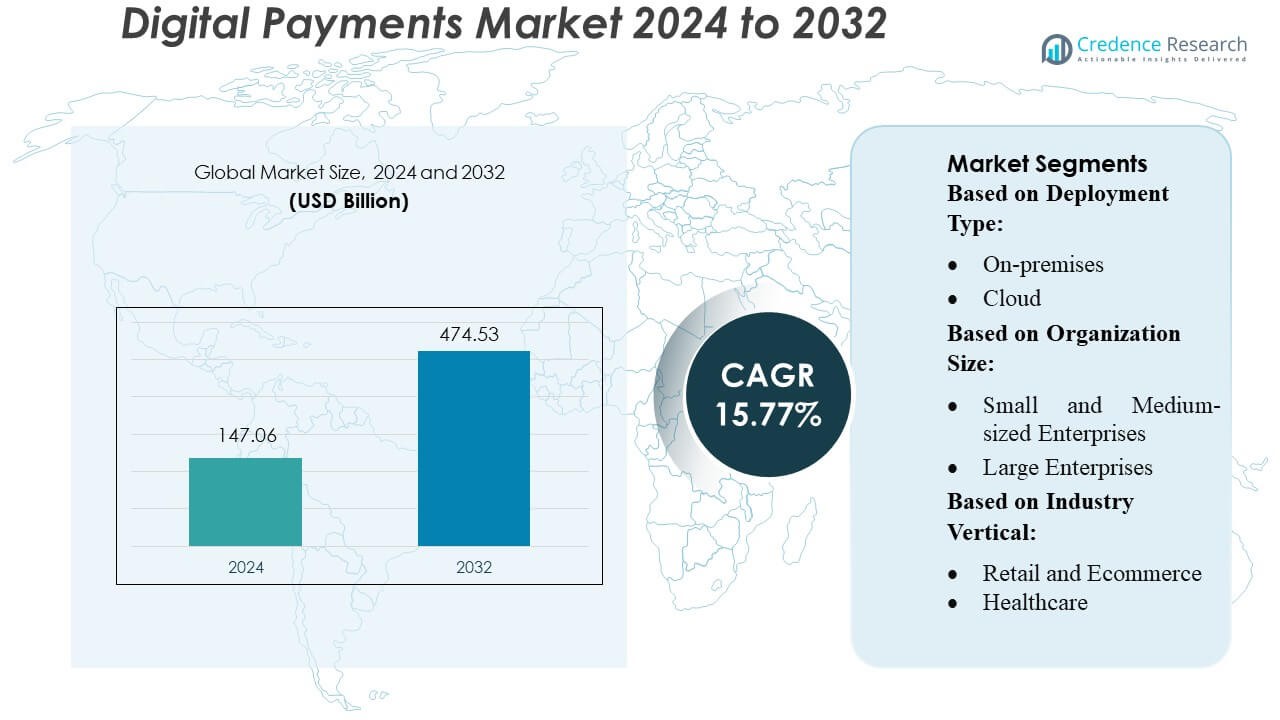
Digital Payments Market size was valued USD 147.06 billion in 2024 and is anticipated to reach USD 474.53 billion by 2032, at a CAGR of 15.77% during the forecast period.
| REPORT ATTRIBUTE |
DETAILS |
| Historical Period |
2020-2023 |
| Base Year |
2024 |
| Forecast Period |
2025-2032 |
| Digital Payments Market Size 2024 |
USD 147.06 Billion |
| Digital Payments Market, CAGR |
15.77% |
| Digital Payments Market Size 2032 |
USD 474.53 Billion |
The global digital payments market is dominated by leading players such as PayPal, Stripe, Square, Adyen, Alipay (Ant Group), WeChat Pay (Tencent), Apple Pay, Google Pay, Visa, Mastercard, Fiserv, and FIS. These companies together drive innovation across digital wallets, payment gateways, and real-time transaction processing. Regionally, North America commands the largest share, accounting for approximately 36% of the global digital payments market.
Market Insights
- The Digital Payments Market reached USD 147.06 billion in 2024 and is projected to hit USD 474.53 billion by 2032, expanding at a CAGR of 15.77%, driven by rapid digitization and rising global transaction volumes.
- Growing smartphone penetration, expanding e-commerce activity, and strong government initiatives continue to drive market adoption, with digital wallets and contactless payments accelerating consumer and merchant uptake.
- Advanced technologies such as tokenization, AI-driven fraud detection, and instant payment infrastructure shape market trends, supported by strategic investments from PayPal, Stripe, Adyen, Alipay, and Visa in real-time processing capabilities.
- Competitive pressure intensifies as global and regional players enhance security, pricing models, and interoperability, while data privacy concerns, cybersecurity risks, and regulatory complexities act as key restraints.
- North America holds 36% of the market, leading in digital infrastructure, while Asia-Pacific shows the fastest growth; within segments, digital wallets account for the largest share, supported by high user adoption and merchant integration.
Access crucial information at unmatched prices!
Request your sample report today & start making informed decisions powered by Credence Research Inc.!
Download Sample
Market Segmentation Analysis:
By Deployment Type
The cloud deployment segment dominates the digital payments market with an estimated 65–70% share, driven by its scalability, lower upfront investment, and rapid integration with APIs and fintech ecosystems. Enterprises increasingly adopt cloud-based payment gateways and fraud-detection systems to support real-time transaction processing and high availability. In contrast, on-premises solutions retain relevance in highly regulated environments requiring full data control, but their market share continues to decline as businesses prioritize operational flexibility, automatic updates, and enhanced cybersecurity capabilities offered through cloud-native architectures.
- For instance, Aurus Inc. powers its AurusPay® platform across major payment processors in more than 25 countries (spanning North America, South America, Europe, and Asia), enabling cloud-native transaction routing for global merchants. The platform offers the flexibility to choose from a wide option of payment processors to suit business needs.
By Organization Size
Large enterprises lead this segment with approximately 60% market share, driven by their high transaction volumes, multi-channel payment requirements, and early adoption of advanced technologies such as AI-based fraud analytics and tokenization. Their investments in global payment orchestration platforms and compliance automation further strengthen dominance. Small and medium-sized enterprises, however, represent the fastest-growing user group as digital wallets, QR-based payments, and low-cost cloud gateways reduce integration barriers, enabling SMEs to expand digital acceptance and improve customer experience.
- For instance, Stripe supports 3D Secure 2 integration using robust security practices, including the use of modern cryptographic hash functions like SHA-256 for request/response digital signatures to ensure secure, authenticated transactions.
By Industry Vertical
The BFSI sector holds the largest share at around 35%, supported by extensive digital banking adoption, real-time payment infrastructure, and strict compliance frameworks that accelerate investment in secure payment technologies. Retail and e-commerce follow closely due to rising online shopping and omnichannel payment integration. Healthcare, travel and hospitality, transportation and logistics, and media and entertainment increasingly adopt digital payments to streamline billing, automate ticketing, and enhance user engagement. Other sectors collectively grow through government digitalization initiatives and expanding mobile payment acceptance across emerging markets.
Key Growth Drivers
- Rapid Global Smartphone and Internet Penetration
The expansion of affordable smartphones and high-speed internet continues to accelerate the adoption of digital payments worldwide. Mobile-first markets, especially in Asia-Pacific and Africa, are integrating digital wallets and UPI-based systems into everyday transactions. Improved 4G/5G connectivity enables faster verification, seamless onboarding, and secure transactions even in remote areas. As mobile devices increasingly become financial access points for the unbanked population, digital payment applications achieve broader reach, supporting transaction volume growth across consumer and merchant ecosystems.
- For instance, PayPal’s smartphones drive a significant share of its volume: as of recent data from 2025, PayPal noted that 45% of transactions were made via mobile devices, with mobile payments on the platform reaching approximately $720 billion in total volume in that year alone.
- Government Initiatives Toward Cashless Economies
Governments across emerging and developed economies actively promote digital payments through regulatory reforms, incentives, and infrastructure investments. Programs such as India’s Digital India and Europe’s PSD2 encourage transparency, financial inclusion, data portability, and secure open banking frameworks. Tax benefits, interoperable platforms, and reduced merchant discount rates further motivate businesses to adopt digital channels. These supportive policies accelerate the transition from cash-based transactions to digital systems, strengthening the overall digital finance ecosystem and enabling payment providers to scale rapidly.
- For instance, Global Payments’ global transaction-processing network supports over 66 billion transactions annually, underpinned by its low-latency, high-availability API architecture.
- Technological Advancements in Fraud Prevention and Payment Security
Advanced technologies such as AI-driven fraud detection, tokenization, biometrics, and blockchain significantly enhance transaction security, increasing consumer confidence in digital payments. Real-time anomaly detection reduces financial risks, while biometric authentication improves user experience without compromising safety. These innovations address long-standing concerns around cyber threats and data breaches, enabling enterprises, banks, and fintech companies to expand digital solutions across high-risk sectors like e-commerce and financial services. As security capabilities strengthen, digital payment platforms experience higher adoption and transaction throughput.
Key Trends & Opportunities
- Growth of Contactless and QR-Based Payments
Contactless card payments and QR-based transactions are gaining prominence as consumers seek frictionless, hygienic, and instant payment options. NFC-enabled devices and interoperable QR frameworks expand merchant acceptance and reduce transaction time. Retail, public transport, and food delivery sectors increasingly rely on tap-and-go systems to enhance customer experience. This trend opens opportunities for providers to build scalable, low-cost acceptance solutions, particularly in emerging markets where small merchants prefer QR codes due to minimal hardware investment and simplified onboarding.
- For instance, Adyen’s Tap-to-Pay on Android lets any NFC-enabled Android device be used as a terminal; this solution is available in 8 markets including the US, Europe, UAE, Singapore, and Australia.
- Expansion of Embedded Finance and Payment-as-a-Service (PaaS)
Embedded payment solutions integrated within e-commerce, mobility, and SaaS platforms create new monetization opportunities for fintechs and payment processors. Businesses leverage PaaS models to deliver seamless checkout experiences, subscription billing, and automated payouts without building proprietary systems. API-driven ecosystems allow developers to integrate payments, lending, and identity verification directly into applications. This trend drives faster innovation cycles, enabling companies to differentiate through customizable financial workflows and value-added services while expanding the addressable market for digital payment infrastructure providers.
- For instance, Authorize.Net acts as a backbone for embedded payment workflows: it powers over 440,000 merchant accounts, according to its official website and documentation.
- Rising Adoption of Real-Time Cross-Border Payments
Demand for instant, low-cost international transfers is rising among businesses, freelancers, and migrant workers. Real-time payment networks, ISO 20022 messaging standards, and blockchain-based solutions help reduce settlement delays and FX inefficiencies. Fintech firms and global banks collaborate to simplify compliance and enhance transparency in cross-border corridors. As trade digitalization accelerates, providers offering interoperable global payment rails gain a competitive edge, creating opportunities for platform expansion, partnerships, and new revenue streams across remittance and B2B segments.
Key Challenges
- Escalating Cybersecurity Threats and Data Breaches
Despite technological advancements, the digital payments landscape faces increasing cyberattacks, phishing incidents, and data breaches. Financial institutions and fintechs must continuously invest in security upgrades, encryption, and compliance with data protection standards. Smaller merchants often lack robust security infrastructure, creating vulnerabilities within the broader payment ecosystem. Rising fraud risks can undermine consumer trust, slow adoption rates, and increase operational costs for service providers, making cybersecurity a persistent challenge that requires ongoing vigilance and innovation.
- Regulatory Complexity and Compliance Burden
Digital payment operators navigate diverse and rapidly evolving regulations across countries related to data privacy, authentication, KYC/AML norms, and cross-border transactions. Compliance costs rise as governments introduce stricter frameworks to mitigate systemic and consumer risks. Varying regional requirements complicate scalability for global payment providers and delay product deployments. Balancing innovation with regulatory adherence remains a strategic challenge for fintechs, banks, and PSPs, often requiring specialized legal, cybersecurity, and audit teams to ensure continuous compliance.
Regional Analysis
North America
North America maintains a leading position in the digital payments market with an estimated 32–34% share, supported by advanced financial infrastructure, rapid fintech adoption, and strong regulatory frameworks that encourage innovation. Consumers increasingly use mobile wallets, contactless cards, and real-time payments, driven by high smartphone penetration and established digital banking ecosystems. The U.S. leads the region due to widespread merchant acceptance and continuous investments in fraud prevention technologies. Additionally, initiatives such as FedNow accelerate real-time transaction capabilities, while Canada strengthens interoperability across banks and payment networks, further solidifying regional dominance.
Europe
Europe holds roughly 25–27% of the global digital payments market, driven by unified regulatory standards, cross-border payment harmonization, and growing consumer preference for cashless transactions. The EU’s PSD2 directive continues to expand open banking adoption, enabling secure and competitive digital payment solutions across member states. Countries like the U.K., Germany, and the Nordics lead in contactless usage and digital wallet penetration. High merchant acceptance, strong cybersecurity policies, and bank–fintech partnerships support regional growth. Government-led digital identity frameworks and instant payment schemes such as SEPA further improve transaction speed and transparency across European markets.
Asia-Pacific
Asia-Pacific represents the fastest-growing regional market, accounting for an estimated 30–32% market share, supported by large unbanked populations transitioning to mobile-first payment ecosystems. China and India dominate due to widespread QR-based systems, low-cost UPI infrastructure, and mass smartphone ownership. The region benefits from aggressive fintech innovation, government-backed digitalization programs, and expanding e-commerce activity. Southeast Asian countries—such as Indonesia, Vietnam, and the Philippines—continue to adopt interoperable payment standards that enhance financial inclusion. High-volume, low-value digital transactions define market dynamics, while super-apps integrate payments with transportation, retail, and financial services, accelerating regional adoption.
Latin America
Latin America captures around 7–8% of the global digital payments market, recording strong momentum as financial inclusion efforts reshape consumer and merchant behavior. Brazil leads with its widely adopted instant payment platform PIX, which drives rapid cashless transition across demographics. Mexico, Colombia, and Chile continue expanding smartphone-enabled wallets and electronic transfers, supported by improving banking accessibility and regulatory modernization. Growing e-commerce penetration and fintech investment further accelerate adoption. Despite challenges like security risks and inconsistent infrastructure, regional governments’ push for interoperable systems and digital identity frameworks helps strengthen trust and widen digital payment usage.
Middle East & Africa
The Middle East & Africa region holds an estimated 5–6% market share, but demonstrates significant growth potential with expanding mobile money ecosystems and government-led digital transformation initiatives. Gulf Cooperation Council (GCC) countries accelerate contactless and real-time payment adoption through national digitalization strategies. Meanwhile, African markets—particularly Kenya, Nigeria, and South Africa—thrive on mobile money platforms that bridge financial access gaps. Increasing smartphone penetration, rising e-commerce activity, and cross-border remittance needs stimulate market expansion. Although infrastructure and regulatory disparities persist, ongoing partnerships between banks, telecom operators, and fintechs are strengthening digital payment integration across the region.
Market Segmentations:
By Deployment Type:
By Organization Size:
- Small and Medium-sized Enterprises
- Large Enterprises
By Industry Vertical:
- Retail and Ecommerce
- Healthcare
By Geography
- North America
- Europe
- Germany
- France
- U.K.
- Italy
- Spain
- Rest of Europe
- Asia Pacific
- China
- Japan
- India
- South Korea
- South-east Asia
- Rest of Asia Pacific
- Latin America
- Brazil
- Argentina
- Rest of Latin America
- Middle East & Africa
- GCC Countries
- South Africa
- Rest of the Middle East and Africa
Competitive Landscape
The competitive landscape of the Digital Payments Market features a diverse mix of global and regional leaders, including Aurus Inc., Wirecard, PayPal Holdings Inc., Global Payments Inc., Adyen, Authorize.Net, Novatti Group Pty Ltd., Aliant Payments, ACI Worldwide, Inc., and Financial Software & Systems Pvt. Ltd. The Digital Payments Market continues to evolve rapidly as companies enhance their technological capabilities and pursue global expansion strategies. Market participants focus on strengthening real-time payment processing, improving interoperability, and integrating advanced security features such as tokenization and AI-driven fraud prevention. Increasing demand for seamless omnichannel experiences drives firms to invest in cloud-native architectures, open APIs, and embedded payment solutions that support e-commerce, mobile wallets, and contactless transactions. Strategic partnerships with banks, retailers, and fintech ecosystems remain crucial for scaling operations and improving market reach. As regulatory frameworks tighten, companies prioritize compliance, data privacy, and resilient infrastructure to maintain trust and competitiveness in an increasingly digital financial environment.
Key Player Analysis
- Aurus Inc.
- Wirecard
- PayPal Holdings Inc.
- Global Payments Inc.
- Adyen
- Net
- Novatti Group Pty Ltd.
- Aliant Payments
- ACI Worldwide, Inc.
- Financial Software & Systems Pvt. Ltd.
Recent Developments
- In March 2025, National Payments Corporation of India (NPCI) launched BHIM 3.0, an upgraded digital payment platform with features to enhance user experience and financial inclusivity. Key updates include tools for expense splitting and tracking, a “Family Mode” for shared household expenses, a “Spends Analytics Dashboard,” and optimized performance for low-internet areas.
- In January 2025, Elon Musk-owned social media platform X is collaborating with Visa to introduce a real-time payment system, marking progress toward Musk’s long-standing goal of transforming the platform into an “everything app.”
- In September 2024, PayPal Holdings Inc. launched its PayPal Complete Payments (PPCP) platform in China, including Hong Kong, providing businesses with a robust and flexible payment solution designed to enhance global e-commerce operations.
- In December 2023, Visa Inc. declared a definitive agreement to secure a majority stake in Prosa, a prominent payments processor in Mexico, with the aim of expediting the acceptance of secure and inventive digital payments within the nation.
Shape Your Report to Specific Countries or Regions & Enjoy 30% Off!
Report Coverage
The research report offers an in-depth analysis based on Deployment Type, Organization Size, Industry Vertical and Geography. It details leading market players, providing an overview of their business, product offerings, investments, revenue streams, and key applications. Additionally, the report includes insights into the competitive environment, SWOT analysis, current market trends, as well as the primary drivers and constraints. Furthermore, it discusses various factors that have driven market expansion in recent years. The report also explores market dynamics, regulatory scenarios, and technological advancements that are shaping the industry. It assesses the impact of external factors and global economic changes on market growth. Lastly, it provides strategic recommendations for new entrants and established companies to navigate the complexities of the market.
Future Outlook
- Digital payment adoption will accelerate as consumers increasingly prefer mobile wallets and contactless transactions.
- Real-time payment infrastructure will expand globally, improving transaction speed and operational efficiency.
- Open banking frameworks will strengthen collaboration between banks and fintechs, enabling more integrated payment ecosystems.
- AI-driven fraud detection will become a core differentiator as cybersecurity threats grow more sophisticated.
- Cross-border digital payments will advance through improved interoperability and regulatory alignment.
- Super-apps will gain wider traction by integrating payments with e-commerce, mobility, and financial services.
- Merchant adoption of omnichannel payment platforms will rise to support seamless in-store and online experiences.
- Blockchain-based payment solutions will grow as institutions explore faster and more transparent settlement methods.
- Cloud-native architectures will dominate as providers modernize legacy systems for higher scalability and reliability.
- Financial inclusion initiatives will expand digital payment access across emerging markets through low-cost mobile and QR-based solutions.


