Recorded inflows dominate the value of Nigerian transfers
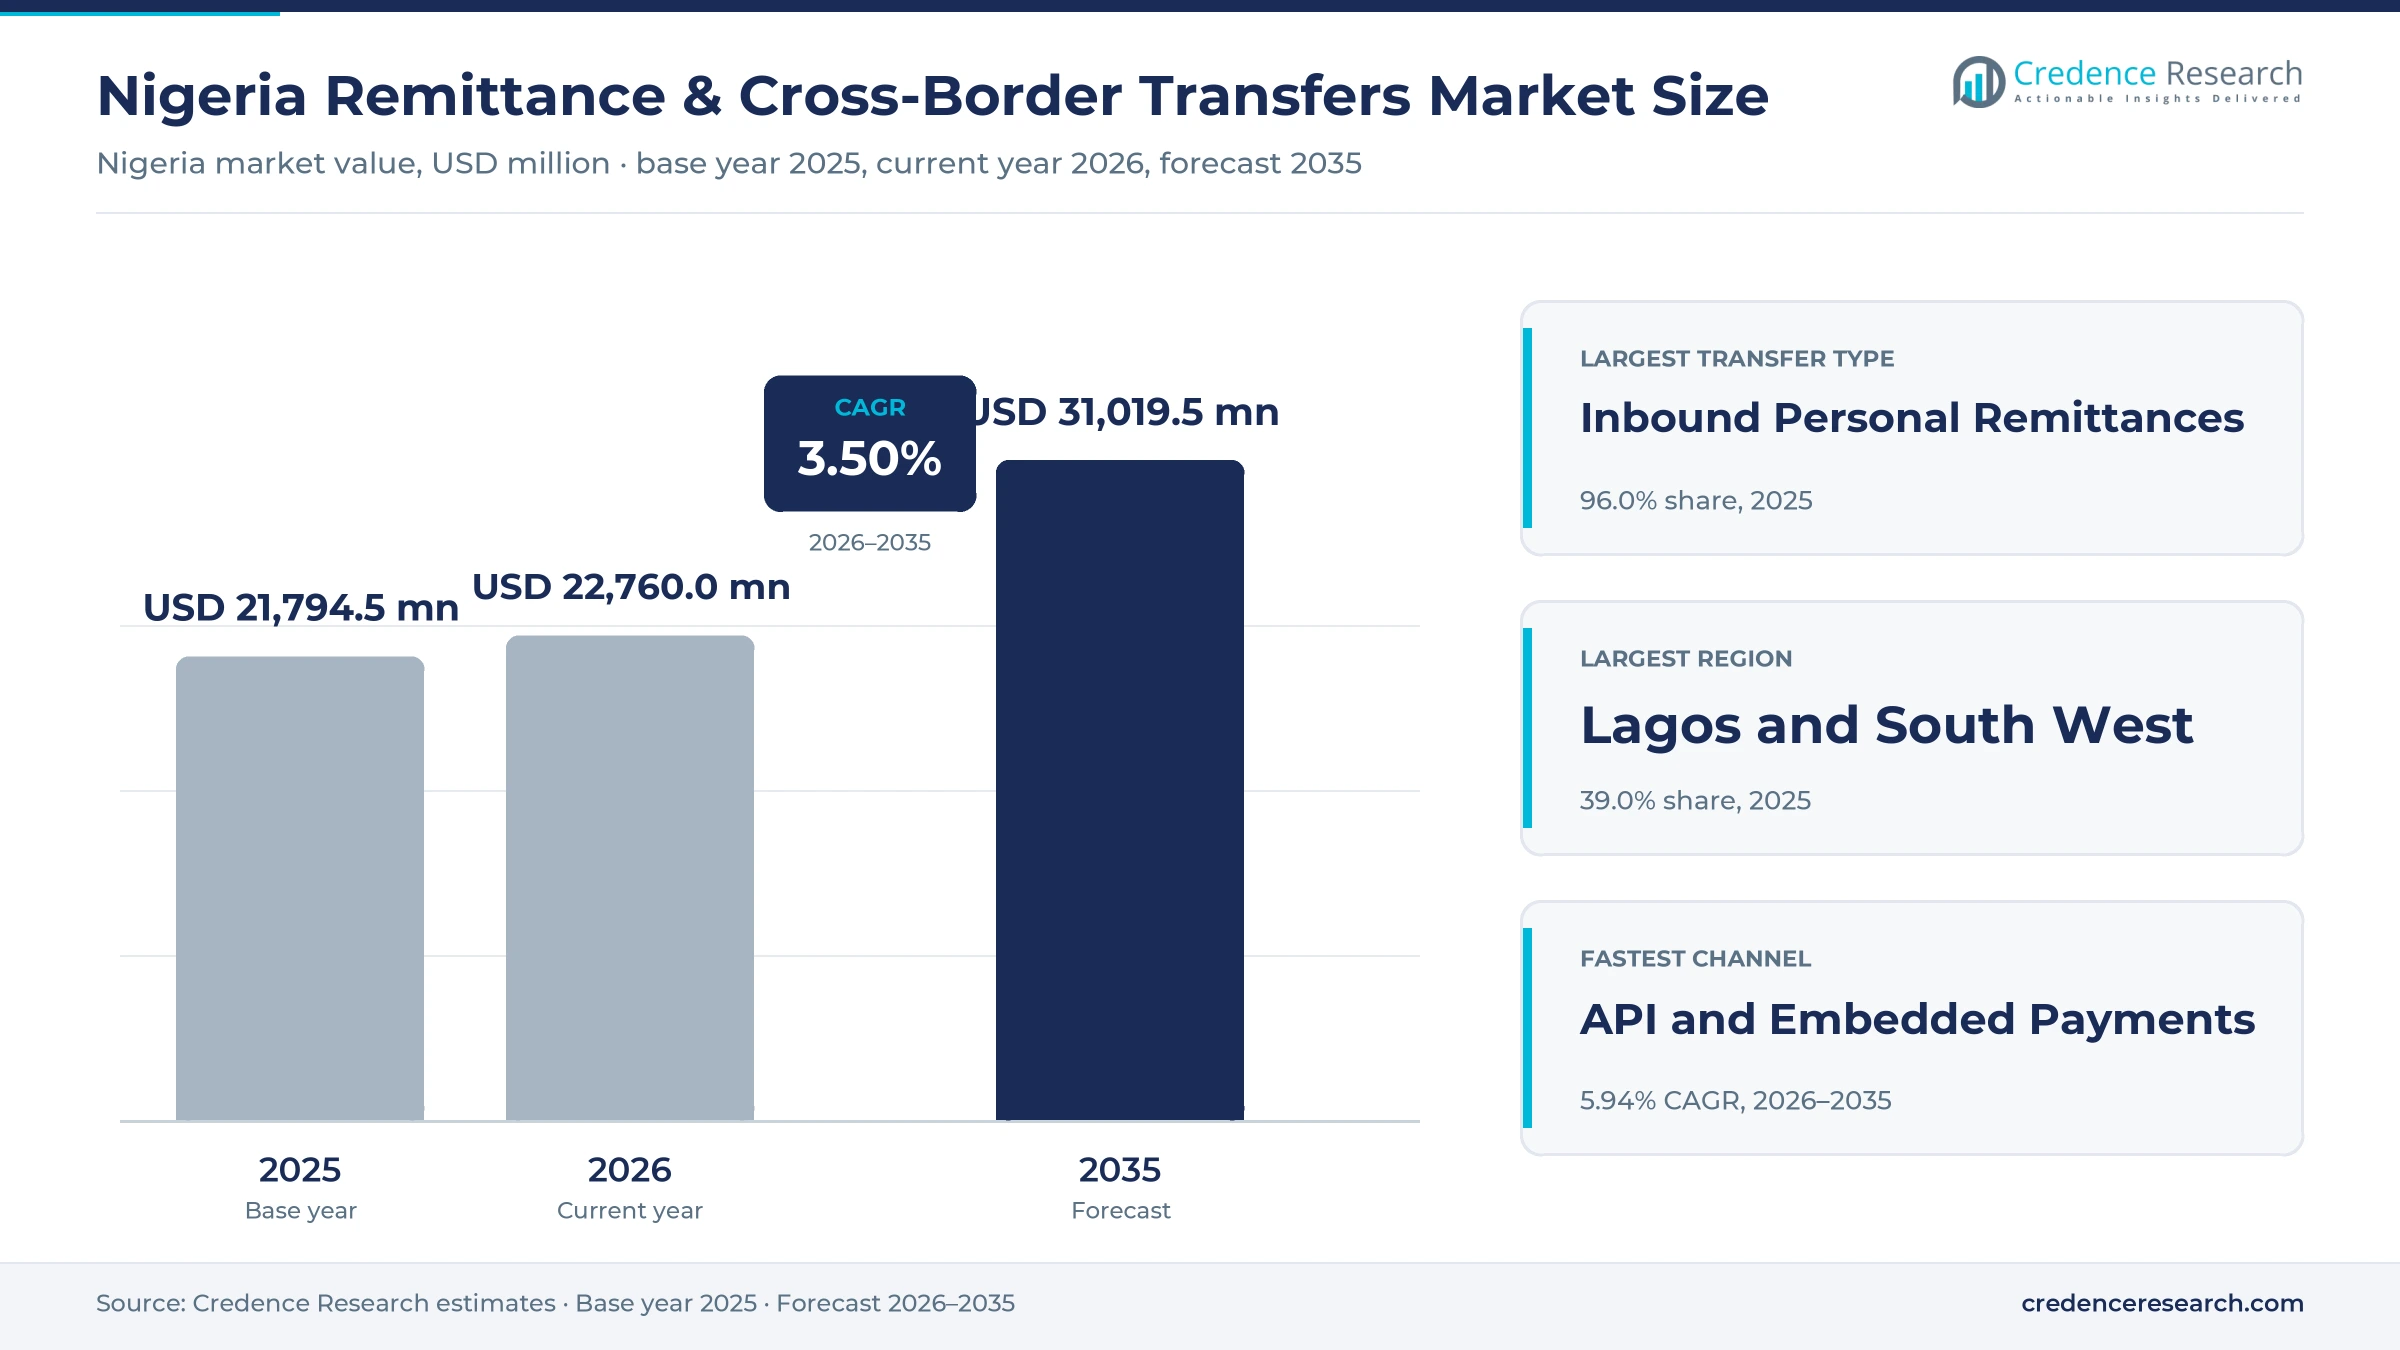
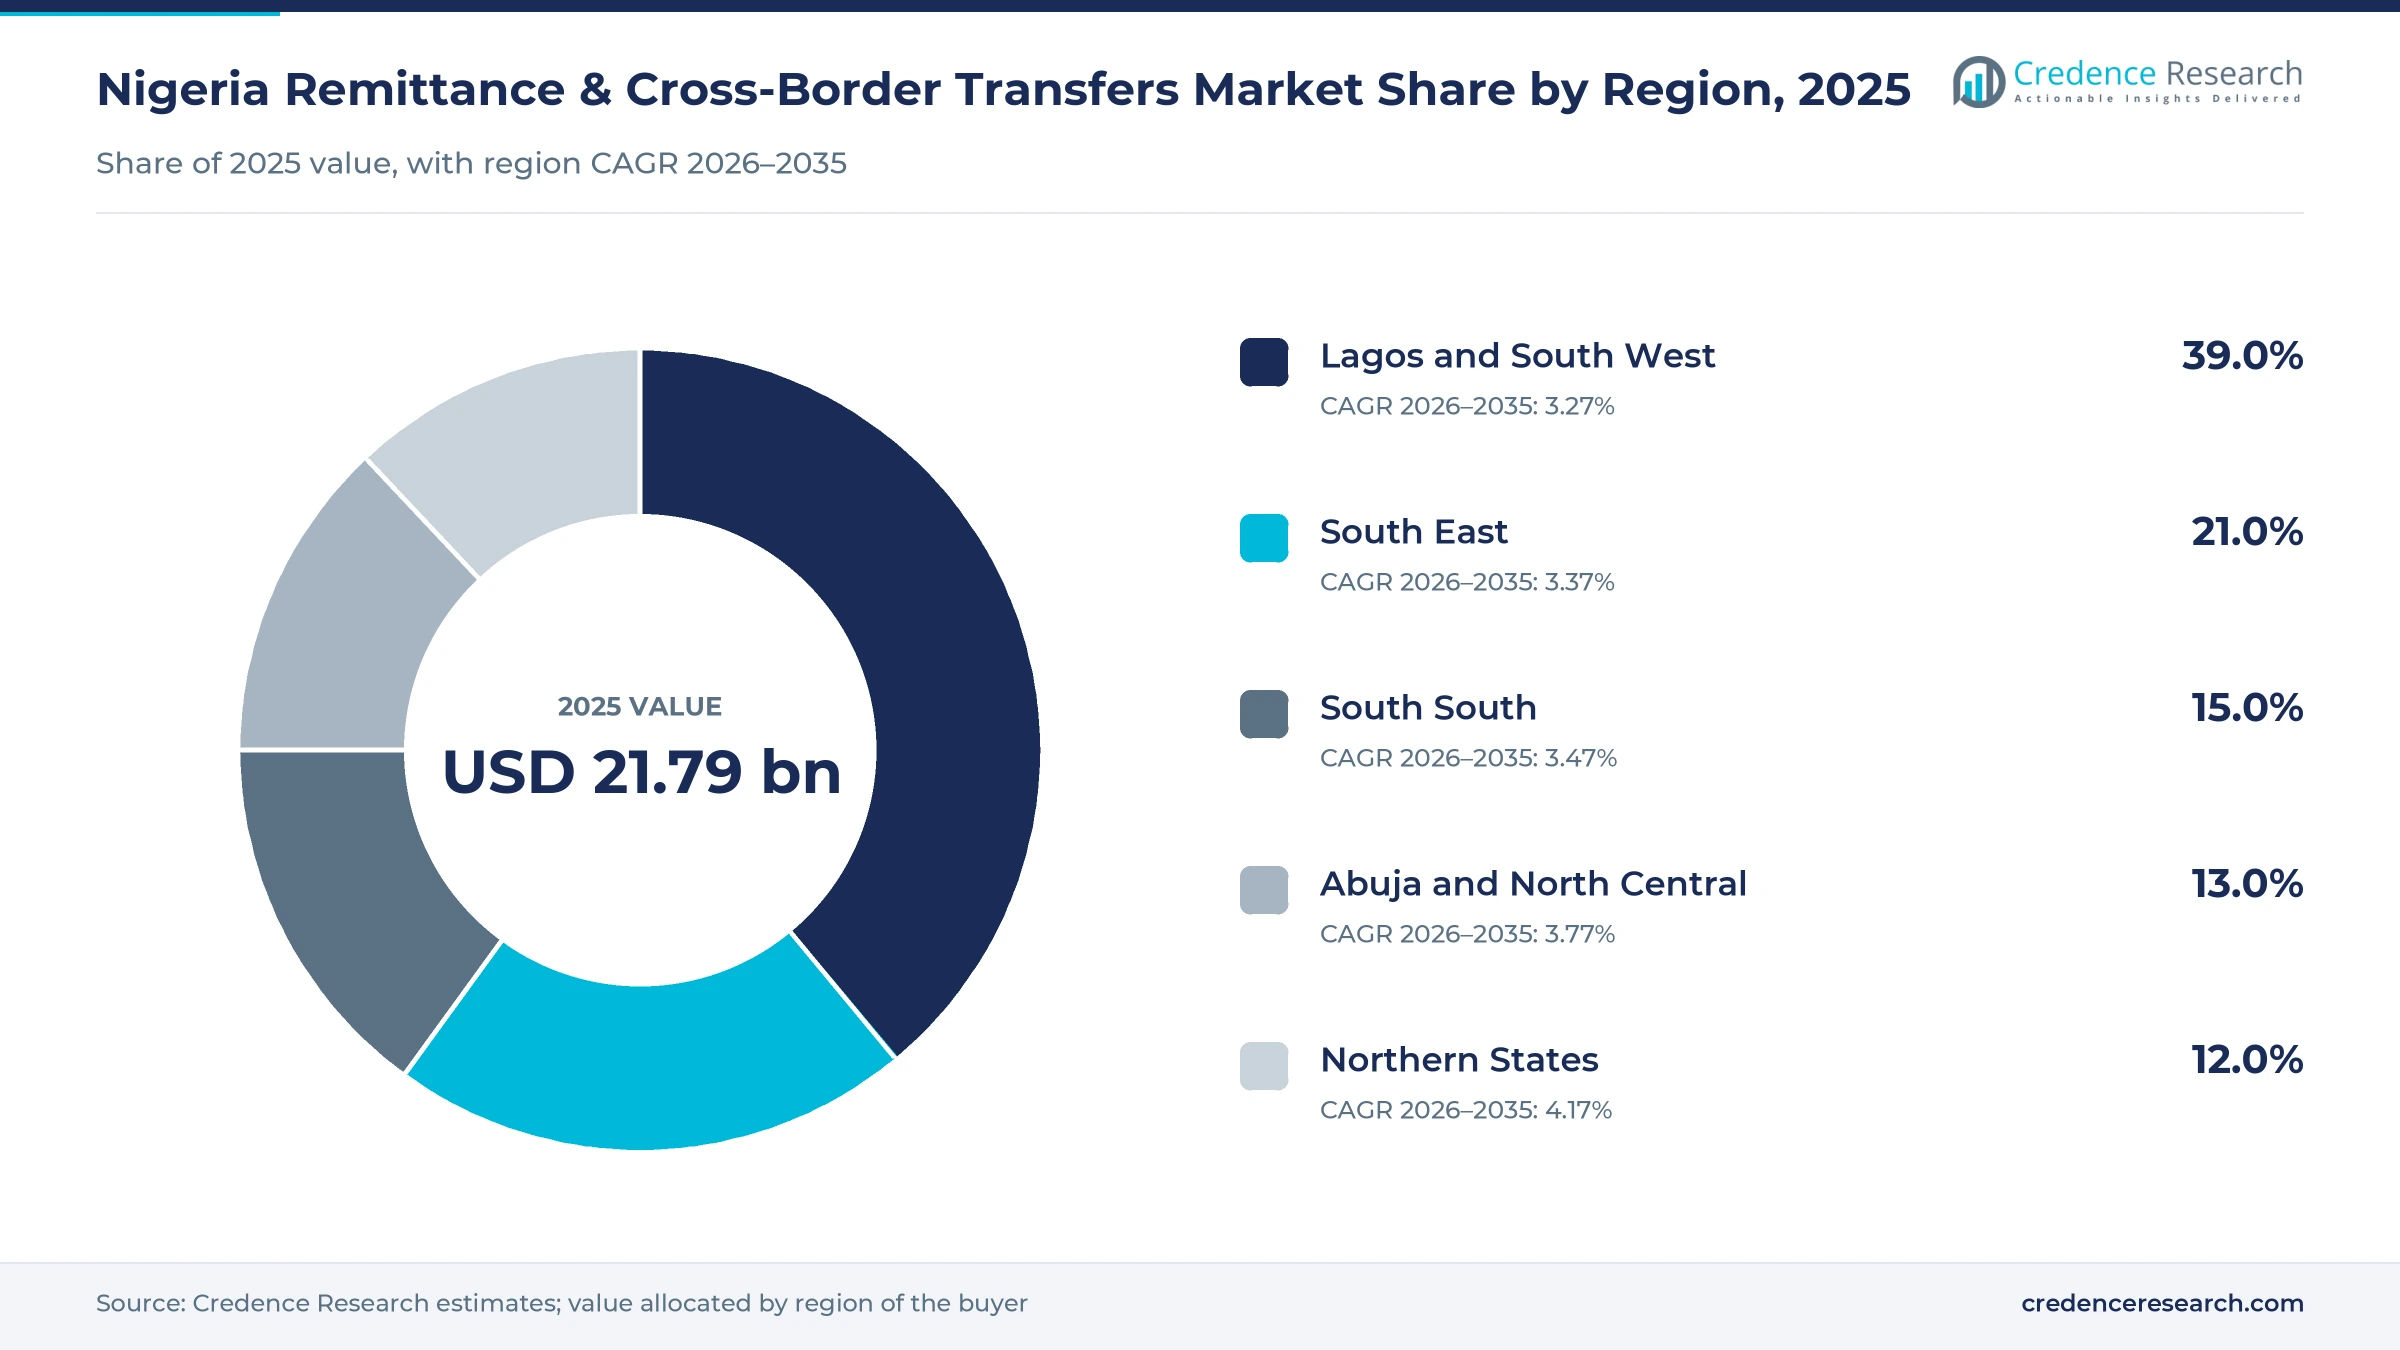
The Nigeria remittance and cross-border transfers market was valued at USD 21.79 billion in 2025 and is projected to increase from USD 22.76 billion in 2026 to USD 31.02 billion by 2035, registering a CAGR of 3.50% during 2026–2035. These figures measure the value of funds moved, not the fees providers earn. Demand rests on a diaspora that NiDCOM puts above 20 million people, whose transfers exceeded foreign direct investment in 2024. Lagos and South West held the largest regional share, 39.0% in 2025, because formal accounts and payout points are concentrated there. Northern States is the fastest-growing region at 4.17% a year as digital finance reaches adults who were excluded in earlier surveys. The Central Bank of Nigeria changed the channel most directly on May 1, 2026, when every licensed money transfer operator had to settle through naira accounts at authorized dealer banks, and recorded operator inflows reached USD 947 million in July 2026.
What does the Nigerian transfer market actually count?
This report sizes the U.S. dollar value of money moving through Nigerian personal and small-business transfer channels each year. It covers inbound personal remittances, outbound personal transfers, SME cross-border payments and diaspora investment transfers, whichever operator, bank, app or wallet carries them. The value is therefore a flow of funds and should not be read as provider revenue, which is a small fraction of it because customers pay fees and foreign-exchange spreads only on each transfer.
Large corporate trade settlement, foreign portfolio flows and oil receipts are excluded. Informal cash couriers and unrecorded stablecoin transfers are also excluded because no official series measures them, although both compete for the same customers. The value chain runs from sending-country apps and agents through correspondent and settlement networks to Nigerian banks, wallets and cash payout points.
Nigeria Remittance & Cross-Border Transfers Market Insights
- The market, measured as transfer value, was USD 21.79 billion in 2025 and is forecast to reach USD 31.02 billion by 2035, growing at 3.50% a year during 2026–2035.
- Lagos and South West held 39.0% of 2025 transfer value, while Northern States grows fastest at 4.17% a year from a low base.
- Inbound Personal Remittances made up 96.0% of 2025 value, because World Bank data shows only USD 113 million in personal transfers leaving Nigeria that year.
- Since May 1, 2026, licensed operators must run Nigerian disbursements through naira settlement accounts at authorized dealer banks, under a Central Bank of Nigeria circular dated March 24, 2026.
- Flutterwave received a Nigerian banking license in April 2026 and connected Xoom to Nigerian bank payouts in July 2026, which shows payment firms moving closer to the customer account.
Personal inflows lead while digital rails gain share
Why do inbound personal remittances dwarf other flows?
Based on transfer type, the market is categorized into inbound personal remittances, outbound personal transfers, SME cross-border payments and diaspora investment transfers. Inbound Personal Remittances led with 96.0% of 2025 value because World Bank data shows USD 22.79 billion received against only USD 113 million paid abroad that year. Credence Research anchors its value to the lower Central Bank of Nigeria personal remittance series. The January 2024 operator guidelines also bar licensed operators from outbound business, which narrows that route further. SME Cross-Border Payments grows fastest at 6.10% a year as Nairametrics reported in May 2025 that 22 Nigerian banks had joined the PAPSS local-currency settlement system.
Which customers send and receive the most value?
Based on customer segment, the market is categorized into migrant families, diaspora professionals, SMEs and online sellers, students and education sponsors, and corporate and institutional payers. Migrant Families led with 58.0% of 2025 value because Financial Nigeria cites research placing 70% of Nigerian remittances in household consumption and 30% in investment. SMEs and Online Sellers grow fastest at 5.42% a year as Flutterwave said in April 2026 that more than two million businesses would benefit from its new Nigerian banking services. Education sponsors also gained room when the June 2026 foreign exchange manual raised semester tuition remittances to USD 25,000.
How is the money reaching Nigerian recipients?
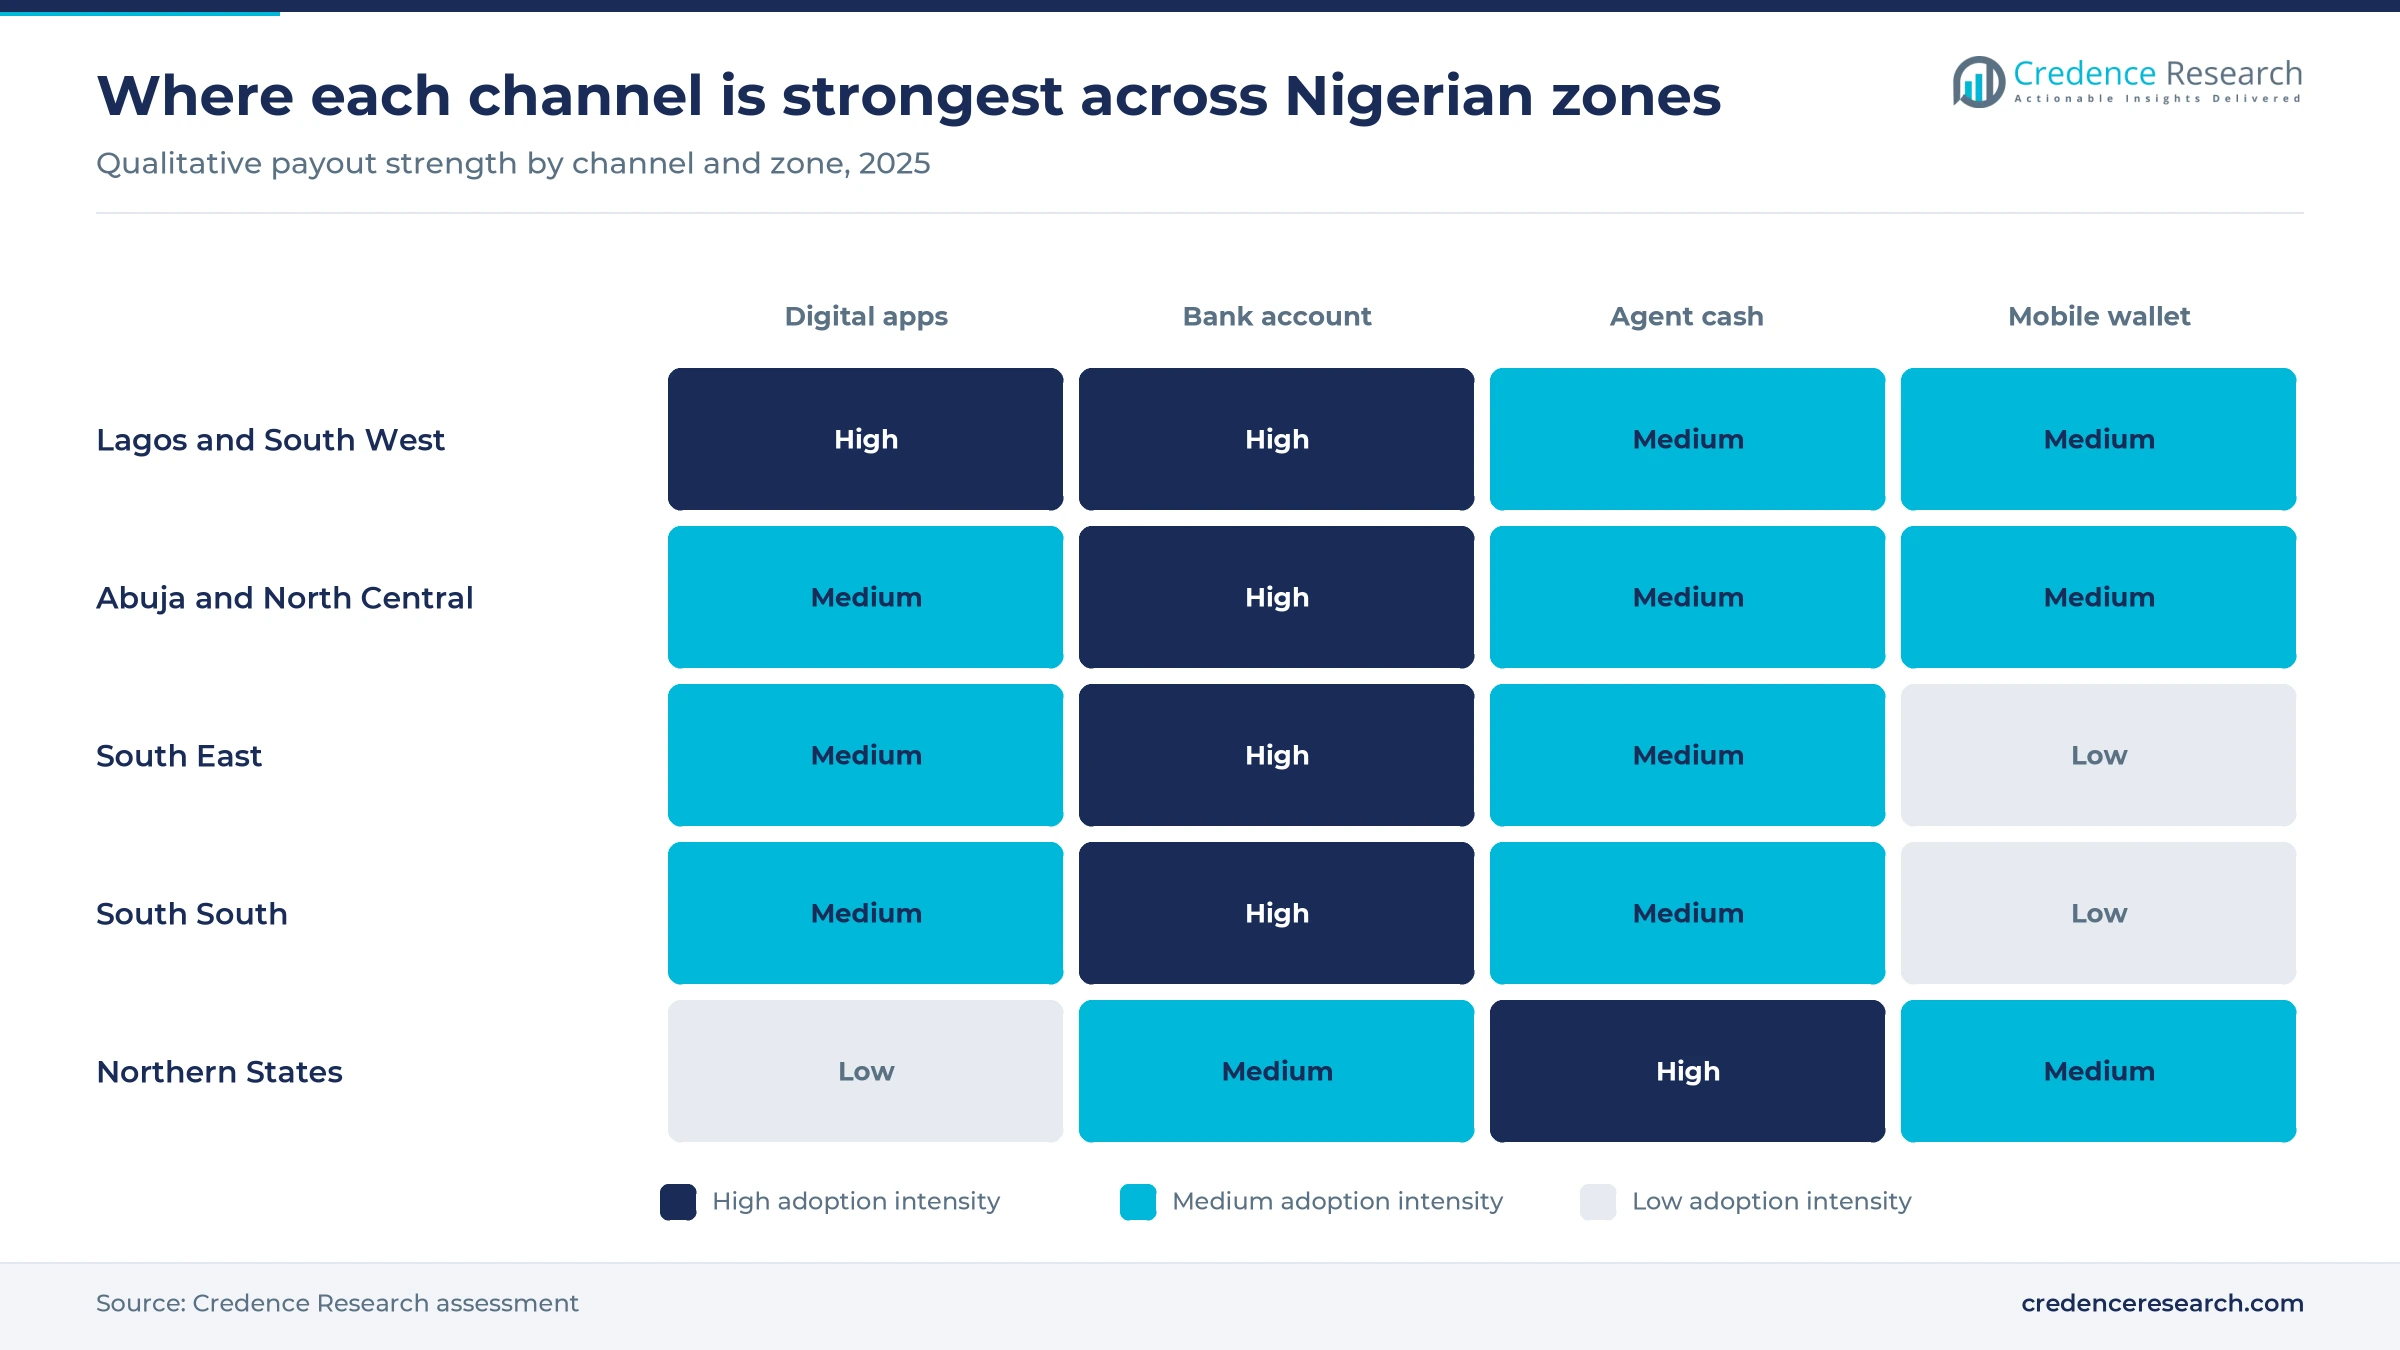
Based on distribution channel, the market is categorized into digital apps and web, bank branch and account transfer, agent and cash pickup, mobile wallets and API and embedded payments. Digital Apps and Web led with 38.0% of 2025 value because Condia reported LemFi handling more than USD 1 billion in monthly payments, with Nigeria its largest market. Cash remains capped, since the 2024 guidelines send payouts above USD 200 to accounts. Taptap Send and some other apps also pay into mobile wallets in Nigeria. API and Embedded Payments grow fastest at 5.94% a year as Xoom connected to Flutterwave's Nigerian bank payout rails in July 2026.
Which institutions carry the largest share of value?
Based on institution type, the market is categorized into international money transfer operators, deposit money banks, fintech and payment service providers, mobile money operators and correspondent and settlement networks. Deposit Money Banks led with 44.0% of 2025 value because the Central Bank of Nigeria reported USD 4.73 billion through formal operator channels in 2024 against about USD 21 billion in total inflows. Banks have also held the settlement accounts of operators since May 2026. Fintech and Payment Service Providers grow fastest at 5.48% a year as fintech companies such as Pesa, which Condia reported licensed in August 2025, gain direct access.
| Segment Group | Leading Sub-segment | Share, 2025 | Fastest-growing Sub-segment | CAGR, 2026–2035 |
|---|---|---|---|---|
| By Transfer Type | Inbound Personal Remittances | 96.0% | SME Cross-Border Payments | 6.10% |
| By Customer Segment | Migrant Families | 58.0% | SMEs and Online Sellers | 5.42% |
| By Distribution Channel | Digital Apps and Web | 38.0% | API and Embedded Payments | 5.94% |
| By Institution Type | Deposit Money Banks | 44.0% | Fintech and Payment Service Providers | 5.48% |
Request a Free Sample
Fill in your details and we'll send you a free sample report.
- Sample data tables & charts
- Research methodology
Diaspora scale and FX reform lift recorded flows
Large and economically active Nigerian diaspora
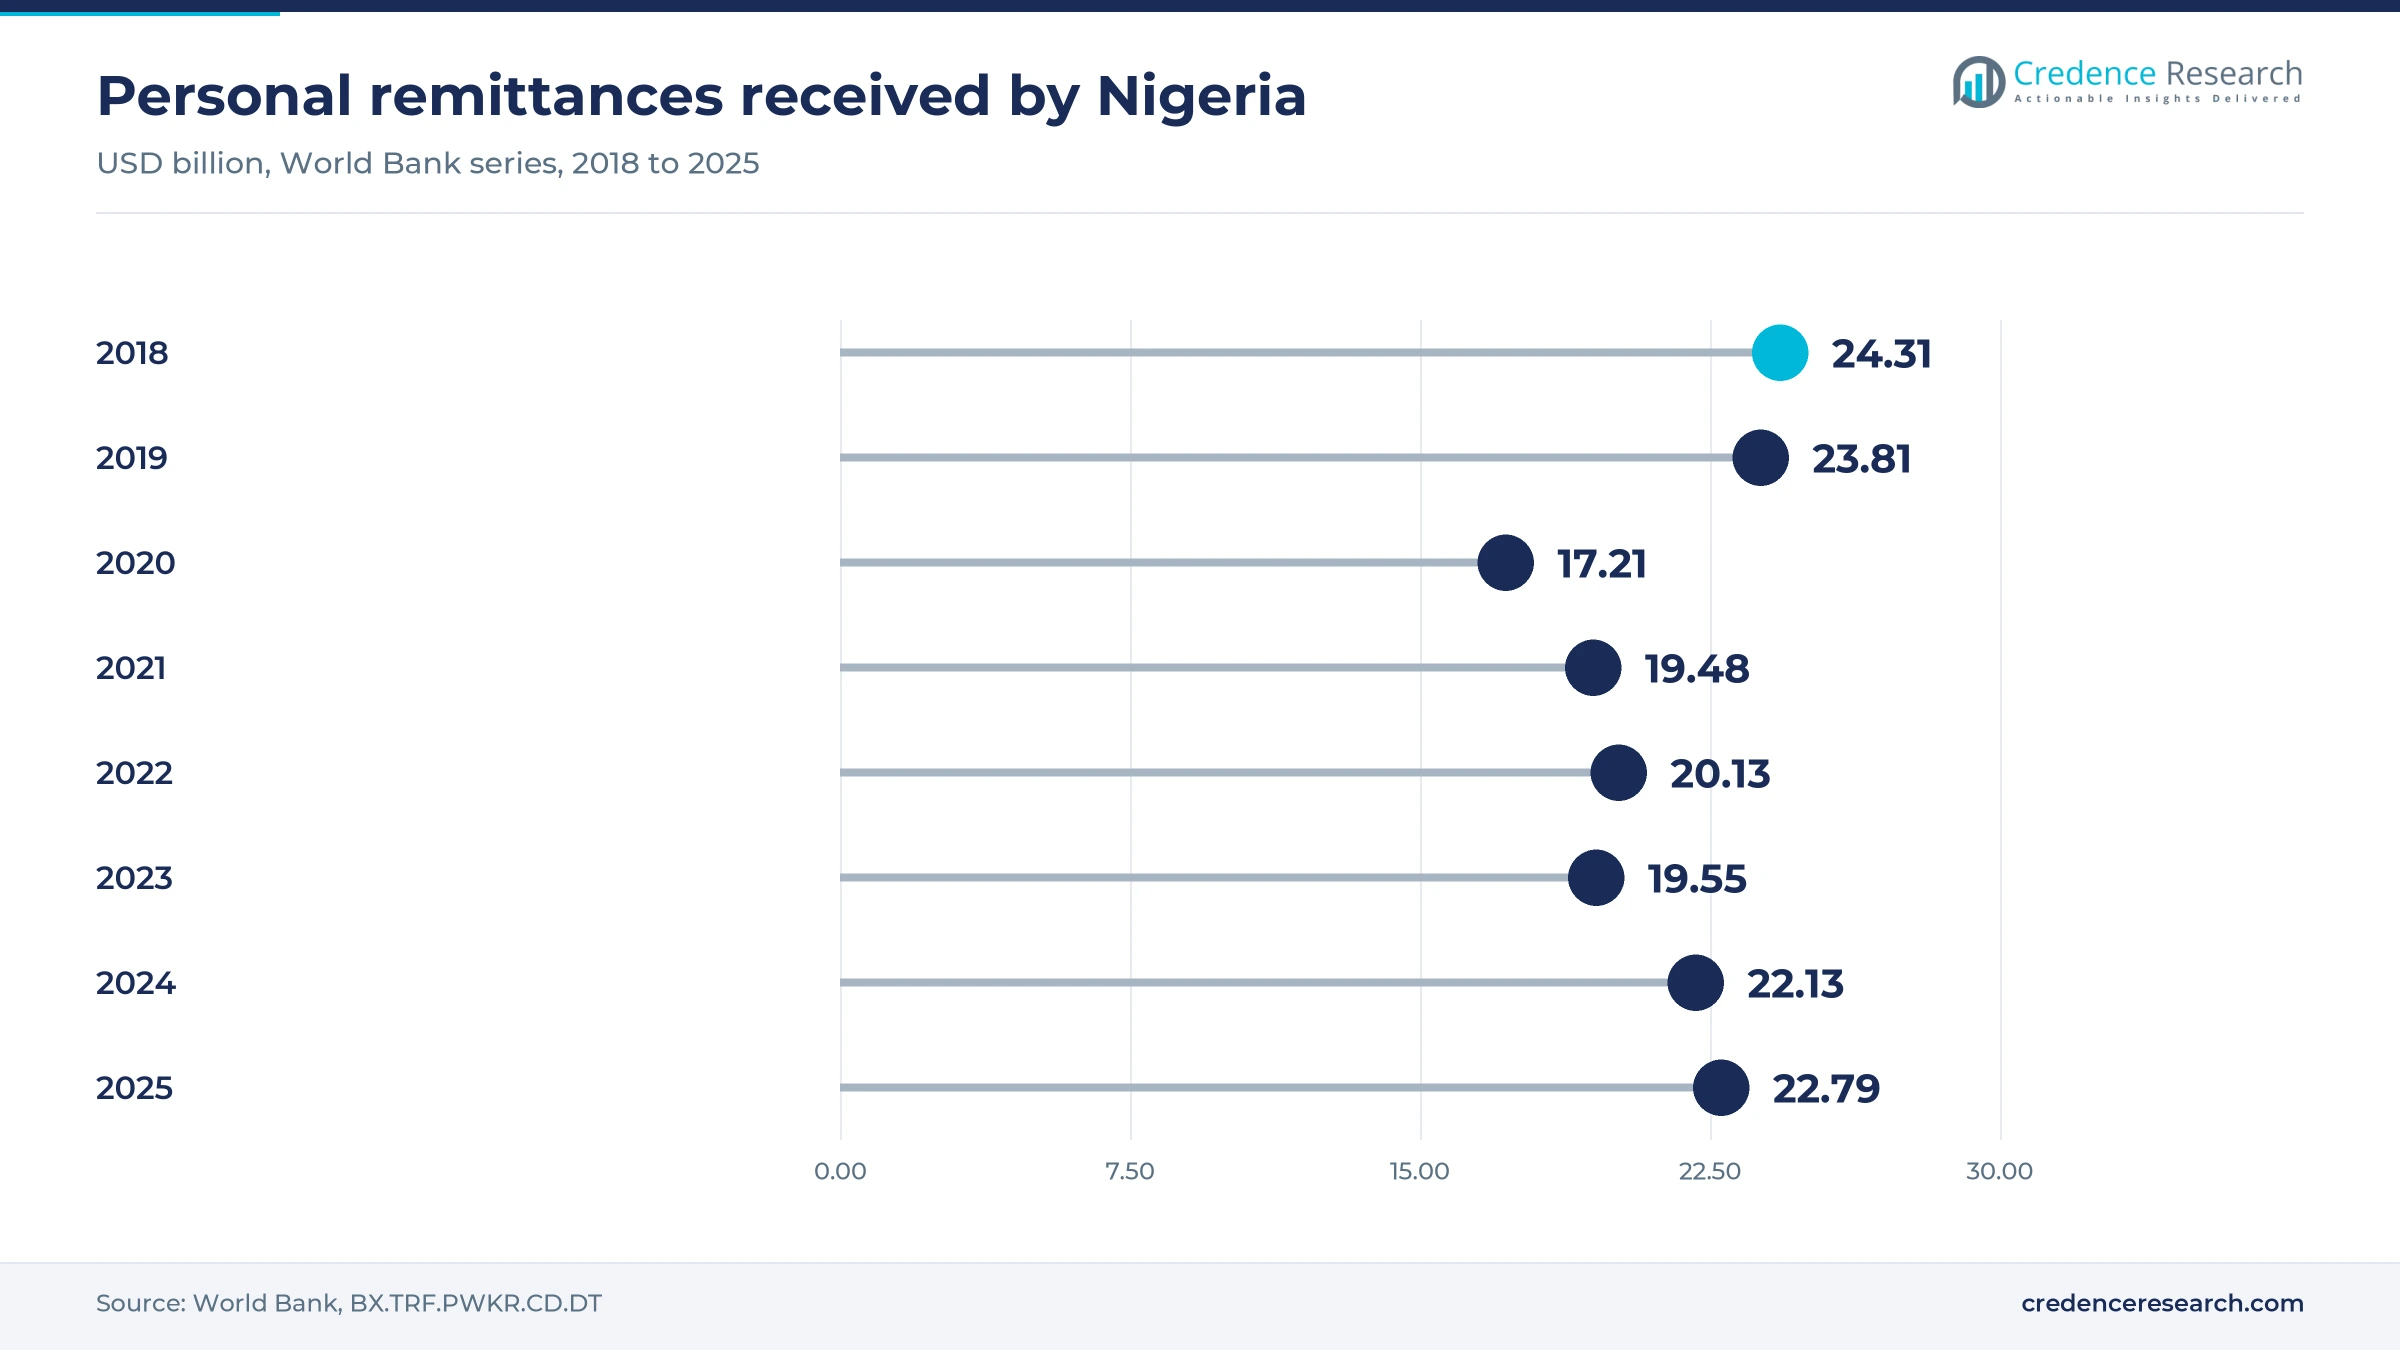
The size and earning power of Nigerians abroad remain the main growth driver for cross-border transfers. NiDCOM chairman Abike Dabiri-Erewa said in July 2025 that more than 20 million Nigerians live overseas and that they sent over USD 20 billion home in 2024, more than foreign direct investment that year. World Bank data records USD 22.79 billion received in 2025, equal to 7.84% of GDP, up from USD 19.55 billion in 2023. Arbiterz estimated in April 2026 that the United States supplied USD 7.5 billion to USD 8.5 billion of the 2025 total and the United Kingdom USD 3.5 billion to USD 4.5 billion. As a result, wage conditions in two corridors shape much of the annual flow.
Digital financial infrastructure expansion
Wider digital access boosts app-based sending because recipients can take funds without visiting a branch. The EFInA Access to Financial Services survey, reported by the News Agency of Nigeria in September 2026, found digital financial service use at 64.4% of adults, up from 45% in 2023 and 34% in 2020. Formal inclusion reached 73% of adults in the same EFInA survey. On the sending side, Nairametrics reported in August 2025 that Remitly pays out to more than 570 Nigerian financial institutions. Recipients can then move funds through digital payments at home, which reduces the need for cash collection and supports adoption of account-based transfers.
Policy support for formal remittance channels
Central bank policy has given senders a stronger reason to use recorded channels since the 2023 exchange-rate reform. The Central Bank of Nigeria said formal inflows rose from USD 3.3 billion in 2023 to USD 4.73 billion in 2024, and it launched the Non-Resident Bank Verification Number platform with NIBSS on May 13, 2025. Operator inflows then reached a record USD 947 million in July 2026, with January through July up 50.2% from a year earlier, according to the central bank. Governor Olayemi Cardoso has set a target of USD 1 billion a month by the end of 2026. This policy mainly enlarges the recorded share, so it lifts operator volumes faster than total inflows.
Lower compliance friction after the FATF exit
Lower compliance friction supports both correspondent access and sender confidence. The Financial Action Task Force removed Nigeria from its grey list on Oct. 24, 2025, ending a listing that began in February 2023, and Nairametrics reported that smoother and cheaper international transactions were expected as a result. The January 2024 operator guidelines also set clear entry terms, including minimum capital of USD 1 million and an annual renewal fee of 10 million naira. Licensed entrants have followed, including Pesa in August 2025, according to Condia. These measures matter because grey-list status typically raises the cost and complexity of cross-border transactions, as global institutions apply tighter checks, so the exit should support demand for formal routes.
Formal channels and embedded rails reshape transfers
Shift from dollar payouts to naira settlement accounts
The most immediate shift is the move to a tightly supervised naira settlement structure. A circular dated March 24, 2026 requires every operator to open naira settlement accounts with authorized dealer banks by May 1, 2026, and to run beneficiary disbursements through them. Operators must also use Bloomberg BMatch prices as guidance when quoting customers. Early data shows stronger recorded flows, since the central bank's Q2 2026 bulletin put operator inflows at USD 1.57 billion against USD 1.18 billion a year earlier, according to Nairametrics in October 2026. However, that report does not attribute the rise to the rule. Operators with thin bank relationships now face more onboarding work than the larger networks.
Rise of embedded payout rails and bank-licensed fintechs
Payment firms are moving from behind-the-scenes processors to account holders in their own right. The Fintech Times reported in April 2026 that Flutterwave had secured a Nigerian banking license, which lets it hold deposits without relying on a sponsor bank for clearing access. It also reported more than USD 40 billion in payments processed to date by the company and over 1 million SendApp users, with more than 2 million businesses expected to benefit. In July 2026, Brandspur reported that PayPal's Xoom would send funds into Nigerian bank accounts through Flutterwave's infrastructure, settling in naira at banks including Access Bank, UBA and Zenith Bank. As a result, global senders can reach local accounts without building local rails, and API and Embedded Payments gain share at 5.94% a year.
Opportunity in diaspora investment and non-resident accounts
The clearest opening for new products is diaspora saving and investing rather than consumption transfers. Financial Nigeria cites research placing about 30% of remittances in investment, which implies several billion dollars a year on recorded receipts. The Central Bank of Nigeria's Non-Resident Ordinary Account and Non-Resident Nigerian Investment Account now connect diaspora customers to savings, mortgages, insurance, pensions and capital markets, with repatriation of investment proceeds allowed, according to The Gazette in May 2025, when the platform launched on May 13. The central bank invited banks, fintechs and operators to integrate with its remote verification platform at that launch. For providers, online banking products built on this structure could convert one-way senders into multi-product customers, and diaspora investment transfers grow faster than personal flows.
Opportunity in SME payments across African borders
Small exporters and online sellers offer a second opening because their needs differ from family remittances. Nairametrics reported in May 2025 that 22 Nigerian commercial banks were fully onboarded on the Pan-African Payment and Settlement System, the most of any listed country, ahead of Ghana with 19 banks. The system links 16 African countries and more than 150 banks and supports local-currency payments. A simplified documentation threshold of USD 5,000 applies to corporate users under the central bank circular cited in that report. The IMF said in June 2026 that small firms already use stablecoins to pay overseas suppliers, a role that overlaps with crypto payment gateways and shows unmet demand. Consequently, SME Cross-Border Payments grow fastest among transfer types at 6.10% a year.
Cost, tax and stablecoin leakage limit recorded growth
Transfer costs remain above the global average
Cost remains the clearest barrier to moving flows into recorded channels. World Bank Remittance Prices Worldwide data for Q3 2025, cited by Brandspur in May 2026, put the average cost of sending money to Sub-Saharan Africa at 8.46% against 6.36% globally, with banks charging close to 15%. Low-income families sending small sums feel this most, because fixed fees take a larger share. Providers respond with no-fee apps, although exchange-rate margins can still reduce what recipients receive.
The U.S. remittance tax raises cash-funded costs
The largest sending corridor gained a new charge when the U.S. 1% remittance tax took effect on Jan. 1, 2026. WorldRemit explains that the charge falls on cash, money orders and cashier's checks, while transfers funded from U.S. bank accounts and cards are exempt. Agent-based senders without U.S. bank accounts therefore carry the added cost. Because Arbiterz estimates that roughly a third of Nigerian inflows originate in the United States, cash-based networks face the most pressure, and many customers may migrate toward app-based sending.
Stablecoins divert flows outside recorded channels
Stablecoins compete directly with licensed channels and make the true flow harder to measure. The IMF reported in June 2026 that Nigeria received about USD 59 billion in crypto-asset inflows between July 2023 and June 2024, and it holds about 60% of Sub-Saharan Africa's stablecoin inflows since 2019. Households and small firms use these tokens for remittances and supplier payments. Regulators and licensed operators are therefore both affected, since some value leaves official statistics. The Securities and Exchange Commission has issued rules for virtual asset providers, which may bring part of it into view.
Fraud and compliance costs weigh on onboarding
Fraud risk raises onboarding and monitoring costs across the digital channel. NIBSS reported digital payment fraud losses of 25.85 billion naira in 2025, down 51% from 52.26 billion naira in 2024, according to The Guardian Nigeria, with Lagos accounting for 63.43% of activity and insider abuse the most common technique. Operators also face five-year record keeping and possible license revocation under the 2026 circular. Smaller entrants feel this burden most, so many rely on shared compliance tools and larger bank partners.
Lagos leads receipts while the North has the most headroom
| Region | Value, 2025 (USD billion) | Share, 2025 | CAGR, 2026–2035 |
|---|---|---|---|
| Lagos and South West | 8.50 | 39.0% | 3.27% |
| South East | 4.58 | 21.0% | 3.37% |
| South South | 3.27 | 15.0% | 3.47% |
| Abuja and North Central | 2.83 | 13.0% | 3.77% |
| Northern States | 2.62 | 12.0% | 4.17% |
Lagos and South West holds the largest payout base
Lagos and South West held 39.0% of 2025 value and grows at 3.27% a year. EFInA's 2023 survey found only 5% of South West adults financially excluded, the lowest of the zones reported, which gives this zone the strongest account-based payout network. Lagos State's own data shows services at 91.57% of real output in Q2 2024. The concentration of digital activity also appears in the NIBSS figures for 2025, which assign Lagos more than 60% of fraud activity.
South East receipts lean toward property and family firms
South East held 21.0% of 2025 value and grows at 3.37% a year. This is the most assumption-heavy share in the report, because no published series isolates the zone's receipts. A peer-reviewed study of the southeastern zone, published by Taylor & Francis in January 2021, found that households receiving remittances invest more in buildings, land and household businesses than other households. Credence Research places the zone second on that diaspora-linked pattern. Growth is set slightly below the national pace as a cautious assumption rather than a measured result. Further upside could come from the non-resident accounts launched in May 2025, which link diaspora money to mortgages and savings.
Rivers and Delta anchor strong southern account access
South South held 15.0% of 2025 value and grows at 3.47% a year. EFInA's 2023 survey put financial exclusion in the zone at 10%, well below the northern zones, which supports account credit over cash collection. Rivers and Delta each recorded between about 2% and 2.5% of national digital fraud activity in NIBSS data for 2025, which suggests a meaningful digital base outside Lagos. Account-based payout therefore fits this zone better than cash, and the 2024 rule sending payouts above USD 200 to accounts reinforces that pattern.
Abuja and North Central gains from federal-capital incomes
Abuja and North Central held 13.0% of 2025 value and grows at 3.77% a year. The Federal Capital Territory recorded 3.12% of national digital fraud activity in NIBSS data for 2025, the second-highest figure cited, which indicates a substantial digital payments base. The NRBVN platform was also launched in Abuja on May 13, 2025, by the central bank. The wider North Central zone remains less served, so growth depends on wallets and agents reaching beyond the capital.
Northern States offers headroom from a low base
Northern States held 12.0% of 2025 value and grows fastest at 4.17% a year. EFInA's 2023 survey put exclusion in the North West at 47%, far above the South West, which leaves the widest gap between payout demand and account access. Rural adults also face far weaker access, with 37% excluded against 17% in cities. As national digital finance use climbs to 64.4%, wallets and agents can formalize more of this flow.
Rules and licenses dated 2024 to 2026 reset the channel
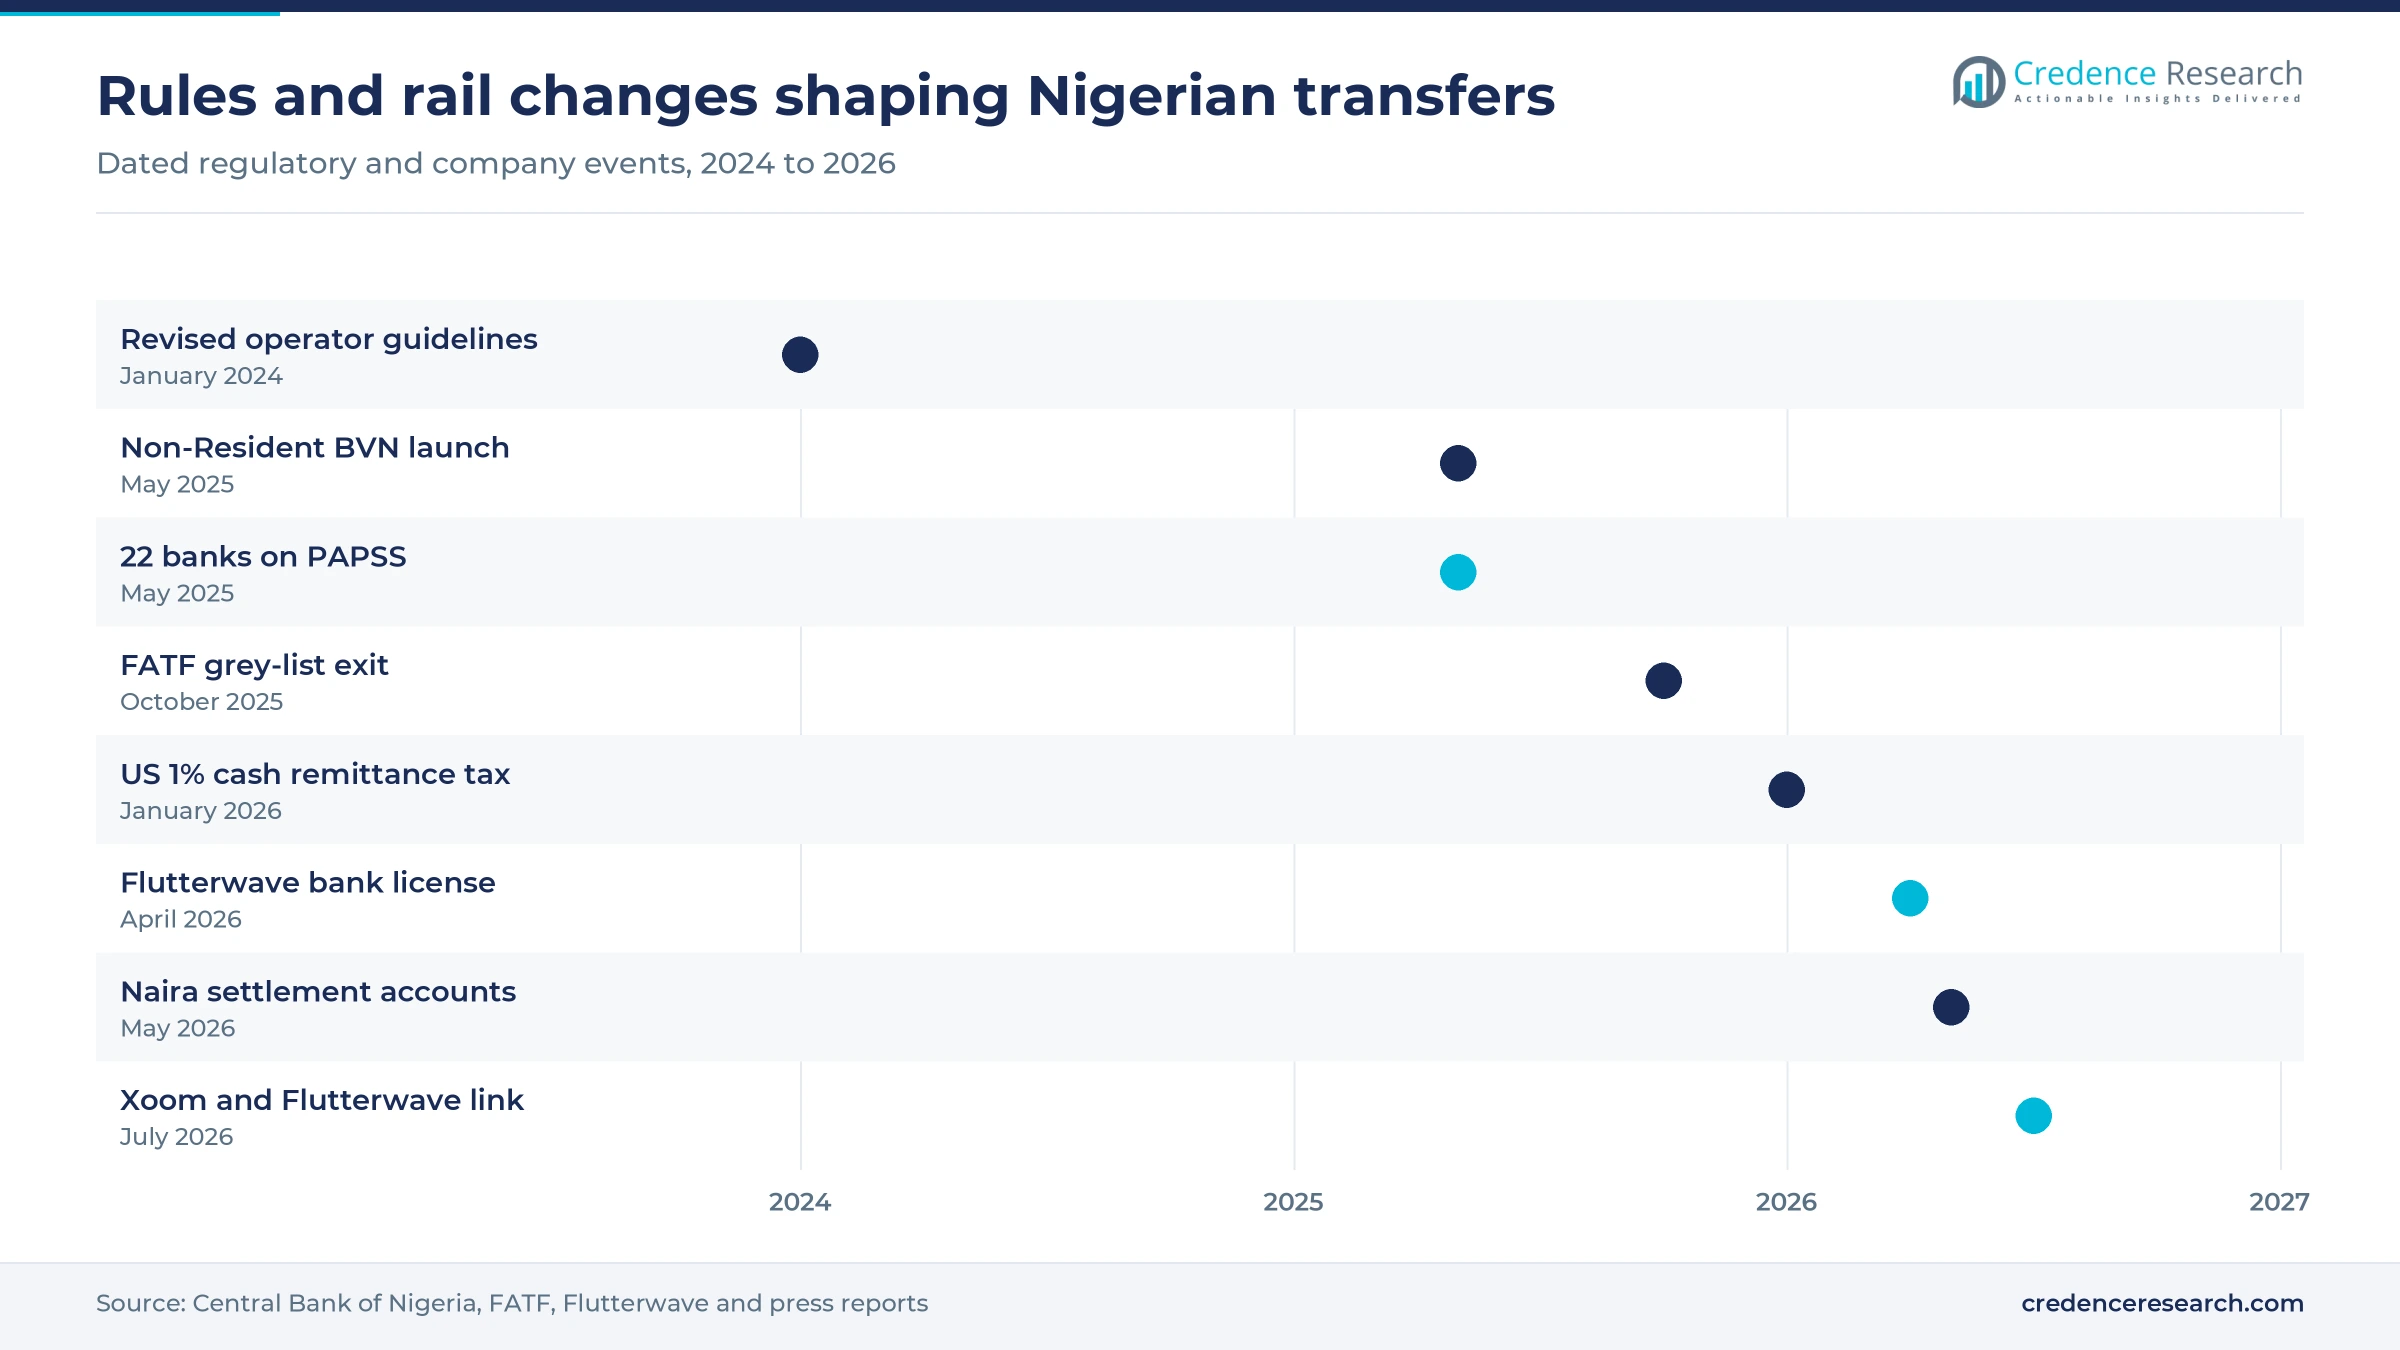
| Development | Status and market relevance |
|---|---|
| In January 2024, the Central Bank of Nigeria released revised guidelines for international money transfer services, setting USD 1 million minimum capital and removing outbound business. | In force; it still frames who may operate. |
| In May 2025, the Central Bank of Nigeria and NIBSS launched the Non-Resident Bank Verification Number platform in Abuja. | Live; banks, fintechs and operators were invited to integrate. |
| In October 2025, the Financial Action Task Force removed Nigeria from its grey list after listing it in February 2023. | Completed; expected to ease cross-border scrutiny. |
| In April 2026, The Fintech Times reported that Flutterwave had secured a Nigerian banking license. | Granted; deposit and account products are planned. |
| In May 2026, the Central Bank of Nigeria required licensed operators to use naira settlement accounts under its March 2026 circular. | In force; noncompliance can lead to license revocation. |
Settlement rails decide who can pay out faster
- Non-Resident BVN lets Nigerians abroad obtain a bank verification number remotely, which removes the physical visit that previously blocked many diaspora accounts.
- Bloomberg BMatch pricing gives operators a real-time reference that the central bank expects them to use when quoting transfers to customers and dealer banks.
- PAPSS settles African cross-border payments in local currency across 16 countries, reducing reliance on the U.S. dollar for regional trade payments.
- Payment APIs connect foreign senders such as Xoom to Nigerian bank accounts through a local partner, so a global brand need not build its own payout network.
- Stablecoin settlement moves value in minutes according to the IMF, and Flutterwave says it is exploring it, although it remains outside most official series.
Need a Custom Version of This Report?
Tailor the scope, geography, or segments to your exact requirements.
- Custom geography or segment scope
- Direct access to our analyst team
Apps, banks and legacy operators compete on payout
Competition splits by the part of the route each firm controls. Western Union and MoneyGram are the major operators named in coverage of the March 2026 naira rule, and Western Union partnered with Paga in March 2014 to credit Paga accounts. Digital senders compete mainly on price, speed and payout reach. LemFi sends from Canada, the U.K. and the U.S. and counts Nigeria as its largest market, while Taptap Send serves the U.K. to Nigeria corridor with no stated transfer fee, according to Nairametrics in August 2025. Remitly lists more than 570 Nigerian institutions for payout, Sendwave also advertises no transfer fees, and WorldRemit says its transfers are fully digital. Flutterwave now operates on both sides, holding a banking license and serving Xoom. Advantage increasingly depends on naira liquidity, bank relationships and compliance capacity.
Companies profiled and their roles in this market
| Company | Type | Role in the market |
|---|---|---|
| Western Union | Money transfer operator | On the Central Bank of Nigeria approved operator list as of April 2021; Paga account payout partnership dated March 2014 |
| MoneyGram | Money transfer operator | On the Central Bank of Nigeria approved operator list as of April 2021; named by Legit.ng in 2026 among major operators |
| Remitly | Digital sender | More than 570 Nigerian institutions for payout, according to Nairametrics in August 2025 |
| WorldRemit | Digital sender | Describes its transfers as fully digital and outside the U.S. cash remittance tax |
| Sendwave | Digital sender | Lists Nigeria among destinations and advertises no transfer fees, according to Nairametrics in August 2025 |
| LemFi | Digital sender | Nigeria is its largest market; USD 53 million Series B in January 2025, according to Condia |
| Taptap Send | Digital sender | U.K. to Nigeria corridor with bank and wallet payout options, according to Condia and Nairametrics |
| Flutterwave | Payment provider and bank | Nigerian banking license in April 2026; Xoom payout partner from July 2026 |
| Paga | Mobile wallet | Western Union partnership in March 2014 credited transfers to Paga accounts |
Formalization is not the same as new money
Credence Research's view is that buyers of Nigerian cross-border transfers data should separate two stories. Recorded operator flows are rising sharply, with January through July 2026 up 50.2%, yet World Bank data shows total receipts in 2025 still below the 2018 peak of USD 24.31 billion. Much of the operator gain is therefore a shift from informal routes into official ones. That shift is valuable for banks, licensed operators and the central bank, but it does not double the underlying flow. Providers should plan around share capture and account relationships rather than a fast-growing pool of money.
How the Credence Research estimate was built
The report uses 2025 as the base year, 2026 as the first forecast year and 2035 as the end of the forecast. Market values come from the Credence Research model and measure transfer value, not provider revenue. The 2025 base follows the Central Bank of Nigeria personal remittance series, which is lower than the World Bank figure. The model was checked against World Bank remittance series, Central Bank of Nigeria balance of payments and operator data, and implied provider fees. The 2026 value reflects first-half personal transfers plus the second-quarter pace for the rest of the year. Regional, segment and channel splits in this report are Credence Research estimates. Sources used include World Bank and IMF data, central bank statements as reported by Nigerian media, legal firm summaries and company disclosures. No interviews or primary surveys were conducted by Credence Research for this report.
Steady flows with a larger recorded share to 2035
To 2035, the market should keep growing steadily rather than sharply, reaching USD 31.02 billion as diaspora earnings rise and recorded channels capture more of the flow. The central bank's monthly inflow target is close, but it concerns operator inflows and not total receipts of cross-border transfers. Stablecoin regulation, the U.S. tax and naira stability will decide how much value stays in official channels. Providers with bank-grade compliance, local settlement and products beyond one-way transfers are best placed. Northern wallet expansion and non-resident investment accounts offer the largest untapped value over the period.
Frequently Asked Questions
How big is the Nigeria remittance and cross-border transfers market?
Does the market size show provider revenue?
Which transfer type is largest?
Which region leads transfer value?
What changed for money transfer operators in 2026?
What is growing fastest by channel?
Why does the forecast grow slower than recent operator data?
Which companies are active in this market?
Table of Content
Chapter 1 Market Segmentation
- 1.1 Segmentation Framework
- 1.1.1 Product and Service Classification
- 1.1.2 Application and End-Use Classification
- 1.1.3 Technology and Solution Classification
- 1.1.4 Customer and Distribution Channel Classification
- 1.1.5 Geographic Segmentation
- 1.1.6 Market Segment Definitions and Boundaries
- 1.2 By Transfer Type
- 1.2.1 Inbound Personal Remittances
- 1.2.2 Outbound Personal Transfers
- 1.2.3 SME Cross-Border Payments
- 1.2.4 Diaspora Investment Transfers
- 1.3 By Customer Segment
- 1.3.1 Migrant Families
- 1.3.2 Diaspora Professionals
- 1.3.3 SMEs and Online Sellers
- 1.3.4 Students and Education Sponsors
- 1.3.5 Corporate and Institutional Payers
- 1.4 By Institution Type
- 1.4.1 Deposit Money Banks
- 1.4.2 International Money Transfer Operators
- 1.4.3 Fintech and Payment Service Providers
- 1.4.4 Mobile Money Operators
- 1.4.5 Correspondent and Settlement Networks
Chapter 2 Introduction
- 2.1 Report Objectives and Scope
- 2.2 Product Definition and Industry Terminology
- 2.3 Market Inclusions and Exclusions
- 2.4 Research Process
- 2.4.1 Primary Research and Expert Interviews
- 2.4.2 Secondary Research and Source Review
- 2.4.3 Top-Down and Bottom-Up Estimation
- 2.4.4 Data Triangulation and Verification
- 2.5 Market Size Measurement Basis
- 2.5.1 2025: USD 21.79 billion → 2035: USD 31.02 billion
- 2.6 Historical and Forecast Reference Periods
- 2.6.1 Historical Period: 2018-2025
- 2.6.2 Base Year: 2025
- 2.6.3 Forecast Period: 2025-2035
- 2.7 Research Assumptions and Limitations
Chapter 3 Executive Summary
- 3.1 Market Snapshot and Key Findings
- 3.2 Base-Year Market Size, 2025
- 3.3 Forecast Market Size, 2035
- 3.4 Revenue and Volume Growth Outlook
- 3.5 Key Demand and Supply Indicators
- 3.6 Leading Market Segments
- 3.7 Fastest-Growing Market Opportunities
- 3.8 Regional Performance Highlights
- 3.9 Technology and Industry Transformation
- 3.10 Competitive Landscape Summary
- 3.11 Analyst View and Strategic Implications
Chapter 4 Nigeria Remittance & Cross-Border Transfers Market Trends and Developments
- 4.1 Historical Industry Development, 2018-2025
- 4.2 Recent Market Trends and Developments
- 4.3 Demand and Customer Behavior Trends
- 4.4 Technology and Product Innovation
- 4.5 Artificial Intelligence, Automation and Digitalization
- 4.6 Local Manufacturing and Supply Chain Realignment
- 4.7 Industry Partnerships, Mergers and Acquisitions
- 4.8 Sustainability and Circular Economy Developments
- 4.9 Government and Private Sector Investment Trends
- 4.10 Emerging Business Models and Commercialization
- 4.11 Industry Developments and Announcements
Chapter 5 Nigeria Remittance & Cross-Border Transfers Market Supply and Demand Analysis
- 5.1 Demand Trend and Consumption Analysis, 2018-2025
- 5.2 Demand Forecast, 2025-2035
- 5.3 Supply Chain Structure and Procurement Trends
- 5.4 Supply-Demand Gap and Bottlenecks
- 5.5 Import Dependence and Sourcing Structure
- 5.6 Regional Supply and Demand Concentration
Chapter 6 Nigeria Remittance & Cross-Border Transfers Market Pricing Analysis
- 6.1 Pricing Structure and Measurement
- 6.2 Historical Pricing Trends, 2018-2025
- 6.3 Pricing Outlook, 2025-2035
- 6.4 Pricing by Product and Market Segment
- 6.5 Geographic Pricing Differences
- 6.6 Key Input, Energy, Labor and Logistics Costs
- 6.7 Contract Pricing and Purchasing Models
- 6.8 Pricing Sensitivity and Competitive Positioning
- 6.9 Price, Margin and Profitability Implications
Chapter 7 Nigeria Remittance & Cross-Border Transfers Market Dynamics
- 7.1 Market Growth Drivers
- 7.1.1 Demand-Side Drivers
- 7.1.2 Technology and Innovation Drivers
- 7.1.3 Infrastructure and Investment Drivers
- 7.1.4 Regulatory and Policy Drivers
- 7.2 Market Restraints
- 7.2.1 Cost and Affordability Constraints
- 7.2.2 Technology and Adoption Barriers
- 7.2.3 Supply Chain and Operational Constraints
- 7.3 Market Challenges
- 7.3.1 Competitive Pressure and Margin Erosion
- 7.3.2 Skills, Infrastructure and Implementation Gaps
- 7.4 Emerging Market Opportunities
- 7.5 Market Dynamics Impact and Time-Horizon Assessment
Chapter 8 Nigeria Remittance & Cross-Border Transfers Value Chain Analysis
- 8.1 Industry Value Chain Overview
- 8.2 Upstream Suppliers and Critical Inputs
- 8.3 Technology and Component Providers
- 8.4 Manufacturing or Service Delivery
- 8.5 Distribution, Channel Partners and Integrators
- 8.6 Downstream Applications and End Users
- 8.7 Value Addition and Profit Pools
- 8.8 Vertical Integration and Outsourcing
- 8.9 Supplier Concentration and Risk
- 8.10 Supply Chain Localization and Resilience
Chapter 9 Nigeria Remittance & Cross-Border Transfers Market Regulations and Policies
- 9.1 Relevant Laws, Standards and Compliance Frameworks
- 9.2 Product, Service, Safety and Quality Requirements
- 9.3 Government Policies, Incentives and Subsidies
- 9.4 Imports, Exports and Trade Barriers
- 9.5 Public Procurement and Local Content Requirements
- 9.6 Data Protection, AI and Cybersecurity Compliance
- 9.7 Upcoming Policy Changes and Market Implications
Chapter 10 Nigeria Remittance & Cross-Border Transfers Market Hotspots and Opportunities
- 10.1 Market Opportunity Mapping and Growth Hotspots
- 10.2 High-Growth Applications and Customer Groups
- 10.3 Underserved Markets and White-Space Opportunities
- 10.4 Emerging Technology and Product Opportunities
- 10.5 New Capacity and Investment Hotspots
- 10.6 Market Entry and Expansion Opportunities
- 10.7 Distribution and Partnership Opportunities
- 10.8 Near-Term and Long-Term Commercial Potential
- 10.9 Opportunity Attractiveness and Execution Risks
Chapter 11 Nigeria Remittance & Cross-Border Transfers Market Outlook, 2025-2035
- 11.1 Market Size and Analysis
- 11.1.1 Revenue (Market Measurement: 2025: USD 21.79 billion → 2035: USD 31.02 billion)
- 11.1.2 Historical Market Size, 2018-2025
- 11.1.3 Base-Year Market Size, 2025
- 11.2 Market Forecast, 2025-2035
- 11.2.1 Revenue Forecast to 2035
- 11.2.2 CAGR and Year-on-Year Growth
- 11.2.3 Incremental Revenue Opportunity
- 11.3 Forecast Assumptions and Scenario Analysis
- 11.3.1 Base-Case Forecast
- 11.3.2 Optimistic and Conservative Scenarios
- 11.3.3 Technology, Pricing and Policy Sensitivities
- 11.4 Market Attractiveness and Growth Outlook
Chapter 12 Nigeria Remittance & Cross-Border Transfers Market Segmentation and Outlook
- 12.1 Segmentation Summary and Market Shares, 2025
- 12.2 Largest and Fastest-Growing Segments
- 12.3 By Transfer Type - Market Size and Forecast, 2025-2035
- 12.3.1 Segment Definition and Scope
- 12.3.2 Historical Market Size, 2018-2025
- 12.3.3 Revenue Forecast, 2025-2035
- 12.3.4 Base-Year Market Share, 2025
- 12.3.5 Segment CAGR and Growth Drivers
- 12.3.6 Subsegment Market Size and Forecast
- 12.3.6.1 Inbound Personal Remittances
- 12.3.6.2 Outbound Personal Transfers
- 12.3.6.3 SME Cross-Border Payments
- 12.3.6.4 Diaspora Investment Transfers
- 12.3.7 Subsegment Pricing and Adoption Trends
- 12.3.8 Leading Suppliers and Competition
- 12.3.9 Regional Demand and Opportunities
- 12.4 By Customer Segment - Market Size and Forecast, 2025-2035
- 12.4.1 Segment Definition and Scope
- 12.4.2 Historical Market Size, 2018-2025
- 12.4.3 Revenue Forecast, 2025-2035
- 12.4.4 Base-Year Market Share, 2025
- 12.4.5 Segment CAGR and Growth Drivers
- 12.4.6 Subsegment Market Size and Forecast
- 12.4.6.1 Migrant Families
- 12.4.6.2 Diaspora Professionals
- 12.4.6.3 SMEs and Online Sellers
- 12.4.6.4 Students and Education Sponsors
- 12.4.6.5 Corporate and Institutional Payers
- 12.4.7 Subsegment Pricing and Adoption Trends
- 12.4.8 Leading Suppliers and Competition
- 12.4.9 Regional Demand and Opportunities
- 12.5 By Institution Type - Market Size and Forecast, 2025-2035
- 12.5.1 Segment Definition and Scope
- 12.5.2 Historical Market Size, 2018-2025
- 12.5.3 Revenue Forecast, 2025-2035
- 12.5.4 Base-Year Market Share, 2025
- 12.5.5 Segment CAGR and Growth Drivers
- 12.5.6 Subsegment Market Size and Forecast
- 12.5.6.1 Deposit Money Banks
- 12.5.6.2 International Money Transfer Operators
- 12.5.6.3 Fintech and Payment Service Providers
- 12.5.6.4 Mobile Money Operators
- 12.5.6.5 Correspondent and Settlement Networks
- 12.5.7 Subsegment Pricing and Adoption Trends
- 12.5.8 Leading Suppliers and Competition
- 12.5.9 Regional Demand and Opportunities
- 12.6 Segment Growth Comparison
- 12.7 Segment Attractiveness and Priority Matrix
Chapter 13 Nigeria Remittance & Cross-Border Transfers End-Use and Application Market Outlook
- 13.1 End-Use Industry and Customer Demand Structure
- 13.2 Leading Applications and Customer Groups
- 13.3 End-Use Market Size, Share and Forecast
- 13.4 Major End-Use Industry Deep Dives
- 13.4.1 Customer Requirements and Use Cases
- 13.4.2 Demand and Replacement Cycles
- 13.4.3 Technical and Regulatory Considerations
- 13.4.4 Purchasing and Procurement Models
- 13.4.5 Leading Vendors and Distribution Channels
- 13.4.6 Forecast and Commercial Opportunities
- 13.5 Emerging Applications and Cross-Segment Demand
- 13.6 End-Use Industry Investment Priorities
Chapter 14 Nigeria Remittance & Cross-Border Transfers Geographic Market Outlook, 2025-2035
- 14.1 Domestic Market Distribution and Demand Clusters
- 14.2 State- or Province-Wise Market Size and Forecast, 2025-2035
- 14.3 City and Metropolitan Market Outlook
- 14.4 Industrial, Manufacturing and Commercial Clusters
- 14.5 Geographic Concentration of Key End Users
- 14.6 Local Pricing and Purchasing Differences
- 14.7 Domestic Production Facilities and Capacity Map
- 14.8 Local Infrastructure and Project Pipeline
- 14.9 State-Level Policy and Incentive Differences
- 14.10 Subnational Investment Hotspots and Opportunities
- 14.11 Distribution and Logistics Networks
- 14.12 Domestic Competitive Footprint
Chapter 15 Nigeria Remittance & Cross-Border Transfers Technology, Innovation and Sustainability Outlook
- 15.1 Technology Landscape and Maturity
- 15.2 Product, Process and Service Innovation
- 15.3 AI, Automation and Digital Tools in the Industry
- 15.4 Technology Adoption and Performance Benchmarking
- 15.5 Innovation Pipeline and R&D Investment
- 15.6 Energy Efficiency and Resource Management
- 15.7 Sustainability, Recycling and Circularity
- 15.8 Technology Roadmap, 2025-2035
- 15.9 Risks of Obsolescence and Technology Substitution
Chapter 16 Nigeria Remittance & Cross-Border Transfers Market Key Strategic Imperatives
- 16.1 Growth and Market Entry Priorities
- 16.2 High-Return Products and Segments
- 16.3 Pricing, Profitability and Cost Optimization
- 16.4 Technology Investment and Product Differentiation
- 16.5 Supply Chain Localization and Resilience
- 16.6 Distribution and Customer Acquisition
- 16.7 Partnership, Acquisition and Capacity Strategy
- 16.8 Regional Expansion Priorities
- 16.9 Short-, Medium- and Long-Term Actions
Chapter 17 Competition Outlook
- 17.1 Industry Competition Characteristics
- 17.2 Market Structure and Concentration
- 17.3 Market Share and Competitive Positioning, 2025
- 17.4 Company-Wise Revenue and Product Benchmarking
- 17.5 Production and Service Capacity Benchmarking
- 17.6 Technology, Pricing and Differentiation
- 17.7 Regional Footprint and Distribution Strength
- 17.8 Mergers, Acquisitions and Strategic Alliances
- 17.9 New Entrants and Competitive Threats
- 17.10 Porter's Five Forces and Industry Attractiveness
- 17.11 Competitive Outlook, 2025-2035
Chapter 18 Company Profiles
- 18.1 Company Coverage and Selection Criteria
- 18.2 Western Union
- 18.2.1 Business Description
- 18.2.2 Company Ownership and Geographic Presence
- 18.2.3 Product and Service Portfolio
- 18.2.4 Manufacturing and Operating Footprint
- 18.2.5 Financial Performance and Investment
- 18.2.6 Market Share and Competitive Position
- 18.2.7 Technology and Innovation Capabilities
- 18.2.8 Strategic Alliances or Partnerships
- 18.2.9 Recent Developments
- 18.2.10 Growth Strategy and Outlook
- 18.3 MoneyGram
- 18.4 Remitly
- 18.5 WorldRemit
- 18.6 Sendwave
- 18.7 LemFi
- 18.8 Taptap Send
- 18.9 Flutterwave
- 18.10 Interswitch
- 18.11 Paga
- 18.12 Other Relevant Market Participants
Note: Every listed company is profiled on the structure shown under the first company. The company list is preliminary and may change based on research findings, market developments, data availability and client requirements.
Chapter 19 Disclaimer
- 19.1 Research and Forecast Disclaimer
- 19.2 Data Source and Estimation Limitations
Note: The depth of individual sections depends on data availability for this market. Volume, capacity, trade and other unit-based metrics are included where applicable.