Bank gaps keep SME borrowers moving to digital lenders
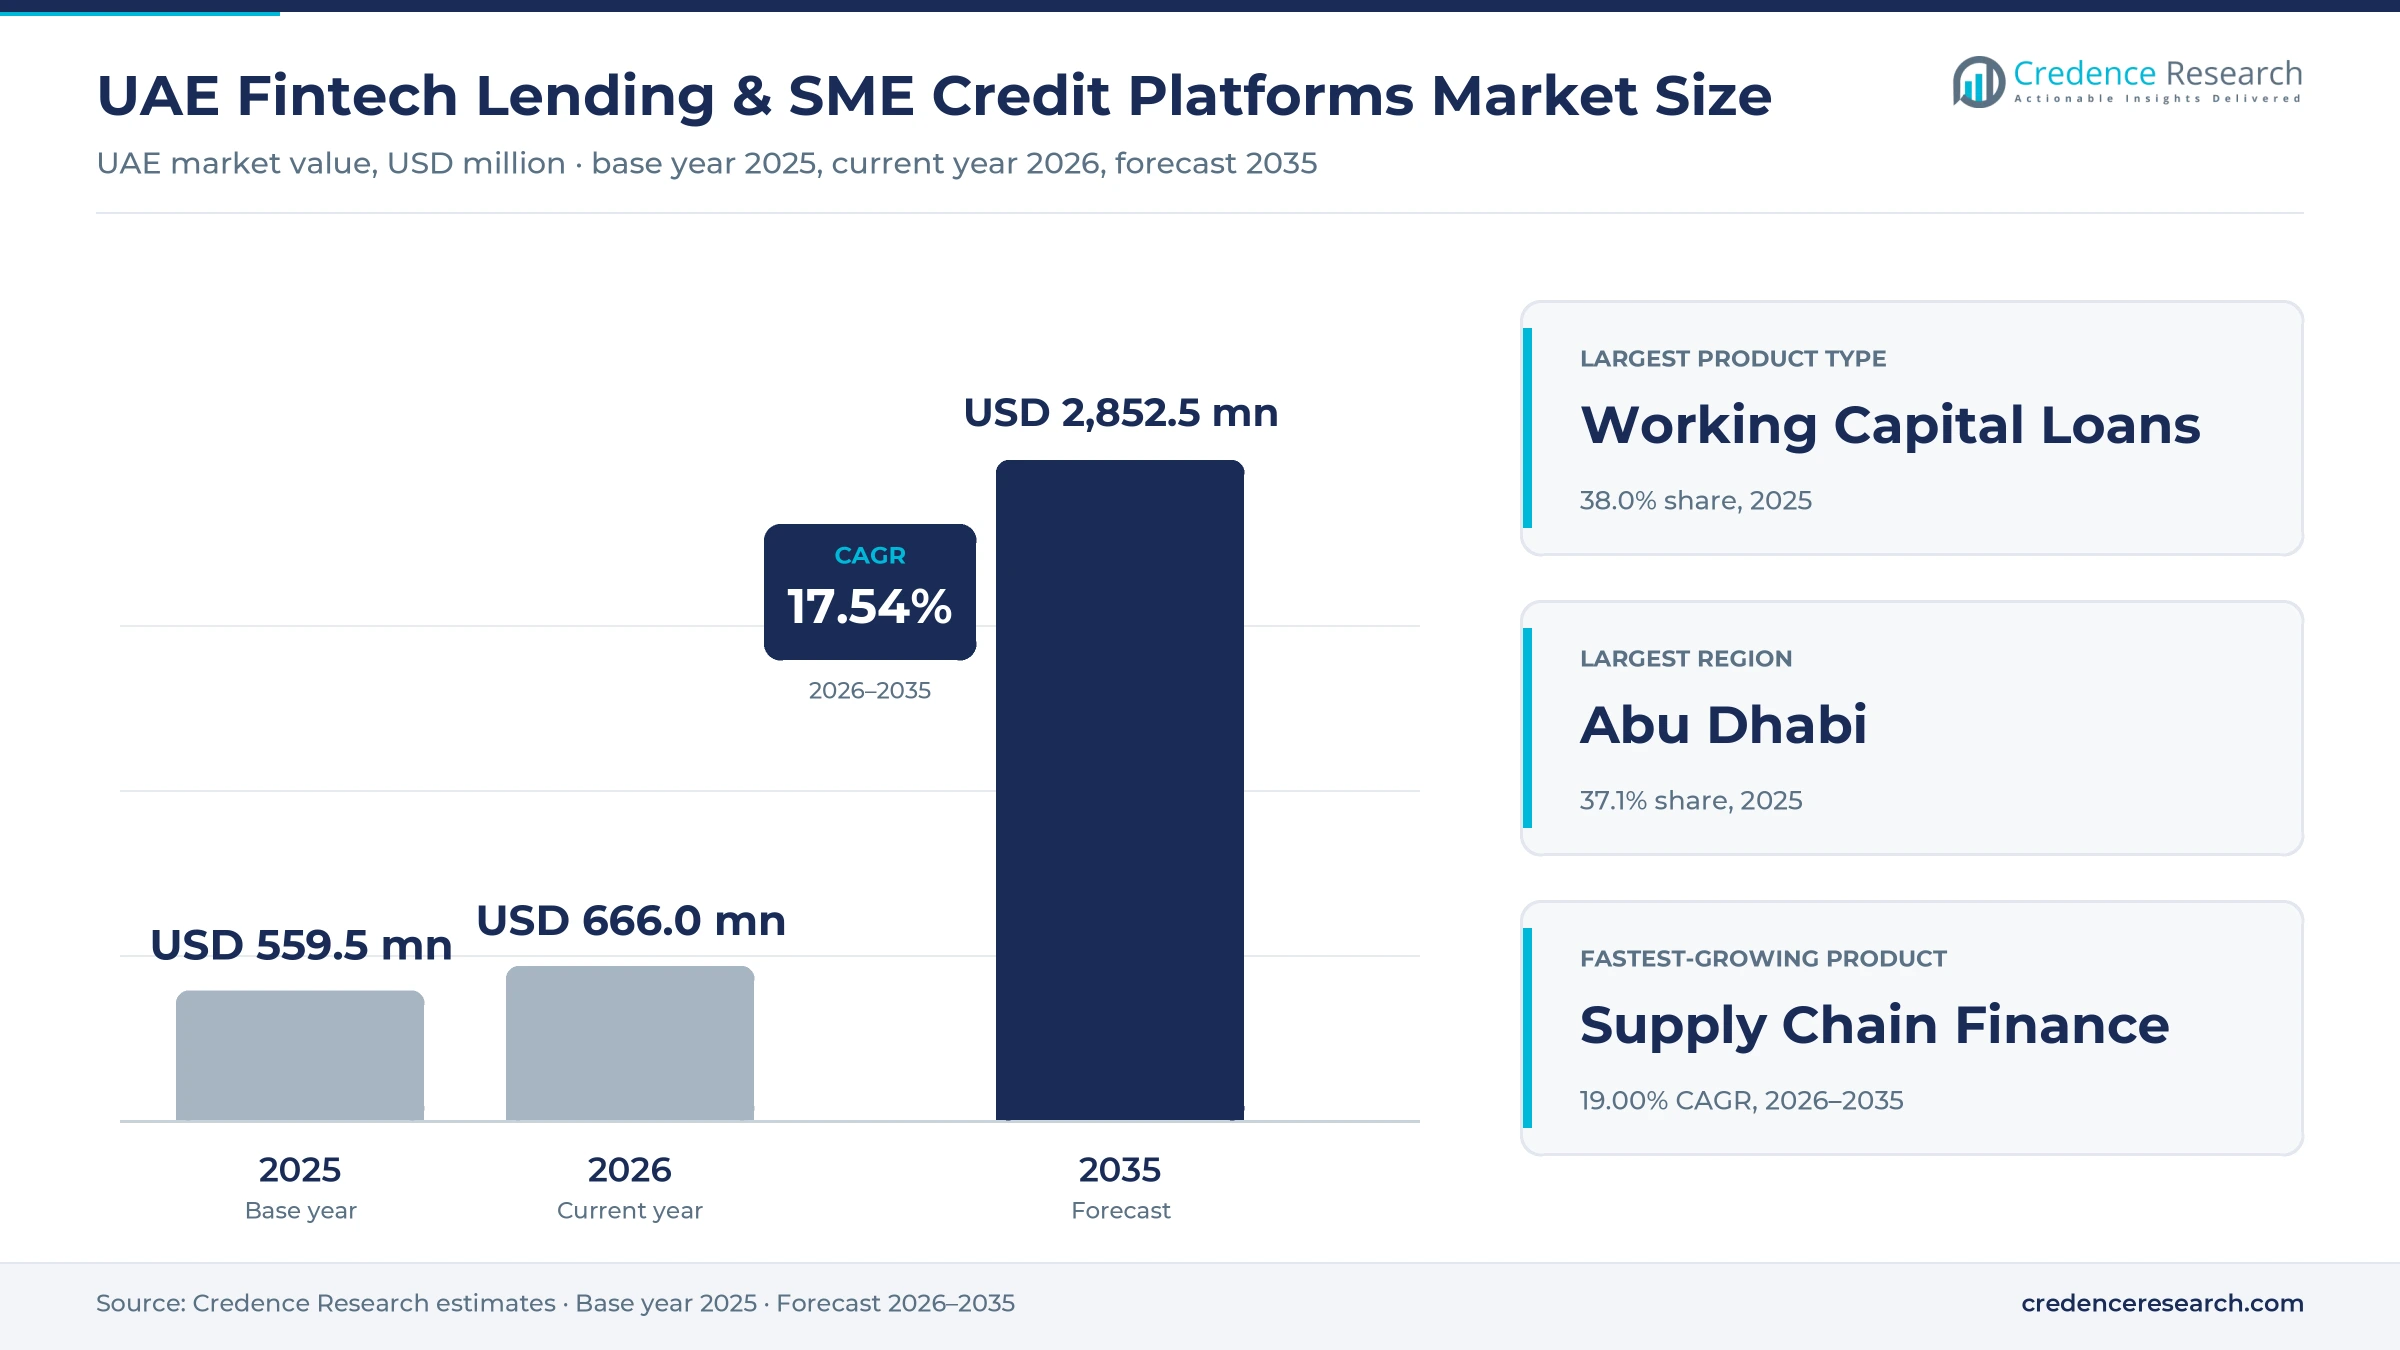
The UAE fintech lending and SME credit platforms market was valued at USD 559.5 million in 2025 and is projected to increase from USD 666.0 million in 2026 to USD 2.85 billion by 2035, registering a CAGR of 17.54% during 2026–2035. Demand comes from a company base of about 1.2 million firms whose smaller members receive roughly a tenth of bank credit. Abu Dhabi held the largest regional share, 37.1% in 2025, helped by lenders and credit funds regulated in Abu Dhabi Global Market, while Northern Emirates is the fastest-growing region at 18.51% a year as free-zone company formation accelerates. Institutional money has changed the supply side, with International Holding Company placing USD 715 million into Zelo in December 2025. The next structural change is mandatory e-invoicing from January 2027, which gives receivables lenders cleaner data on who owes what to whom. Stress from the 2026 regional conflict tightened underwriting for several months, although Beehive expected a record month of approvals in October.
What does UAE SME platform credit include and how do borrowers buy it?
The market counts financing to micro, small and medium enterprises that is originated or serviced through digital platforms, including working capital loans, receivables purchase, revenue-based advances, merchant cash advances and buyer-led programs. Borrowers usually apply online with bank statements, payment data or invoices, then receive a decision within days. Tickets on the crowdfunding platforms typically run from AED 100,000 to AED 2 million, according to a Funding Souq comparison page.
Conventional branch-based SME loans from banks, consumer buy-now-pay-later and equity investment are excluded, although digital lenders owned by banks are counted. The value is a Credence Research estimate of platform credit outstanding, not annual originations or funding commitments, so it should not be compared directly with single-lender facilities or financing targets. The value chain runs from capital providers such as private credit funds and retail investors, through licensed lenders and their distribution partners, to the SME borrower.
UAE Fintech Lending & SME Credit Platforms Market Insights
- The market grows from USD 559.5 million in 2025 to USD 2.85 billion by 2035, a 17.54% CAGR, because bank SME credit remains small against the size of the company base.
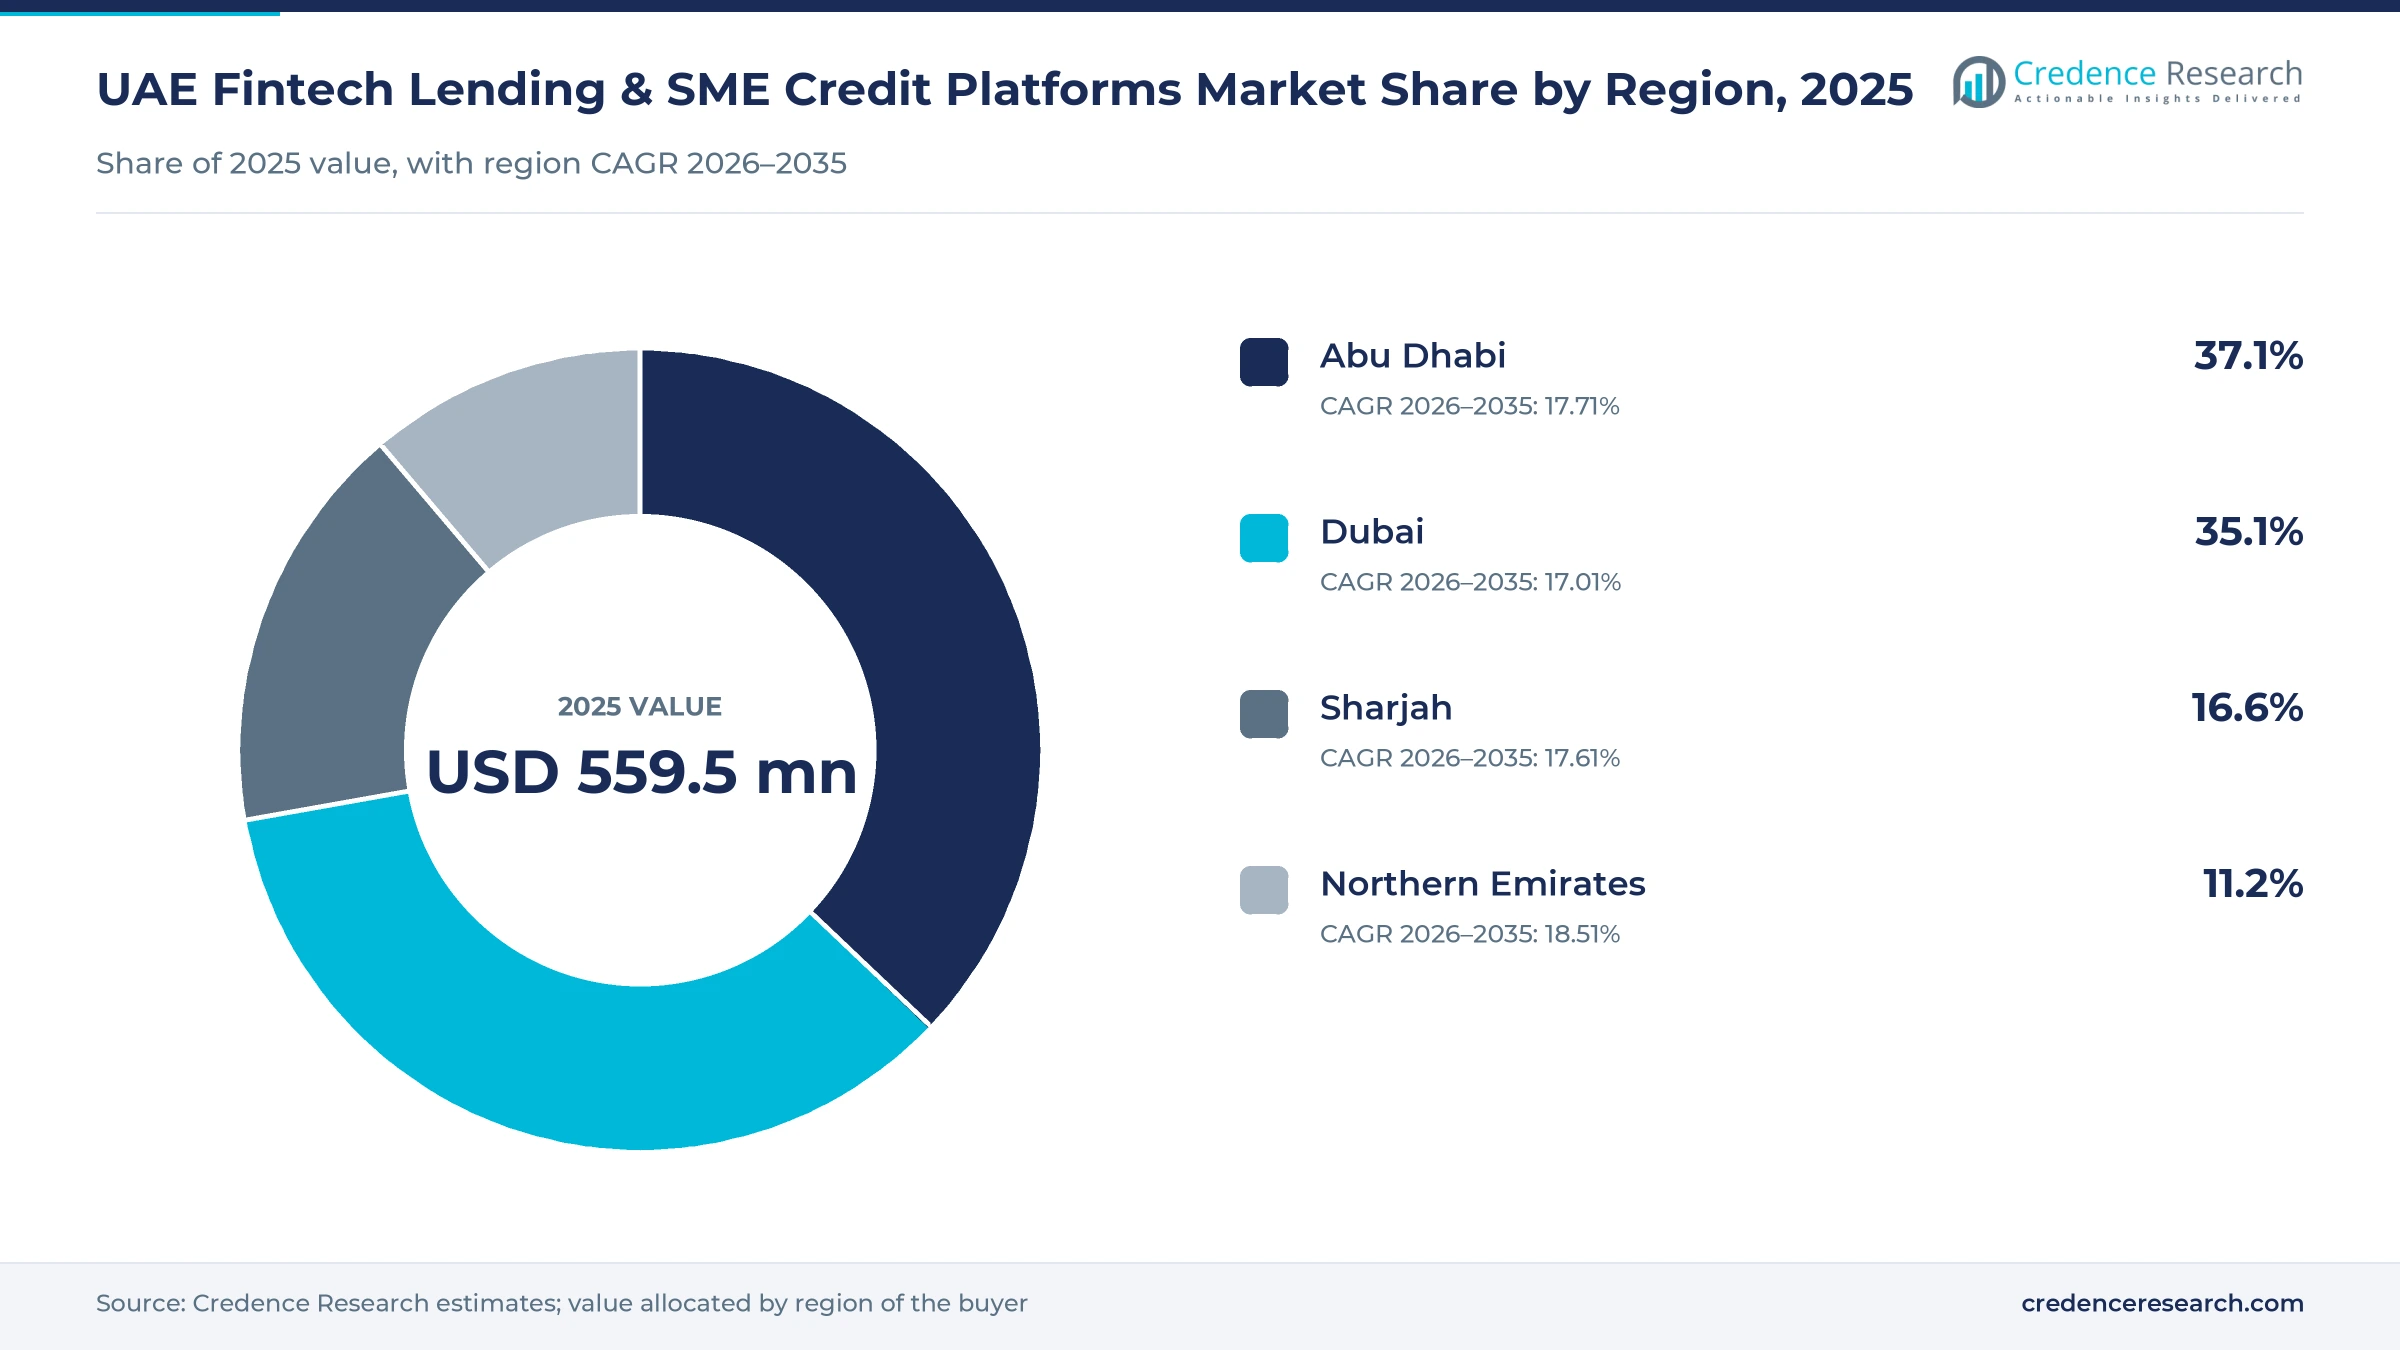
- Abu Dhabi led with 37.1% of 2025 value, narrowly ahead of Dubai at 35.1%, reflecting the concentration of regulated lenders and credit funds in the capital.
- Working Capital Loans held 38.0% of 2025 value, while Loan Crowdfunding Platforms led institution types with 44.0% because Beehive and Funding Souq scaled first.
- The Open Finance Regulation updated by Circular 3 of 2025 took effect July 10, 2025, and gives licensed lenders a consented route to customer banking data.
- Private credit and sovereign capital arrived together, with Pollen Street backing CredibleX in September 2025 and Mubadala leading its Series A in May 2026.
Working capital and crowdfunding anchor current volumes
Why do working capital loans lead while buyer-led finance grows fastest?
Based on product type, the market is categorized into working capital loans, invoice and receivables finance, revenue-based finance, merchant cash advance and supply chain finance. Working Capital Loans led with 38.0% of 2025 value because the largest platforms built on them, with Funding Souq offering terms of three to 24 months and Beehive 12 to 48 months on their published comparison page. Supply Chain Finance grows fastest at 19.00% a year as anchor programs scale, and Enterprise reported in December 2025 that Zelo had funded more than 12,000 transactions worth USD 225 million.
Why do small enterprises take the largest share of platform credit?
Based on customer segment, the market is categorized into micro enterprises, small enterprises and medium enterprises. Small Enterprises led with 49.0% of 2025 value because platform products fit their needs, and Beehive told Enterprise in October 2026 that it targets businesses with AED 5 million to AED 50 million in revenue. Micro Enterprises grows fastest at 18.62% a year as terminal and payment data make them easier to score, and The National reported in July 2025 that more than half of 2,235 Abu Dhabi SME Champions applicants were microenterprises.
Why is embedded distribution gaining on direct digital origination?
Based on distribution channel, the market is categorized into direct digital origination, embedded finance partners, accounting and ERP integrations, marketplace and e-commerce partnerships, and broker and referral networks. Direct Digital Origination led with 41.0% of 2025 value because early platforms acquired borrowers through their own portals, and Scene Now reported in September 2025 that erad reviews applications within 48 hours. Embedded Finance Partners grows fastest at 19.19% a year as partner lists lengthen, with CredibleX reporting more than 70 distribution partners by May 2026, up from over 60 cited by Global Trade Review in September 2025.
Why do crowdfunding platforms lead as ADGM lenders gain ground?
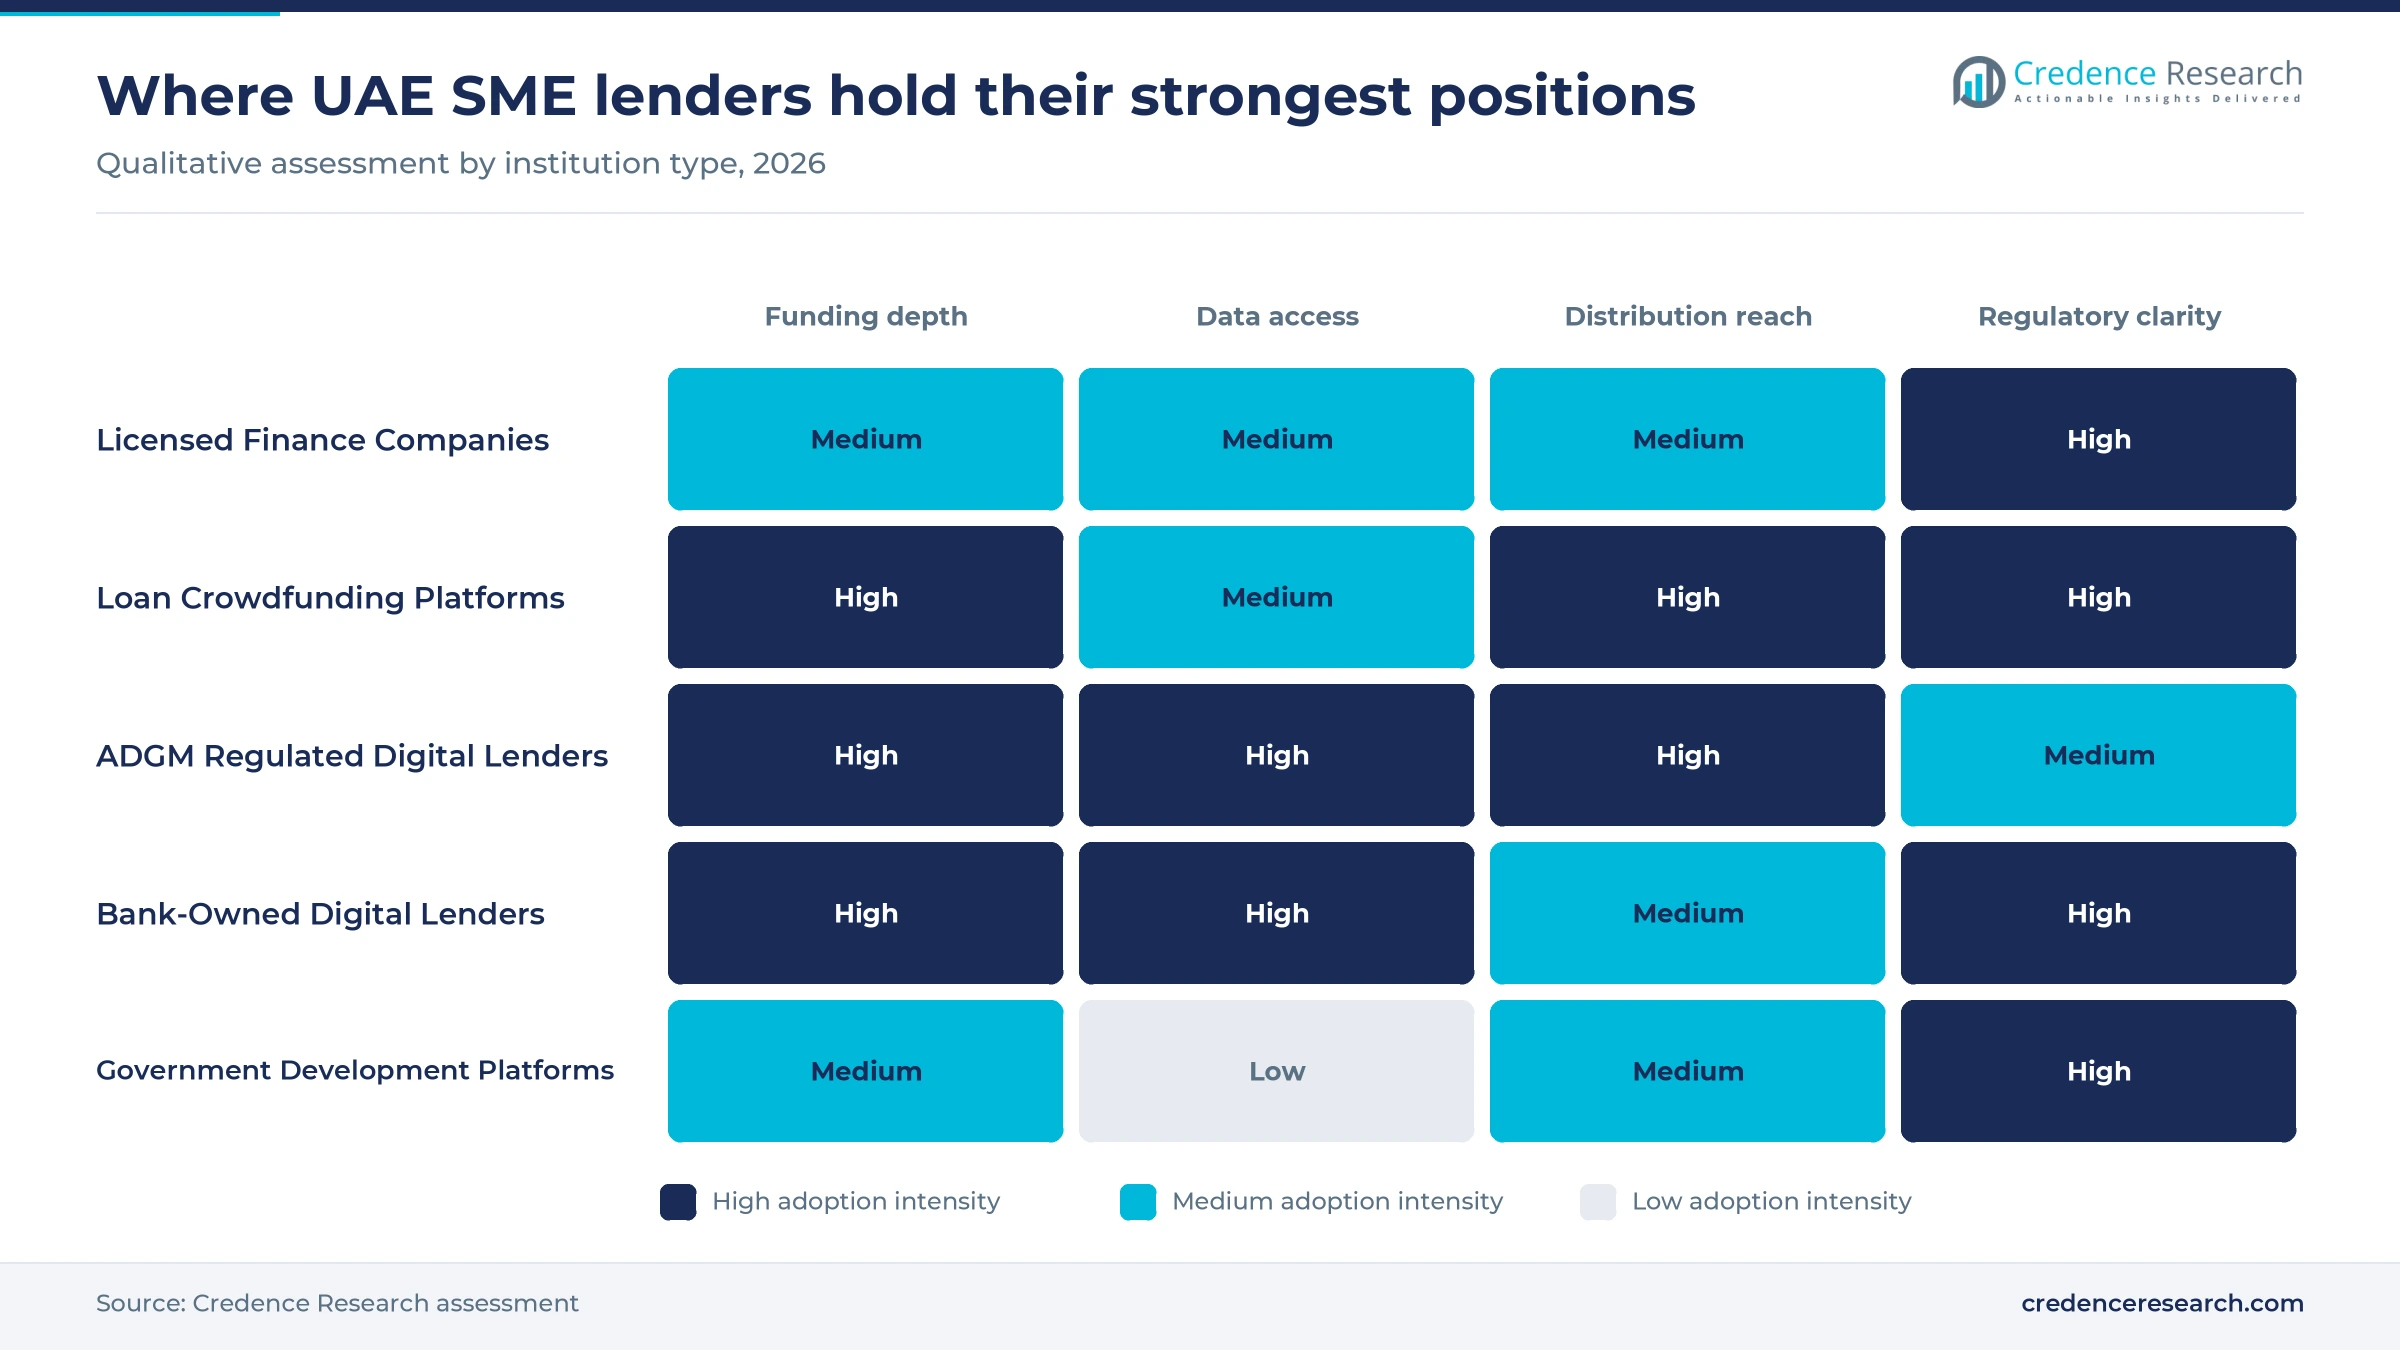
Based on institution type, the market is categorized into licensed finance companies, loan crowdfunding platforms, ADGM regulated digital lenders, bank-owned digital lenders and government development platforms. Loan Crowdfunding Platforms led with 44.0% of 2025 value because they scaled first, and Beehive reports lending close to AED 6 billion since launch, according to Enterprise in October 2026. ADGM Regulated Digital Lenders grows fastest at 19.24% a year as the Financial Services Regulatory Authority supervises CredibleX, and FF News reported that Klub announced an AED 1 billion credit fund under the ADGM regime.
| Segment Group | Leading Sub-segment | Share, 2025 | Fastest-growing Sub-segment | CAGR, 2026–2035 |
|---|---|---|---|---|
| By Product Type | Working Capital Loans | 38.0% | Supply Chain Finance | 19.00% |
| By Customer Segment | Small Enterprises | 49.0% | Micro Enterprises | 18.62% |
| By Distribution Channel | Direct Digital Origination | 41.0% | Embedded Finance Partners | 19.19% |
| By Institution Type | Loan Crowdfunding Platforms | 44.0% | ADGM Regulated Digital Lenders | 19.24% |
Request a Free Sample
Fill in your details and we'll send you a free sample report.
- Sample data tables & charts
- Research methodology
Borrower depth and new capital are lifting supply
Large SME borrower base and persistent working-capital demand
The clearest driver is the mismatch between the number of smaller companies and the credit they receive from banks. The National reported in September 2025 that the UAE had about 1.2 million companies, with a target of roughly 2 million by 2031, and that SMEs make up about 94% of businesses and about 63.5% of non-oil GDP. Bank facilities to SMEs stood at only AED 81.2 billion in June 2024, or 9.5% of credit to commercial and industrial sectors, according to Zawya citing central bank data. The IMF advised the UAE to improve access to credit for SMEs in its December 2024 Article IV release. As a result, working capital loans still hold 38.0% of platform value, and lenders see repeat demand from firms that wait months for customers to pay.
Institutional capital moving into digital SME credit
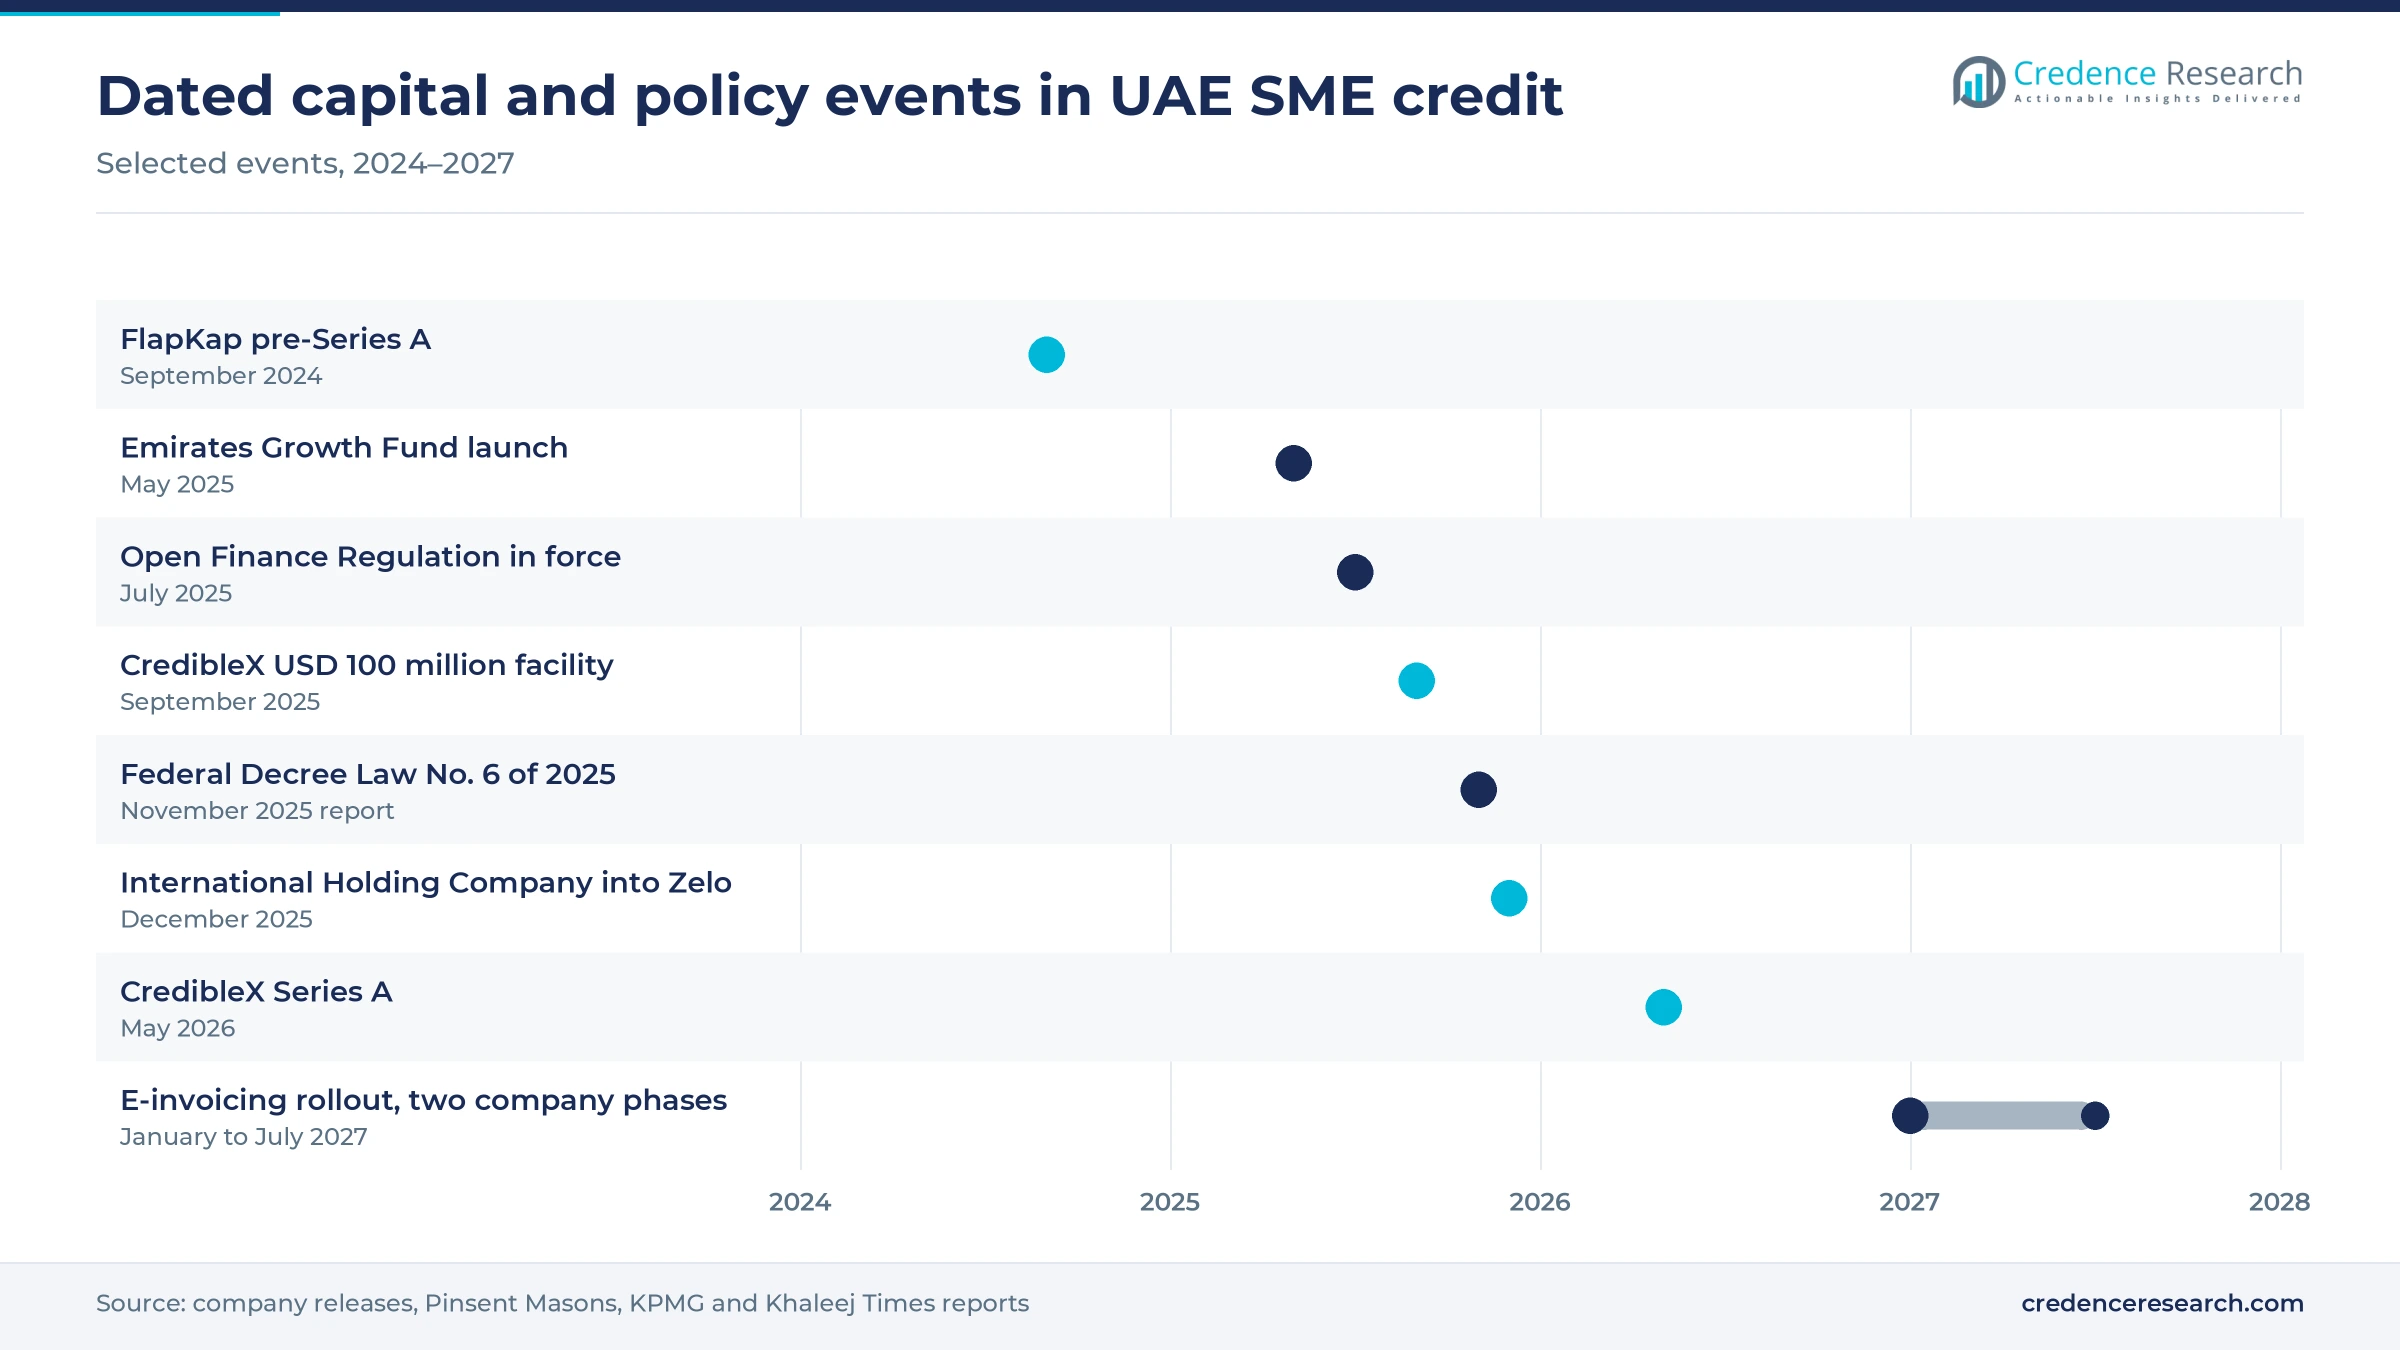
Lending capacity has grown because large institutions now fund these balance sheets, which removes the main limit on early crowdfunding models. Global Trade Review reported that CredibleX sealed a USD 100 million secured facility from Pollen Street Capital in September 2025. Mubadala then led a Series A round in CredibleX on May 6, 2026, through its MENA Venture Capital Fund, as part of a USD 15 million equity raise. Enterprise reported that International Holding Company invested in Zelo in December 2025, and that Goldman Sachs made an initial AED 500 million commitment to Beehive in 2025. Scene Now also reported USD 33 million in debt for erad in September 2025, with UAE expansion in its plan. This capital helps ADGM Regulated Digital Lenders grow at 19.24% a year.
Open finance and embedded distribution infrastructure
Regulated data access and partner channels are lowering the cost of finding and assessing a borrower. The Open Finance Regulation took effect July 10, 2025, and it makes participation mandatory for finance companies and loan-based crowdfunding firms, according to Pinsent Masons, with Nebras Open Finance operating the API hub and Al Tareq providing the consent layer. Distribution has moved in parallel, because The Paypers reported that Network International added Wio Bank to its merchant lending marketplace in July 2025. IBS Intelligence reported in June 2026 that Geidea began referring eligible merchants to Wio for financing, and SME10x reported in February 2026 that CredibleX linked financing to NEO PAY terminal and online activity. Growth in embedded finance therefore lifts Embedded Finance Partners at 19.19% a year.
Mandatory e-invoicing creates a verifiable receivables record
The national invoicing rollout gives receivables lenders a structured record that was previously held in scattered spreadsheets and PDF files. KPMG reported in July 2026 that mandatory e-invoicing starts Jan. 1, 2027 for companies with revenue of AED 50 million or more, and on July 1, 2027, for smaller firms. Sovos reported in October 2026 that Cabinet Decision No. 173 of 2026 sets penalties of AED 100 per missed invoice, capped at AED 5,000 a month, which encourages compliance among smaller suppliers. The need for this finance is visible too, since Enterprise cited an Atradius survey showing about two in five UAE B2B invoices paid late in the second quarter of 2026. Together with invoice processing software, these records support growth in receivables products.
Live data and anchor programs are reshaping credit
Shift from single-borrower loans to anchor-led programs
Lenders increasingly reach many suppliers through one large buyer, which reduces acquisition cost and improves visibility on repayment. Enterprise reported in December 2025 that Zelo converts approved receivables into working capital within two days across oil and gas, construction, infrastructure and retail, and that it targets USD 1 billion of gross financing volume next year. Emirates Development Bank signed a memorandum with Trade Capital Partners on Aug. 17, 2023, to develop supply chain finance for SMEs, with Hub71 facilitating the agreement. Wamda reported in December 2023 that Fundbot raised USD 1.5 million to embed supply-chain finance for banks, telcos and marketplaces. Supply Chain Finance consequently grows at 19.00% a year, the fastest rate among products.
Rise of cash-flow underwriting from live business data
Credit decisions are moving away from audited accounts toward daily payment and invoice data, because many younger UAE firms have thin financial histories. The Paypers reported that Wio generates customized offers for Network International merchants from real-time transaction data. Zawya carried an announcement that UPFRONT, which raised a USD 10 million pre-seed round in October 2025, would supply CredibleX with live data on invoices, payment behavior and cash movement. Wamda reported in September 2024 that FlapKap uses AI-powered underwriting and open banking for its revenue-based advances, backed by a USD 34 million round. Links to accounting software therefore matter more, and Micro Enterprises benefit most at 18.62% a year.
Opening in the medium-sized missing middle
Medium enterprises present a clear opening because they are too large for microfinance and often too young for bank relationship lending. Khaleej Times reported that Emirates Growth Fund vice chair Najla Al Midfa estimated this missing middle gap at more than AED 7 billion when the AED 1 billion fund launched on May 19, 2025. Emirates Development Bank also holds a mandate to approve AED 30 billion in financing support for 13,500 companies by 2026, according to its August 2023 release. Beehive told Enterprise that it can now support up to AED 2 billion of UAE lending. Lenders offering larger receivables lines can win these clients from banks.
Opening among free-zone and e-commerce merchants
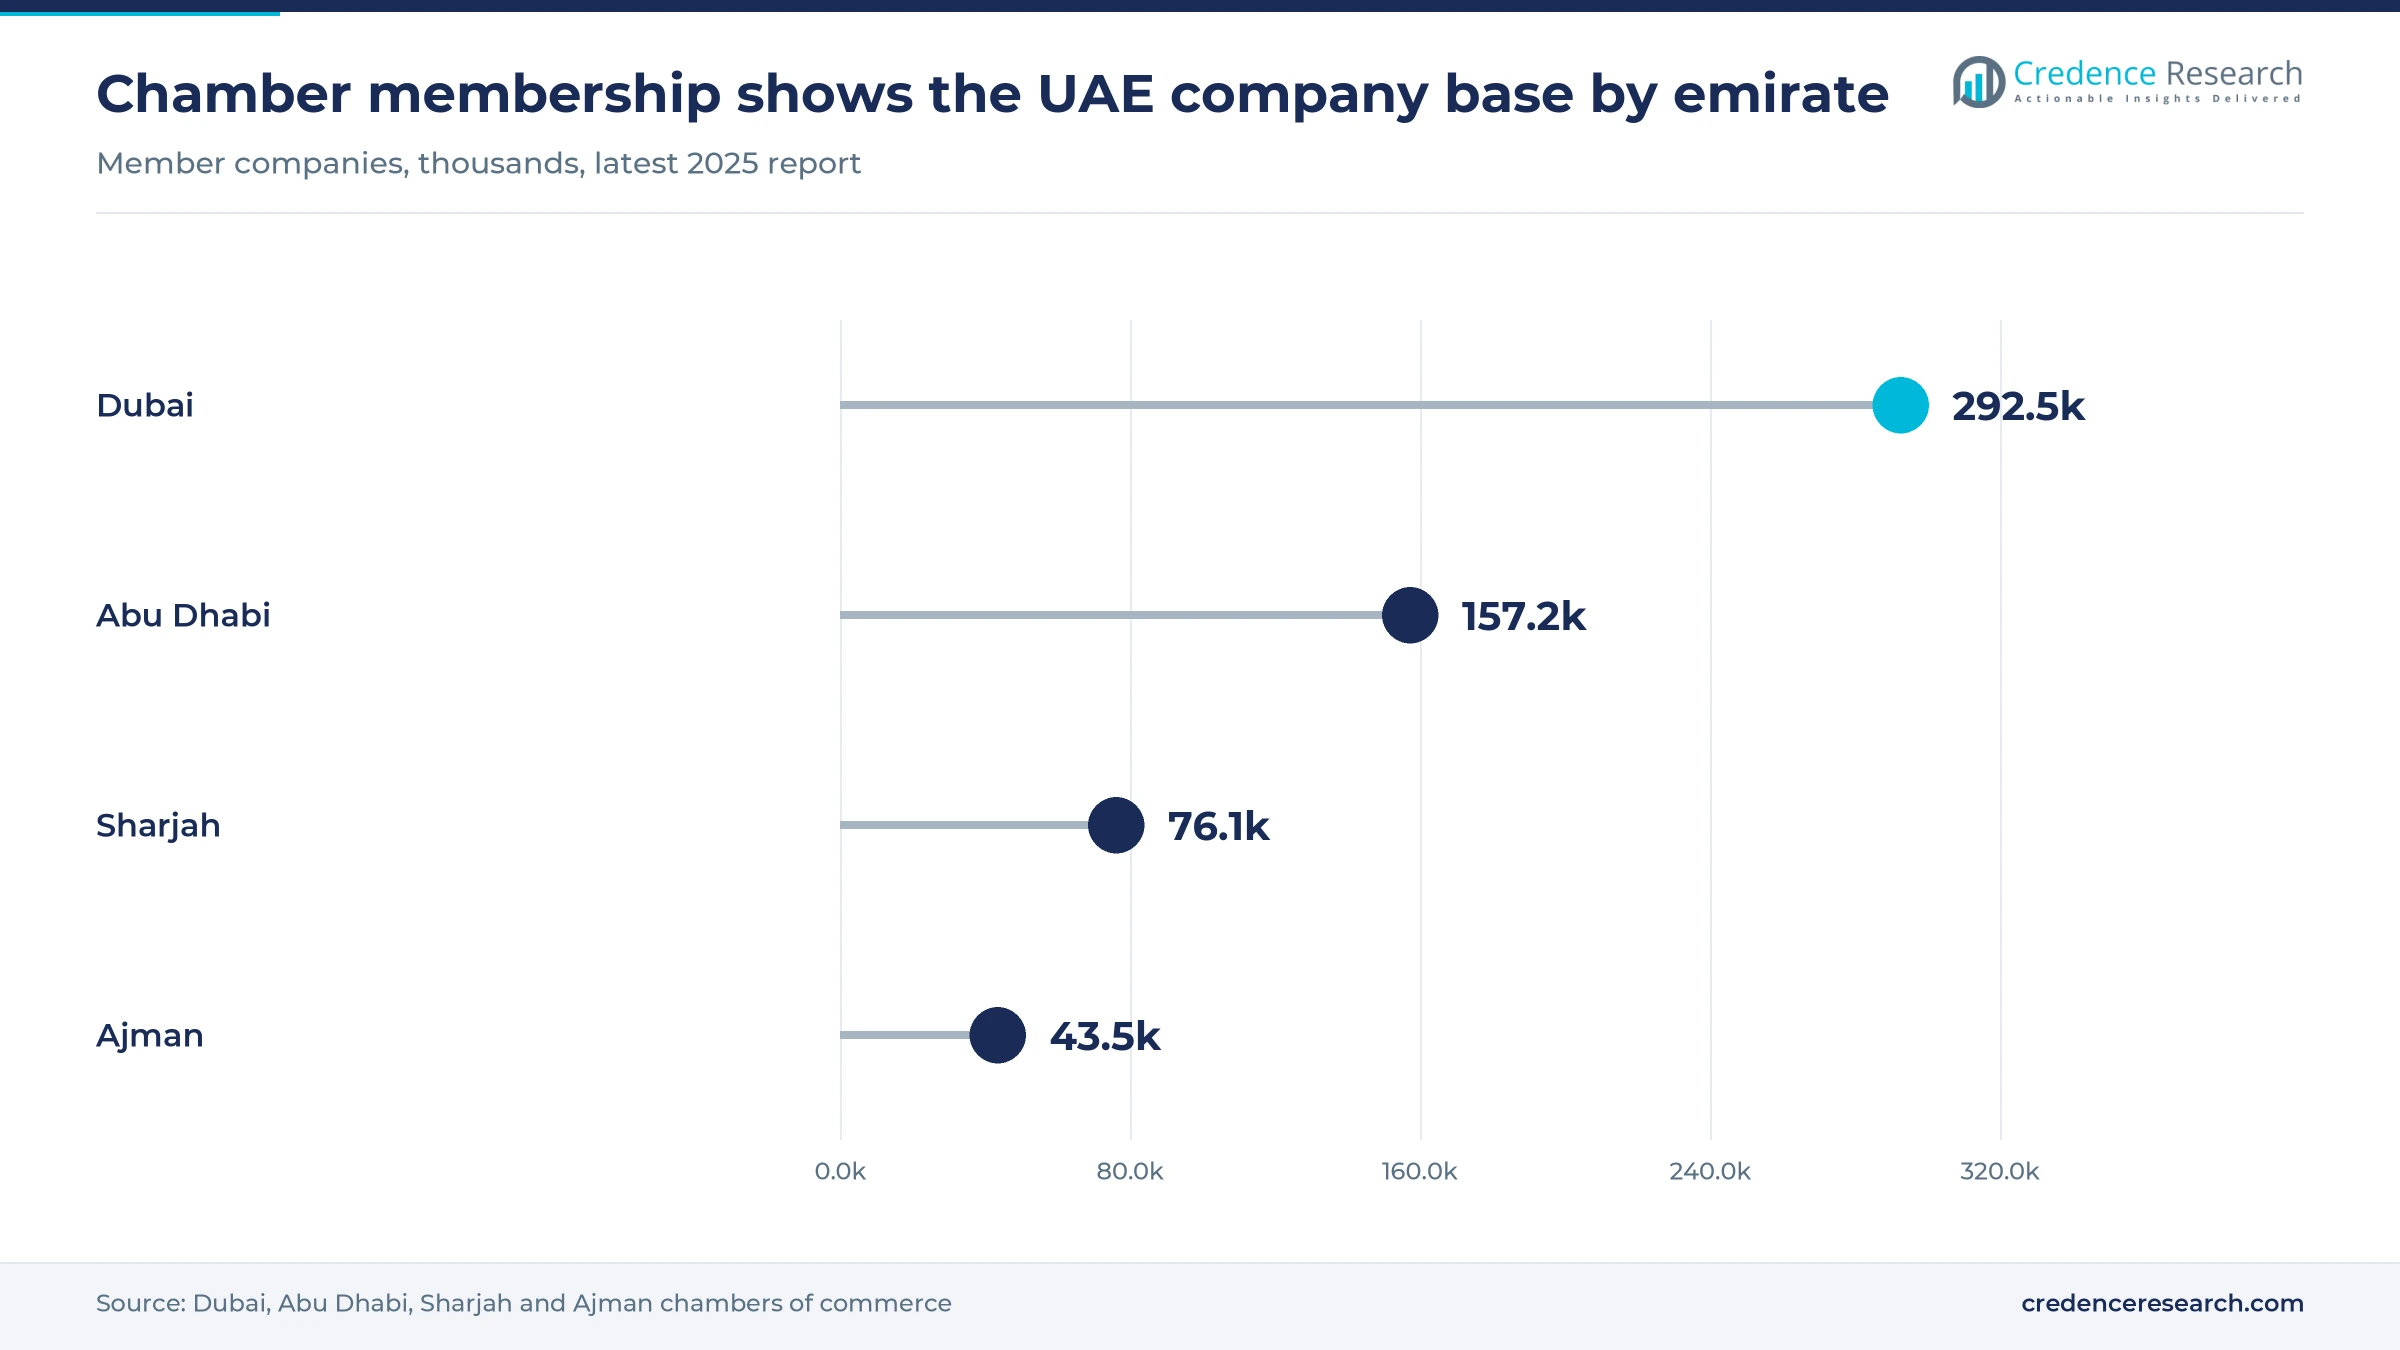
Newly licensed online sellers in free zones offer an underserved borrower pool with rich digital sales data and little credit history. RAKEZ reported in April 2026 that around 19,000 new companies joined in 2025, a 44% increase on 2024, and that e-commerce accounted for 17% of those licenses. Ajman Chamber recorded 43,486 memberships in 2025, up from 40,031 a year earlier, including 19,825 commercial members. FlapKap already funds inventory and digital advertising for online sellers from its Abu Dhabi base, according to Wamda. Revenue-based and merchant cash products suit these firms because repayment follows sales, and Northern Emirates remains the fastest-growing region from a comparatively small base.
Conflict stress and slow payers test underwriting
Conflict-related credit stress and deferred loans
New lending fell sharply in March and April during the 2026 regional conflict, and Beehive’s chief executive told Enterprise in October 2026 that loans 5 to 30 days overdue rose to about 6% in June and July before easing to roughly 2.5%. The central bank resilience package deferred about AED 13.5 billion in repayments for more than 135,000 customers, and those deferred bank loans began falling due in September and October. Platform lenders may therefore see delayed stress, so Beehive plans tighter criteria until at least the end of 2026.
Longer cash cycles squeeze importers and contractors
Beehive told Enterprise that a container from China rose from about USD 1,200 to roughly USD 10,000 during the conflict, while some deliveries stretched from about 60 to 120 days. Importers of electronics and white goods, often on margins of 1% to 2%, struggled to pass these costs on, and contractors on fixed-price deals faced similar pressure. Beehive also caps lending to trading companies because of historically higher defaults, which limits credit for a group that needs working capital most.
High pricing limits the pool of qualifying borrowers
Platform credit remains expensive compared with secured bank borrowing, which narrows the borrower pool and raises adverse selection risk. A Funding Souq comparison page lists a stated APR of 26% on its own loans and an average APR of 10% to 14% at Beehive, a spread that shows how widely risk pricing varies. Digital banks such as Wio are also entering merchant channels with their own funding, so specialist lenders must lower capital costs or concentrate on riskier, thin-file clients.
A stricter federal regime raises compliance costs
Federal Decree Law No. 6 of 2025 raised the maximum administrative fine to AED 1 billion and brought fintech firms and technology platforms within central bank supervision, Khaleej Times reported in November 2025. Institutions received one year to comply, and that period ran to Sept. 15, 2026, so partners who distribute credit now need to be in compliance. Smaller platforms and embedded partners bear the greatest burden, because licensing reviews and control upgrades cost relatively more for them, and some may seek bank partners instead.
Abu Dhabi and Dubai hold most of the lending value
| Region | Value, 2025 (USD million) | Share, 2025 | CAGR, 2026–2035 |
|---|---|---|---|
| Abu Dhabi | 207.6 | 37.1% | 17.71% |
| Dubai | 196.4 | 35.1% | 17.01% |
| Sharjah | 92.9 | 16.6% | 17.61% |
| Northern Emirates | 62.7 | 11.2% | 18.51% |
Abu Dhabi leads through regulated lenders and sovereign capital
Abu Dhabi held 37.1% of 2025 value and grows at 17.71% a year, supported by a concentration of regulated lenders and investors. Zawya reported that ADGM hosted 2,972 companies at June 30, 2025, up from 2,381 six months earlier, with assets under management up 42% in a year. CredibleX, FlapKap and the Numou platform all operate from the capital, and Abu Dhabi Chamber counted 157,207 member companies in June 2025. The Abu Dhabi SME Champions program also facilitated deals worth more than USD 183 million in its latest reported year, according to The National in July 2025.
Dubai holds the largest company base and pioneer platforms
Dubai held 35.1% of 2025 value and grows at 17.01% a year, a slower pace because its platform market matured first. Gulf Today reported that Dubai Chamber had 292,486 active members at the end of 2025, after 71,830 joined that year. Wholesale and retail trade made up 34.5% of new member activity, which supports inventory and receivables borrowing. Beehive is based in the emirate, Funding Souq holds a Dubai Financial Services Authority license, and Dubai Chambers partnered with Qashio on embedded financing in February 2026.
Sharjah benefits from trading and manufacturing firms
Sharjah held 16.6% of 2025 value and grows at 17.61% a year, with demand from trading, light manufacturing and service firms that often sit below bank thresholds. Zawya carried Sharjah Chamber results showing 76,110 active members at the end of 2025 and 8,385 new companies during that year. Sharjah has fewer locally headquartered lenders than Abu Dhabi or Dubai, so most borrowers reach credit through online origination and referral partners rather than local platform offices.
Northern Emirates grow fastest from a smaller base
Northern Emirates held 11.2% of 2025 value and grow at 18.51% a year, the fastest regional rate. RAKEZ reported more than 40,000 registered companies in Ras Al Khaimah in April 2026, including about 19,000 that joined during 2025. Ajman Chamber also listed 1,688 factories that year, up from 1,549, which adds asset-backed and receivables demand. Credit reach remains thinner here, so embedded offers through payment terminals and free-zone partners should carry most new lending.
Capital raises and data links marked 2025 and 2026
| Development | Status and market relevance |
|---|---|
| In May 2026, Mubadala led a Series A round in CredibleX, part of a USD 15 million equity raise. | Completed; funds marketplace scaling and partner distribution across the UAE |
| In December 2025, International Holding Company invested USD 715 million in Zelo after acquiring eFunder. | Completed; supports anchor partnerships and receivables financing volumes |
| In September 2025, CredibleX sealed a USD 100 million secured credit facility from Pollen Street Capital. | Active; expands the loan book and UAE footprint of an ADGM lender |
| In July 2025, the updated Open Finance Regulation took effect under Central Bank Circular 3 of 2025. | In force; phased participation covers finance companies and crowdfunding firms |
| In January 2025, Klub partnered with ADGM platform Numou to fund UAE SMEs and startups. | Active; offers tenors ranging from two days to two years |
Open data and e-invoices change how lenders score
- Open finance APIs route consented bank data through the Nebras hub, which reduces manual statement collection for licensed lenders.
- Payment-terminal scoring turns merchant sales through Network International, Geidea or NEO PAY into offers that update with trading activity.
- Structured e-invoices give receivables financiers a machine-readable XML record once the mandatory rollout begins in 2027.
- Early-warning monitoring tracks signals such as Beehive’s 5 to 30 day overdue metric and borrower cash balances to trigger credit action.
Need a Custom Version of This Report?
Tailor the scope, geography, or segments to your exact requirements.
- Custom geography or segment scope
- Direct access to our analyst team
Crowdfunding incumbents face well-funded new lenders
Competition among SME credit platforms splits between crowdfunding pioneers, newly capitalized balance-sheet lenders and partners that control borrower data. Beehive and Funding Souq compete on established investor bases and direct origination, and Funding Souq publishes its pricing and tenors openly. CredibleX, FlapKap and Klub compete instead through revenue-linked products and distribution inside other platforms, which lowers acquisition costs. Zelo and Trade Capital Partners approach the market through large buyers and supply chains, while Fundbot sells the enabling technology to banks and marketplaces. Numou gives ADGM an institutional access point, and erad brings Saudi experience into the UAE. Digital banks such as Wio add pressure in merchant channels. Over the forecast period, cost of capital and access to live data should matter more than brand, so further consolidation like the eFunder acquisition by International Holding Company appears likely.
Companies profiled and their roles in this market
| Company | Type | Role in the market |
|---|---|---|
| Beehive | Loan crowdfunding platform | Dubai-based SME lender with close to AED 6 billion lent since launch and Goldman Sachs funding |
| Funding Souq | Loan crowdfunding platform | DFSA-regulated working capital and fixed asset lender with tickets from AED 100,000 to AED 1 million |
| CredibleX | ADGM regulated digital lender | Embedded revenue-based, receivables and payable financing through more than 70 partners |
| erad | Digital SME lender | Riyadh-based Sharia-compliant financier that plans expansion across Saudi Arabia and the UAE |
| FlapKap | Revenue-based financier | Abu Dhabi-based funder of inventory and digital advertising for online and retail SMEs |
| Klub | Revenue-based financier | AED 1 billion credit fund under the ADGM regime with Numou as a distribution partner |
| Zelo | Receivables financier | International Holding Company platform that converts approved invoices into cash within two days |
| Numou | Government-linked platform | ADGM digital financing platform that connects UAE SMEs and startups with financiers |
| Trade Capital Partners | Supply chain finance provider | Emirates Development Bank partner on supply chain and working capital solutions for SMEs |
| Fundbot | Embedded finance technology | Automates corporate lending and supply-chain finance for banks, telcos and B2B marketplaces |
Funding depth will now separate the UAE lenders
Credence Research's view is that UAE credit platforms have moved past proving that SMEs want digital finance, and the question is now which lenders can fund and monitor it through a cycle. The events of 2026 offered a real test, because overdue ratios rose and then normalized at the largest platform within months. Beehive tightened its criteria through that stress, yet it still expected a record approvals month in October. Buyers of this credit should compare funding depth, data access and regulatory status before price alone. The largest uncertainty is the maturing of deferred bank loans, which could still affect shared borrowers during 2027.
How the UAE SME platform estimates were built
The report uses 2025 as the base year and forecasts values through 2035 from the Credence Research market model. Regional, segment and channel shares are Credence Research estimates informed by company disclosures, licensing categories and public statistics on company formation, because no official series reports these splits. Sources used include central bank publications, IMF documents, government and chamber releases, law firm and tax adviser guidance, company announcements and financial news. No interviews or surveys were conducted for this edition of the report. Facts were checked against the source pages cited, and estimates should be read as modeled values rather than reported lender data.
Receivables data should drive growth through 2035
From USD 666.0 million in 2026, the market is forecast to reach USD 2.85 billion by 2035, a 17.54% CAGR over 2026–2035. Growth should come less from new borrower awareness and more from data, as e-invoicing and open finance reach smaller firms during 2027 and lenders can verify receivables at lower cost. Supply Chain Finance and Embedded Finance Partners are positioned to gain share, while Northern Emirates lift their contribution from a small base. Credit discipline at the SME credit platforms will decide the pace, because another payment shock could quickly slow approvals and raise funding costs for specialist lenders.
Frequently Asked Questions
How big is the UAE fintech lending and SME credit platforms market?
Which product type leads UAE SME platform credit?
Which emirate holds the largest share of this market?
What is driving growth in digital SME credit in the UAE?
Which companies are active in UAE SME platform credit?
How did the 2026 regional conflict affect SME platform lending?
Why does e-invoicing matter to receivables lenders in the UAE?
What are the main risks for UAE SME credit platforms?
Table of Content
Chapter 1 Market Segmentation
- 1.1 Segmentation Framework
- 1.1.1 Product and Service Classification
- 1.1.2 Application and End-Use Classification
- 1.1.3 Technology and Solution Classification
- 1.1.4 Customer and Distribution Channel Classification
- 1.1.5 Geographic Segmentation
- 1.1.6 Market Segment Definitions and Boundaries
- 1.2 By Product Type
- 1.2.1 Working Capital Loans
- 1.2.2 Invoice and Receivables Finance
- 1.2.3 Revenue-Based Finance
- 1.2.4 Merchant Cash Advance
- 1.2.5 Supply Chain Finance
- 1.3 By Customer Segment
- 1.3.1 Micro Enterprises
- 1.3.2 Small Enterprises
- 1.3.3 Medium Enterprises
- 1.4 By Institution Type
- 1.4.1 Licensed Finance Companies
- 1.4.2 Loan Crowdfunding Platforms
- 1.4.3 ADGM Regulated Digital Lenders
- 1.4.4 Bank-Owned Digital Lenders
- 1.4.5 Government Development Platforms
Chapter 2 Introduction
- 2.1 Report Objectives and Scope
- 2.2 Product Definition and Industry Terminology
- 2.3 Market Inclusions and Exclusions
- 2.4 Research Process
- 2.4.1 Primary Research and Expert Interviews
- 2.4.2 Secondary Research and Source Review
- 2.4.3 Top-Down and Bottom-Up Estimation
- 2.4.4 Data Triangulation and Verification
- 2.5 Market Size Measurement Basis
- 2.5.1 2025: USD 559.5 million → 2035: USD 2.85 billion
- 2.6 Historical and Forecast Reference Periods
- 2.6.1 Historical Period: 2018-2025
- 2.6.2 Base Year: 2025
- 2.6.3 Forecast Period: 2025-2035
- 2.7 Research Assumptions and Limitations
Chapter 3 Executive Summary
- 3.1 Market Snapshot and Key Findings
- 3.2 Base-Year Market Size, 2025
- 3.3 Forecast Market Size, 2035
- 3.4 Revenue and Volume Growth Outlook
- 3.5 Key Demand and Supply Indicators
- 3.6 Leading Market Segments
- 3.7 Fastest-Growing Market Opportunities
- 3.8 Regional Performance Highlights
- 3.9 Technology and Industry Transformation
- 3.10 Competitive Landscape Summary
- 3.11 Analyst View and Strategic Implications
Chapter 4 UAE Fintech Lending & SME Credit Platforms Market Trends and Developments
- 4.1 Historical Industry Development, 2018-2025
- 4.2 Recent Market Trends and Developments
- 4.3 Demand and Customer Behavior Trends
- 4.4 Technology and Product Innovation
- 4.5 Artificial Intelligence, Automation and Digitalization
- 4.6 Local Manufacturing and Supply Chain Realignment
- 4.7 Industry Partnerships, Mergers and Acquisitions
- 4.8 Sustainability and Circular Economy Developments
- 4.9 Government and Private Sector Investment Trends
- 4.10 Emerging Business Models and Commercialization
- 4.11 Industry Developments and Announcements
Chapter 5 UAE Fintech Lending & SME Credit Platforms Market Supply and Demand Analysis
- 5.1 Demand Trend and Consumption Analysis, 2018-2025
- 5.2 Demand Forecast, 2025-2035
- 5.3 Supply Chain Structure and Procurement Trends
- 5.4 Supply-Demand Gap and Bottlenecks
- 5.5 Import Dependence and Sourcing Structure
- 5.6 Regional Supply and Demand Concentration
Chapter 6 UAE Fintech Lending & SME Credit Platforms Market Pricing Analysis
- 6.1 Pricing Structure and Measurement
- 6.2 Historical Pricing Trends, 2018-2025
- 6.3 Pricing Outlook, 2025-2035
- 6.4 Pricing by Product and Market Segment
- 6.5 Geographic Pricing Differences
- 6.6 Key Input, Energy, Labor and Logistics Costs
- 6.7 Contract Pricing and Purchasing Models
- 6.8 Pricing Sensitivity and Competitive Positioning
- 6.9 Price, Margin and Profitability Implications
Chapter 7 UAE Fintech Lending & SME Credit Platforms Market Dynamics
- 7.1 Market Growth Drivers
- 7.1.1 Demand-Side Drivers
- 7.1.2 Technology and Innovation Drivers
- 7.1.3 Infrastructure and Investment Drivers
- 7.1.4 Regulatory and Policy Drivers
- 7.2 Market Restraints
- 7.2.1 Cost and Affordability Constraints
- 7.2.2 Technology and Adoption Barriers
- 7.2.3 Supply Chain and Operational Constraints
- 7.3 Market Challenges
- 7.3.1 Competitive Pressure and Margin Erosion
- 7.3.2 Skills, Infrastructure and Implementation Gaps
- 7.4 Emerging Market Opportunities
- 7.5 Market Dynamics Impact and Time-Horizon Assessment
Chapter 8 UAE Fintech Lending & SME Credit Platforms Value Chain Analysis
- 8.1 Industry Value Chain Overview
- 8.2 Upstream Suppliers and Critical Inputs
- 8.3 Technology and Component Providers
- 8.4 Manufacturing or Service Delivery
- 8.5 Distribution, Channel Partners and Integrators
- 8.6 Downstream Applications and End Users
- 8.7 Value Addition and Profit Pools
- 8.8 Vertical Integration and Outsourcing
- 8.9 Supplier Concentration and Risk
- 8.10 Supply Chain Localization and Resilience
Chapter 9 UAE Fintech Lending & SME Credit Platforms Market Regulations and Policies
- 9.1 Relevant Laws, Standards and Compliance Frameworks
- 9.2 Product, Service, Safety and Quality Requirements
- 9.3 Government Policies, Incentives and Subsidies
- 9.4 Imports, Exports and Trade Barriers
- 9.5 Public Procurement and Local Content Requirements
- 9.6 Data Protection, AI and Cybersecurity Compliance
- 9.7 Upcoming Policy Changes and Market Implications
Chapter 10 UAE Fintech Lending & SME Credit Platforms Market Hotspots and Opportunities
- 10.1 Market Opportunity Mapping and Growth Hotspots
- 10.2 High-Growth Applications and Customer Groups
- 10.3 Underserved Markets and White-Space Opportunities
- 10.4 Emerging Technology and Product Opportunities
- 10.5 New Capacity and Investment Hotspots
- 10.6 Market Entry and Expansion Opportunities
- 10.7 Distribution and Partnership Opportunities
- 10.8 Near-Term and Long-Term Commercial Potential
- 10.9 Opportunity Attractiveness and Execution Risks
Chapter 11 UAE Fintech Lending & SME Credit Platforms Market Outlook, 2025-2035
- 11.1 Market Size and Analysis
- 11.1.1 Revenue (Market Measurement: 2025: USD 559.5 million → 2035: USD 2.85 billion)
- 11.1.2 Historical Market Size, 2018-2025
- 11.1.3 Base-Year Market Size, 2025
- 11.2 Market Forecast, 2025-2035
- 11.2.1 Revenue Forecast to 2035
- 11.2.2 CAGR and Year-on-Year Growth
- 11.2.3 Incremental Revenue Opportunity
- 11.3 Forecast Assumptions and Scenario Analysis
- 11.3.1 Base-Case Forecast
- 11.3.2 Optimistic and Conservative Scenarios
- 11.3.3 Technology, Pricing and Policy Sensitivities
- 11.4 Market Attractiveness and Growth Outlook
Chapter 12 UAE Fintech Lending & SME Credit Platforms Market Segmentation and Outlook
- 12.1 Segmentation Summary and Market Shares, 2025
- 12.2 Largest and Fastest-Growing Segments
- 12.3 By Product Type - Market Size and Forecast, 2025-2035
- 12.3.1 Segment Definition and Scope
- 12.3.2 Historical Market Size, 2018-2025
- 12.3.3 Revenue Forecast, 2025-2035
- 12.3.4 Base-Year Market Share, 2025
- 12.3.5 Segment CAGR and Growth Drivers
- 12.3.6 Subsegment Market Size and Forecast
- 12.3.6.1 Working Capital Loans
- 12.3.6.2 Invoice and Receivables Finance
- 12.3.6.3 Revenue-Based Finance
- 12.3.6.4 Merchant Cash Advance
- 12.3.6.5 Supply Chain Finance
- 12.3.7 Subsegment Pricing and Adoption Trends
- 12.3.8 Leading Suppliers and Competition
- 12.3.9 Regional Demand and Opportunities
- 12.4 By Customer Segment - Market Size and Forecast, 2025-2035
- 12.4.1 Segment Definition and Scope
- 12.4.2 Historical Market Size, 2018-2025
- 12.4.3 Revenue Forecast, 2025-2035
- 12.4.4 Base-Year Market Share, 2025
- 12.4.5 Segment CAGR and Growth Drivers
- 12.4.6 Subsegment Market Size and Forecast
- 12.4.6.1 Micro Enterprises
- 12.4.6.2 Small Enterprises
- 12.4.6.3 Medium Enterprises
- 12.4.7 Subsegment Pricing and Adoption Trends
- 12.4.8 Leading Suppliers and Competition
- 12.4.9 Regional Demand and Opportunities
- 12.5 By Institution Type - Market Size and Forecast, 2025-2035
- 12.5.1 Segment Definition and Scope
- 12.5.2 Historical Market Size, 2018-2025
- 12.5.3 Revenue Forecast, 2025-2035
- 12.5.4 Base-Year Market Share, 2025
- 12.5.5 Segment CAGR and Growth Drivers
- 12.5.6 Subsegment Market Size and Forecast
- 12.5.6.1 Licensed Finance Companies
- 12.5.6.2 Loan Crowdfunding Platforms
- 12.5.6.3 ADGM Regulated Digital Lenders
- 12.5.6.4 Bank-Owned Digital Lenders
- 12.5.6.5 Government Development Platforms
- 12.5.7 Subsegment Pricing and Adoption Trends
- 12.5.8 Leading Suppliers and Competition
- 12.5.9 Regional Demand and Opportunities
- 12.6 Segment Growth Comparison
- 12.7 Segment Attractiveness and Priority Matrix
Chapter 13 UAE Fintech Lending & SME Credit Platforms End-Use and Application Market Outlook
- 13.1 End-Use Industry and Customer Demand Structure
- 13.2 Leading Applications and Customer Groups
- 13.3 End-Use Market Size, Share and Forecast
- 13.4 Major End-Use Industry Deep Dives
- 13.4.1 Customer Requirements and Use Cases
- 13.4.2 Demand and Replacement Cycles
- 13.4.3 Technical and Regulatory Considerations
- 13.4.4 Purchasing and Procurement Models
- 13.4.5 Leading Vendors and Distribution Channels
- 13.4.6 Forecast and Commercial Opportunities
- 13.5 Emerging Applications and Cross-Segment Demand
- 13.6 End-Use Industry Investment Priorities
Chapter 14 UAE Fintech Lending & SME Credit Platforms Geographic Market Outlook, 2025-2035
- 14.1 Domestic Market Distribution and Demand Clusters
- 14.2 State- or Province-Wise Market Size and Forecast, 2025-2035
- 14.3 City and Metropolitan Market Outlook
- 14.4 Industrial, Manufacturing and Commercial Clusters
- 14.5 Geographic Concentration of Key End Users
- 14.6 Local Pricing and Purchasing Differences
- 14.7 Domestic Production Facilities and Capacity Map
- 14.8 Local Infrastructure and Project Pipeline
- 14.9 State-Level Policy and Incentive Differences
- 14.10 Subnational Investment Hotspots and Opportunities
- 14.11 Distribution and Logistics Networks
- 14.12 Domestic Competitive Footprint
Chapter 15 UAE Fintech Lending & SME Credit Platforms Technology, Innovation and Sustainability Outlook
- 15.1 Technology Landscape and Maturity
- 15.2 Product, Process and Service Innovation
- 15.3 AI, Automation and Digital Tools in the Industry
- 15.4 Technology Adoption and Performance Benchmarking
- 15.5 Innovation Pipeline and R&D Investment
- 15.6 Energy Efficiency and Resource Management
- 15.7 Sustainability, Recycling and Circularity
- 15.8 Technology Roadmap, 2025-2035
- 15.9 Risks of Obsolescence and Technology Substitution
Chapter 16 UAE Fintech Lending & SME Credit Platforms Market Key Strategic Imperatives
- 16.1 Growth and Market Entry Priorities
- 16.2 High-Return Products and Segments
- 16.3 Pricing, Profitability and Cost Optimization
- 16.4 Technology Investment and Product Differentiation
- 16.5 Supply Chain Localization and Resilience
- 16.6 Distribution and Customer Acquisition
- 16.7 Partnership, Acquisition and Capacity Strategy
- 16.8 Regional Expansion Priorities
- 16.9 Short-, Medium- and Long-Term Actions
Chapter 17 Competition Outlook
- 17.1 Industry Competition Characteristics
- 17.2 Market Structure and Concentration
- 17.3 Market Share and Competitive Positioning, 2025
- 17.4 Company-Wise Revenue and Product Benchmarking
- 17.5 Production and Service Capacity Benchmarking
- 17.6 Technology, Pricing and Differentiation
- 17.7 Regional Footprint and Distribution Strength
- 17.8 Mergers, Acquisitions and Strategic Alliances
- 17.9 New Entrants and Competitive Threats
- 17.10 Porter's Five Forces and Industry Attractiveness
- 17.11 Competitive Outlook, 2025-2035
Chapter 18 Company Profiles
- 18.1 Company Coverage and Selection Criteria
- 18.2 Beehive
- 18.2.1 Business Description
- 18.2.2 Company Ownership and Geographic Presence
- 18.2.3 Product and Service Portfolio
- 18.2.4 Manufacturing and Operating Footprint
- 18.2.5 Financial Performance and Investment
- 18.2.6 Market Share and Competitive Position
- 18.2.7 Technology and Innovation Capabilities
- 18.2.8 Strategic Alliances or Partnerships
- 18.2.9 Recent Developments
- 18.2.10 Growth Strategy and Outlook
- 18.3 Funding Souq
- 18.4 CredibleX
- 18.5 erad
- 18.6 FlapKap
- 18.7 Klub
- 18.8 Zelo
- 18.9 Numou
- 18.10 Trade Capital Partners
- 18.11 Fundbot
- 18.12 Other Relevant Market Participants
Note: Every listed company is profiled on the structure shown under the first company. The company list is preliminary and may change based on research findings, market developments, data availability and client requirements.
Chapter 19 Disclaimer
- 19.1 Research and Forecast Disclaimer
- 19.2 Data Source and Estimation Limitations
Note: The depth of individual sections depends on data availability for this market. Volume, capacity, trade and other unit-based metrics are included where applicable.