Insurer mandates hold most of the money that managers run
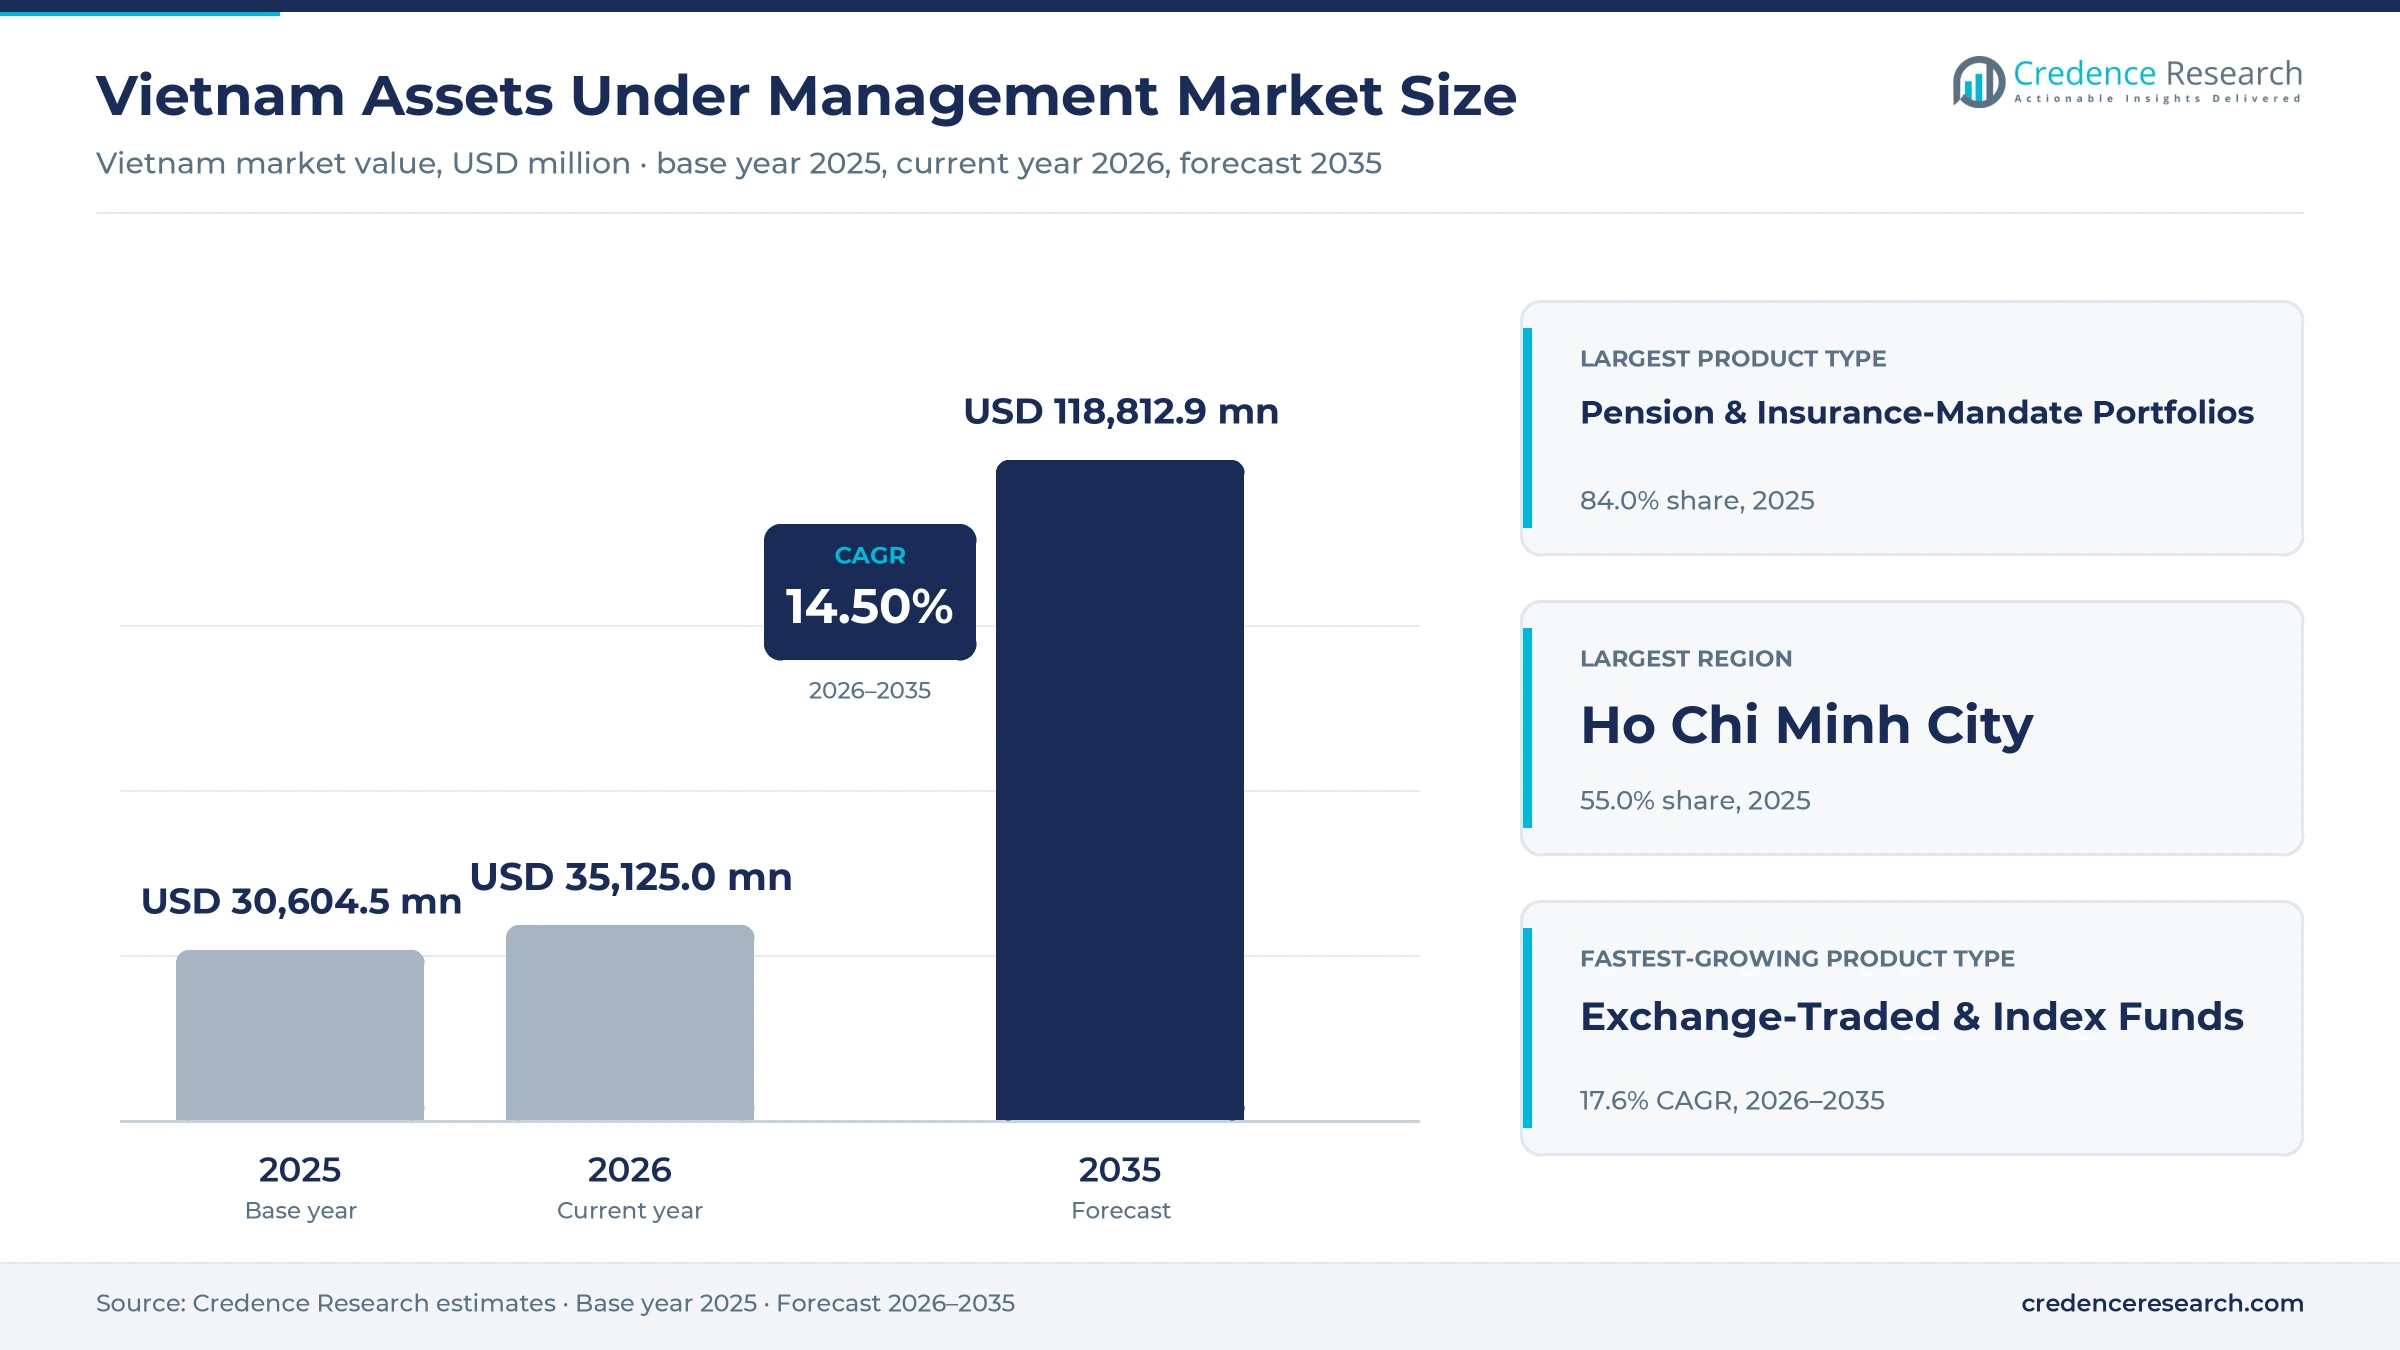
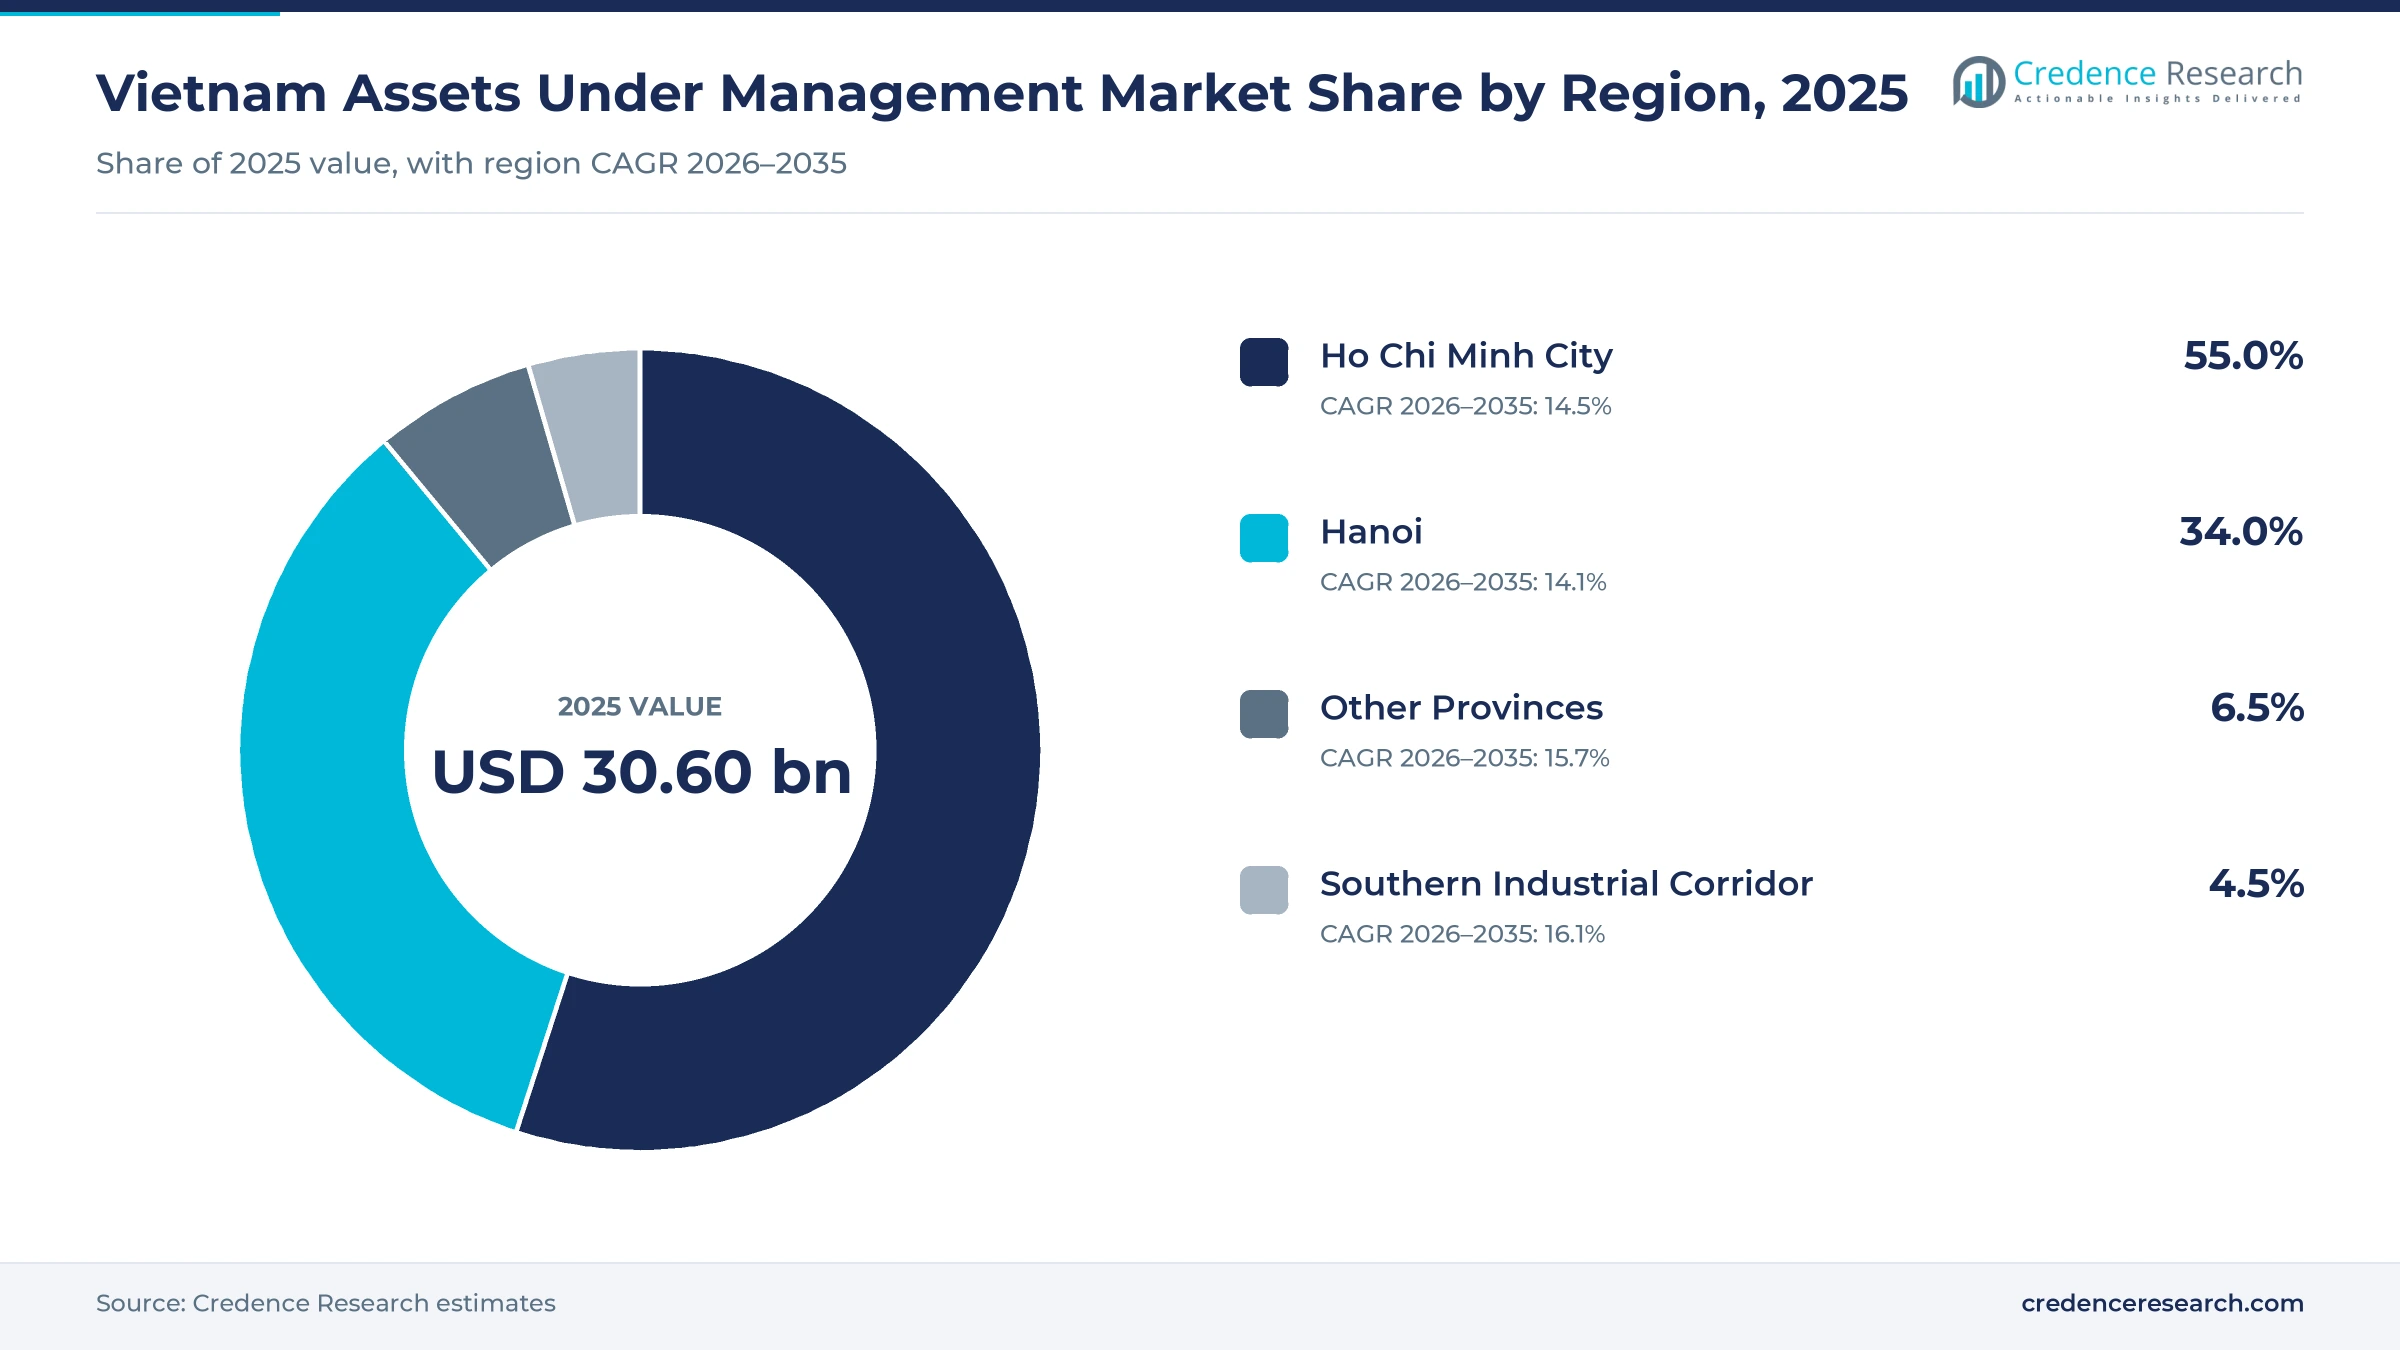
The Vietnam assets under management market was valued at USD 30.60 billion in 2025 and is projected to increase from USD 35.13 billion in 2026 to USD 118.81 billion by 2035, registering a CAGR of 14.50% during 2026–2035. Demand comes from life insurers that hand their reserves to affiliated fund managers, from households moving part of their savings out of bank deposits, and from foreign investors returning after the market reclassification. Ho Chi Minh City held the largest regional share, 55.0% in 2025, because most licensed managers, the Ho Chi Minh Stock Exchange and the largest insurers are based there, while the Southern Industrial Corridor is the fastest-growing region at 16.1% a year as factory wages and new brokerage accounts spread across Dong Nai and Tay Ninh. Pension and insurance-mandate portfolios carry most of the assets under management in the country. The most important commercial change is the move to FTSE Russell secondary emerging status from Sept. 21, 2026, which brings index-tracking money into Vietnamese equity funds.
Mandates from life insurers make up most of what is managed
The market counts the assets that licensed fund management companies run in Vietnam, including discretionary and insurance-mandate portfolios, public open-ended funds, exchange-traded and index funds, closed-end and member funds, and supplementary pension funds. Clients range from retail savers and wealthy families to insurers, banks, corporates and foreign institutions, and they buy through the manager directly, through banks and brokers, or through investment apps.
The count excludes bank deposits, securities held directly in brokerage accounts, offshore funds that invest in Vietnam but are managed abroad, and the balance sheets of insurers that are not entrusted to a fund manager. Value is earned through management, performance, advisory and distribution fees, and is shared between managers, their parent groups and the banks, brokers and platforms that sell fund units.
Vietnam Assets Under Management Market Insights
- The Vietnam assets under management market grows from USD 30.60 billion in 2025 to USD 118.81 billion by 2035, a 14.50% annual rate, as savings move from deposits into managed funds.
- Ho Chi Minh City held 55.0% of 2025 assets, while the Southern Industrial Corridor grows fastest at 16.1% a year.
- Pension & Insurance-Mandate Portfolios held 84.0% of 2025 assets, reflecting how much of the industry still runs money for life insurers.
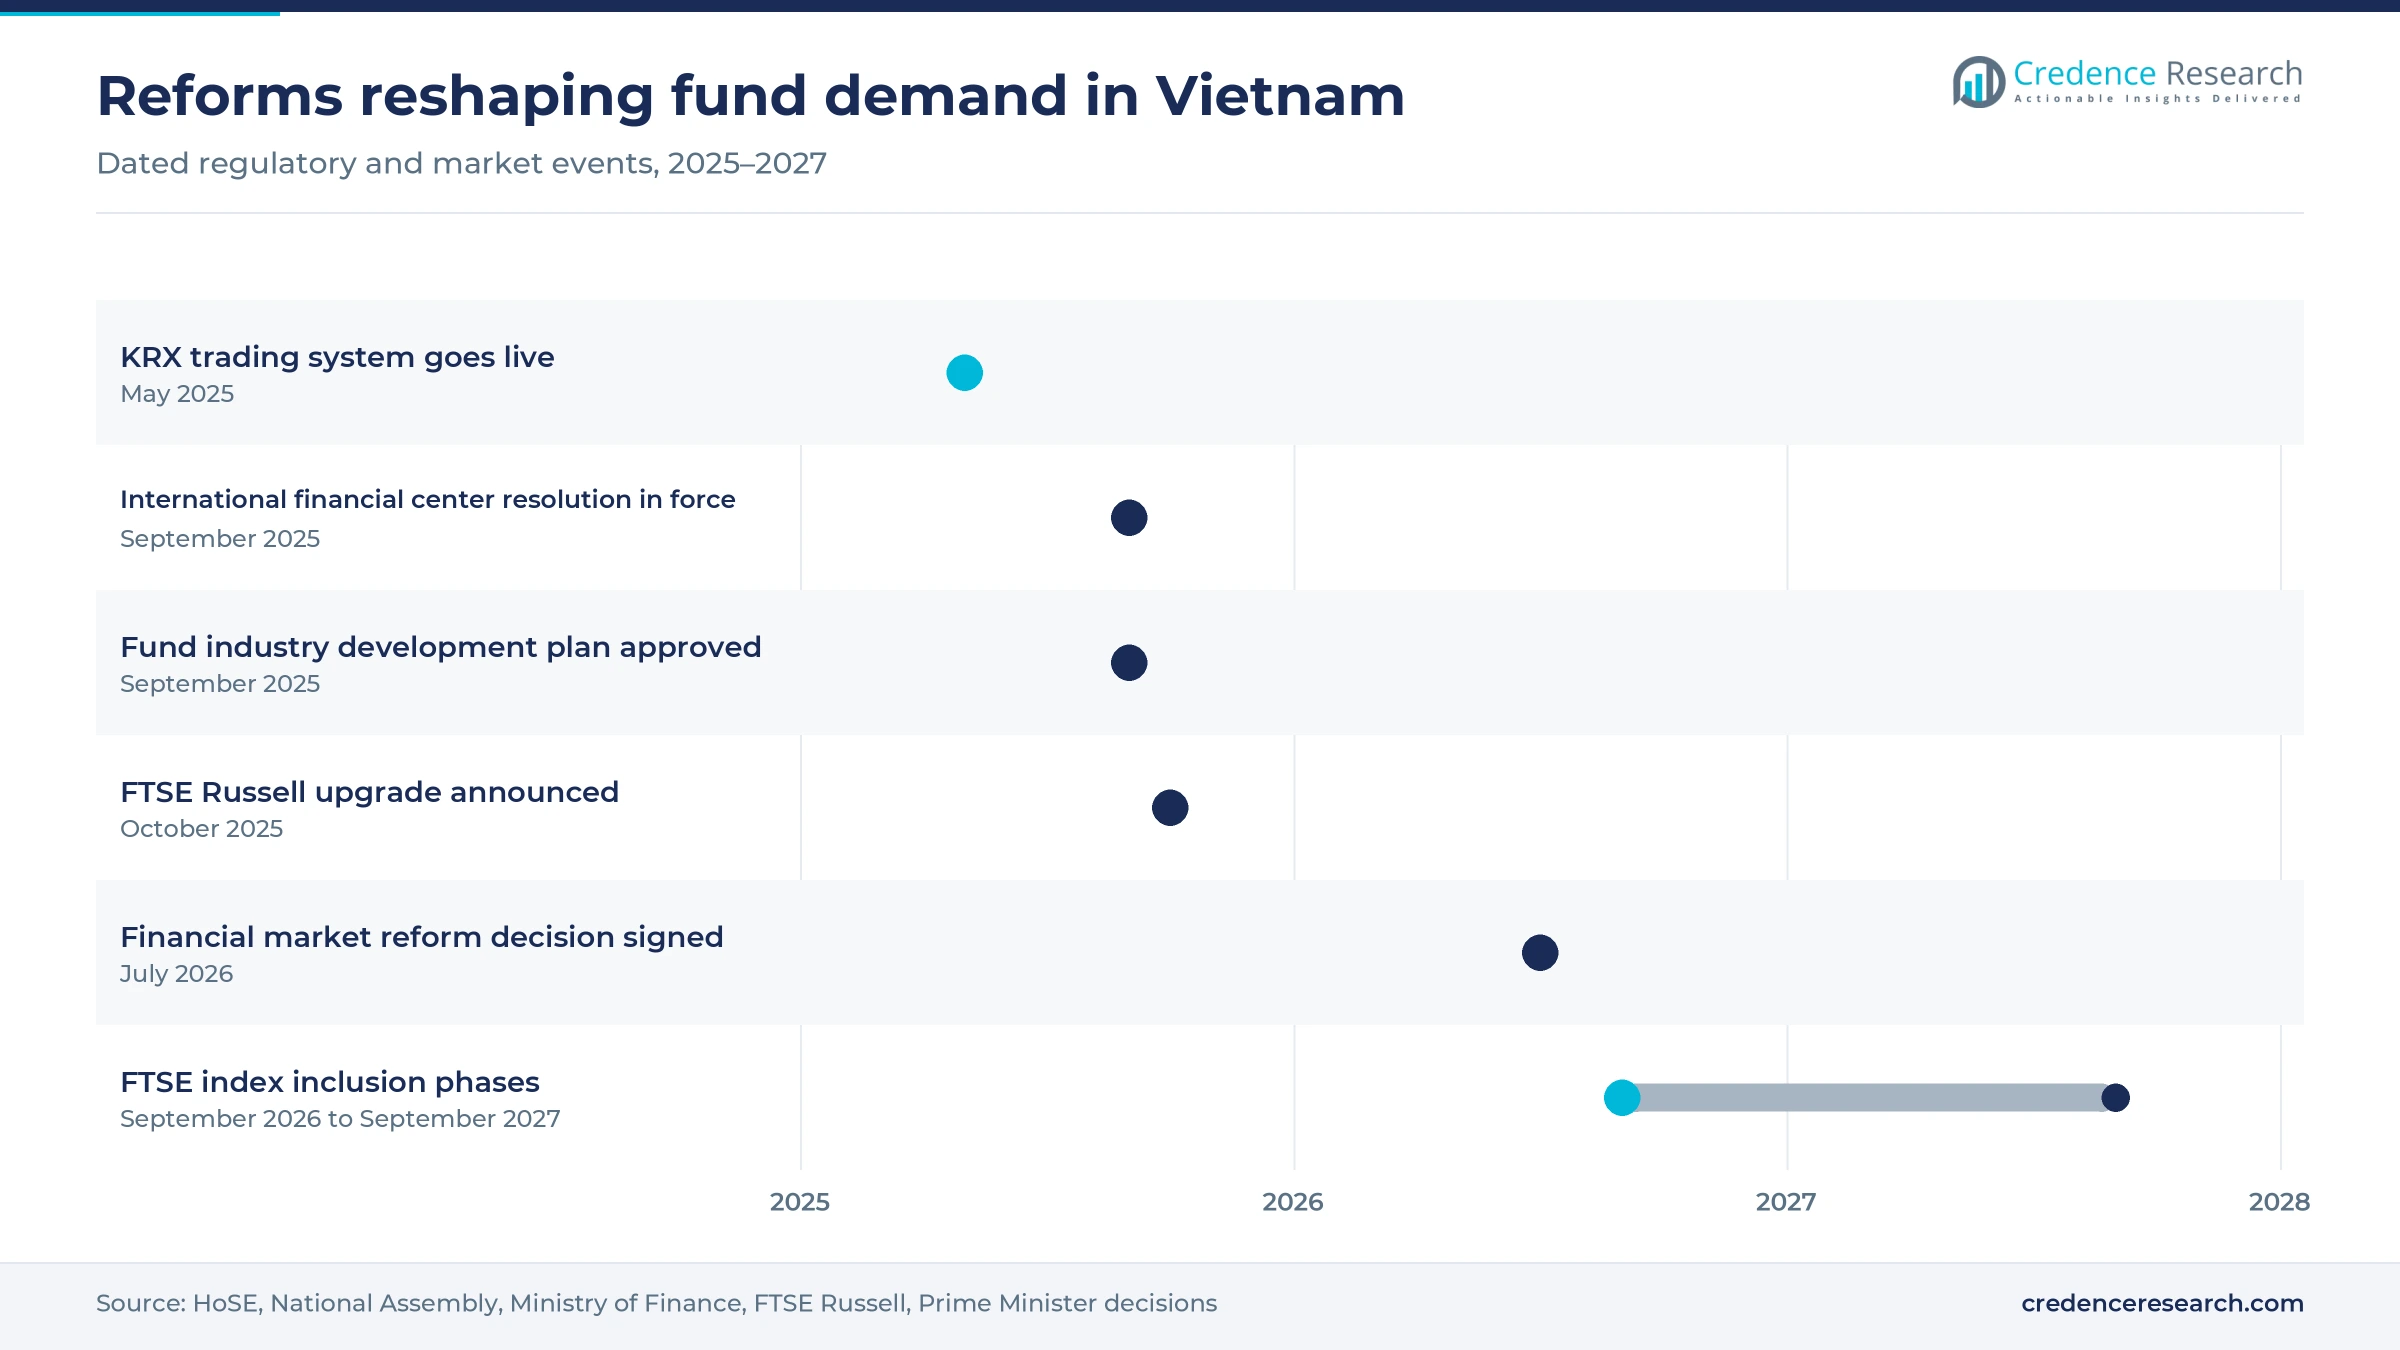
- FTSE Russell reclassified Vietnam as a secondary emerging market from Sept. 21, 2026, with index inclusion phased in through September 2027.
- The ten largest of the 43 licensed managers controlled about 95% of industry assets at the end of 2025, so entry happens mainly through acquisitions and partnerships.
Insurer mandates lead as ETFs and retail money grow fastest
Insurer mandates lead while exchange-traded funds grow fastest
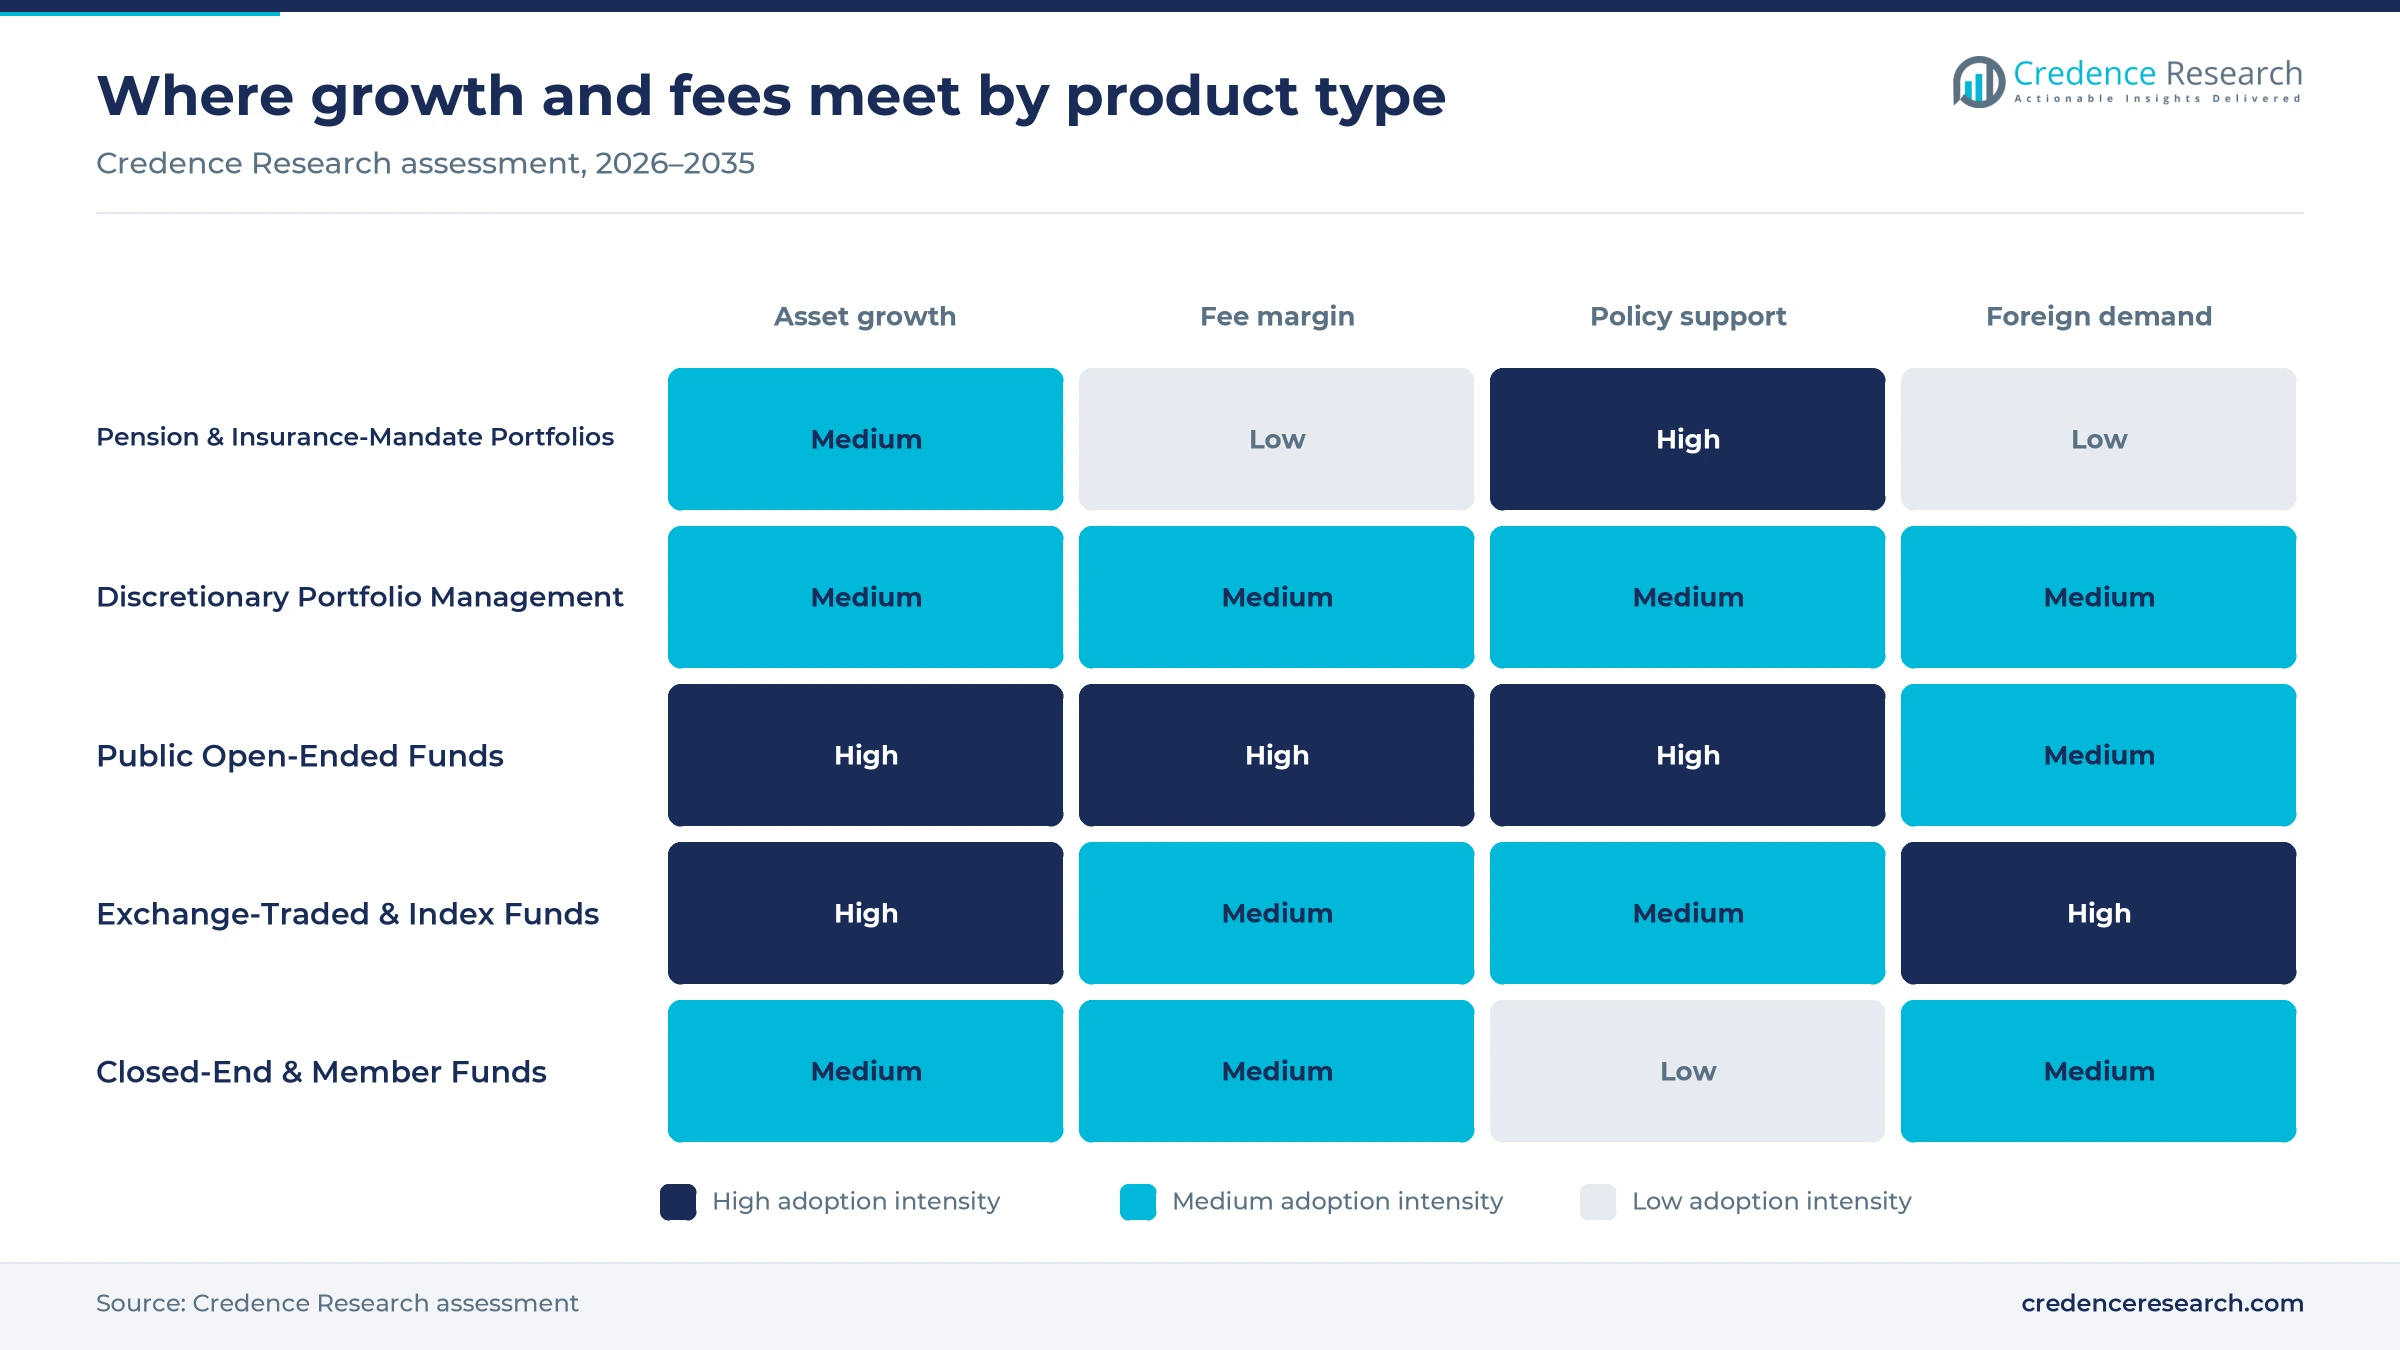
Based on product type, the market is categorized into discretionary portfolio management, public open-ended funds, exchange-traded & index funds, closed-end & member funds, and pension & insurance-mandate portfolios. Pension & Insurance-Mandate Portfolios led with 84.0% of 2025 assets because insurers entrust their reserves to sister companies, and Manulife Vietnam alone placed VND118.37 trillion with its fund arm at the end of 2024, according to The Investor. Exchange-Traded & Index Funds grow fastest at 17.6% a year, as Nguoi Quan Sat reported in December 2025 that the DCVFMVN Diamond ETF held about VND13.2 trillion. Index products are likely to capture most of the new foreign money arriving after 2026.
Insurers dominate the client base as retail savers grow fastest
Based on customer segment, the market is categorized into retail individuals, high-net-worth individuals, insurance companies, banks & corporates, and foreign & institutional investors. Insurance Companies led with 84.5% of 2025 assets because life premiums of about VND150 trillion a year, as the Vietnam Insurance Association estimated for 2025, keep feeding mandate portfolios. Retail Individuals grow fastest at 17.7% a year from a small base, since only about 473,000 Vietnamese, 0.46% of the population, invested through mutual funds at the end of 2025, The Investor reported. Each new saver moves the retail line sharply because the starting base is so small.
Direct mandates lead while fintech apps grow fastest
Based on distribution channel, the market is categorized into direct asset manager, bank & bancassurance, securities brokerage & wealth platforms, and digital fintech platforms. Direct Asset Manager led with 87.0% of 2025 assets because mandates are signed directly between insurers and their fund arms, and Eastspring Vietnam, part of Prudential, managed VND159 trillion at the end of the first quarter of 2025, The Investor reported. Digital Fintech Platforms grow fastest at 18.2% a year, as SSI Asset Management began selling three funds through the Finhay app of Vina Securities on Aug. 6, 2025. Apps now set the cost of reaching small savers who invest a few million dong.
Fixed income leads as equity growth funds gain fastest
Based on risk category, the market is categorized into capital preservation, fixed income, balanced & multi-asset, equity growth and alternatives & private markets. Fixed Income led with 53.0% of 2025 assets because the Ministry of Finance said in September 2025 that nearly 90% of industry assets were entrusted money, mainly from insurers and placed in bonds and bank deposits. Equity Growth grows fastest at 16.2% a year, as listed stocks reached 78.5% of GDP and companies raised USD 15.8 billion through the stock market in the first nine months of 2025, according to the State Securities Commission. Equity managers gain the most from the index upgrade and from renewed demand for growth funds.
| Segment Group | Leading Sub-segment | Share, 2025 | Fastest-growing Sub-segment | CAGR, 2026–2035 |
|---|---|---|---|---|
| By Product Type | Pension & Insurance-Mandate Portfolios | 84.0% | Exchange-Traded & Index Funds | 17.6% |
| By Customer Segment | Insurance Companies | 84.5% | Retail Individuals | 17.7% |
| By Distribution Channel | Direct Asset Manager | 87.0% | Digital Fintech Platforms | 18.2% |
| By Risk Category | Fixed Income | 53.0% | Equity Growth | 16.2% |
Fees fall from equity funds to bonds and insurer mandates
Pricing works as an annual fee on assets, charged daily against net asset value, with redemption fees used to keep retail money invested. Equity funds charge the most because they need research teams and face the sharpest redemptions, while bond funds and insurer mandates run on thin margins and large balances. The mix explains why industry fee income grows more slowly than assets, because most money sits in low-fee mandates. Managers that grow equity and ETF assets lift their average fee rate, so the index upgrade matters more for profits than for volume. An equity fund charging 1.75% a year earns about twice the fee of a bond fund at 0.9%, so shifts in demand between them move margins.
| Product or fee | Typical price or fee | Basis |
|---|---|---|
| Open-ended equity fund management fee | 1.75% a year, 0% subscription | VinaCapital VEOF factsheet, December 2025 |
| Equity fund redemption fee | 2% in year one, 1% in year two, 0% after 730 days | VinaCapital VEOF factsheet, December 2025 |
| Open-ended bond fund management fee | 0.9% a year, 0% subscription | VinaCapital VLBF factsheet, December 2025 |
| Insurer mandate fee | 0.2% to 0.4% of assets a year | Credence Research estimate from published fund-manager accounts |
| Performance fee on private mandates | 10% to 20% of returns above a hurdle | Credence Research estimate from mandate terms |
Request a Free Sample
Fill in your details and we'll send you a free sample report.
- Sample data tables & charts
- Research methodology
Policy targets, index inclusion and new products lift assets
Policy-led expansion of the fund investor base
Government targets now push savings toward funds rather than leaving that shift to market cycles. The Ministry of Finance approved Decision 3168 on Sept. 12, 2025, a plan to restructure the investor base and develop the fund industry, and it aims for about 500 funds and 2.5 million fund investors by 2030. The starting point is narrow, since Vietcombank Fund Management's Nguyen Thi Hang Nga put open-ended fund investors at just over 700,000 in September 2026, against about 13 million securities accounts, Vietnam News reported. The Prime Minister then signed Decision 1413 on July 27, 2026, calling for a larger role for institutional investors across the financial market. For managers, the gap between brokerage accounts and fund holders is the most direct pool of new clients over the forecast period.
Institutionalization of Vietnam's capital markets
Market reforms are turning Vietnam from a retail trading venue into one that index funds and global institutions must hold. The Ho Chi Minh Stock Exchange switched to the KRX trading system on May 5, 2025, and authorities replaced the pre-funding rule for foreign institutions with a non-prefunding model. The World Bank estimated in April 2026 that the FTSE Russell upgrade could bring USD 3 billion to 5 billion of portfolio flows in the first few years and USD 25 billion by 2030 if reforms continue. KIM Vietnam chief executive Huynh Tuan Khanh said in July 2026 that active foreign funds could add USD 3 billion to 4 billion. Domestic equity and ETF managers are the first to receive this money, which lifts both assets and fee income.
Broader investment product architecture
A wider product shelf gives each client group a fund that fits its horizon, which raises the share of savings that managers can capture. The State Securities Commission counts 142 securities investment funds, including 106 public funds, as reported by Vietstock in September 2026. Decree 85/2026 on supplementary pension insurance replaced the 2016 pilot rules and lets pension funds buy rated listed corporate bonds. Resolution 222/2025/QH15, in force since Sept. 1, 2025, allows investment funds and asset managers to join the international financial centers in Ho Chi Minh City and Da Nang. Each new wrapper, from payroll pension plans to bond-holding pension funds, opens a channel for long-horizon money that ordinary equity funds could not reach, which favors managers holding pension licenses.
Insurer balance sheets keep mandate assets rising
Life insurers remain the anchor client, so the growth of their balance sheets sets a floor under industry assets. The Vietnam Insurance Association projected total insurance-sector assets of about VND1.1 quadrillion, or USD 43.3 billion, at the end of 2025. Insurers reinvested more than VND900 trillion into the economy in 2025, much of it through government bonds and deposits run by affiliated managers. The same association counted more than 2,100 insurance products on sale in 2025. As a result, Insurance Companies keep their lead through 2035, although their share slips as retail and foreign money grows faster. Managers tied to an insurer gain a steady base, while independents must win retail and foreign clients to grow.
Investors rotate to bond funds as sales move onto apps
Shift from equity funds toward bond funds
Investors are rotating out of equity funds and into bond funds, even in months when share prices rise. Vietnam News reported in September 2025 that equity funds saw a net outflow of VND7.6 trillion in August 2025, the largest since August 2023, while the VN-Index rose almost 12% that month. Thai holders of depositary receipts drove much of the selling in the two largest local ETFs. Bond funds took in nearly VND6.5 trillion over the 12 months to August 2025, their third straight month of net inflows. The rotation favors managers with strong fixed-income desks and means equity managers depend on the index upgrade to reverse redemptions.
Rise of app-based and bank distribution of fund units
Fund units are moving onto digital and bank channels, which lowers the cost of serving small investors. The Ministry of Finance proposed in September 2025 that commercial banks be allowed to distribute and invest in fund certificates by amending State Bank Circular 16 of Nov. 10, 2021. The State Securities Commission also planned to revise Circular 98 to support online fund distribution. The securities depository is due to finish a central public fund information system by 2028, according to The Investor. Managers that integrate with bank apps and digital payments wallets can reach the deposit base without building their own branch networks.
Opportunity in supplementary pension funds
Voluntary pension savings are an early-stage opening that suits managers with long-horizon products. Vietstock reported in June 2026 that four managers ran seven supplementary pension funds with net assets above VND2.2 trillion by the end of 2025, with almost 28,600 participants. Contributions are tax-deductible only up to VND1 million a month, a cap that has not moved for years, and a draft tax amendment would raise it to VND3 million. Workers can join only through their employers, which an official called a bottleneck. A higher cap would make pension plans a standard payroll benefit and lift long-term inflows to the licensed managers.
Opportunity in first-time investors beyond the two big cities
Retail investors outside Hanoi and Ho Chi Minh City are a large, mostly untouched pool for managers that can sell simply and cheaply. The securities depository counted 11.3 million securities accounts at the end of October 2025, and individuals held 99% of them, The Investor reported. About 310,000 new accounts were opened in October 2025 alone, the highest monthly rise in a year. Fund industry leaders said in September 2026 that fund certificate ownership remains limited outside the two cities. Managers that pair online brokerage accounts with small regular-savings plans can turn these traders into long-term fund holders.
Bank savings habits and slow licensing hold back funds
Fund assets remain small relative to GDP
Asset growth has not changed the structure of the industry, which limits the case for new entrants. The Investor reported in June 2026 that industry assets of more than VND806 trillion at the end of 2025 equal only about 6.5% of GDP, against more than 20% in Thailand and 40% to 60% in Malaysia. Most assets under management still come from a few large insurer mandates. Managers without an insurer parent therefore compete for a thin slice of retail money, and they respond with low-fee bond funds and app tie-ups.
Life insurance sales have not recovered
Mandate growth depends on life insurance sales, which fell after the investment-linked product mis-selling cases. The Insurance Supervisory Authority reported that life premiums fell 5% in 2024 to VND149,204 billion, the second straight year of decline. Rules now restrict selling investment-linked policies near loan disbursement at banks. Slower premium growth means smaller new mandates, so insurer-backed managers are building retail and pension products to offset it.
Lengthy fund licensing delays new products
Slow approvals mean new funds can miss the market windows they were designed for. KIM Vietnam chief executive Huynh Tuan Khanh said on Vietnam Television on July 2, 2026, that lengthy licensing procedures raise the opportunity cost of capital waiting to be deployed. The delay matters most as index inflows arrive from September 2026. Managers file products early and lean on existing ETFs, which favors incumbents over newcomers.
Banks still absorb most household savings
Bank deposits remain the default home for savings, which caps how much money reaches funds in any year. The World Bank found that the banking sector mobilized about USD 53.5 billion a year on average in 2019 to 2023, against about USD 2.9 billion for the stock market. Household deposits exceed VND11 quadrillion, Vietnam News reported on Sept. 24, 2026. Managers respond by selling funds through bank partners rather than competing head-on with deposits.
Ho Chi Minh City leads and the corridor grows fastest
| Region | Value, 2025 (USD billion) | Share, 2025 | CAGR, 2026–2035 |
|---|---|---|---|
| Ho Chi Minh City | 16.83 | 55.0% | 14.5% |
| Hanoi | 10.41 | 34.0% | 14.1% |
| Other Provinces | 1.99 | 6.5% | 15.7% |
| Southern Industrial Corridor | 1.38 | 4.5% | 16.1% |
Ho Chi Minh City leads on exchanges, insurers and managers
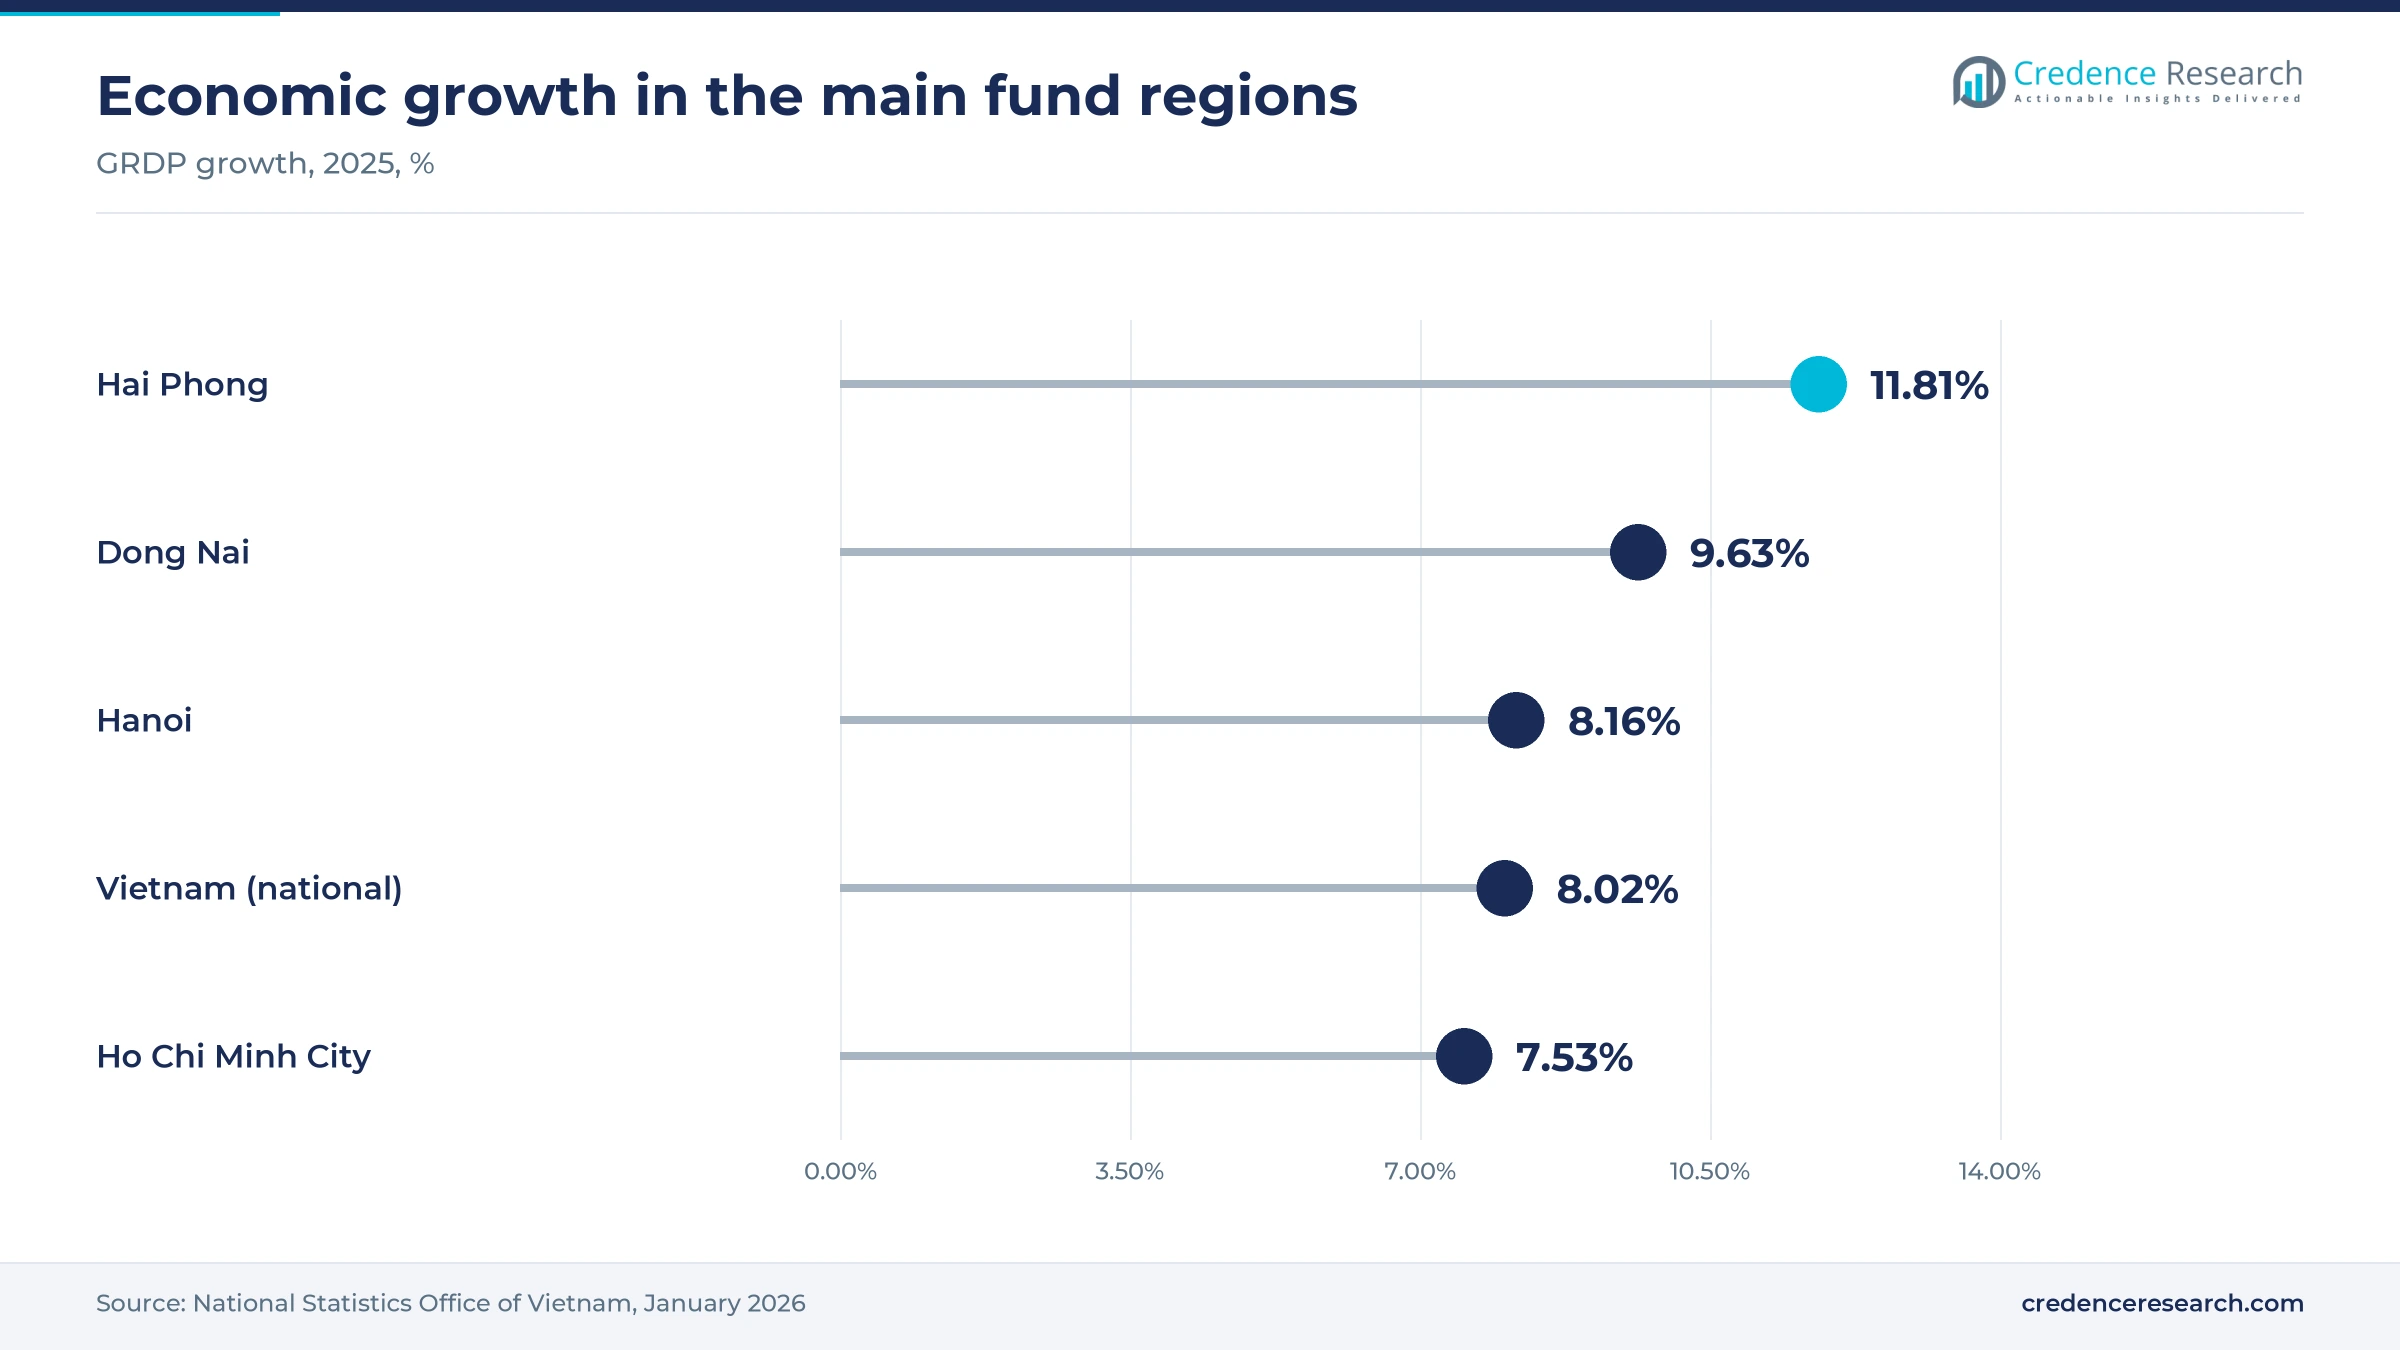
Ho Chi Minh City held 55.0% of 2025 assets and grows at 14.5% a year, which keeps it the industry's center. The Ho Chi Minh Stock Exchange, the largest foreign-owned managers and the biggest life insurers are based there, and the city absorbed Binh Duong and Ba Ria-Vung Tau in the July 2025 merger. The National Statistics Office said in January 2026 that the city grew 7.53% in 2025 and that Ho Chi Minh City and Hanoi together contributed 36.1 percentage points of national growth. Its international financial center should draw more foreign fund platforms over time.
Hanoi anchors bank-backed and state-linked managers
Hanoi's share of 2025 assets was 34.0%, and the city grows at 14.1% a year, slightly below the national rate. The capital hosts the regulator, the Hanoi Stock Exchange and managers tied to state-owned banks and the Bao Viet group. The city grew 8.16% in 2025, according to the National Statistics Office. Bank-backed managers here gain most if commercial banks are allowed to sell fund certificates.
Southern Industrial Corridor grows fastest from a small base
The Southern Industrial Corridor held 4.5% of 2025 assets and grows fastest at 16.1% a year. Dong Nai, which absorbed Binh Phuoc, recorded estimated growth of 9.63% in 2025, and Tay Ninh absorbed Long An in the same reform. Factory employment and rising wages create savers who are new to investing, though few hold funds today. Managers reach them mainly through payroll pension plans and investment apps rather than branches.
Other provinces offer the largest untapped saver pool
Other Provinces held 6.5% of 2025 assets, a small share relative to their combined economic output. Hai Phong grew 11.81% in 2025, one of the fastest local economies, and Da Nang is building the second international financial center. Fund ownership in these provinces is thin, so demand growth of 15.7% a year depends on bank and app distribution. Managers that partner with regional banks can add investors at a lower cost than opening offices.
Trading systems, index decisions and new partnerships
| Development | Status and market relevance |
|---|---|
| In May 2025, the Ho Chi Minh Stock Exchange began trading on the KRX system, supporting the later non-prefunding model for foreign institutions. | In operation since May 5, 2025 |
| In August 2025, SSI Asset Management began distributing three open-ended funds through the Finhay platform of Vina Securities. | Live for retail investors |
| In October 2025, FTSE Russell announced that Vietnam would move from frontier to secondary emerging market status. | Confirmed in April 2026; effective Sept. 21, 2026 |
| In December 2025, Dragon Capital Vietnam Fund Management set the shareholder record date to list 31.2 million shares on UPCoM. | Listing registration in progress |
| In July 2026, the Prime Minister signed Decision 1413 on comprehensive reform of the financial market. | Implementation under way |
Settlement upgrades and eKYC reshape how funds are sold
- KRX trading system replaced the old platform at the Ho Chi Minh Stock Exchange, giving funds faster order handling and the base for new products.
- Non-prefunding framework lets foreign institutions trade without depositing cash in advance, a condition that index providers required for the upgrade.
- eKYC onboarding allows investors to open accounts and buy fund units on a phone, which cuts the cost of serving small savers.
- Central fund information system planned by the securities depository for 2028 will give investors one place to compare public funds.
Need a Custom Version of This Report?
Tailor the scope, geography, or segments to your exact requirements.
- Custom geography or segment scope
- Direct access to our analyst team
Ten managers hold nearly all assets in a mandate-led field
Competition is organized around access to captive money rather than around price. Eastspring Vietnam, backed by Prudential and the fund arm of Manulife Vietnam run the largest insurer mandates, while Bao Viet Fund Management manages money for the Bao Viet group and an ETF. Dragon Capital Vietnam Fund Management, with about VND128 trillion of assets in May 2025, leads in retail equity funds and ETFs. VinaCapital and KIM Vietnam compete through equity, bond and index products. Bank-linked managers such as Vietcombank Fund Management, MB Capital and Techcom Capital lean on their parent banks, and SSI Asset Management uses its broker parent and app partners. Four of these managers also run licensed supplementary pension funds, so payroll plans are becoming a new contest for long-term money. Captive insurer and bank money keeps these leaders secure through the forecast, so challengers grow mainly by buying licenses or partnering with apps.
A concentrated field built around insurer and bank parents
The supply side is highly concentrated, with 43 licensed managers but about 95% of assets held by the ten largest, according to Viet Wisdom data. Most leaders are captive arms of insurers, such as Eastspring, Manulife and Bao Viet, or of banks and brokers, such as Vietcombank Fund Management, MB Capital, Techcom Capital and SSI Asset Management. The industry recorded 14 ownership changes, mergers and acquisitions from 2017 to 2025, because buying a license and a client book is faster than starting from scratch. Margins are highest in retail equity funds and lowest in insurer mandates, which is why independents focus on performance and distribution.
Leading managers and how each competes in Vietnam
| Company | Type | Role in the market |
|---|---|---|
| Eastspring Investments Fund Management Company (Vietnam) | Insurer-backed manager | Prudential fund arm running insurer mandates and public funds |
| Manulife Investment Management (Vietnam) | Insurer-backed manager | Manages a VND118.37 trillion trust from Manulife Vietnam plus equity and balanced funds |
| Dragon Capital Vietnam Fund Management | Foreign-owned manager | Largest retail equity and ETF house; licensed pension fund manager |
| Bao Viet Fund Management | Insurer-backed manager | Manages Bao Viet group assets and the FUEBFVND ETF |
| VinaCapital Fund Management | Foreign-owned manager | Open-ended equity and bond funds sold to retail investors |
| SSI Asset Management | Securities-backed manager | Sells funds through the Finhay app; licensed pension fund manager |
| Techcom Capital | Bank-backed manager | Fund arm of the Techcombank group serving its bank clients |
| Vietcombank Fund Management | Bank-backed manager | Joint venture linked to Vietcombank; licensed pension fund manager |
| MB Capital | Bank-backed manager | Fund arm of the MB group; licensed pension fund manager |
| KIM Vietnam Fund Management | Foreign-owned manager | Korea Investment Management unit running the FUEKIVFS ETF |
Retail and foreign money must reduce reliance on insurers
Credence Research's view is that the market's next stage depends on reducing its reliance on insurer mandates. Those mandates give the industry scale, but they carry low fees and grow only as fast as life insurance sales. Real change comes from retail savers and foreign institutions, which pay higher fees and are now within reach because of the index upgrade, wealthtech distribution and the pension decree. Managers that combine a bank or broker channel with a credible equity record are best placed. Retail Individuals grow at 17.7% a year, faster than any other client group, which makes retail demand the main source of new fee income.
Values built from regulator data, fund reports and filings
The report uses 2025 as the base year and forecasts values for 2026 to 2035 in U.S. dollars. Market values come from the Credence Research model, which starts from industry asset totals published by the State Securities Commission and reported by the financial press, then checks them against insurance-sector assets and fund net asset values. Segment and regional splits are Credence Research estimates based on fund reports, company disclosures, regulator statements and official statistics on provincial growth. Fee ranges come from fund factsheets, fund-manager accounts and published fund documents. No primary interviews or surveys were used in building these estimates.
Index flows and pension reform set the pace through 2035
Through 2035, assets should grow faster than the economy as policy targets, index inclusion and pension reform pull savings into managed funds. Insurer mandates will remain the largest block, but exchange-traded funds, retail open-ended funds and digital channels will gain share each year. Growth will be uneven, because equity flows follow foreign sentiment and life insurance sales. The decisive variables are whether banks may sell fund certificates, whether the pension tax cap rises and whether Vietnam reaches MSCI emerging market status, which would bring a larger wave of foreign money. Assets under management reach USD 118.81 billion by 2035 in the base case, with index products and retail funds taking a rising share of new money.
Index inflows and pension rules decide the range of outcomes
In the base case, assets under management in Vietnam grow at 14.50% a year from USD 35.13 billion in 2026. The outcome depends on whether foreign index money and household savings both arrive, or only one of them. The downside case assumes renewed equity redemptions, weak life insurance sales and no change to pension tax rules. The base case follows phased FTSE inclusion and steady insurer mandates. The upside case adds bank distribution of fund certificates, a higher pension deduction and progress toward an MSCI upgrade, which would bring larger flows than the FTSE move.
| Scenario | CAGR, 2026–2035 | Value, 2035 | What has to hold |
|---|---|---|---|
| Downside | 11.5% | USD 93.56 billion | Foreign selling persists, insurer premiums stay flat and pension tax caps are unchanged |
| Base | 14.50% | USD 118.81 billion | FTSE inclusion completes by September 2027 and insurer mandates grow in line with premiums |
| Upside | 17.0% | USD 144.31 billion | Banks sell fund certificates, the pension cap rises and an MSCI upgrade follows by 2028 |
Frequently Asked Questions
How big is the Vietnam assets under management market?
Which product type holds the most assets?
Which product type grows fastest?
Which region leads the market?
How concentrated is the industry?
What does the FTSE Russell upgrade change?
What fees do Vietnamese funds charge?
What holds the market back?
Table of Content
Chapter 1 Market Segmentation
- 1.1 Segmentation Framework
- 1.1.1 Product and Service Classification
- 1.1.2 Application and End-Use Classification
- 1.1.3 Technology and Solution Classification
- 1.1.4 Customer and Distribution Channel Classification
- 1.1.5 Geographic Segmentation
- 1.1.6 Market Segment Definitions and Boundaries
- 1.2 By Product Type
- 1.2.1 Pension & Insurance-Mandate Portfolios
- 1.2.2 Discretionary Portfolio Management
- 1.2.3 Public Open-Ended Funds
- 1.2.4 Exchange-Traded & Index Funds
- 1.2.5 Closed-End & Member Funds
- 1.3 By Customer Segment
- 1.3.1 Insurance Companies
- 1.3.2 Retail Individuals
- 1.3.3 High-Net-Worth Individuals
- 1.3.4 Banks & Corporates
- 1.3.5 Foreign & Institutional Investors
- 1.4 By Risk Category
- 1.4.1 Capital Preservation
- 1.4.2 Fixed Income
- 1.4.3 Balanced & Multi-Asset
- 1.4.4 Equity Growth
- 1.4.5 Alternatives & Private Markets
Chapter 2 Introduction
- 2.1 Report Objectives and Scope
- 2.2 Product Definition and Industry Terminology
- 2.3 Market Inclusions and Exclusions
- 2.4 Research Process
- 2.4.1 Primary Research and Expert Interviews
- 2.4.2 Secondary Research and Source Review
- 2.4.3 Top-Down and Bottom-Up Estimation
- 2.4.4 Data Triangulation and Verification
- 2.5 Market Size Measurement Basis
- 2.5.1 2025: USD 30.60 billion → 2035: USD 118.81 billion
- 2.6 Historical and Forecast Reference Periods
- 2.6.1 Historical Period: 2018-2025
- 2.6.2 Base Year: 2025
- 2.6.3 Forecast Period: 2025-2035
- 2.7 Research Assumptions and Limitations
Chapter 3 Executive Summary
- 3.1 Market Snapshot and Key Findings
- 3.2 Base-Year Market Size, 2025
- 3.3 Forecast Market Size, 2035
- 3.4 Revenue and Volume Growth Outlook
- 3.5 Key Demand and Supply Indicators
- 3.6 Leading Market Segments
- 3.7 Fastest-Growing Market Opportunities
- 3.8 Regional Performance Highlights
- 3.9 Technology and Industry Transformation
- 3.10 Competitive Landscape Summary
- 3.11 Analyst View and Strategic Implications
Chapter 4 Vietnam Assets Under Management Market Trends and Developments
- 4.1 Historical Industry Development, 2018-2025
- 4.2 Recent Market Trends and Developments
- 4.3 Demand and Customer Behavior Trends
- 4.4 Technology and Product Innovation
- 4.5 Artificial Intelligence, Automation and Digitalization
- 4.6 Local Manufacturing and Supply Chain Realignment
- 4.7 Industry Partnerships, Mergers and Acquisitions
- 4.8 Sustainability and Circular Economy Developments
- 4.9 Government and Private Sector Investment Trends
- 4.10 Emerging Business Models and Commercialization
- 4.11 Industry Developments and Announcements
Chapter 5 Vietnam Assets Under Management Market Supply and Demand Analysis
- 5.1 Demand Trend and Consumption Analysis, 2018-2025
- 5.2 Demand Forecast, 2025-2035
- 5.3 Supply Chain Structure and Procurement Trends
- 5.4 Supply-Demand Gap and Bottlenecks
- 5.5 Import Dependence and Sourcing Structure
- 5.6 Regional Supply and Demand Concentration
Chapter 6 Vietnam Assets Under Management Market Pricing Analysis
- 6.1 Pricing Structure and Measurement
- 6.2 Historical Pricing Trends, 2018-2025
- 6.3 Pricing Outlook, 2025-2035
- 6.4 Pricing by Product and Market Segment
- 6.5 Geographic Pricing Differences
- 6.6 Key Input, Energy, Labor and Logistics Costs
- 6.7 Contract Pricing and Purchasing Models
- 6.8 Pricing Sensitivity and Competitive Positioning
- 6.9 Price, Margin and Profitability Implications
Chapter 7 Vietnam Assets Under Management Market Dynamics
- 7.1 Market Growth Drivers
- 7.1.1 Demand-Side Drivers
- 7.1.2 Technology and Innovation Drivers
- 7.1.3 Infrastructure and Investment Drivers
- 7.1.4 Regulatory and Policy Drivers
- 7.2 Market Restraints
- 7.2.1 Cost and Affordability Constraints
- 7.2.2 Technology and Adoption Barriers
- 7.2.3 Supply Chain and Operational Constraints
- 7.3 Market Challenges
- 7.3.1 Competitive Pressure and Margin Erosion
- 7.3.2 Skills, Infrastructure and Implementation Gaps
- 7.4 Emerging Market Opportunities
- 7.5 Market Dynamics Impact and Time-Horizon Assessment
Chapter 8 Vietnam Assets Under Management Value Chain Analysis
- 8.1 Industry Value Chain Overview
- 8.2 Upstream Suppliers and Critical Inputs
- 8.3 Technology and Component Providers
- 8.4 Manufacturing or Service Delivery
- 8.5 Distribution, Channel Partners and Integrators
- 8.6 Downstream Applications and End Users
- 8.7 Value Addition and Profit Pools
- 8.8 Vertical Integration and Outsourcing
- 8.9 Supplier Concentration and Risk
- 8.10 Supply Chain Localization and Resilience
Chapter 9 Vietnam Assets Under Management Market Regulations and Policies
- 9.1 Relevant Laws, Standards and Compliance Frameworks
- 9.2 Product, Service, Safety and Quality Requirements
- 9.3 Government Policies, Incentives and Subsidies
- 9.4 Imports, Exports and Trade Barriers
- 9.5 Public Procurement and Local Content Requirements
- 9.6 Data Protection, AI and Cybersecurity Compliance
- 9.7 Upcoming Policy Changes and Market Implications
Chapter 10 Vietnam Assets Under Management Market Hotspots and Opportunities
- 10.1 Market Opportunity Mapping and Growth Hotspots
- 10.2 High-Growth Applications and Customer Groups
- 10.3 Underserved Markets and White-Space Opportunities
- 10.4 Emerging Technology and Product Opportunities
- 10.5 New Capacity and Investment Hotspots
- 10.6 Market Entry and Expansion Opportunities
- 10.7 Distribution and Partnership Opportunities
- 10.8 Near-Term and Long-Term Commercial Potential
- 10.9 Opportunity Attractiveness and Execution Risks
Chapter 11 Vietnam Assets Under Management Market Outlook, 2025-2035
- 11.1 Market Size and Analysis
- 11.1.1 Revenue (Market Measurement: 2025: USD 30.60 billion → 2035: USD 118.81 billion)
- 11.1.2 Historical Market Size, 2018-2025
- 11.1.3 Base-Year Market Size, 2025
- 11.2 Market Forecast, 2025-2035
- 11.2.1 Revenue Forecast to 2035
- 11.2.2 CAGR and Year-on-Year Growth
- 11.2.3 Incremental Revenue Opportunity
- 11.3 Forecast Assumptions and Scenario Analysis
- 11.3.1 Base-Case Forecast
- 11.3.2 Optimistic and Conservative Scenarios
- 11.3.3 Technology, Pricing and Policy Sensitivities
- 11.4 Market Attractiveness and Growth Outlook
Chapter 12 Vietnam Assets Under Management Market Segmentation and Outlook
- 12.1 Segmentation Summary and Market Shares, 2025
- 12.2 Largest and Fastest-Growing Segments
- 12.3 By Product Type - Market Size and Forecast, 2025-2035
- 12.3.1 Segment Definition and Scope
- 12.3.2 Historical Market Size, 2018-2025
- 12.3.3 Revenue Forecast, 2025-2035
- 12.3.4 Base-Year Market Share, 2025
- 12.3.5 Segment CAGR and Growth Drivers
- 12.3.6 Subsegment Market Size and Forecast
- 12.3.6.1 Pension & Insurance-Mandate Portfolios
- 12.3.6.2 Discretionary Portfolio Management
- 12.3.6.3 Public Open-Ended Funds
- 12.3.6.4 Exchange-Traded & Index Funds
- 12.3.6.5 Closed-End & Member Funds
- 12.3.7 Subsegment Pricing and Adoption Trends
- 12.3.8 Leading Suppliers and Competition
- 12.3.9 Regional Demand and Opportunities
- 12.4 By Customer Segment - Market Size and Forecast, 2025-2035
- 12.4.1 Segment Definition and Scope
- 12.4.2 Historical Market Size, 2018-2025
- 12.4.3 Revenue Forecast, 2025-2035
- 12.4.4 Base-Year Market Share, 2025
- 12.4.5 Segment CAGR and Growth Drivers
- 12.4.6 Subsegment Market Size and Forecast
- 12.4.6.1 Insurance Companies
- 12.4.6.2 Retail Individuals
- 12.4.6.3 High-Net-Worth Individuals
- 12.4.6.4 Banks & Corporates
- 12.4.6.5 Foreign & Institutional Investors
- 12.4.7 Subsegment Pricing and Adoption Trends
- 12.4.8 Leading Suppliers and Competition
- 12.4.9 Regional Demand and Opportunities
- 12.5 By Risk Category - Market Size and Forecast, 2025-2035
- 12.5.1 Segment Definition and Scope
- 12.5.2 Historical Market Size, 2018-2025
- 12.5.3 Revenue Forecast, 2025-2035
- 12.5.4 Base-Year Market Share, 2025
- 12.5.5 Segment CAGR and Growth Drivers
- 12.5.6 Subsegment Market Size and Forecast
- 12.5.6.1 Capital Preservation
- 12.5.6.2 Fixed Income
- 12.5.6.3 Balanced & Multi-Asset
- 12.5.6.4 Equity Growth
- 12.5.6.5 Alternatives & Private Markets
- 12.5.7 Subsegment Pricing and Adoption Trends
- 12.5.8 Leading Suppliers and Competition
- 12.5.9 Regional Demand and Opportunities
- 12.6 Segment Growth Comparison
- 12.7 Segment Attractiveness and Priority Matrix
Chapter 13 Vietnam Assets Under Management End-Use and Application Market Outlook
- 13.1 End-Use Industry and Customer Demand Structure
- 13.2 Leading Applications and Customer Groups
- 13.3 End-Use Market Size, Share and Forecast
- 13.4 Major End-Use Industry Deep Dives
- 13.4.1 Customer Requirements and Use Cases
- 13.4.2 Demand and Replacement Cycles
- 13.4.3 Technical and Regulatory Considerations
- 13.4.4 Purchasing and Procurement Models
- 13.4.5 Leading Vendors and Distribution Channels
- 13.4.6 Forecast and Commercial Opportunities
- 13.5 Emerging Applications and Cross-Segment Demand
- 13.6 End-Use Industry Investment Priorities
Chapter 14 Vietnam Assets Under Management Geographic Market Outlook, 2025-2035
- 14.1 Domestic Market Distribution and Demand Clusters
- 14.2 State- or Province-Wise Market Size and Forecast, 2025-2035
- 14.3 City and Metropolitan Market Outlook
- 14.4 Industrial, Manufacturing and Commercial Clusters
- 14.5 Geographic Concentration of Key End Users
- 14.6 Local Pricing and Purchasing Differences
- 14.7 Domestic Production Facilities and Capacity Map
- 14.8 Local Infrastructure and Project Pipeline
- 14.9 State-Level Policy and Incentive Differences
- 14.10 Subnational Investment Hotspots and Opportunities
- 14.11 Distribution and Logistics Networks
- 14.12 Domestic Competitive Footprint
Chapter 15 Vietnam Assets Under Management Technology, Innovation and Sustainability Outlook
- 15.1 Technology Landscape and Maturity
- 15.2 Product, Process and Service Innovation
- 15.3 AI, Automation and Digital Tools in the Industry
- 15.4 Technology Adoption and Performance Benchmarking
- 15.5 Innovation Pipeline and R&D Investment
- 15.6 Energy Efficiency and Resource Management
- 15.7 Sustainability, Recycling and Circularity
- 15.8 Technology Roadmap, 2025-2035
- 15.9 Risks of Obsolescence and Technology Substitution
Chapter 16 Vietnam Assets Under Management Market Key Strategic Imperatives
- 16.1 Growth and Market Entry Priorities
- 16.2 High-Return Products and Segments
- 16.3 Pricing, Profitability and Cost Optimization
- 16.4 Technology Investment and Product Differentiation
- 16.5 Supply Chain Localization and Resilience
- 16.6 Distribution and Customer Acquisition
- 16.7 Partnership, Acquisition and Capacity Strategy
- 16.8 Regional Expansion Priorities
- 16.9 Short-, Medium- and Long-Term Actions
Chapter 17 Competition Outlook
- 17.1 Industry Competition Characteristics
- 17.2 Market Structure and Concentration
- 17.3 Market Share and Competitive Positioning, 2025
- 17.4 Company-Wise Revenue and Product Benchmarking
- 17.5 Production and Service Capacity Benchmarking
- 17.6 Technology, Pricing and Differentiation
- 17.7 Regional Footprint and Distribution Strength
- 17.8 Mergers, Acquisitions and Strategic Alliances
- 17.9 New Entrants and Competitive Threats
- 17.10 Porter's Five Forces and Industry Attractiveness
- 17.11 Competitive Outlook, 2025-2035
Chapter 18 Company Profiles
- 18.1 Company Coverage and Selection Criteria
- 18.2 Eastspring Investments Fund Management Company (Vietnam)
- 18.2.1 Business Description
- 18.2.2 Company Ownership and Geographic Presence
- 18.2.3 Product and Service Portfolio
- 18.2.4 Manufacturing and Operating Footprint
- 18.2.5 Financial Performance and Investment
- 18.2.6 Market Share and Competitive Position
- 18.2.7 Technology and Innovation Capabilities
- 18.2.8 Strategic Alliances or Partnerships
- 18.2.9 Recent Developments
- 18.2.10 Growth Strategy and Outlook
- 18.3 Manulife Investment Management (Vietnam)
- 18.4 Dragon Capital Vietnam Fund Management
- 18.5 Bao Viet Fund Management
- 18.6 VinaCapital Fund Management
- 18.7 SSI Asset Management
- 18.8 Techcom Capital
- 18.9 Vietcombank Fund Management
- 18.10 MB Capital
- 18.11 KIM Vietnam Fund Management
- 18.12 Other Relevant Market Participants
Note: Every listed company is profiled on the structure shown under the first company. The company list is preliminary and may change based on research findings, market developments, data availability and client requirements.
Chapter 19 Disclaimer
- 19.1 Research and Forecast Disclaimer
- 19.2 Data Source and Estimation Limitations
Note: The depth of individual sections depends on data availability for this market. Volume, capacity, trade and other unit-based metrics are included where applicable.