Broker networks anchor digital loan matching in Australia
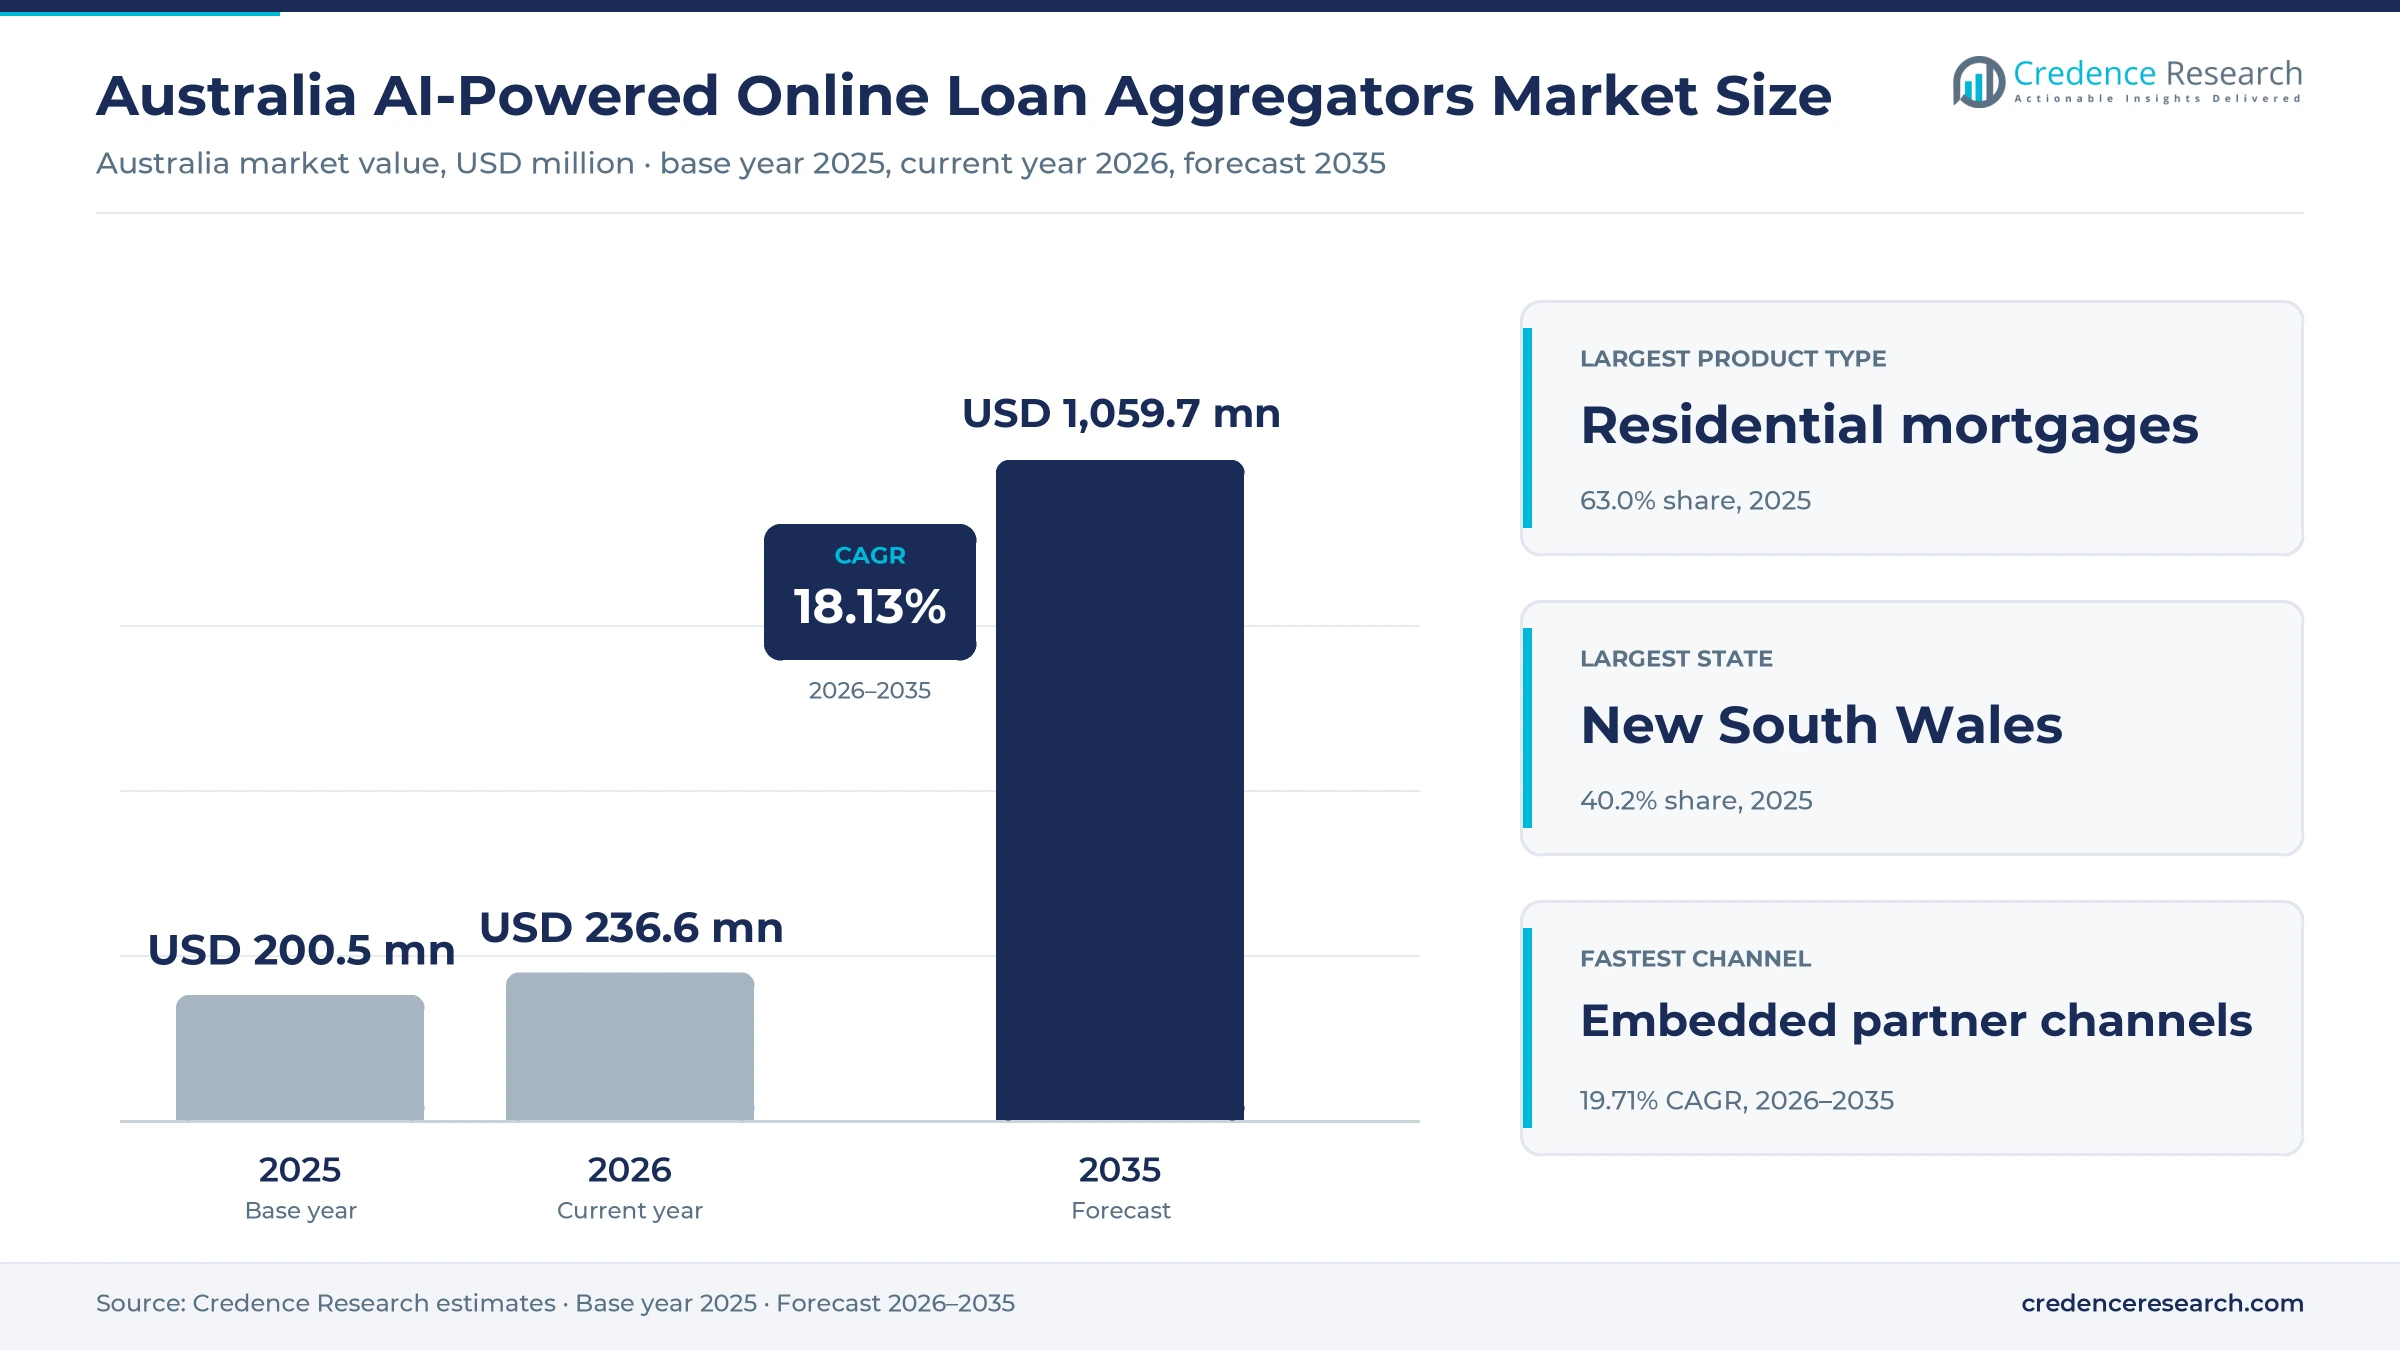
The Australia AI-powered online loan aggregators market was valued at USD 200.5 million in 2025 and is projected to increase from USD 236.6 million in 2026 to USD 1.06 billion by 2035, registering a CAGR of 18.13% during 2026–2035. Demand comes from households and businesses that compare credit through broker networks, comparison portals and partner apps, and from lenders paying commissions for digital origination. New South Wales held the largest regional share at 40.2% in 2025, helped by the highest average new owner-occupier loan in the country. Remaining states and territories form the fastest-growing region at 19.70% a year, reflecting a sizable first home buyer base against a small modeled revenue share today. The main commercial change is the Consumer Data Right rollout to non-bank lenders, which began with product data in July 2026 and moves to consumer data sharing in November 2026. As a result, loan matching can draw on verified account data and live lender pricing rather than forms alone.
What do AI-powered loan aggregators in Australia actually sell?
The market counts the intermediation income earned in Australia by platforms that use machine learning or agentic software to match borrowers with lenders. This income includes upfront and trail commissions, technology licensing and advertising or referral fees, and lenders usually fund it rather than borrowers.
The scope excludes loan principal, lender interest income and earnings from insurance or other unrelated products. The value chain runs from lenders and credit data holders through aggregators, broker groups and comparison portals, and then on to households and business borrowers.
Australia AI-Powered Online Loan Aggregators Market Insights
- The market rises from USD 200.5 million in 2025 to USD 1.06 billion by 2035, an 18.13% CAGR, as broker platforms and consent data widen automated loan matching.
- New South Wales held 40.2% of 2025 value, and Canstar reported the largest average new owner-occupier loan there in the June 2026 quarter.
- Residential mortgages led product type with 63.0% of 2025 value, supported by A$495.55 billion of 2025 broker settlements reported by the MFAA.
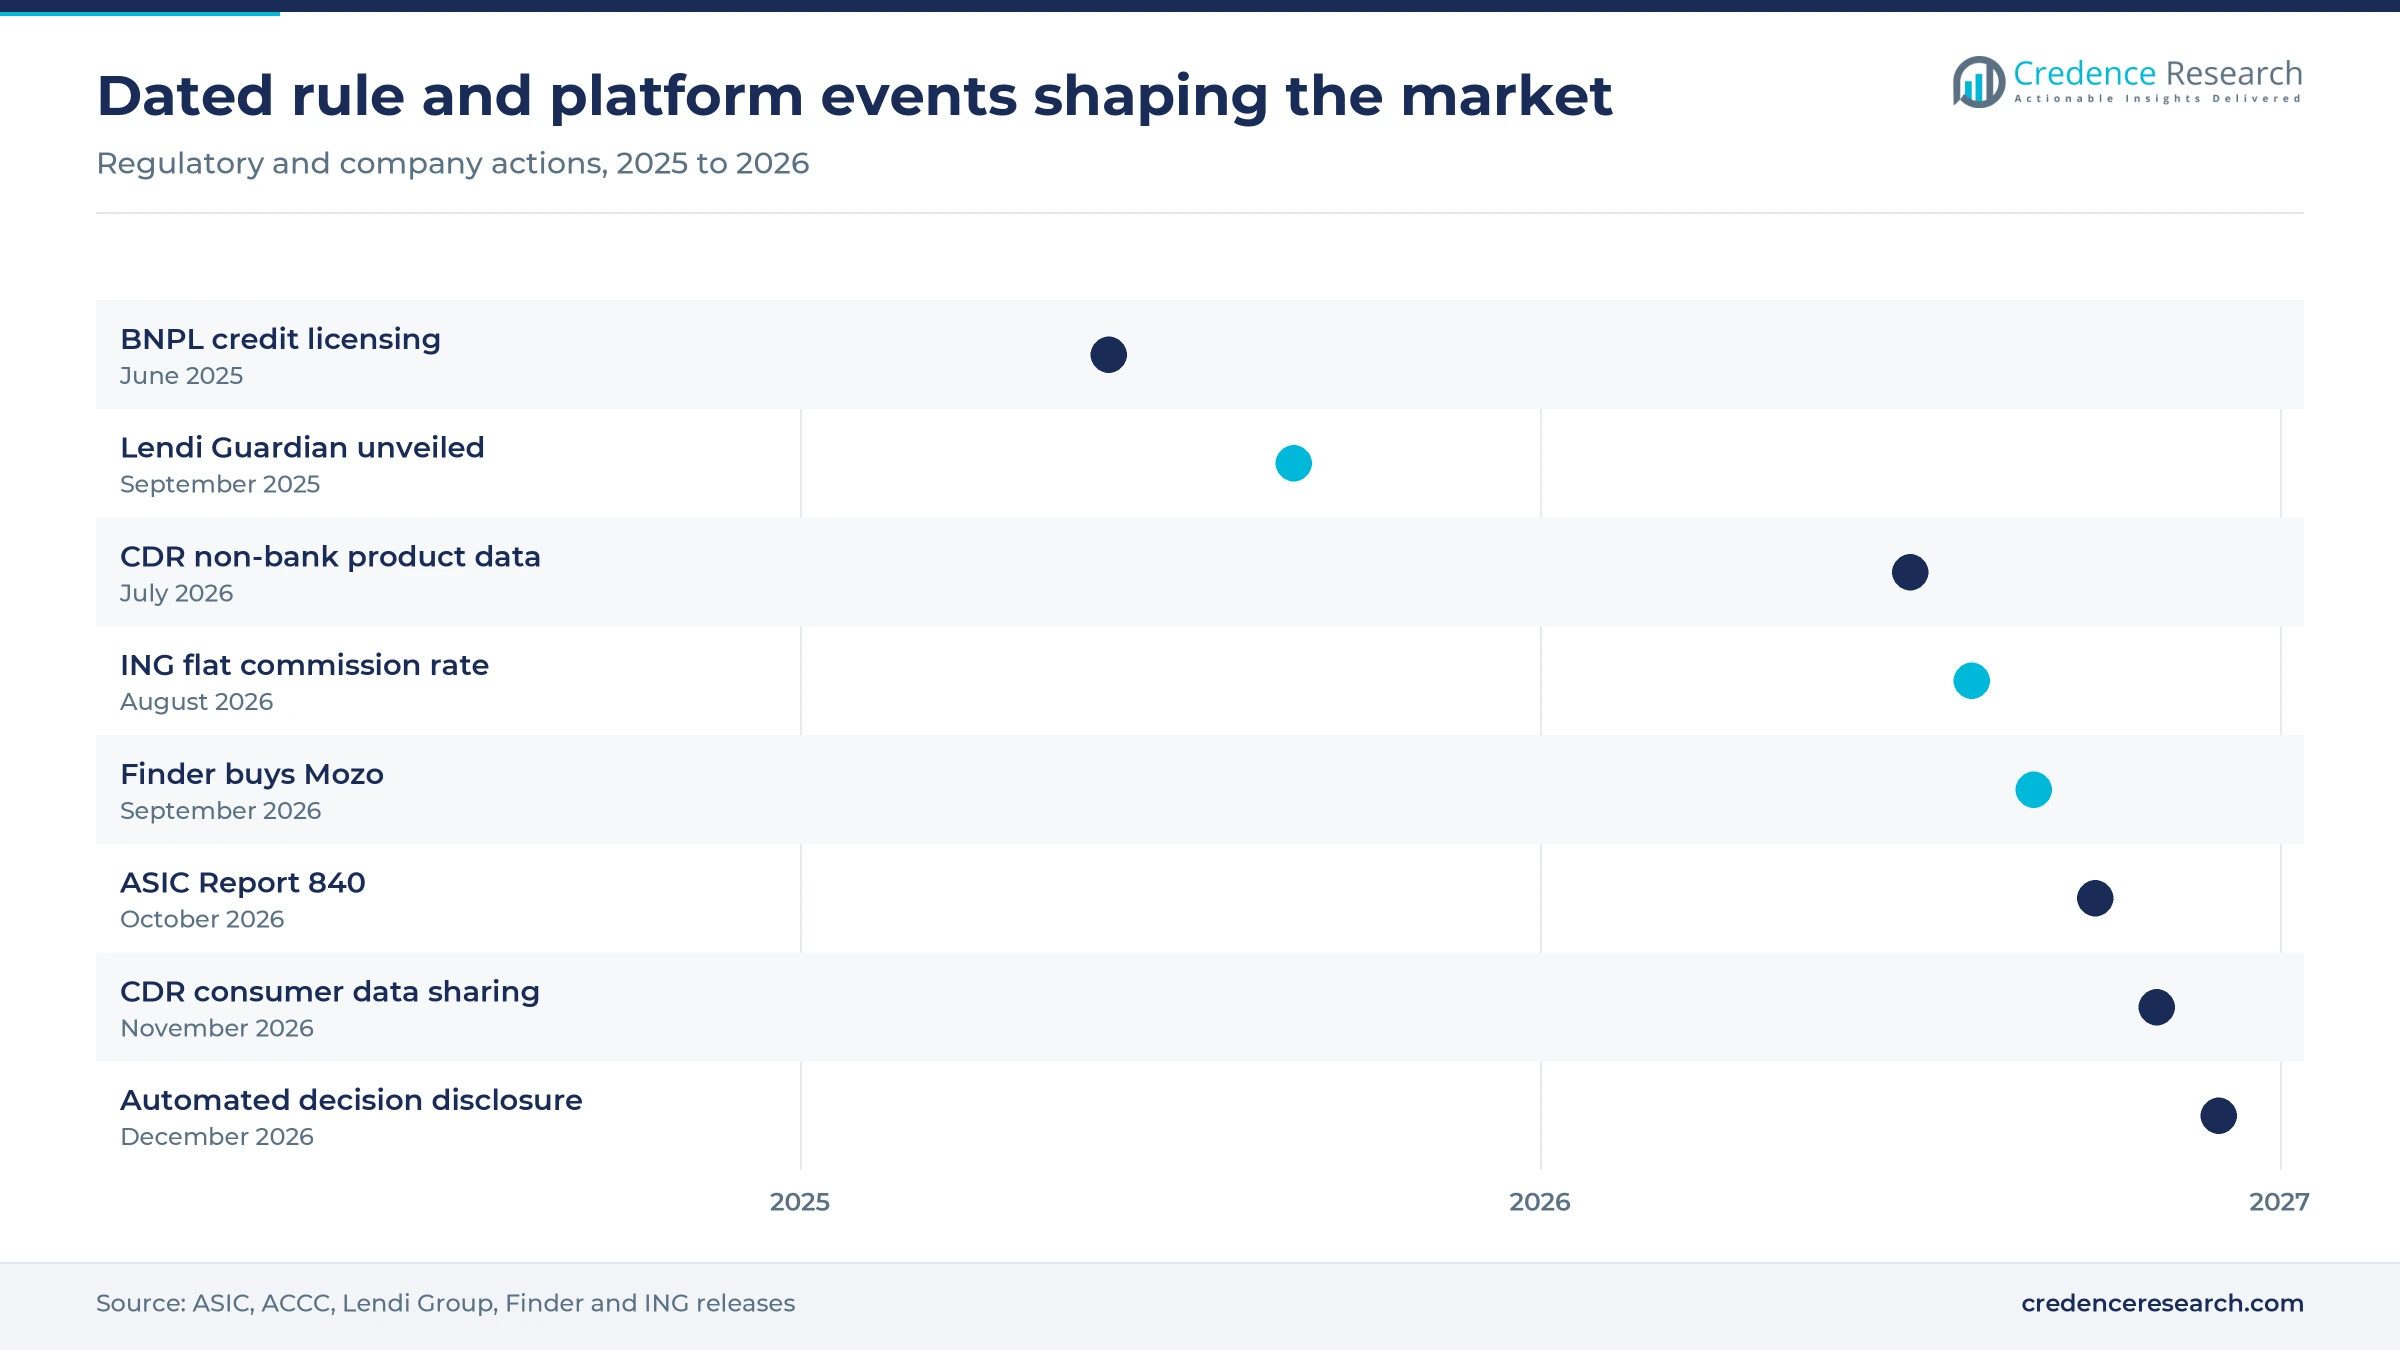
- Consumer Data Right obligations reached non-bank lenders on July 13, 2026, and consumer data sharing starts for select lenders on Nov. 9, 2026, widening platform inputs.
- Finder bought comparison site Mozo in September 2026, while Lendi Group, Mortgage Choice and Tiimely extended agentic or white-label tools across their channels.
Mortgages and trail income shape platform revenue
Why do residential mortgages dominate platform income?
Based on product type, the market is categorized into residential mortgages, personal loans, vehicle finance and business loans. Residential mortgages led with 63.0% of 2025 value because broker-channel residential settlements alone reached A$495.55 billion across 838,815 loans in 2025, according to the MFAA report published in September 2026. Business loans form the fastest-growing type at 19.36% a year, as the same MFAA report shows commercial, business and asset finance settlements rising to A$52.3 billion from A$41.1 billion. This shift gives platforms a second commission pool beyond housing.
How do borrower profiles change the matching task?
Based on customer segment, the market is categorized into salaried households, self-employed households and business borrowers. Salaried households led with 66.0% of 2025 value because their payslip data suits automated serviceability checks, and Lendi Group said in September 2025 that its Guardian app monitors finances through open banking links. Self-employed households grow fastest at 19.10% a year, as Australian Broker reported a record 104,784 new business registrations in August 2025. These borrowers carry irregular income records, so they rely more on intermediaries that can interpret bank statements and match specialist lender policies.
Where do borrowers enter the platform funnel?
Based on distribution channel, the market is categorized into direct consumer platforms, broker-assisted platforms and embedded partner channels. Broker-assisted platforms led with 58.0% of 2025 value because the MFAA put brokers at 81.6% of new residential loans in the June 2026 quarter. Embedded partner channels grow fastest at 19.71% a year, as lenders and property portals place loan journeys inside their own apps. Broker Daily reported in August 2026 that Mortgage Choice settlements from realestate.com.au leads rose 30%, while Tiimely built the Up Home Zone for a digital bank serving more than 750,000 customers.
Which income streams carry platform economics?
Based on revenue model, the market is categorized into upfront commissions, trail commissions, technology licensing and advertising revenue. Trail commissions led with 46.0% of 2025 value because the MFAA reported median gross trail revenue of A$77,894 per broker in 2025, up 18.7% on a growing A$1.17 trillion loan book. Technology licensing grows fastest at 20.12% a year, as banks rent rather than build digital mortgage stacks. Tiimely says its white-label platform let Bendigo Bank launch Bendigo Express in about six months, which shows how licensing can shorten a lender's route to market.
| Segment Group | Leading Sub-segment | Share, 2025 | Fastest-growing Sub-segment | CAGR, 2026–2035 |
|---|---|---|---|---|
| By Product Type | Residential mortgages | 63.0% | Business loans | 19.36% |
| By Customer Segment | Salaried households | 66.0% | Self-employed households | 19.10% |
| By Distribution Channel | Broker-assisted platforms | 58.0% | Embedded partner channels | 19.71% |
| By Revenue Model | Trail commissions | 46.0% | Technology licensing | 20.12% |
Request a Free Sample
Fill in your details and we'll send you a free sample report.
- Sample data tables & charts
- Research methodology
Broker reach, consented data and automation lift demand
Broker-led digital distribution sets the volume base
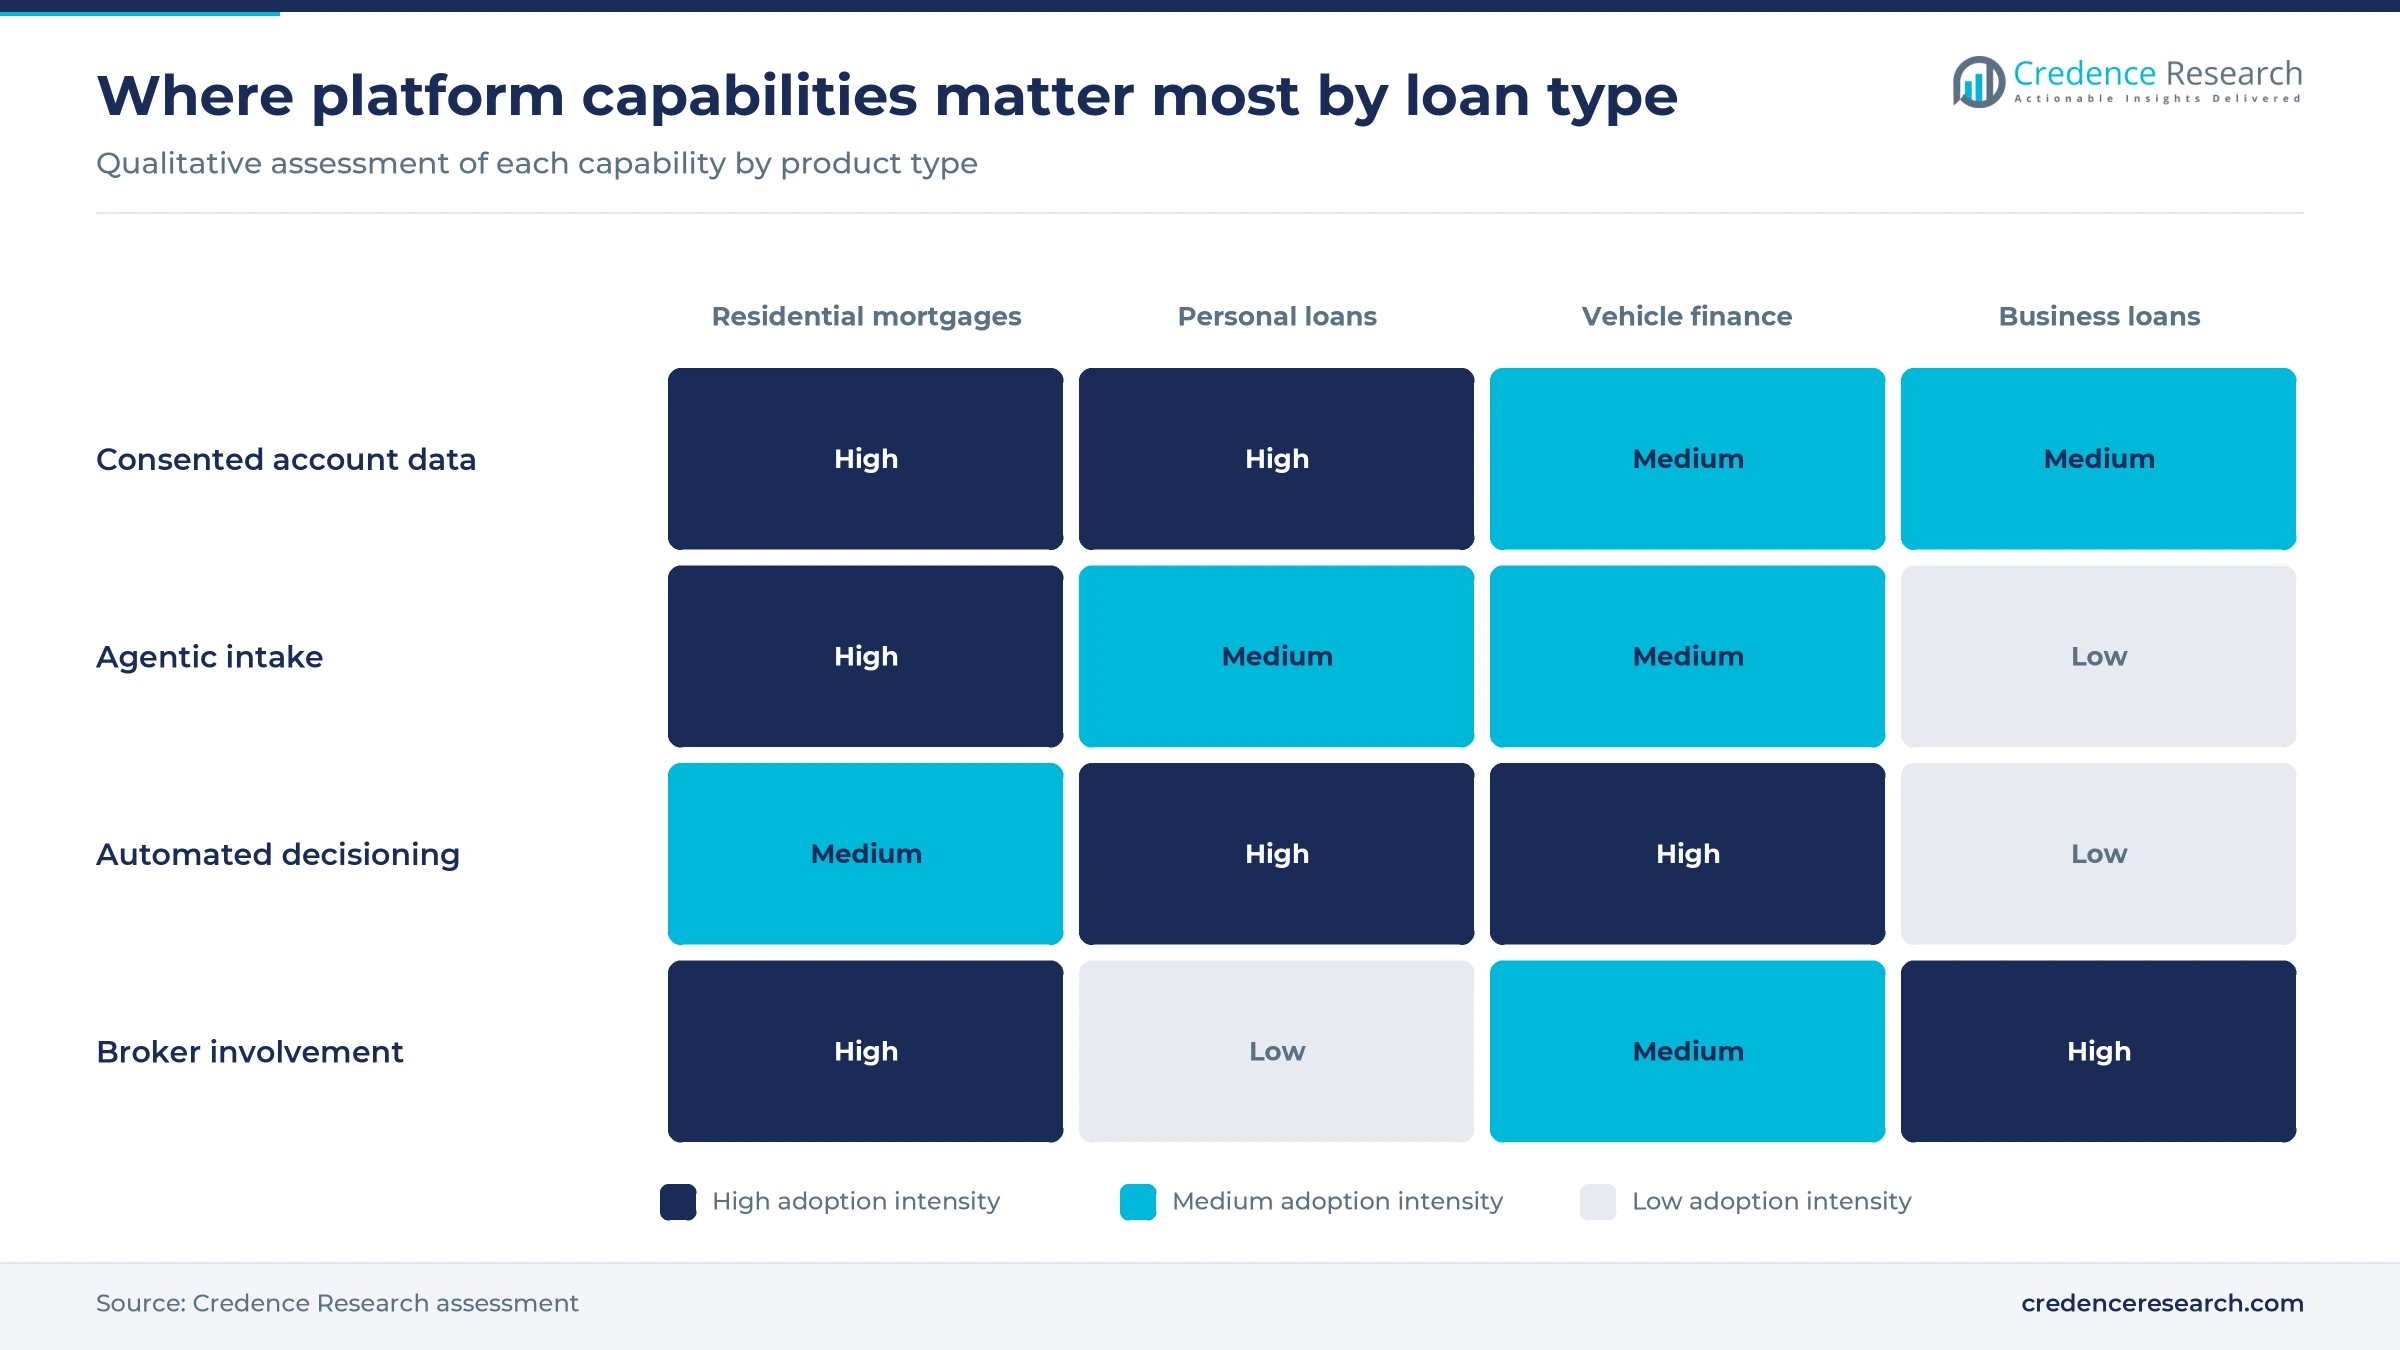
Broker-led distribution gives platforms their largest pool of borrowers, because most Australian home loans now pass through an intermediary. ASIC said in October 2026 that more than 80% of home loans are arranged through mortgage brokers. The same channel keeps adding capacity, and the MFAA counted 24,116 brokers in 2025, up 9.1% in a year. AFG alone reported more than 4,300 brokers and A$75 billion of FY26 residential settlements in August 2026. Because each of these brokers needs lender policy search and file tools, aggregator software spreads quickly across the network. As a result, broker-assisted platforms held a 58.0% share of 2025 value across the country.
Consented financial data widens what platforms can assess
Consented data lets a platform compare a borrower's actual accounts with live lender terms, which improves match quality beyond a form. The Adviser reported in July 2026 that non-bank lenders began publishing product data on July 13, with select lenders sharing consumer data from Nov. 9. At least 35 additional data holders are expected to join, and more than 1.3 million Australians already use enabled services, up about 135% over a year. The 2026–27 federal budget also set aside A$62 million over two years, part of which will explore bringing tax office data into the scheme. This matters most outside the major banks, since non-banks held 7.2% of the broker channel in 2025, according to the MFAA.
Automated borrower assessment cuts the cost of a file
Automation lowers the labor in each application, so platforms can profitably serve smaller loans and more complex files. Twilio reported in September 2026 that about 20% of Lendi Group customers now complete fact-finding and receive product options, up from under 3% in the earlier human-led funnel. Broker Daily reported in August 2026 that an AI policy search tool at Mortgage Choice can save brokers up to four hours on complex lender queries. Over half of its brokers now use AI agents built on REA Group data. Plenti said in its May 2026 annual report that AI and automated document checks raised the share of applications approved without manual review. In turn, assessment speed has become a commercial reason for lenders to favor digital channels.
Refinance activity keeps borrowers comparing lenders
Rate pressure gives existing borrowers a reason to compare, and comparison is the moment platforms earn their income. The Reserve Bank of Australia raised the cash rate three times in 2026 before holding at 4.35% on June 16, as Broker Daily reported. Canstar's reading of Australian Bureau of Statistics data showed A$67.1 billion of refinancing across 103,046 loans in the June 2026 quarter. This activity came while new lending fell to A$97.6 billion, a 5% quarterly drop. Because refinancing kept moving during that decline, tools such as Lendi Guardian, which scans thousands of home loans daily according to iTnews, retain a use case when purchase demand softens. Debt levels add to the motive, since the IMF put household debt at 176% of disposable income for 2025.
Agentic tools and embedded channels reshape origination
Shift from assistive bots to agentic loan journeys
The clearest shift is from software that helps a broker toward agents that run stages of the loan journey themselves. iTnews reported in September 2025 that Lendi Group set a June 2026 goal of becoming AI-native, with 30,000-plus hours logged on its refinance redesign. By September 2026, Twilio described two Lendi agents, Guardian for intake and Linda for outbound follow-up, working alongside about 1,350 brokers and 215 stores. Those results included a 2.5-times rise in customers moving from fact-find to lodgement over six months. Mantel Group separately reported a 40% uplift in engagement with the agent in November 2025. Competing groups must now decide whether to build such agents or license them from specialist providers.
Rise of embedded journeys inside partner apps
Loan journeys are moving into apps and property portals where the borrower already spends time, which changes who owns the first contact. Tiimely describes an in-app Up Home Zone connected through three API endpoints that carry applications from pre-approval to full approval. Plenti reported that its "NAB powered by Plenti" car loan portfolio reached A$121 million by March 31, 2026, up from A$16.7 million a year earlier. Mortgage Choice settlements from REA Group's realestate.com.au leads also rose 30% in FY26, according to Broker Daily. These partner models overlap with wider embedded finance activity, and embedded partner channels are the fastest-growing route at 19.71% a year.
Opening in non-mortgage credit for existing broker networks
Mortgage brokers already hold the customer relationship, which creates an opening to cross-sell personal, vehicle and business credit through the same platform. Plenti reported more than 11,400 accredited broker partners and 17 aggregator partners for personal lending in May 2026, alongside A$636 million of personal and A$994 million of automotive originations in FY26. Driva now promises comparison across more than 50 lenders using a soft credit check that leaves no trace on a credit file. AFG also reported A$4.3 billion of asset and commercial settlements in FY26, up 19%. For platforms, the opportunity is to route these smaller tickets automatically, because manual broker time rarely pays for them. Competition from buy now, pay later providers remains a limit at the small end.
Opening for platforms serving lenders without digital stacks
Smaller lenders that cannot fund a full digital mortgage stack represent an opening for licensing income, and banks have already tested the model. Tiimely says Bendigo Bank launched Bendigo Express on its white-label platform in about six months, covering collection, decisioning and managed settlement. Consumer Data Right rules add to this need, since at least 35 additional data holders are expected to join the scheme during the non-bank rollout and many will want compliant tools. Non-bank lenders also held a A$72.2 billion loan book in FY25, as Australian Broker reported in July 2026. Platforms that pair origination software with distribution can sell to these lenders twice, first as a technology vendor and then as a source of applications.
Conduct scrutiny and clawbacks test platform economics
Best interests evidence raises compliance costs
ASIC found in October 2026 that seven of eight large aggregator groups reported brokers not recommending the cheapest loan in over 20% of cases. Some files lacked clear evidence for choosing higher-cost loans, so licensees now face closer monitoring duties. This compliance pressure falls hardest on smaller broker groups with thin data teams. Platforms can respond by logging every product comparison automatically, which turns the record-keeping burden into a saleable compliance feature for their broker customers.
Fraud cases expose introducer and broker channels
Commonwealth Bank self-reported about A$1 billion of potential mortgage fraud in February 2026, and The Adviser said on Sept. 30, 2026, that ASIC will review introducer programs and lender oversight of brokers. AUSTRAC's Operation Claw referred about 200 brokers, accountants, lawyers and other entities to authorities. The resulting risk is tighter lender accreditation, which would slow onboarding for digital channels. Platforms with document verification and anomaly checks are better placed, although they must prove those controls work.
Clawback pressure and softer lodgements limit commission income
Commission income is exposed to early loan exits, and the MFAA reported median gross clawbacks of A$11,442 per broker in 2025, up 16.5%. Lender terms also keep moving, because ING set a flat 71.5 basis point upfront rate from Aug. 1, 2026. Canstar reported in August 2026 that Commonwealth Bank applications had fallen 15% since May 12. Volume-dependent platforms therefore face thinner income in weak quarters, which strengthens the case for adding subscription or licensing revenue.
Automated decision rules add disclosure duties
From Dec. 10, 2026, new Australian Privacy Principles require entities to disclose automated decisions that significantly affect individuals, and Hamilton Locke notes that the regulator lists programs approving or rejecting loans as in scope. A serviceability score that a loan officer relies on heavily is also likely to be covered. This barrier means platforms and their lender partners must map where models influence outcomes, and vendors of regulatory technology may gain work from this requirement.
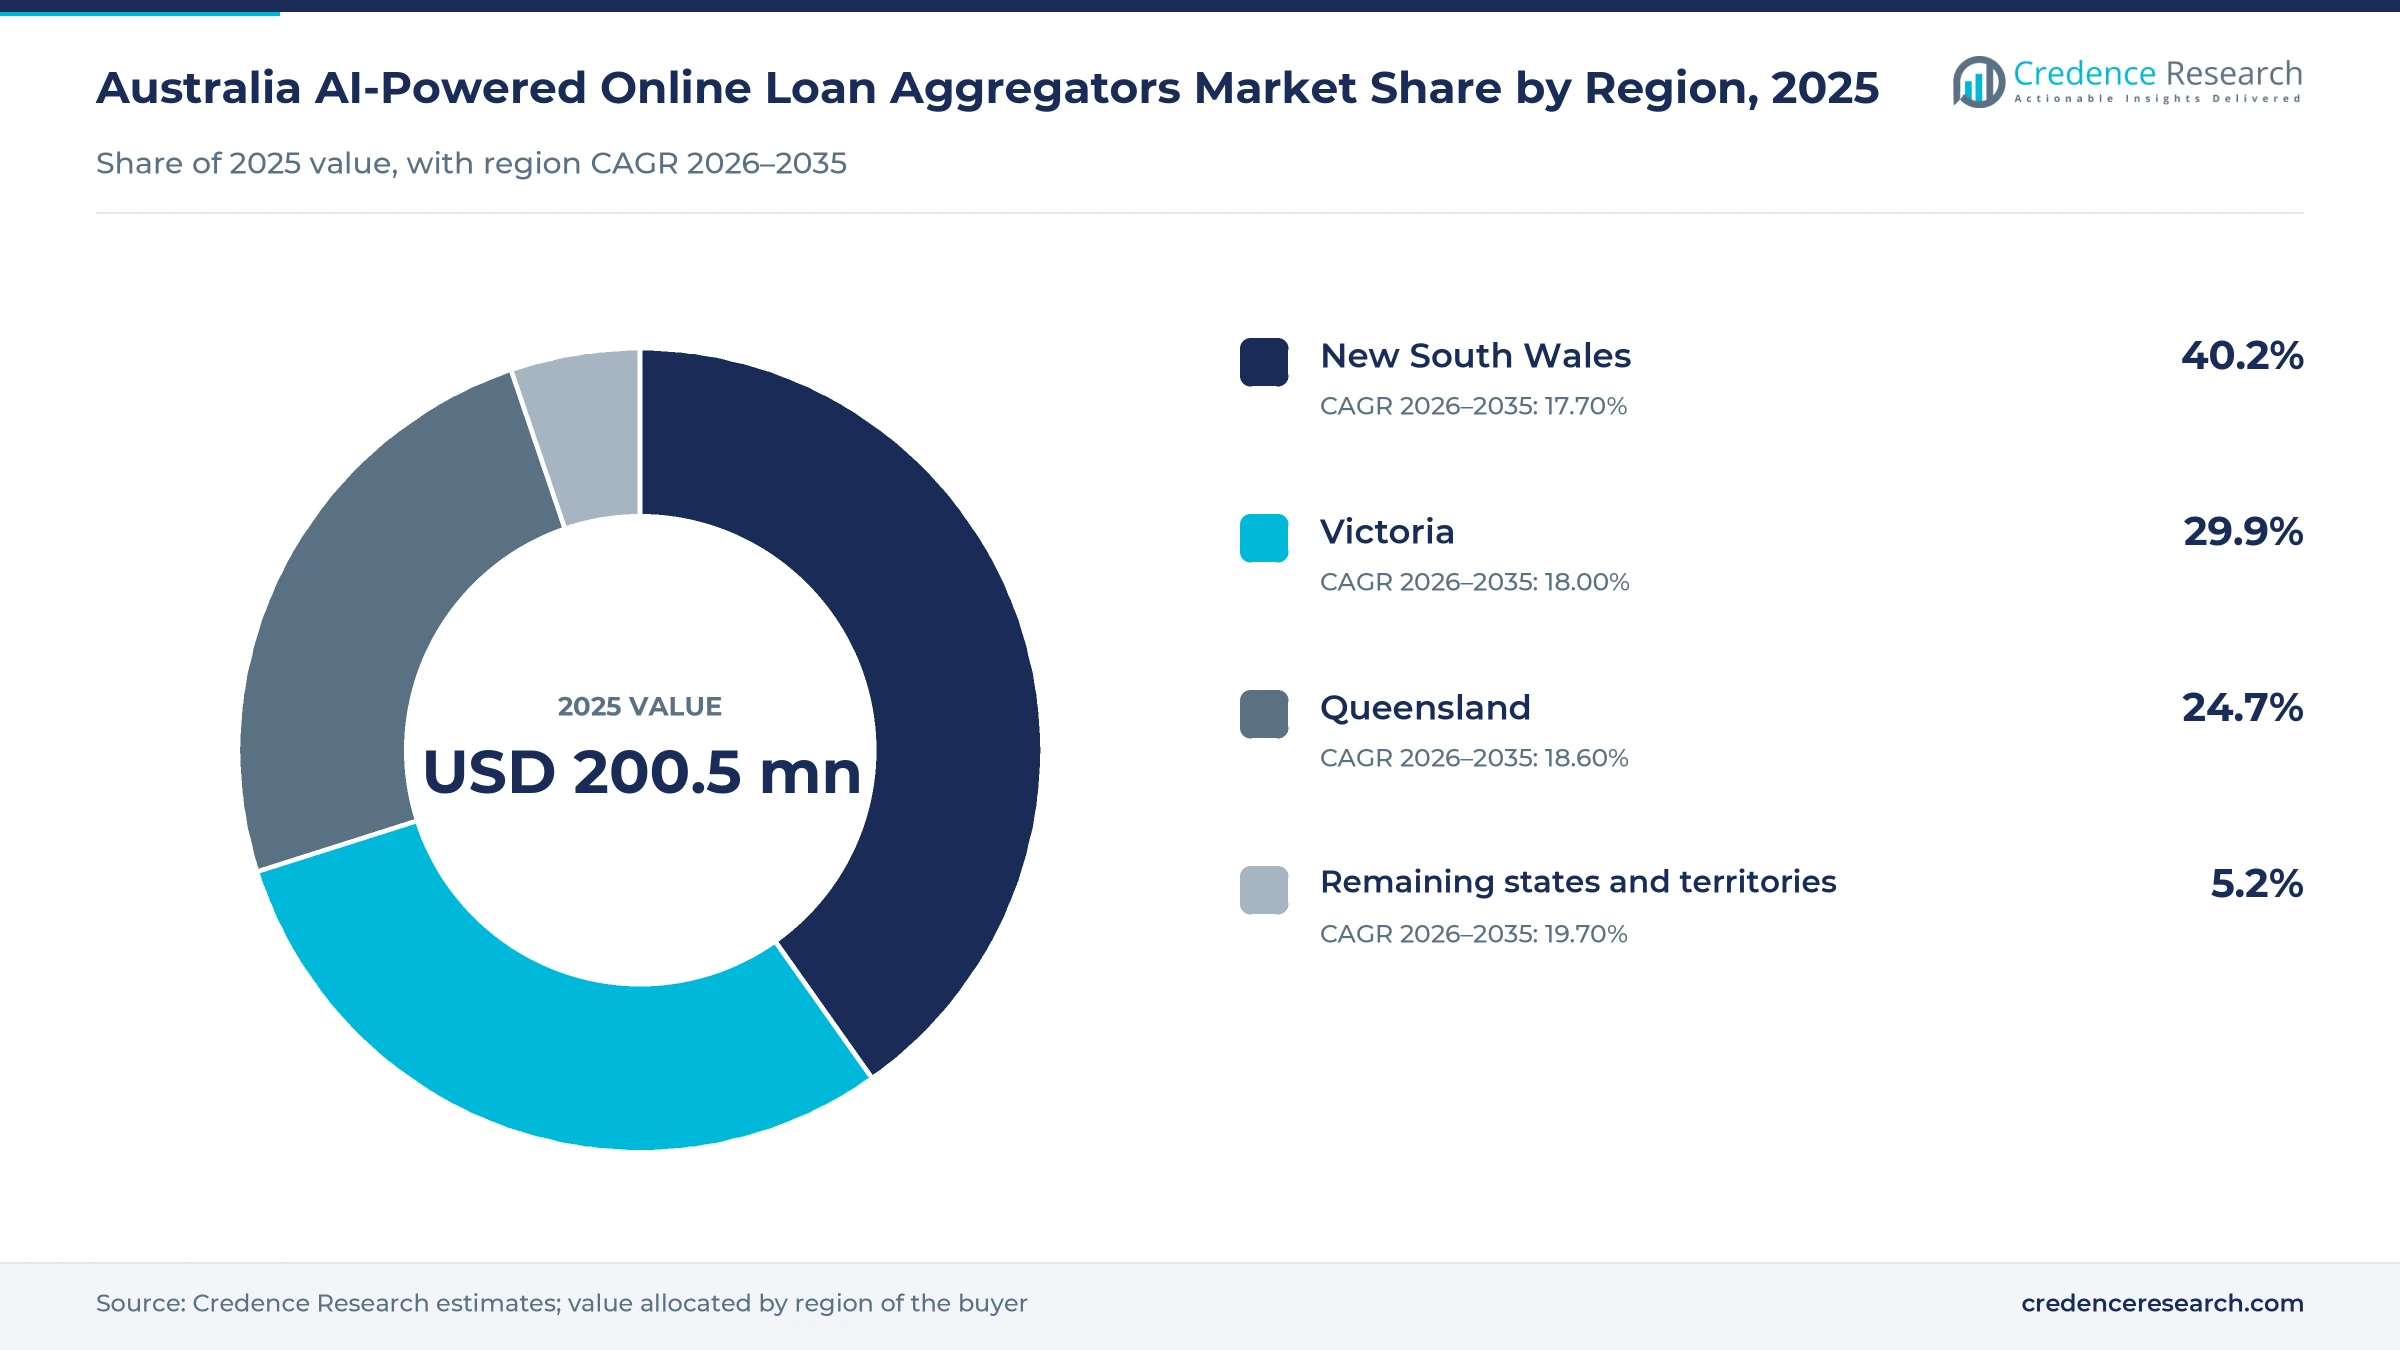
New South Wales leads while smaller states grow fastest
| Region | Value, 2025 (USD million) | Share, 2025 | CAGR, 2026–2035 |
|---|---|---|---|
| New South Wales | 80.6 | 40.2% | 17.70% |
| Victoria | 59.9 | 29.9% | 18.00% |
| Queensland | 49.5 | 24.7% | 18.60% |
| Remaining states and territories | 10.4 | 5.2% | 19.70% |
New South Wales leads on loan size and business density
New South Wales held 40.2% of 2025 value and grows at 17.70% a year. Canstar's reading of official lending data put the average new owner-occupier loan there at A$842,000 in the June 2026 quarter, the highest of any state, which lifts value-based commissions per settlement. Australian Bureau of Statistics counts cited by Money.com.au also show 916,603 businesses in the state at June 30, 2025, giving platforms a deep commercial borrower pool close to many broker head offices.
Victoria leads first home buyer volumes
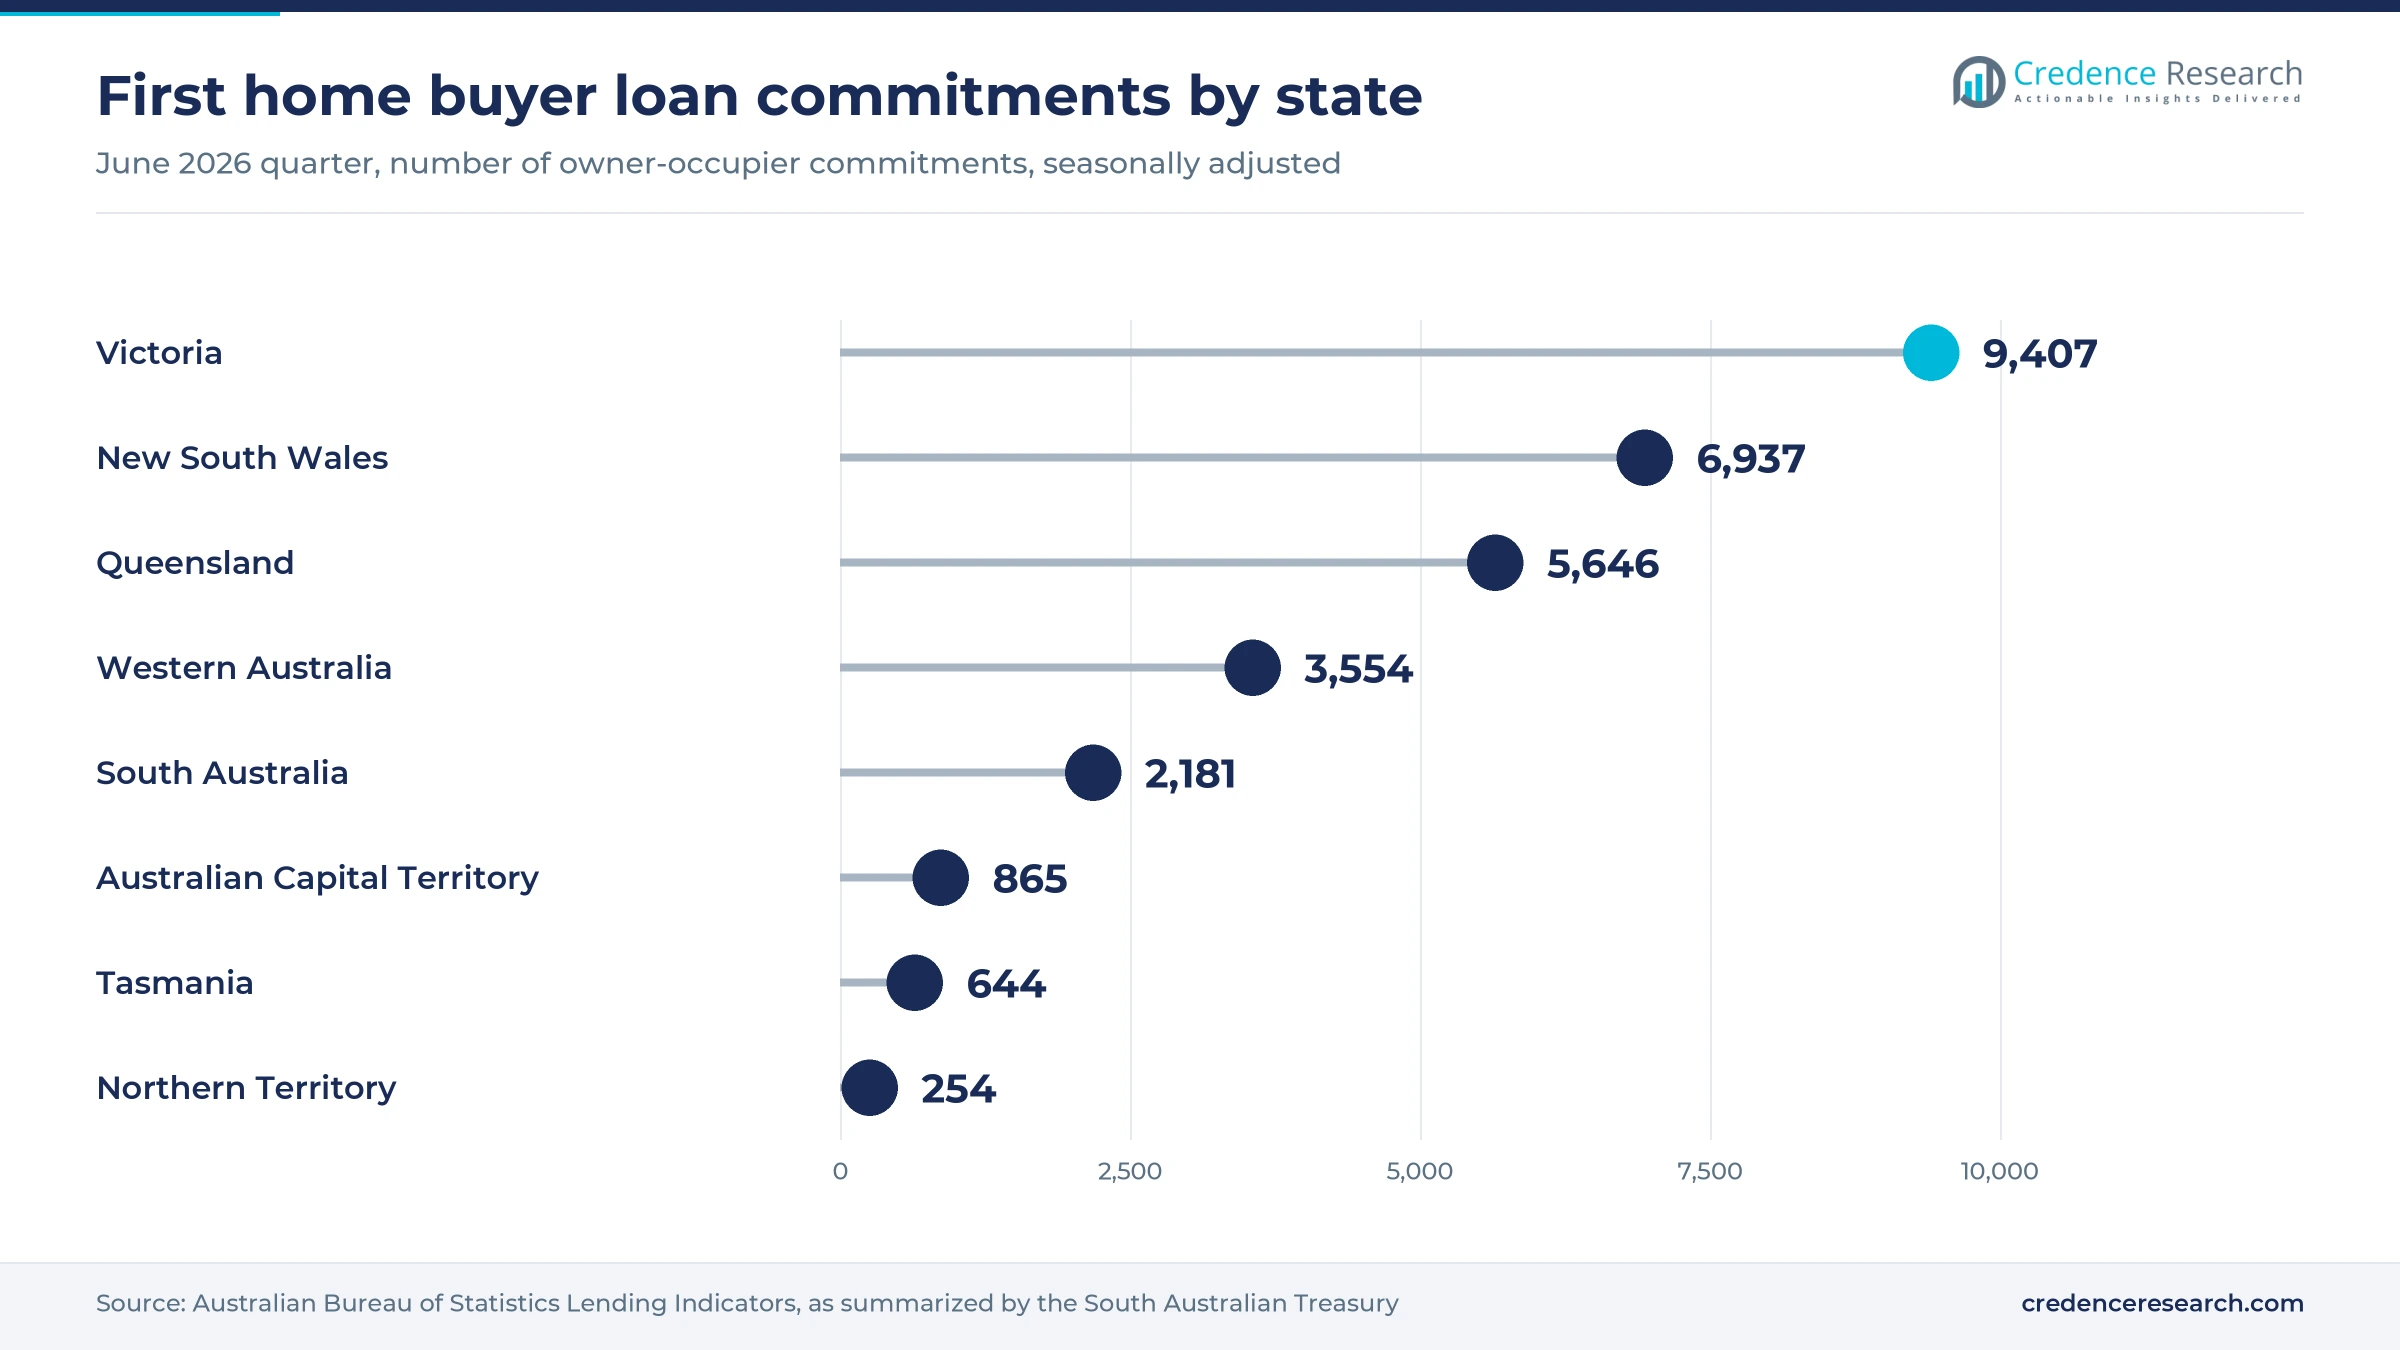
Victoria held 29.9% of 2025 value and grows at 18.00% a year. The state recorded 9,407 first home buyer commitments in the June 2026 quarter, the most in the country, according to the South Australian Treasury summary of official data. Average new owner-occupier loans were lower at A$664,000, as Canstar reported, so platforms in this region earn more through application volume than ticket size. First-time borrowers also tend to need more guidance, which favors assisted digital journeys.
Queensland combines record loan sizes with business entry
Queensland held 24.7% of 2025 value and grows at 18.60% a year. Canstar reported a record A$751,000 average new owner-occupier loan there in the June 2026 quarter, which raises the commission value of each settlement. Official business data cited by Money.com.au shows 82,254 new Queensland businesses in FY 2024/25, along with the largest net inflow of any state. These entrants add the self-employed borrowers whose irregular income records suit broker-assisted platforms.
Remaining states and territories offer the widest gap
Remaining states and territories held 5.2% of 2025 value and are the fastest-growing group at 19.70% a year. Western Australia, South Australia, Tasmania, the Northern Territory and the Australian Capital Territory recorded 7,498 of 29,319 first home buyer commitments in the June 2026 quarter. South Australia alone accounted for 2,181 of those commitments, according to Canstar. The distance between that borrower base and the modeled revenue share marks the clearest distribution opening in the country.
Data rules and agentic launches defined 2025 and 2026
| Development | Status and market relevance |
|---|---|
| In September 2025, Lendi Group unveiled Lendi Guardian, an agentic app with a rate radar and one-tap refinance journeys. | Launched first for eligible home owners and investors, it set the pattern for agentic refinance tools. |
| In July 2026, non-bank lenders began publishing standardized product data under the Consumer Data Right, with consumer data sharing set for Nov. 9, 2026. | Live, and it gives comparison tools consistent non-bank pricing data. |
| In September 2026, Finder acquired comparison platform Mozo, founded in 2008, to deepen its coverage of Australian household categories. | Completed as announced, it consolidates the comparison portal tier. |
| In September 2026, Twilio and Lendi Group detailed Guardian and Linda agents running across voice, SMS and email. | Live, with a real-time voice pilot still under test. |
| In October 2026, ASIC released Report 840 on broker best interests duty practices at eight large aggregator groups. | Published, and it raises the evidence expected of licensees and their platforms. |
Agents and consented data now drive borrower matching
- Agentic intake asks qualifying questions by text or voice and matches customers to live products, as Lendi Group's Guardian does.
- Consumer Data Right feeds bring product and, with consent, account data into comparison and application tools under ACCC and privacy regulator supervision.
- Policy search copilots answer complex lender policy questions for brokers, with Mortgage Choice citing savings of up to four hours per query.
- Decision engines combine document verification with credit data so that more applications clear without manual review, as Plenti reports.
Need a Custom Version of This Report?
Tailor the scope, geography, or segments to your exact requirements.
- Custom geography or segment scope
- Direct access to our analyst team
Aggregators and comparison brands compete on data depth
Competition among online loan aggregators runs across three tiers that increasingly overlap. Aggregators and broker groups such as Australian Finance Group and Mortgage Choice compete on lender panels, broker tools and access to data, while Lendi Group combines Aussie stores with its own agentic platform. Comparison operators such as Finder, Canstar and RateCity compete for search-led borrowers, and Canstar says it compares around 94% of the Australian home loan market while earning referral and sponsorship fees. Specialist providers such as Tiimely sell white-label infrastructure to lenders rather than competing for every borrower directly. Nest Egg reported in February 2026 that new aggregator Viking is entering with a software-first approach, and its arrival adds pressure on the incumbents. Pricing power remains limited because lenders set most commission rates, so operators differentiate through conversion and compliance evidence. Scale buyers are also consolidating brands, as the Finder purchase of Mozo shows, and adjacent digital lending platforms are competing for the same applicants.
Companies profiled and their roles in this market
| Company | Type | Role in the market |
|---|---|---|
| Lendi Group | Digital broker group | Owns Aussie and Lendi, running Guardian and Linda agents with about 1,350 brokers and 215 stores |
| Mortgage Choice | Broker franchise, REA Group | Reached A$27 billion of FY26 settlements, with AI agents and realestate.com.au leads |
| Australian Finance Group | Aggregator | Supports more than 4,300 brokers across more than 80 lenders |
| Finder | Comparison portal | Bought Mozo in September 2026 to extend household category coverage |
| Canstar | Comparison portal | Compares around 94% of the home loan market and earns referral and sponsorship fees |
| RateCity | Comparison portal | Offers free search and comparison across home, personal and car loans |
| Tiimely | Specialist platform provider | Licenses white-label mortgage technology to Bendigo Bank and Up |
Consent data and conduct evidence will separate winners
Credence Research's view is that the next phase for AI-powered online loan aggregators depends on evidence rather than interface design. Broker reach already exceeds 80% of home lending, so share gains from channel shift are nearly exhausted, and growth must come from conversion, non-mortgage credit and licensing. Consumer data access helps all operators equally once it spreads, which reduces its value as a lasting advantage. The stronger position belongs to platforms that can show ASIC why a recommendation was made, and that can prove their automated checks catch fraud. Those records are expensive to build, so they should favor larger groups.
How Credence Research estimated this market
The report uses 2025 as the base year and 2026 to 2035 as the forecast period, with market values taken from the Credence Research model and checked against broker revenue data. Segment and regional splits in this report are Credence Research estimates built from public data. Sources include releases from ASIC and the IMF, official lending and business statistics as reported by named publishers, MFAA industry data, listed-company reports and company releases. No primary interviews or surveys were conducted for this edition.
Non-mortgage lending widens the platform base to 2035
The market is projected to rise from USD 236.6 million in 2026 to USD 1.06 billion by 2035, an 18.13% CAGR over 2026–2035. Early growth should come from consent-based data as more non-bank lenders join the scheme in stages through May 2027. Later growth for online loan aggregators depends on business lending, vehicle finance and licensing, because mortgage broker share has limited room left. Regulation will shape the pace, particularly automated decision disclosure and ASIC's planned review of lender oversight. Operators outside the eastern states also have room to expand, provided that their tools satisfy lenders on verification and conduct.
Frequently Asked Questions
How big is the Australia AI-powered online loan aggregators market?
What share do brokers hold in Australian home lending?
Which product type leads the market?
How does the Consumer Data Right affect these platforms?
Which state leads the market?
How do these platforms earn revenue?
What are the main risks for operators?
Who are the main companies in this market?
Table of Content
Chapter 1 Market Segmentation
- 1.1 Segmentation Framework
- 1.1.1 Product and Service Classification
- 1.1.2 Application and End-Use Classification
- 1.1.3 Technology and Solution Classification
- 1.1.4 Customer and Distribution Channel Classification
- 1.1.5 Geographic Segmentation
- 1.1.6 Market Segment Definitions and Boundaries
- 1.2 By Product Type
- 1.2.1 Residential mortgages
- 1.2.2 Personal loans
- 1.2.3 Vehicle finance
- 1.2.4 Business loans
- 1.3 By Customer Segment
- 1.3.1 Salaried households
- 1.3.2 Self-employed households
- 1.3.3 Business borrowers
- 1.4 By Revenue Model
- 1.4.1 Trail commissions
- 1.4.2 Upfront commissions
- 1.4.3 Technology licensing
- 1.4.4 Advertising revenue
Chapter 2 Introduction
- 2.1 Report Objectives and Scope
- 2.2 Product Definition and Industry Terminology
- 2.3 Market Inclusions and Exclusions
- 2.4 Research Process
- 2.4.1 Primary Research and Expert Interviews
- 2.4.2 Secondary Research and Source Review
- 2.4.3 Top-Down and Bottom-Up Estimation
- 2.4.4 Data Triangulation and Verification
- 2.5 Market Size Measurement Basis
- 2.5.1 2025: USD 200.5 million → 2035: USD 1.06 billion
- 2.6 Historical and Forecast Reference Periods
- 2.6.1 Historical Period: 2018-2025
- 2.6.2 Base Year: 2025
- 2.6.3 Forecast Period: 2025-2035
- 2.7 Research Assumptions and Limitations
Chapter 3 Executive Summary
- 3.1 Market Snapshot and Key Findings
- 3.2 Base-Year Market Size, 2025
- 3.3 Forecast Market Size, 2035
- 3.4 Revenue and Volume Growth Outlook
- 3.5 Key Demand and Supply Indicators
- 3.6 Leading Market Segments
- 3.7 Fastest-Growing Market Opportunities
- 3.8 Regional Performance Highlights
- 3.9 Technology and Industry Transformation
- 3.10 Competitive Landscape Summary
- 3.11 Analyst View and Strategic Implications
Chapter 4 Australia AI-Powered Online Loan Aggregators Market Trends and Developments
- 4.1 Historical Industry Development, 2018-2025
- 4.2 Recent Market Trends and Developments
- 4.3 Demand and Customer Behavior Trends
- 4.4 Technology and Product Innovation
- 4.5 Artificial Intelligence, Automation and Digitalization
- 4.6 Local Manufacturing and Supply Chain Realignment
- 4.7 Industry Partnerships, Mergers and Acquisitions
- 4.8 Sustainability and Circular Economy Developments
- 4.9 Government and Private Sector Investment Trends
- 4.10 Emerging Business Models and Commercialization
- 4.11 Industry Developments and Announcements
Chapter 5 Australia AI-Powered Online Loan Aggregators Market Supply and Demand Analysis
- 5.1 Demand Trend and Consumption Analysis, 2018-2025
- 5.2 Demand Forecast, 2025-2035
- 5.3 Supply Chain Structure and Procurement Trends
- 5.4 Supply-Demand Gap and Bottlenecks
- 5.5 Import Dependence and Sourcing Structure
- 5.6 Regional Supply and Demand Concentration
Chapter 6 Australia AI-Powered Online Loan Aggregators Market Pricing Analysis
- 6.1 Pricing Structure and Measurement
- 6.2 Historical Pricing Trends, 2018-2025
- 6.3 Pricing Outlook, 2025-2035
- 6.4 Pricing by Product and Market Segment
- 6.5 Geographic Pricing Differences
- 6.6 Key Input, Energy, Labor and Logistics Costs
- 6.7 Contract Pricing and Purchasing Models
- 6.8 Pricing Sensitivity and Competitive Positioning
- 6.9 Price, Margin and Profitability Implications
Chapter 7 Australia AI-Powered Online Loan Aggregators Market Dynamics
- 7.1 Market Growth Drivers
- 7.1.1 Demand-Side Drivers
- 7.1.2 Technology and Innovation Drivers
- 7.1.3 Infrastructure and Investment Drivers
- 7.1.4 Regulatory and Policy Drivers
- 7.2 Market Restraints
- 7.2.1 Cost and Affordability Constraints
- 7.2.2 Technology and Adoption Barriers
- 7.2.3 Supply Chain and Operational Constraints
- 7.3 Market Challenges
- 7.3.1 Competitive Pressure and Margin Erosion
- 7.3.2 Skills, Infrastructure and Implementation Gaps
- 7.4 Emerging Market Opportunities
- 7.5 Market Dynamics Impact and Time-Horizon Assessment
Chapter 8 Australia AI-Powered Online Loan Aggregators Value Chain Analysis
- 8.1 Industry Value Chain Overview
- 8.2 Upstream Suppliers and Critical Inputs
- 8.3 Technology and Component Providers
- 8.4 Manufacturing or Service Delivery
- 8.5 Distribution, Channel Partners and Integrators
- 8.6 Downstream Applications and End Users
- 8.7 Value Addition and Profit Pools
- 8.8 Vertical Integration and Outsourcing
- 8.9 Supplier Concentration and Risk
- 8.10 Supply Chain Localization and Resilience
Chapter 9 Australia AI-Powered Online Loan Aggregators Market Regulations and Policies
- 9.1 Relevant Laws, Standards and Compliance Frameworks
- 9.2 Product, Service, Safety and Quality Requirements
- 9.3 Government Policies, Incentives and Subsidies
- 9.4 Imports, Exports and Trade Barriers
- 9.5 Public Procurement and Local Content Requirements
- 9.6 Data Protection, AI and Cybersecurity Compliance
- 9.7 Upcoming Policy Changes and Market Implications
Chapter 10 Australia AI-Powered Online Loan Aggregators Market Hotspots and Opportunities
- 10.1 Market Opportunity Mapping and Growth Hotspots
- 10.2 High-Growth Applications and Customer Groups
- 10.3 Underserved Markets and White-Space Opportunities
- 10.4 Emerging Technology and Product Opportunities
- 10.5 New Capacity and Investment Hotspots
- 10.6 Market Entry and Expansion Opportunities
- 10.7 Distribution and Partnership Opportunities
- 10.8 Near-Term and Long-Term Commercial Potential
- 10.9 Opportunity Attractiveness and Execution Risks
Chapter 11 Australia AI-Powered Online Loan Aggregators Market Outlook, 2025-2035
- 11.1 Market Size and Analysis
- 11.1.1 Revenue (Market Measurement: 2025: USD 200.5 million → 2035: USD 1.06 billion)
- 11.1.2 Historical Market Size, 2018-2025
- 11.1.3 Base-Year Market Size, 2025
- 11.2 Market Forecast, 2025-2035
- 11.2.1 Revenue Forecast to 2035
- 11.2.2 CAGR and Year-on-Year Growth
- 11.2.3 Incremental Revenue Opportunity
- 11.3 Forecast Assumptions and Scenario Analysis
- 11.3.1 Base-Case Forecast
- 11.3.2 Optimistic and Conservative Scenarios
- 11.3.3 Technology, Pricing and Policy Sensitivities
- 11.4 Market Attractiveness and Growth Outlook
Chapter 12 Australia AI-Powered Online Loan Aggregators Market Segmentation and Outlook
- 12.1 Segmentation Summary and Market Shares, 2025
- 12.2 Largest and Fastest-Growing Segments
- 12.3 By Product Type - Market Size and Forecast, 2025-2035
- 12.3.1 Segment Definition and Scope
- 12.3.2 Historical Market Size, 2018-2025
- 12.3.3 Revenue Forecast, 2025-2035
- 12.3.4 Base-Year Market Share, 2025
- 12.3.5 Segment CAGR and Growth Drivers
- 12.3.6 Subsegment Market Size and Forecast
- 12.3.6.1 Residential mortgages
- 12.3.6.2 Personal loans
- 12.3.6.3 Vehicle finance
- 12.3.6.4 Business loans
- 12.3.7 Subsegment Pricing and Adoption Trends
- 12.3.8 Leading Suppliers and Competition
- 12.3.9 Regional Demand and Opportunities
- 12.4 By Customer Segment - Market Size and Forecast, 2025-2035
- 12.4.1 Segment Definition and Scope
- 12.4.2 Historical Market Size, 2018-2025
- 12.4.3 Revenue Forecast, 2025-2035
- 12.4.4 Base-Year Market Share, 2025
- 12.4.5 Segment CAGR and Growth Drivers
- 12.4.6 Subsegment Market Size and Forecast
- 12.4.6.1 Salaried households
- 12.4.6.2 Self-employed households
- 12.4.6.3 Business borrowers
- 12.4.7 Subsegment Pricing and Adoption Trends
- 12.4.8 Leading Suppliers and Competition
- 12.4.9 Regional Demand and Opportunities
- 12.5 By Revenue Model - Market Size and Forecast, 2025-2035
- 12.5.1 Segment Definition and Scope
- 12.5.2 Historical Market Size, 2018-2025
- 12.5.3 Revenue Forecast, 2025-2035
- 12.5.4 Base-Year Market Share, 2025
- 12.5.5 Segment CAGR and Growth Drivers
- 12.5.6 Subsegment Market Size and Forecast
- 12.5.6.1 Trail commissions
- 12.5.6.2 Upfront commissions
- 12.5.6.3 Technology licensing
- 12.5.6.4 Advertising revenue
- 12.5.7 Subsegment Pricing and Adoption Trends
- 12.5.8 Leading Suppliers and Competition
- 12.5.9 Regional Demand and Opportunities
- 12.6 Segment Growth Comparison
- 12.7 Segment Attractiveness and Priority Matrix
Chapter 13 Australia AI-Powered Online Loan Aggregators End-Use and Application Market Outlook
- 13.1 End-Use Industry and Customer Demand Structure
- 13.2 Leading Applications and Customer Groups
- 13.3 End-Use Market Size, Share and Forecast
- 13.4 Major End-Use Industry Deep Dives
- 13.4.1 Customer Requirements and Use Cases
- 13.4.2 Demand and Replacement Cycles
- 13.4.3 Technical and Regulatory Considerations
- 13.4.4 Purchasing and Procurement Models
- 13.4.5 Leading Vendors and Distribution Channels
- 13.4.6 Forecast and Commercial Opportunities
- 13.5 Emerging Applications and Cross-Segment Demand
- 13.6 End-Use Industry Investment Priorities
Chapter 14 Australia AI-Powered Online Loan Aggregators Geographic Market Outlook, 2025-2035
- 14.1 Domestic Market Distribution and Demand Clusters
- 14.2 State- or Province-Wise Market Size and Forecast, 2025-2035
- 14.3 City and Metropolitan Market Outlook
- 14.4 Industrial, Manufacturing and Commercial Clusters
- 14.5 Geographic Concentration of Key End Users
- 14.6 Local Pricing and Purchasing Differences
- 14.7 Domestic Production Facilities and Capacity Map
- 14.8 Local Infrastructure and Project Pipeline
- 14.9 State-Level Policy and Incentive Differences
- 14.10 Subnational Investment Hotspots and Opportunities
- 14.11 Distribution and Logistics Networks
- 14.12 Domestic Competitive Footprint
Chapter 15 Australia AI-Powered Online Loan Aggregators Technology, Innovation and Sustainability Outlook
- 15.1 Technology Landscape and Maturity
- 15.2 Product, Process and Service Innovation
- 15.3 AI, Automation and Digital Tools in the Industry
- 15.4 Technology Adoption and Performance Benchmarking
- 15.5 Innovation Pipeline and R&D Investment
- 15.6 Energy Efficiency and Resource Management
- 15.7 Sustainability, Recycling and Circularity
- 15.8 Technology Roadmap, 2025-2035
- 15.9 Risks of Obsolescence and Technology Substitution
Chapter 16 Australia AI-Powered Online Loan Aggregators Market Key Strategic Imperatives
- 16.1 Growth and Market Entry Priorities
- 16.2 High-Return Products and Segments
- 16.3 Pricing, Profitability and Cost Optimization
- 16.4 Technology Investment and Product Differentiation
- 16.5 Supply Chain Localization and Resilience
- 16.6 Distribution and Customer Acquisition
- 16.7 Partnership, Acquisition and Capacity Strategy
- 16.8 Regional Expansion Priorities
- 16.9 Short-, Medium- and Long-Term Actions
Chapter 17 Competition Outlook
- 17.1 Industry Competition Characteristics
- 17.2 Market Structure and Concentration
- 17.3 Market Share and Competitive Positioning, 2025
- 17.4 Company-Wise Revenue and Product Benchmarking
- 17.5 Production and Service Capacity Benchmarking
- 17.6 Technology, Pricing and Differentiation
- 17.7 Regional Footprint and Distribution Strength
- 17.8 Mergers, Acquisitions and Strategic Alliances
- 17.9 New Entrants and Competitive Threats
- 17.10 Porter's Five Forces and Industry Attractiveness
- 17.11 Competitive Outlook, 2025-2035
Chapter 18 Company Profiles
- 18.1 Company Coverage and Selection Criteria
- 18.2 Lendi Group
- 18.2.1 Business Description
- 18.2.2 Company Ownership and Geographic Presence
- 18.2.3 Product and Service Portfolio
- 18.2.4 Manufacturing and Operating Footprint
- 18.2.5 Financial Performance and Investment
- 18.2.6 Market Share and Competitive Position
- 18.2.7 Technology and Innovation Capabilities
- 18.2.8 Strategic Alliances or Partnerships
- 18.2.9 Recent Developments
- 18.2.10 Growth Strategy and Outlook
- 18.3 Mortgage Choice
- 18.4 Australian Finance Group
- 18.5 Finder
- 18.6 Canstar
- 18.7 RateCity
- 18.8 Tiimely
- 18.9 Other Relevant Market Participants
Note: Every listed company is profiled on the structure shown under the first company. The company list is preliminary and may change based on research findings, market developments, data availability and client requirements.
Chapter 19 Disclaimer
- 19.1 Research and Forecast Disclaimer
- 19.2 Data Source and Estimation Limitations
Note: The depth of individual sections depends on data availability for this market. Volume, capacity, trade and other unit-based metrics are included where applicable.