
Market Overview:
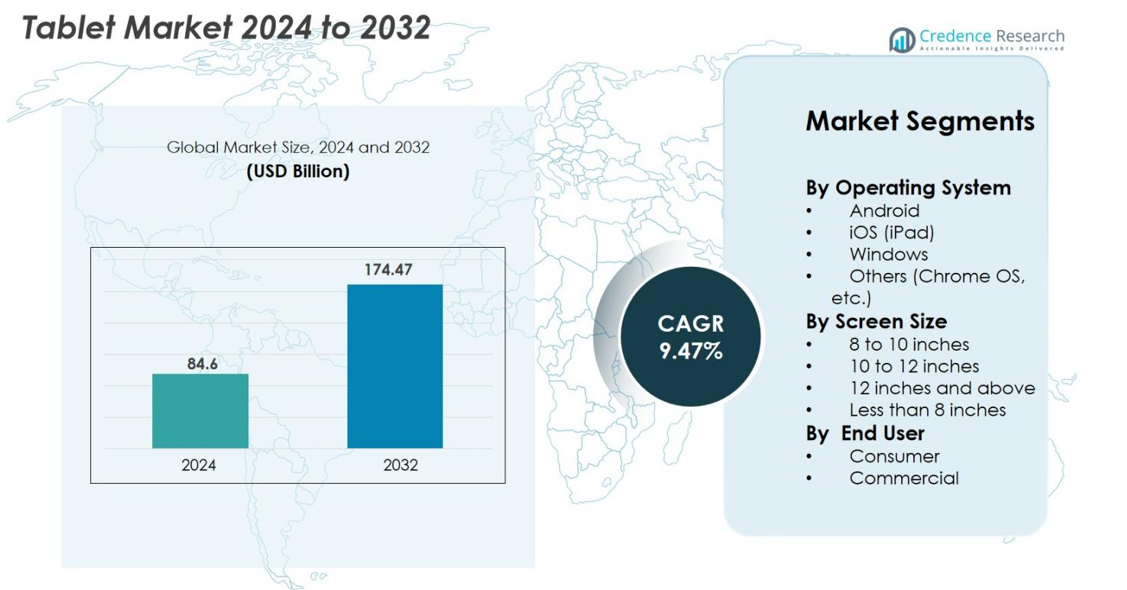
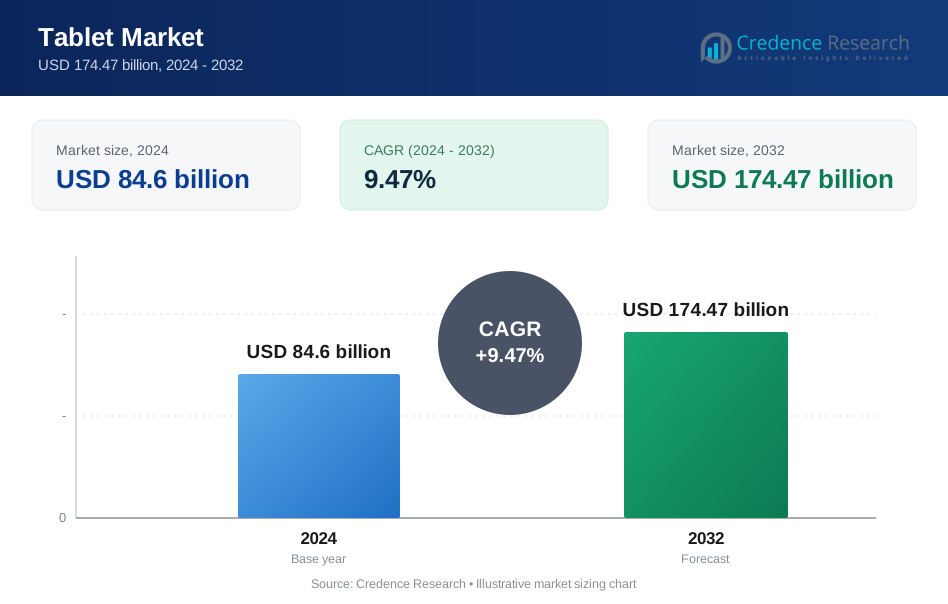
The Tablet market size was valued at USD 84.6 Billion in 2024 and is anticipated to reach USD 174.47 Billion by 2032, at a CAGR of 9.47% during the forecast period.
| REPORT ATTRIBUTE | DETAILS |
|---|---|
| Historical Period | 2020-2023 |
| Base Year | 2024 |
| Forecast Period | 2025-2032 |
| Tablet Market Size 2024 | USD 84.6 Billion |
| Tablet Market, CAGR | 9.47% |
| Tablet Market Size 2032 | USD 174.47 Billion |
The Tablet market is dominated by several key players, including Apple, Samsung, Amazon, Lenovo, Microsoft, and Huawei. Apple holds a significant lead in the premium segment with its iPad series, accounting for approximately 40% of the global tablet market share, driven by its strong brand presence and seamless integration within its ecosystem. Samsung follows with a substantial share of around 18%, offering a wide range of Android-based tablets, including the Galaxy Tab series. Amazon's Fire Tablets cater to the budget-conscious segment, securing about 7% of the market. Lenovo and Microsoft capture notable shares, focusing on enterprise solutions with products like the Lenovo Tab and Microsoft Surface. The leading regions for tablet sales include North America, holding around 44.6% of the global market share, followed by Asia Pacific with 35.8%. Europe holds approximately 14.2%, with Latin America and the Middle East & Africa accounting for smaller but growing shares.
Market Insights
- The global Tablet market was valued at USD 84.6 billion in 2024 and is expected to reach USD 174.47 billion by 2032, growing at a CAGR of 9.47% during the forecast period.
- Key drivers include increasing demand for portability, technological advancements in tablet features, and growing adoption in education and enterprise sectors, fueling market growth.
- Major trends include the rise of hybrid tablets, 5G integration, and the growing demand for digital learning tools, offering new opportunities for vendors.
- The competitive landscape is led by Apple with around 40% market share, followed by Samsung at 18%, and Amazon at 7%, with other players like Lenovo and Microsoft expanding their presence.
- Regionally, North America leads with 44.6% market share, followed by Asia Pacific at 35.8%, Europe at 14.2%, and Latin America and Middle East & Africa with smaller but growing shares.
Market Segmentation Analysis
By Operating System
The Tablet market is dominated by Android, which holds a significant share, driven by its extensive ecosystem and wide range of devices across various price points. iOS (iPad) follows closely, primarily led by Apple's strong brand presence and consistent innovations. Windows tablets cater mainly to commercial users, benefiting from integration with business systems and productivity tools. Other operating systems, including Chrome OS, hold a smaller share but are growing due to their affordability and suitability for educational and budget-conscious consumers. Android leads with approximately 45% market share, followed by iOS with 40%.
- For instance, Samsung’s Galaxy Tab series has become one of the leading Android tablets, offering multiple configurations with high-quality displays and performance, contributing to the Android ecosystem’s strong hold.
By Screen Size
Tablets in the 8 to 10-inch category dominate the market, accounting for around 50% of the market share. This size offers a balance between portability and usability, making it popular for both consumer and commercial use. The 10 to 12-inch segment follows closely, especially favored by users who require larger displays for productivity tasks. Tablets with screens larger than 12 inches are increasingly used in commercial settings for professional tasks that demand more screen real estate. Smaller devices (less than 8 inches) appeal to those prioritizing portability, but they make up a smaller share.
- For instance, the Samsung Galaxy Tab A9 features an 8.7‑inch (22.1 cm) display, offers 4 GB of RAM and 64 GB of storage (expandable to 1 TB), and is powered by a MediaTek Helio G99 processor clocked at 2.2 GHz.
By End User
The Consumer segment is the largest in the Tablet market, driven by the increasing demand for entertainment, education, and personal productivity. It holds about 60% of the market share, with devices being widely used for media consumption and social networking. The Commercial segment, however, is growing rapidly, particularly in industries like education, healthcare, and retail, where tablets are used for customer engagement, digital signage, and point-of-sale systems. The demand in this segment is driven by mobility and ease of integration into business operations, making it the fastest-growing segment.
Key Growth Drivers
Rising Demand for Mobility and Portability
The increasing demand for portable and lightweight devices is one of the primary growth drivers for the Tablet market. Tablets offer the perfect balance of performance, portability, and user experience, making them ideal for consumers and professionals on the go. With the growing need for devices that enable productivity, entertainment, and communication in a mobile context, tablets are becoming more popular among students, business professionals, and travelers. This demand is further amplified by the proliferation of remote work, online learning, and the trend toward digital content consumption. As consumers increasingly prioritize portability without sacrificing performance, tablets have carved a strong niche in the personal and professional device categories. The ability to combine functionality and convenience in a single device continues to drive adoption globally.
- For instance, the Realme Pad 2 Lite features a 10.95‑inch display in a construct aimed at mobile users, indicating how manufacturers are designing tablets for on‑the‑go productivity and entertainment.
Technological Advancements and Innovation
Technological advancements in tablet displays, processing power, and battery life have significantly contributed to the growth of the Tablet market. Modern tablets feature high-resolution displays, long-lasting batteries, and powerful processors that cater to diverse use cases such as gaming, media consumption, education, and business applications. Manufacturers are integrating new technologies like AI, 5G connectivity, and advanced stylus support to enhance tablet functionality further. The introduction of features like face recognition, advanced camera systems, and more robust multitasking capabilities has raised the appeal of tablets, making them a viable alternative to laptops and other computing devices. These technological upgrades also contribute to higher user engagement and satisfaction, which fuels repeat purchases and greater market penetration across different consumer demographics.
- For instance, the Apple iPad Pro with its Liquid Retina XDR display provides a 120Hz refresh rate and enhanced brightness, offering an immersive experience for professionals and creatives.
Growing Adoption in Education and Enterprise Applications
Tablets are gaining traction in both education and enterprise sectors due to their ease of use, affordability, and versatility. In the education sector, tablets enable personalized learning experiences, offering students access to digital textbooks, interactive content, and collaborative learning tools. Educational institutions are increasingly incorporating tablets into their classrooms, making digital learning more accessible and efficient. In the enterprise sector, tablets are widely adopted for point-of-sale systems, inventory management, and mobile business operations, especially in industries like retail, healthcare, and logistics. Tablets allow employees to perform tasks quickly and efficiently, driving productivity. This widespread adoption in both sectors is expected to remain a significant driver of market growth, as businesses and educational institutions continue to embrace digital transformation and mobile solutions.
Key Trends & Opportunities
Integration of 5G Connectivity and Enhanced Mobile Capabilities
With the ongoing rollout of 5G networks worldwide, tablets are poised to capitalize on the increased demand for faster internet speeds and enhanced mobile capabilities. The integration of 5G connectivity in tablets will open up new opportunities for industries like entertainment, gaming, and virtual collaboration. Tablets with 5G capabilities offer ultra-fast download speeds, low latency, and improved overall performance, making them ideal for streaming, online gaming, video conferencing, and other bandwidth-heavy applications. This technology also allows users to remain connected in remote areas, further expanding the tablet’s potential use cases. As 5G adoption grows, it is expected to drive a new wave of innovation in tablet design and functionality, allowing manufacturers to introduce features that were previously not possible with 4G or Wi-Fi-only devices, offering a significant opportunity for growth in the market.
- For instance, the Samsung Galaxy Tab S7 5G offers ultra-fast download speeds, enabling users to stream high-definition content seamlessly or play high-performance games without lag.
Increasing Popularity of Hybrid Tablets for Work and Play
A significant trend in the tablet market is the growing popularity of hybrid or 2-in-1 devices that combine the portability of tablets with the functionality of laptops. These hybrid devices are equipped with detachable keyboards, making them versatile tools for both work and leisure activities. The ability to seamlessly switch between tablet mode and laptop mode is particularly appealing to professionals, students, and remote workers, as it allows them to use a single device for productivity tasks and entertainment. The rise in hybrid tablet adoption is also driven by the increasing demand for multifunctional, space-saving gadgets that can replace multiple devices. As more companies and consumers prioritize versatile and cost-effective solutions, the hybrid tablet market is expected to see significant growth, offering manufacturers an opportunity to cater to a wider range of user needs.
- For instance, the Microsoft Surface Pro 8 offers a detachable keyboard and is powered by Intel’s 11th-generation Core i7 processor, providing strong performance for both productivity tasks and entertainment.
Key Challenges
Competition from Other Portable Devices
One of the major challenges facing the Tablet market is the increasing competition from other portable devices, such as laptops and smartphones. As laptops become more lightweight and smartphones grow larger with more powerful features, tablets are finding it harder to differentiate themselves in terms of functionality. While tablets offer mobility and ease of use, many users prefer the full computing capabilities of a laptop or the all-in-one convenience of a smartphone. The increasing overlap in the features of tablets, laptops, and smartphones leads to consumer indecision, as they often opt for devices that offer a broader range of uses. To overcome this challenge, tablet manufacturers must continuously innovate, offering more specialized features or unique functionalities to carve out their market niche and maintain competitive advantage.
Price Sensitivity and Affordability Issues
The Tablet market faces a challenge with price sensitivity, particularly in emerging markets where cost is a crucial consideration for consumers. While premium tablets such as the iPad offer advanced features and performance, they come with high price tags, making them less accessible for budget-conscious buyers. Lower-cost tablets, on the other hand, may lack the performance and features that high-end users expect, leading to trade-offs in quality and user experience. Additionally, in markets where consumers already own smartphones and laptops, the perceived need for a tablet is lower, especially if the tablet doesn’t offer significant advantages over existing devices. Manufacturers must balance feature innovation with affordability to expand their customer base and address the cost concerns of price-sensitive consumers.
Regional Analysis
North America
North America remains a major regional market for tablets, accounting for 44.6% share of global shipments. The strong share stems from high consumer penetration of tablets, widespread digital education, enterprise computing adoption, and robust infrastructure supporting online content delivery and remote work. Demand is driven by the United States, where hybrid work models and digital learning increasingly rely on tablets. Despite premium pricing and saturation in some sub‑segments, the region continues to generate substantial unit volumes and remains strategically important for global vendors seeking high‑value customers.
Asia Pacific
The Asia Pacific region leads growth in the tablet market, owning over 35.8% share in 2024 and exhibiting strong year‑on‑year expansion. The region’s large and diverse population, rising disposable incomes, and expanding middle class fuel demand, particularly in India, China, and Southeast Asia. Significant demand is also driven by digital education initiatives, mobile connectivity expansion, and the proliferation of e‑commerce, all of which make tablets highly accessible. The competitive environment and regional manufacturing base further enhance adoption, highlighting Asia Pacific as the dominant sub‑region by growth and volume.
Europe
Europe commands a meaningful portion of the tablet market, with steady growth tied to e‑learning uptake, enterprise mobility, and consumer content consumption. The region benefits from the rise of remote work and digital education, which stimulate tablet purchases for both home and professional use. The e‑learning expansion in the region and strong connectivity infrastructure support the penetration of tablets in classrooms and offices. While growth rates are modest compared with Asia Pacific, Europe remains a key mature market, holding 14.2% share, offering reliable revenue streams for manufacturers and channel partners.
Latin America
Latin America is emerging as a growth region in the tablet market, driven by rising smartphone penetration, urbanization, and digital education programs. The region holds a share of 4.5%, with increasing demand, especially in Brazil and Mexico, where tablets offer affordable digital access for students and professionals. Although the region currently holds a smaller share compared with North America or Asia Pacific, favorable demographics, growing middle-class spending, and improving connectivity infrastructure make Latin America an attractive market for growth‑oriented vendors.
Middle East & Africa
The Middle East & Africa region is showing steady tablet market expansion, with an estimated market share of 1.7%. Rising mobile internet access, expanding digital education, and increasing enterprise mobility are key factors driving growth. While the region’s share remains smaller than the major geographies, its growth potential is significant due to the large youth population, government initiatives promoting digital learning, and fewer legacy computing investments. The affordability of tablets and their suitability for education and remote business use present a strong growth opportunity for vendors willing to tailor offerings to regional conditions.
Market Segmentations
By Operating System
- Android
- iOS (iPad)
- Windows
- Others (Chrome OS, etc.)
By Screen Size
- 8 to 10 inches
- 10 to 12 inches
- 12 inches and above
- Less than 8 inches
By End User
- Consumer
- Commercial
By Geography
- North America
- U.S.
- Canada
- Mexico
- Europe
- Germany
- France
- U.K.
- Italy
- Spain
- Rest of Europe
- Asia Pacific
- China
- Japan
- India
- South Korea
- South-east Asia
- Rest of Asia Pacific
- Latin America
- Brazil
- Argentina
- Rest of Latin America
- Middle East & Africa
- GCC Countries
- South Africa
- Rest of the Middle East and Africa
Competitive Landscape
The competitive landscape of the tablet market is characterized by the presence of several key players across various segments, each vying for market share through product innovation, pricing strategies, and differentiated offerings. Leading companies in the market include Apple, with its flagship iPad dominating the premium tablet segment, offering cutting-edge features and a seamless ecosystem. Samsung follows closely, with its Galaxy Tab series catering to both high-end and budget-conscious consumers, supported by robust technological integration and Android operating system flexibility. Amazon is a significant player in the affordable tablet segment with its Fire Tablets, focusing on media consumption at competitive prices. Other notable players such as Lenovo, Microsoft, and Huawei are focusing on hybrid models and enterprise applications, with products like Surface and MatePad. Asus, Xiaomi, and TCL are also strengthening their presence with affordable options and expanding their market share in emerging regions. The competition is driven by continuous technological advancements, strategic partnerships, and a strong focus on pricing to capture a diverse consumer base across the globe.
Key Player Analysis
- Samsung
- Apple (iPad)
- Lenovo
- Xiaomi
- Amazon (Fire Tablets)
- Microsoft (Surface)
- Huawei
- Google (Pixel Tablet)
- TCL
- Asus
Recent Developments
- In 2025, at the Mobile World Congress (MWC) in Barcelona, TCL unveiled its inaugural AI-powered tablet, the NxtPaper 4.0. This model introduces an advanced iteration of its signature display technology, incorporating Smart Eye Comfort Mode and Customized Eye Comfort Mode for improved eye comfort, screen clarity, and overall adaptability.
- In June 2025, Nubia launched the Pad Pro internationally, positioning it as a strong competitor to high-end iPads. The device boasts a Qualcomm Snapdragon 8 Gen 3 chipset, with memory options ranging from 8GB to 16GB and internal storage options of 256GB or 512GB.
- In 2025, Redmi globally released the Pad 2, an impressive Android tablet featuring an 11-inch display, a Helio G100 Ultra chipset, and a robust 9,000 mAh battery.
Report Coverage
The research report offers an in-depth analysis based on Operating System, Screen Size, End-User and Geography. It details leading market players, providing an overview of their business, product offerings, investments, revenue streams, and key applications. Additionally, the report includes insights into the competitive environment, SWOT analysis, current market trends, as well as the primary drivers and constraints. Furthermore, it discusses various factors that have driven market expansion in recent years. The report also explores market dynamics, regulatory scenarios, and technological advancements that are shaping the industry. It assesses the impact of external factors and global economic changes on market growth. Lastly, it provides strategic recommendations for new entrants and established companies to navigate the complexities of the market.
Future Outlook
- The tablet market will continue to expand as demand for portable and multifunctional devices increases.
- Hybrid tablets with detachable keyboards and 2-in-1 capabilities will gain further traction in both consumer and commercial sectors.
- The integration of 5G connectivity will enhance tablet performance, enabling faster downloads, low latency, and improved mobile experiences.
- Increased adoption of tablets in education and enterprise sectors will drive sustained growth, particularly in emerging markets.
- The growing trend towards remote work and digital learning will maintain a steady demand for tablets across various demographics.
- Tablets will become more integrated with AI and smart home ecosystems, offering seamless connectivity with other devices.
- Affordability and access to low-cost tablets will drive growth in developing regions, where digital inclusion efforts are expanding.
- Technological advancements, such as OLED displays and improved battery life, will make tablets more appealing to tech-savvy consumers.
- Tablets will continue to serve as an ideal device for media consumption, gaming, and productivity, with improved performance across these areas.
- The competition between leading brands will intensify, with players focusing on innovation, customization, and regional market penetration.
Request a Free Sample
Fill in your details and we'll send you a free sample report.
- Sample data tables & charts
- Research methodology
Need a Custom Version of This Report?
Tailor the scope, geography, or segments to your exact requirements.
- Custom geography or segment scope
- Direct access to our analyst team
Frequently Asked Questions
What is the current market size for the Tablet market, and what is its projected size in 2032?
At what Compound Annual Growth Rate is the Tablet market projected to grow between 2025 and 2032?
What are the key drivers for the growth of the tablet market?
What are the primary factors fueling the growth of the Tablet market?
Who are the leading companies in the Tablet market?
Table of Content
Chapter 1. Report Introduction
- 1.1 Report Description & Purpose
- 1.1.1 Report Title & Market Definition
- 1.1.2 Unique Selling Propositions (USP) & Key Differentiators
- 1.1.3 Value Proposition for Stakeholders
- 1.2 Research Objectives
- 1.2.1 Market Sizing Objectives (Volume & Revenue)
- 1.2.2 Segmentation Objectives
- 1.2.3 Competitive Intelligence Objectives
- 1.2.4 Forecast & Scenario Objectives
- 1.3 Report Scope
- 1.3.1 Tablet Scope – Types & Subtypes Covered
- 1.3.2 Geographic Scope – Regions & Countries Covered
- 1.3.3 Historical Period, Base Year & Forecast Period (2024; forecast to 2032)
- 1.3.4 Inclusions & Exclusions
- 1.4 HS Code & Classification Framework
- 1.5 Currency, Units & Pricing Basis
- 1.6 Target Stakeholders
- 1.7 Limitations & Assumptions
Chapter 2. Executive Summary
- 2.1 Global Tablet Market Snapshot
- 2.1.1 Market Size – Historical (2024) & Forecast (2024-2032) (2024: USD 84.6 billion → 2032: USD 174.47 billion)
- 2.1.2 Volume & Revenue – Global Totals
- 2.1.3 Key Market Highlights – Top Five Facts
- 2.2 Tablet Market Segmentation Snapshot
- 2.2.1 Market Split by Region – 2024 vs. 2032
- 2.3 Competitive Snapshot
- 2.3.1 Top 10 Players by Revenue Share – 2024
- 2.3.2 Top 10 Players by Volume Share – 2024
- 2.3.3 Recent Strategic Developments (18-Month Summary)
- 2.4 Key Investment Highlights & Strategic Conclusions
Chapter 3. Tablet Market Dynamics & Industry Analysis
- 3.1 Market Overview & Context
- 3.1.1 Tablet Market Position in the Broader Automotive Value Chain
- 3.1.2 OEM vs. Replacement Market Dynamics
- 3.1.3 Market Maturity & Development Stage by Region
- 3.2 Tablet Market Drivers
- 3.3 Tablet Market Restraints & Challenges
- 3.4 Tablet Market Opportunities
- 3.5 Porter's Five Forces Analysis
- 3.5.1 Threat of New Entrants
- 3.5.2 Bargaining Power of Suppliers
- 3.5.3 Bargaining Power of Buyers
- 3.5.4 Threat of Substitutes
- 3.5.5 Competitive Rivalry – Intensity Assessment
- 3.6 Tablet Value Chain Analysis
- 3.6.1 Upstream – Raw Material/Input Suppliers
- 3.6.1.1 Raw Material/Input 1
- 3.6.1.2 Raw Material/Input 2
- 3.6.1.3 Raw Material/Input 3
- 3.6.2 Midstream – Production/Manufacturing/Service Delivery
- 3.6.2.1 Production/Process Overview
- 3.6.2.2 Key Facility Locations & Capacity by Manufacturer
- 3.6.3 Downstream – Distribution & End Consumer
- 3.6.3.1 Primary Channel – B2B/OEM
- 3.6.3.2 Secondary Channels – Dealer, Retail, Online, Direct
- 3.6.4 Value Chain Profitability Analysis
- 3.6.1 Upstream – Raw Material/Input Suppliers
- 3.7 PESTEL Analysis
- 3.7.1 Political Factors
- 3.7.2 Economic Factors
- 3.7.3 Social Factors
- 3.7.4 Technological Factors
- 3.7.5 Environmental Factors
- 3.7.6 Legal Factors
- 3.8 Tablet Supply Chain Analysis
- 3.8.1 Raw Material/Input Supply Risk Assessment
- 3.8.2 Manufacturing Concentration Risk (Geographic Exposure)
- 3.8.3 Trade Disruption Impact Analysis
- 3.9 Regulatory & Policy Landscape
Note: The regulatory and policy landscape section covers regulations based on their applicability to the market, Tablet category, geography, and scope of the study. Only regulatory frameworks with a material impact on operations, compliance, trade, sustainability, or market access are analyzed in detail.
Chapter 4. Key Investment Pockets & Opportunity Analysis
- 4.1 Tablet Market Attractiveness Analysis
- 4.1.1 By Region – Investment Attractiveness Matrix (Volume × CAGR)
- 4.2 Absolute Revenue Growth Opportunity
- 4.2.1 By Region – Absolute USD Growth Through 2032
- 4.3 Incremental Volume Opportunity
- 4.3.1 By Region – Incremental Volume Through 2032
- 4.3.2 Segment – Incremental Volume
- 4.4 Emerging Submarket Opportunity Deep Dive (Subject to Applicability)
- 4.5 Emerging Market Opportunity Scorecards
- 4.5.1 United States
- 4.5.2 Europe
- 4.5.3 Asia
- 4.5.4 Middle East & Africa
Note: Emerging Market Opportunity Scorecards will be included based on relevance and strategic importance. Regions listed are indicative and may vary depending on data availability and market dynamics.
Chapter 5. Tablet Import-Export Analysis & Trade Flows
- 5.1 Global Trade Overview
- 5.1.1 Global Export Value by Country (2024)
- 5.1.2 Global Export Volume by Country (2024)
- 5.1.3 Global Import Value by Country (2024)
- 5.1.4 Global Import Volume by Country (2024)
- 5.1.5 Net Trade Balance by Country (2024)
- 5.2 Export Analysis – Segment
- 5.2.1 Type 1 (HS Code)
- 5.2.2 Type 2 (HS Code)
- 5.2.3 Type 3 (HS Code)
- 5.2.4 Type 4 (HS Code)
- 5.2.5 Type 5 (HS Code)
- 5.3 Import Analysis – Segment
- 5.3.1 Type 1 (HS Code)
- 5.3.2 Type 2 (HS Code)
- 5.3.3 Type 3 (HS Code)
- 5.3.4 Type 4 (HS Code)
- 5.3.5 Type 5 (HS Code)
- 5.4 Average Unit Trade Prices
- 5.4.1 Average Export Price – Segment & Country
- 5.4.2 Average Import Price – Segment & Source Country
- 5.4.3 Price Trends (2024)
- 5.5 Key Trade Route Analysis
- 5.5.1 Trade Route 1
- 5.5.2 Trade Route 2
- 5.5.3 Trade Route 3
- 5.5.4 Trade Route 4
- 5.5.5 Trade Route 5
- 5.6 Trade Policy Impact Assessment
- 5.6.1 US Anti-Dumping & Section 301 Tariffs
- 5.6.2 EU Customs Union Impact
- 5.6.3 Major Free Trade Agreements
- 5.6.4 USMCA Rules of Origin
Note: Trade policy analysis will be included only where relevant to the Tablet market.
Chapter 6. Competitive Landscape & Company Benchmarking
- 6.1 Tablet Market Concentration & Structure
- 6.1.1 Herfindahl-Hirschman Index (HHI) – vs. 2024
- 6.1.2 Tier 1, Tier 2 & Tier 3 Market Structure
- 6.1.3 Global, Regional & Local Player Dynamics
- 6.2 Tablet Market Share Analysis – 2024
- 6.2.1 Global Revenue Share by Company
- 6.2.2 Global Volume Share by Company
- 6.2.3 Regional Revenue Share
- 6.2.4 Market Share Evolution ( vs. 2024)
- 6.2.5 OEM Segment Share by Company
- 6.2.6 Replacement Segment Share by Company
- 6.3 Production/Delivery Capacity & Facility Analysis
- 6.3.1 Global Installed Capacity
- 6.3.2 Capacity Utilization Rates
- 6.3.3 Production/Output Volume
- 6.3.4 Facility Locations & Capacity Map
- 6.3.5 Planned Capacity Additions
- 6.4 Tablet Competitive Benchmarking Matrix
- 6.4.1 Revenue, Volume, CAGR & Profitability Comparison
- 6.4.2 Channel Revenue Mix
- 6.4.3 Geographic Revenue Exposure
- 6.4.4 R&D Intensity
- 6.4.5 Sustainability Maturity
- 6.5 Strategic Developments in Tablet (Last 24 Months)
- 6.5.1 Mergers, Acquisitions & Divestments
- 6.5.2 New Tablet Launches
- 6.5.3 Facility Expansions
- 6.5.4 Strategic Alliances, Joint Ventures & Partnerships
- 6.5.5 Distribution Expansion & Market Entry
- 6.5.6 Sustainability & ESG Initiatives
- 6.6 Competitive Strategy Mapping
- 6.6.1 Leader, Challenger, Follower & Niche Classification
- 6.6.2 Pricing Strategy Comparison
- 6.6.3 Channel Strategy Matrix
Note: Strategic developments are included based on their materiality and the availability of reliable information.
Chapter 7. Global Tablet Market – By Distribution Channel
- 7.1 Segment Overview
- 7.1.1 Volume & Revenue Split by Channel (2024 & 2032)
- 7.1.2 Channel Mix Evolution (2024-2032)
Chapter 8. Regional Market Analysis – Global Overview
- 8.1 Global Regional Overview
- 8.1.1 Regional Volume Share
- 8.1.2 Regional Revenue Share
- 8.1.3 Regional Volume by Region
- 8.1.4 Regional Revenue by Region
- 8.1.5 Regional Forecast Through 2032
- 8.2 Cross-Regional Segment Analysis
- 8.2.1 By Distribution Channel
- 8.2.2 By Brand/Price Tier
Chapter 9. North America Tablet Market
- 9.1 United States
- 9.2 Canada
- 9.3 Mexico
Chapter 10. Europe Tablet Market
- 10.1 Germany
- 10.2 France
- 10.3 Italy
- 10.4 United Kingdom
- 10.5 Spain
- 10.6 Poland
- 10.7 Russia
- 10.8 Netherlands
- 10.9 Belgium
- 10.10 Sweden
- 10.11 Denmark
- 10.12 Norway
- 10.13 Rest of Europe
Chapter 11. Asia Pacific Tablet Market
- 11.1 China
- 11.2 India
- 11.3 Japan
- 11.4 South Korea
- 11.5 Thailand
- 11.6 Indonesia
- 11.7 Vietnam
- 11.8 Malaysia
- 11.9 Australia
- 11.10 Rest of Asia Pacific
Chapter 12. Latin America Tablet Market
- 12.1 Brazil
- 12.2 Argentina
- 12.3 Colombia
- 12.4 Chile
- 12.5 Rest of Latin America
Chapter 13. Middle East Tablet Market
- 13.1 Saudi Arabia
- 13.2 United Arab Emirates
- 13.3 Turkey
- 13.4 Israel
- 13.5 Iran
- 13.6 Rest of the Middle East
Chapter 14. Africa Tablet Market
- 14.1 South Africa
- 14.2 Egypt
- 14.3 Nigeria
- 14.4 Morocco
- 14.5 Rest of Africa
Chapter 15. Tablet Company Profiles
- 15.1 [Company 01]
- 15.1.1 Company Overview
- 15.1.2 Key Management Personnel
- 15.1.3 Products & Services Portfolio
- 15.1.4 Financial Performance
- 15.1.5 Key Market Focus & Geographic Presence
- 15.1.6 Recent Developments & Strategic Initiatives
Note: The company profile list is preliminary and may change based on research findings, market developments, data availability, and client requirements.
Chapter 16. Appendices
- Appendix A – List of Abbreviations & Acronyms
- Appendix B – Industry Classification Code Reference – Full Series
- Appendix C – Production & Capacity Data Tables
- Appendix D – End-Use & Demand Base Tables
- Appendix E – Consumption & Replacement Rate Assumptions
- Appendix F – ASP Reference Tables
- Appendix G – Manufacturing & Facility Database
- Appendix H – Import-Export Data Tables
- Appendix I – Regulatory Summary Tables
- Appendix J – Primary Research Participant List (Anonymized)
- Appendix K – Primary Research Questionnaire Framework
- Appendix L – Data Sources & Bibliography
- Appendix M – Market Size Divergence & Source Comparison
Chapter 17. Research Methodology
- 17.1 Research Framework & Philosophy
- 17.2 Secondary Research – Sources, Hierarchy & Data Extraction
- 17.3 Data Modeling – Bottom-Up & Top-Down Market Sizing
- 17.4 Primary Research – Stakeholder Framework, LOI & Sample Sizes
- 17.5 Forecast Methodology – Regression, Scenario & Sensitivity Analysis
- 17.6 Quality Control – Four-Layer Validation Framework
- 17.7 Limitations & Standard Assumptions
- 17.8 Disclaimer
