
Where Vietnam digital advertising retail media money goes
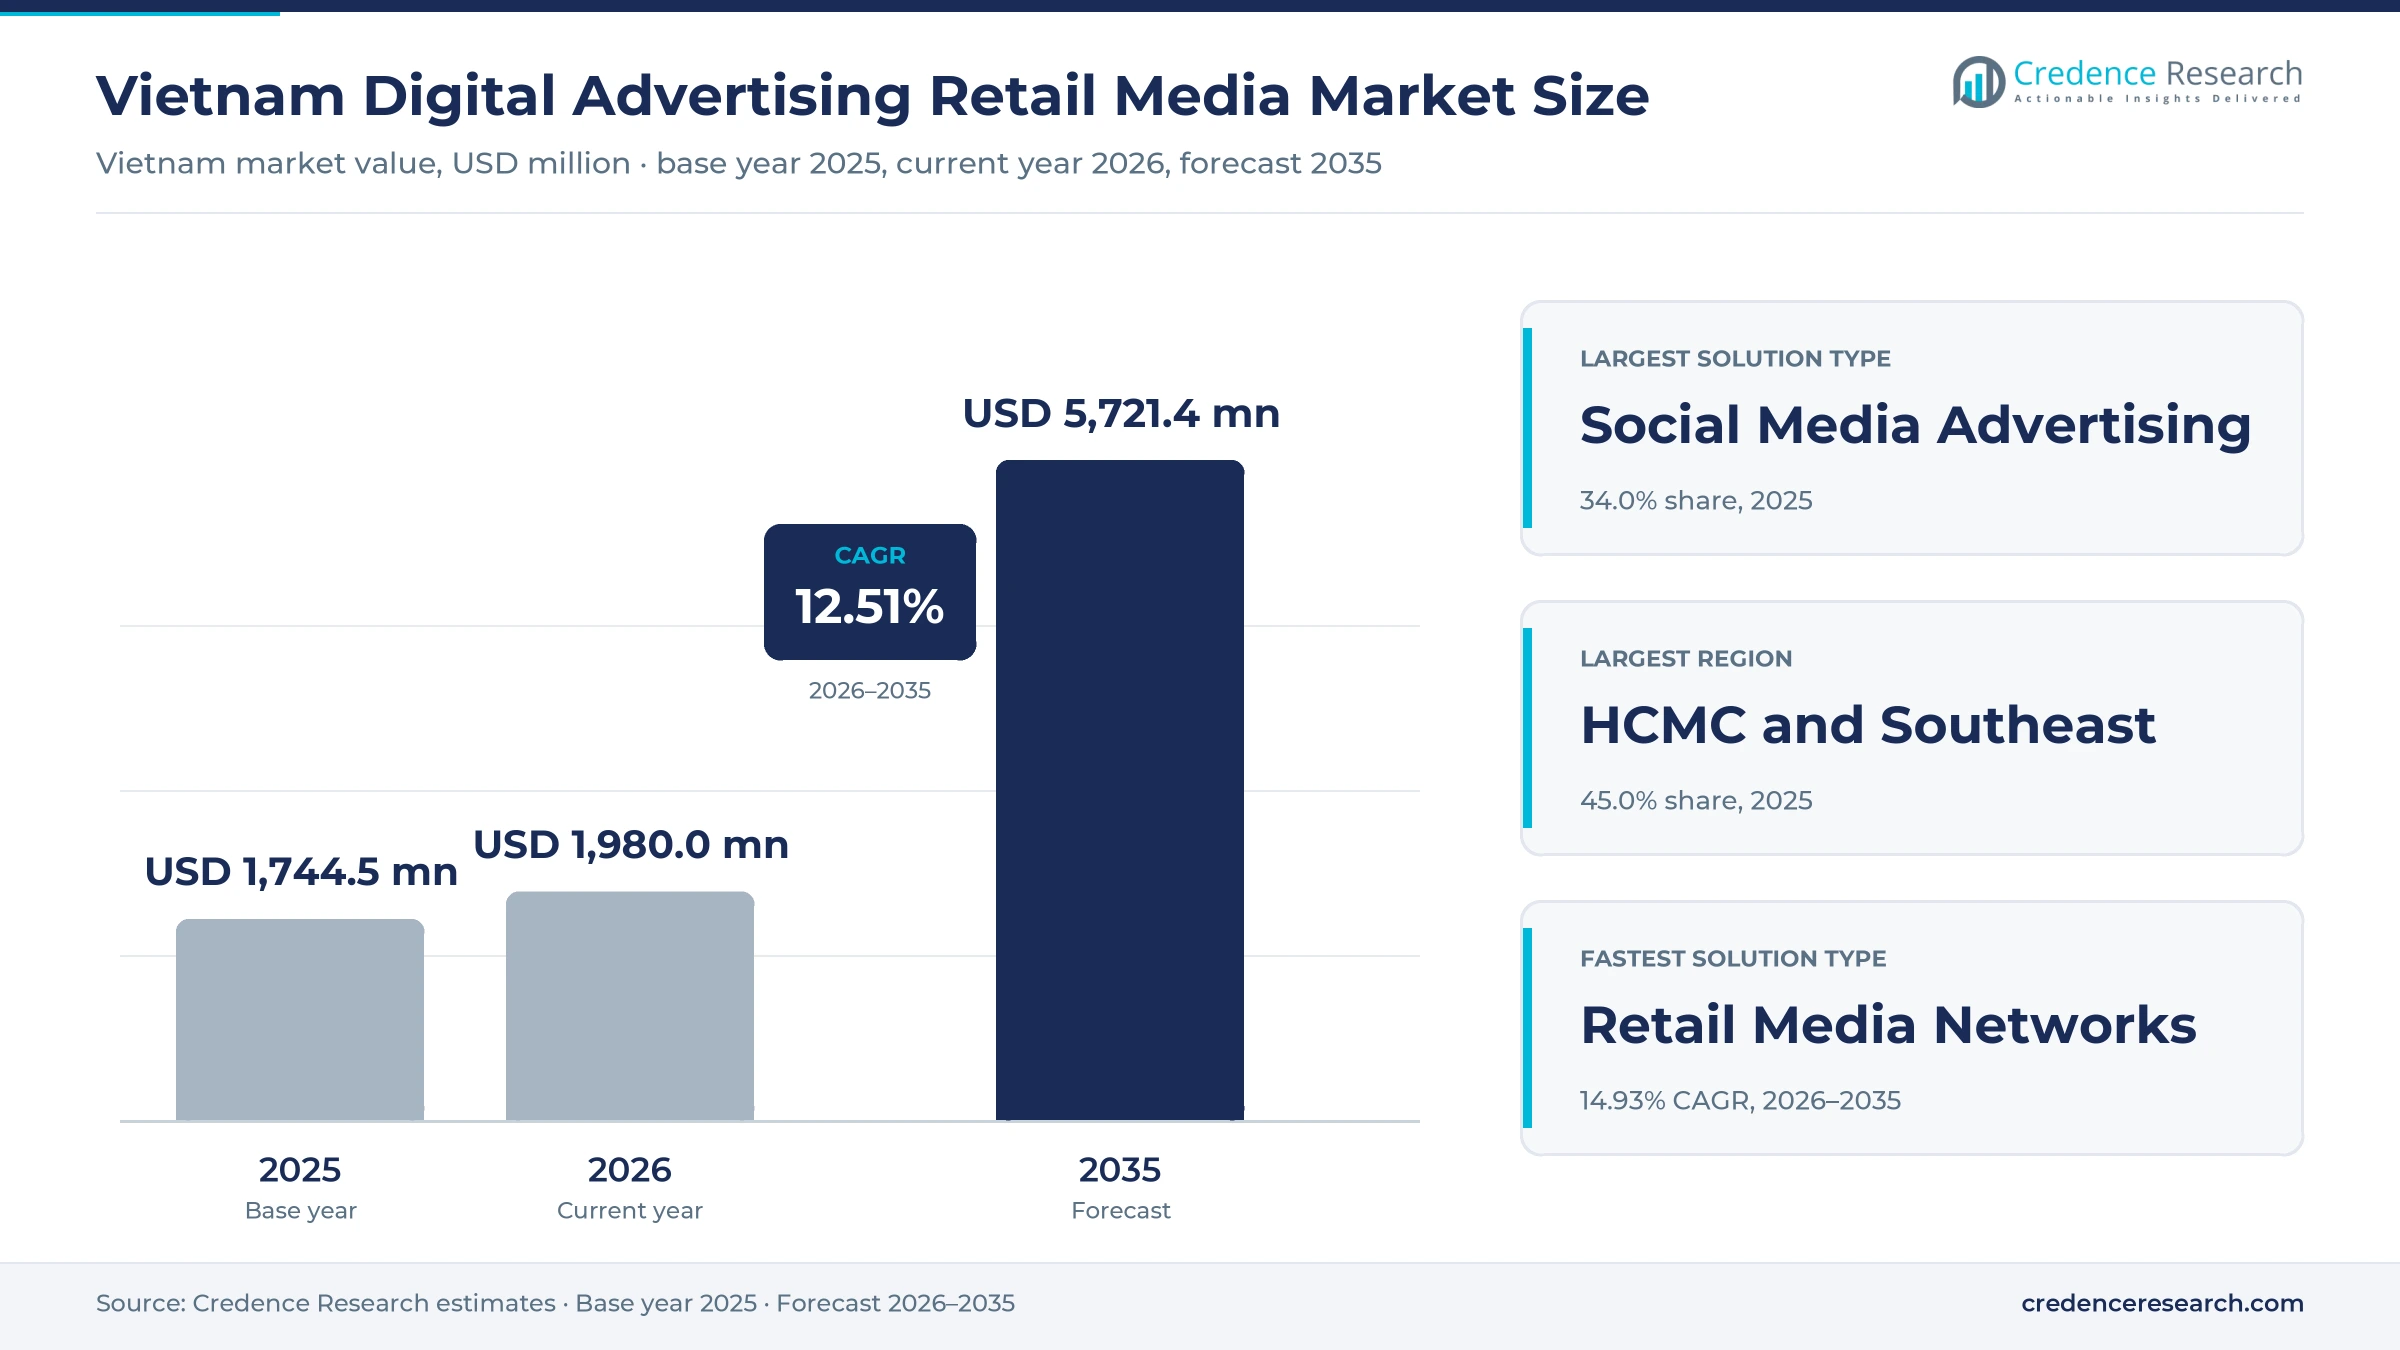
The Vietnam digital advertising retail media market was valued at USD 1.74 billion in 2025 and is projected to increase from USD 1.98 billion in 2026 to USD 5.72 billion by 2035, registering a CAGR of 12.51% during 2026–2035. Spending comes from consumer brands, marketplace sellers, banks, telecom operators and travel companies that reach shoppers through social feeds, search, video and sponsored listings. Ho Chi Minh City and Southeast Corridor held the largest regional share, 45.0% in 2025, because Ho Chi Minh City anchors both agency buying and online sales. Emerging Provincial Markets is the fastest-growing region at 13.70% a year as marketplaces and short video reach buyers outside the two largest metro areas. The main commercial change is the shift of budget toward TikTok Shop and Shopee, where an ad can be judged on orders rather than clicks. The main regulatory change is Decree 342, effective Feb. 15, 2026, which caps forced video viewing at five seconds and sets a 24-hour removal duty for illegal ads.
What does this market count, and what does it leave out?
The market counts money paid to place paid messages on search engines, social networks, video and display inventory, marketplace and app-based retail media, and influencer or native programs aimed at buyers in the country. Advertisers buy through self-service consoles, agencies, managed platform services and direct publisher deals, and pricing runs on clicks, impressions, actions, sponsored listings and service fees.
The estimate excludes television, print, radio and static outdoor spending, seller vouchers and free-shipping subsidies, marketplace commissions unrelated to placement, and unpaid organic content. The value chain runs from advertisers and agencies through buying platforms and publishers to the audience, and it increasingly ends with an order on the same app.
Vietnam Digital Advertising Retail Media Market Insights
- The market is projected to grow from USD 1.74 billion in 2025 to USD 5.72 billion by 2035, a 12.51% CAGR that reflects commerce budgets joining brand media budgets.
- Ho Chi Minh City and Southeast Corridor held 45.0% of 2025 value, supported by agency concentration, national brand headquarters and the largest share of marketplace buyers in the country.
- Social Media Advertising led solution types with 34.0% of 2025 value because Facebook, TikTok and Zalo each reach most adults in the country.
- Decree 342, effective Feb. 15, 2026, limits forced video waits to five seconds, which pushes planners toward shorter creative and away from long unskippable formats.
- Shopee and TikTok Shop held about 97% of 2025 sales on the four largest marketplaces, which gives both companies strong control over sponsored listing terms.
Social feeds lead while marketplace ads gain fastest
Why do social feeds lead while marketplace listings grow fastest?
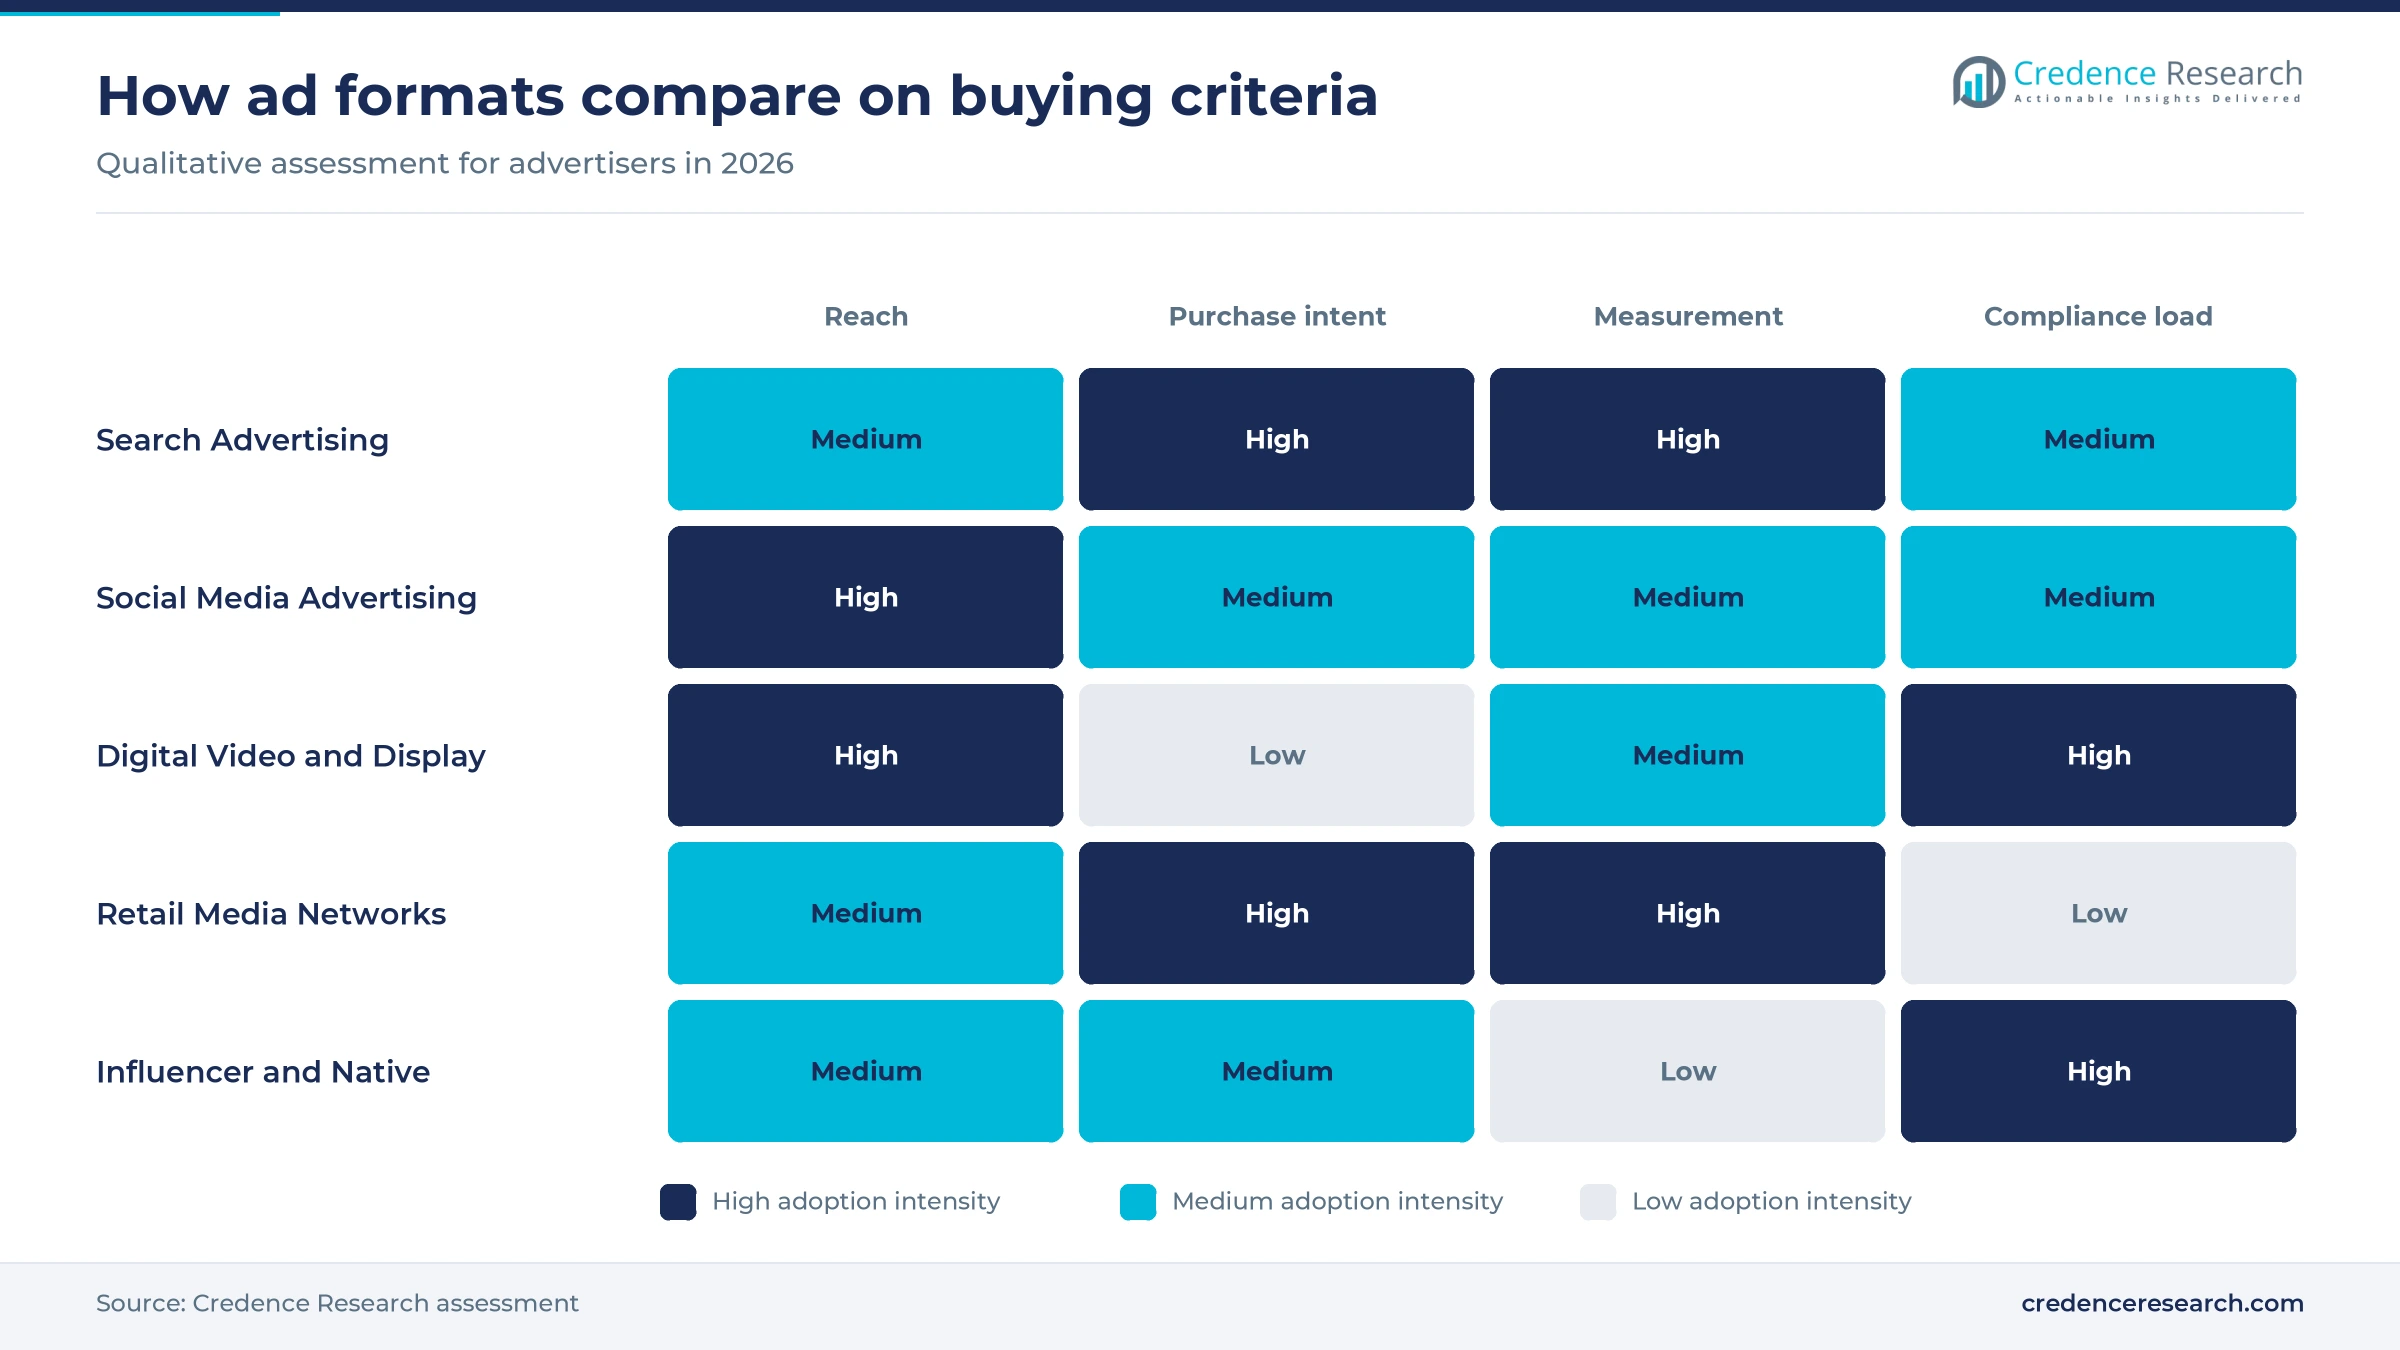
Based on solution type, the market is categorized into search advertising, social media advertising, digital video and display advertising, retail media networks and influencer and native advertising. Social Media Advertising led with 34.0% of 2025 value because DataReportal counted 79.0 million Facebook ad-reach accounts in late 2025, close to the whole online adult audience. Retail Media Networks grow fastest at 14.93% a year as sponsored placement follows marketplace sales, which Vietnam Briefing put at VND291.6 trillion in the first half of 2026. Search remains a steady intent channel, with Decree 342 now requiring sponsored results to be visibly separated from ordinary results.
Which industries pay for the most reach and which are catching up?
Based on end-use industry, the market is categorized into consumer goods and retail, financial services, mobility and travel, technology and telecommunications, and healthcare and education. Consumer Goods and Retail led with 44.0% of 2025 value because Metric recorded VND74.49 trillion of beauty sales and VND56.66 trillion of home and lifestyle sales on marketplaces in 2025. Mobility and Travel grows fastest at 13.72% a year as Viet Nam News reported nearly 14 million foreign arrivals in the first seven months of 2026. Finance brands also buy actively, since e-Conomy SEA 2025 counted 30 million active e-wallet accounts.
How do national brands and newer online sellers buy differently?
Based on customer type, the market is categorized into national brand advertisers, digital-native brands, local merchants and microbusinesses, and government and public-sector buyers. National Brand Advertisers led with 46.0% of 2025 value because VnEconomy reported in January 2026 that Mall stores were 2.12% of sellers yet took 32.6% of Shopee and TikTok Shop revenue. Digital-Native Brands grow fastest at 13.49% a year as Vietnam Investment Review reported TikTok Shop sellers up 96% to 267,000 in the first half of 2025. Microbusinesses buy in small amounts, and Grab says its Ad Manager lets a merchant launch a campaign in about three minutes.
Why are sponsored listings gaining on clicks and impressions?
Based on revenue model, the market is categorized into cost per click, cost per mille, cost per action, sponsored listing and commission, and managed service fee. Cost per Mille led with 36.0% of 2025 value because DataReportal measured 62.1 million YouTube ad-reach accounts and 76.1 million adult TikTok accounts, which are usually sold on impressions. Sponsored Listing and Commission grows fastest at 14.42% a year as The Shiv reported that Shopee proposed a Display Maintenance Program deducting a percentage of seller revenue for advertising, although it later postponed the plan. That proposal shows how closely ad charges now track sales on marketplaces.
| Segment Group | Leading Sub-segment | Share, 2025 | Fastest-growing Sub-segment | CAGR, 2026–2035 |
|---|---|---|---|---|
| By Solution Type | Social Media Advertising | 34.0% | Retail Media Networks | 14.93% |
| By End-Use Industry | Consumer Goods and Retail | 44.0% | Mobility and Travel | 13.72% |
| By Customer Type | National Brand Advertisers | 46.0% | Digital-Native Brands | 13.49% |
| By Revenue Model | Cost per Mille | 36.0% | Sponsored Listing and Commission | 14.42% |
Request a Free Sample
Fill in your details and we'll send you a free sample report.
- Sample data tables & charts
- Research methodology
Audience, marketplaces and video enlarge ad budgets
How does a scaled connected audience lift ad budgets?
A connected audience of unusual size gives advertisers national reach through a handful of apps. DataReportal counted 85.6 million internet users in October 2025, or 84.2% of the population, along with 79.0 million social media identities. The same study put Zalo at 78.3 million monthly users, so a single messaging app now covers about three-quarters of residents. Mobile access deepens that reach, because the Ministry of Science and Technology reported 110.5 million mobile broadband subscriptions in May 2026, with smartphones used on 91.3% of them, according to Viet Nam News. As a result, planners can buy most adults without television, and Social Media Advertising held 34.0% of 2025 value on the strength of that reach.
Why does commerce and retail-media expansion matter so much?
Marketplace growth turns seller budgets into a second advertising pool beside social platforms. Analytics platform Metric put 2025 sales on Shopee, TikTok Shop, Lazada and Tiki at VND429.7 trillion, up 34.75%, with 3.94 billion products sold during the year. Momentum continued in 2026, because Vietnam Briefing reported first-half revenue of VND291.6 trillion, up 44.1%, across 613,800 active online stores. Many of those stores pay for visibility inside crowded listings, and that spending is counted here as Retail Media Networks, which grow at 14.93% a year. These ads sit closest to the purchase, so budgets can be judged on orders. Beauty sellers show the logic clearly, since their category alone generated more marketplace sales than any other in 2025.
How do video, programmatic and AI tools add new revenue?
Video and automated buying raise the value of each hour spent on screens. The e-Conomy SEA 2025 report by Google and Temasek with partners projected online media, which includes advertising, gaming and streaming, at USD 6 billion in 2025, up more than 16%. Network capacity supports heavier formats, because VietNamNet reported in January 2026 that 5G stations had passed 35,000 with coverage near 90%. Programmatic buying and automated creative also find willing users, since the same e-Conomy report found 81% of users engage with AI tools daily. Dai Bieu Nhan Dan reported in April 2026 that more than 42% of Grab partners use its AI Assistant to produce images and banners for their stores.
What brings new categories of advertiser into the market?
Rising household income and foreign arrivals let more companies justify national campaigns each year. The World Bank put GDP per capita at USD 5,066 in 2025 and reclassified the country as upper-middle-income in July 2026, after GDP growth of 8% in 2025. Viet Nam News reported 21.2 million international visitors in 2025, up from 18 million in 2019, which gives airlines and hotels a larger audience to reach at home and abroad. The e-Conomy SEA 2025 report also projected transport and food delivery at USD 5 billion and online travel at USD 4 billion in 2025. In turn, Mobility and Travel grows fastest among industries at 13.72% a year.
Shoppertainment and Mall stores reshape where brands buy
Shift toward shoppertainment on video-first platforms
Budget is moving toward apps where entertainment and checkout share one screen. Metric data show TikTok Shop raising its marketplace share from 29% in 2024 to 41.31% in 2025, while Shopee slipped from about 64% to 56.04%. The e-Conomy SEA 2025 report counted 1.3 billion video commerce transactions and 650,000 sellers, with both measures up 60% year on year. Businesses appear to agree, because the Vietnam E-commerce Association found that 45% rated social networks as highly effective for online sales, against 28% for marketplaces. Live commerce sellers therefore tend to fund creators and sponsored clips together, which blurs the line between media cost and sales cost for many brands.
Rise of Mall stores as the premium ad buyers
Advertising power is concentrating among official brand stores rather than the long tail of small sellers. VnEconomy reported that Mall stores made up 2.12% of sellers on Shopee and TikTok Shop in 2025 yet took 32.6% of revenue, with TikTok Shop Mall revenue up 99.14%. Vietnam Briefing reported Mall revenue up 54% in the first half of 2026, while the number of Mall sellers fell 6%. Active shops also fell 7.43% to about 601,800 in 2025, according to Metric. National brands therefore face fewer but better funded rivals for sponsored slots, and National Brand Advertisers kept 46.0% of 2025 value, as smaller sellers cut back on paid visibility.
Opening for app-based retail media beyond marketplaces
Delivery, payment and messaging apps offer a retail media opening that few brands have tested at scale. Grab says more than 60% of its active users buy something each time they open the app, and GrabAds sells native, rewarded, food-boost and vehicle formats built on in-app behavior rather than cookies. Dai Bieu Nhan Dan reported that over 250 merchant partners attended the Grab Vietnam conference in April 2026, where Lotte Mart and Coca-Cola were honored. Tuoi Tre News reported 79.2 million monthly Zalo users in the third quarter of 2025 and the February 2025 creation of Zalo Platforms for business services. Advertisers that use this first-party purchase data can measure sales without relying on third-party trackers.
Opening for provincial and public-sector buyers
Provincial governments and tourism agencies are becoming measurable digital buyers, though their budgets remain small today. Da Nang ran a campaign with Yandex Ads from May 2026, and SGGP reported more than 1.1 million site interactions and 424,000 page views in the first month. The Vietnam National Authority of Tourism was also tasked in November 2025 with drafting a 2026 promotion plan that intensifies digital promotion. Public bodies already have an owned audience, since Tuoi Tre News reported more than 17,000 official Zalo accounts with over 40 million followers by the end of 2024. Agencies that can report outcomes for such campaigns should win early mandates as provincial budgets start to grow.
Fee pressure, new ad rules and consent limit returns
How far can seller ad budgets stretch as fees climb?
Marketplace fee increases leave sellers less room for paid visibility. VietNamNet reported in March 2026 that platform fees rose at least 10% to 15% in 2025, and that total operating costs can reach 23% to 25% in fashion and technology. Consumption volume fell 8% in the fourth quarter of 2025 as average selling prices rose about 33%. Smaller merchants feel this first and often cut sponsored spending. Brands can respond by shifting to measured campaigns tied to margin rather than gross sales.
What do the new advertising rules add to operating cost?
Compliance work has grown for every party in the buying chain. Decree 342, issued Dec. 26, 2025, requires illegal ads to be removed within 24 hours of an official request, records to be kept for three years and annual reports to be filed by Nov. 25. Campaigns run through influencer marketing platforms face separate duties under the amended law, which took effect Jan. 1, 2026. Agencies and foreign sellers carry most of this burden, and those that build review steps into workflows should see fewer takedowns.
How does tighter consent affect audience targeting?
Data rules narrow the audience signals that advertisers can use freely. Tilleke & Gibbins notes that the Personal Data Protection Law and Decree 356 took effect Jan. 1, 2026, and that the decree prohibits default consent and ambiguous instructions. Tuoi Tre News reported in December 2025 that Zalo drew criticism for all-or-nothing terms, with accounts deleted after 45 days without acceptance. Buyers relying on shared lists are most exposed, so contextual placement and consented first-party data should become the safer planning base.
Why does platform concentration weaken buyer leverage?
A small group of global platforms controls most of the inventory that advertisers need. Viet Nam News reported in July 2026 that tax authorities attribute about 90% of cross-border digital services revenue to Google, Meta, Microsoft, TikTok, Netflix and Apple. Shopee and TikTok Shop also took about 97% of 2025 marketplace sales. Local publishers lose scale in this structure, and advertisers have limited room to negotiate rates. Testing app-based inventory and direct publisher deals can reduce that dependence over time.
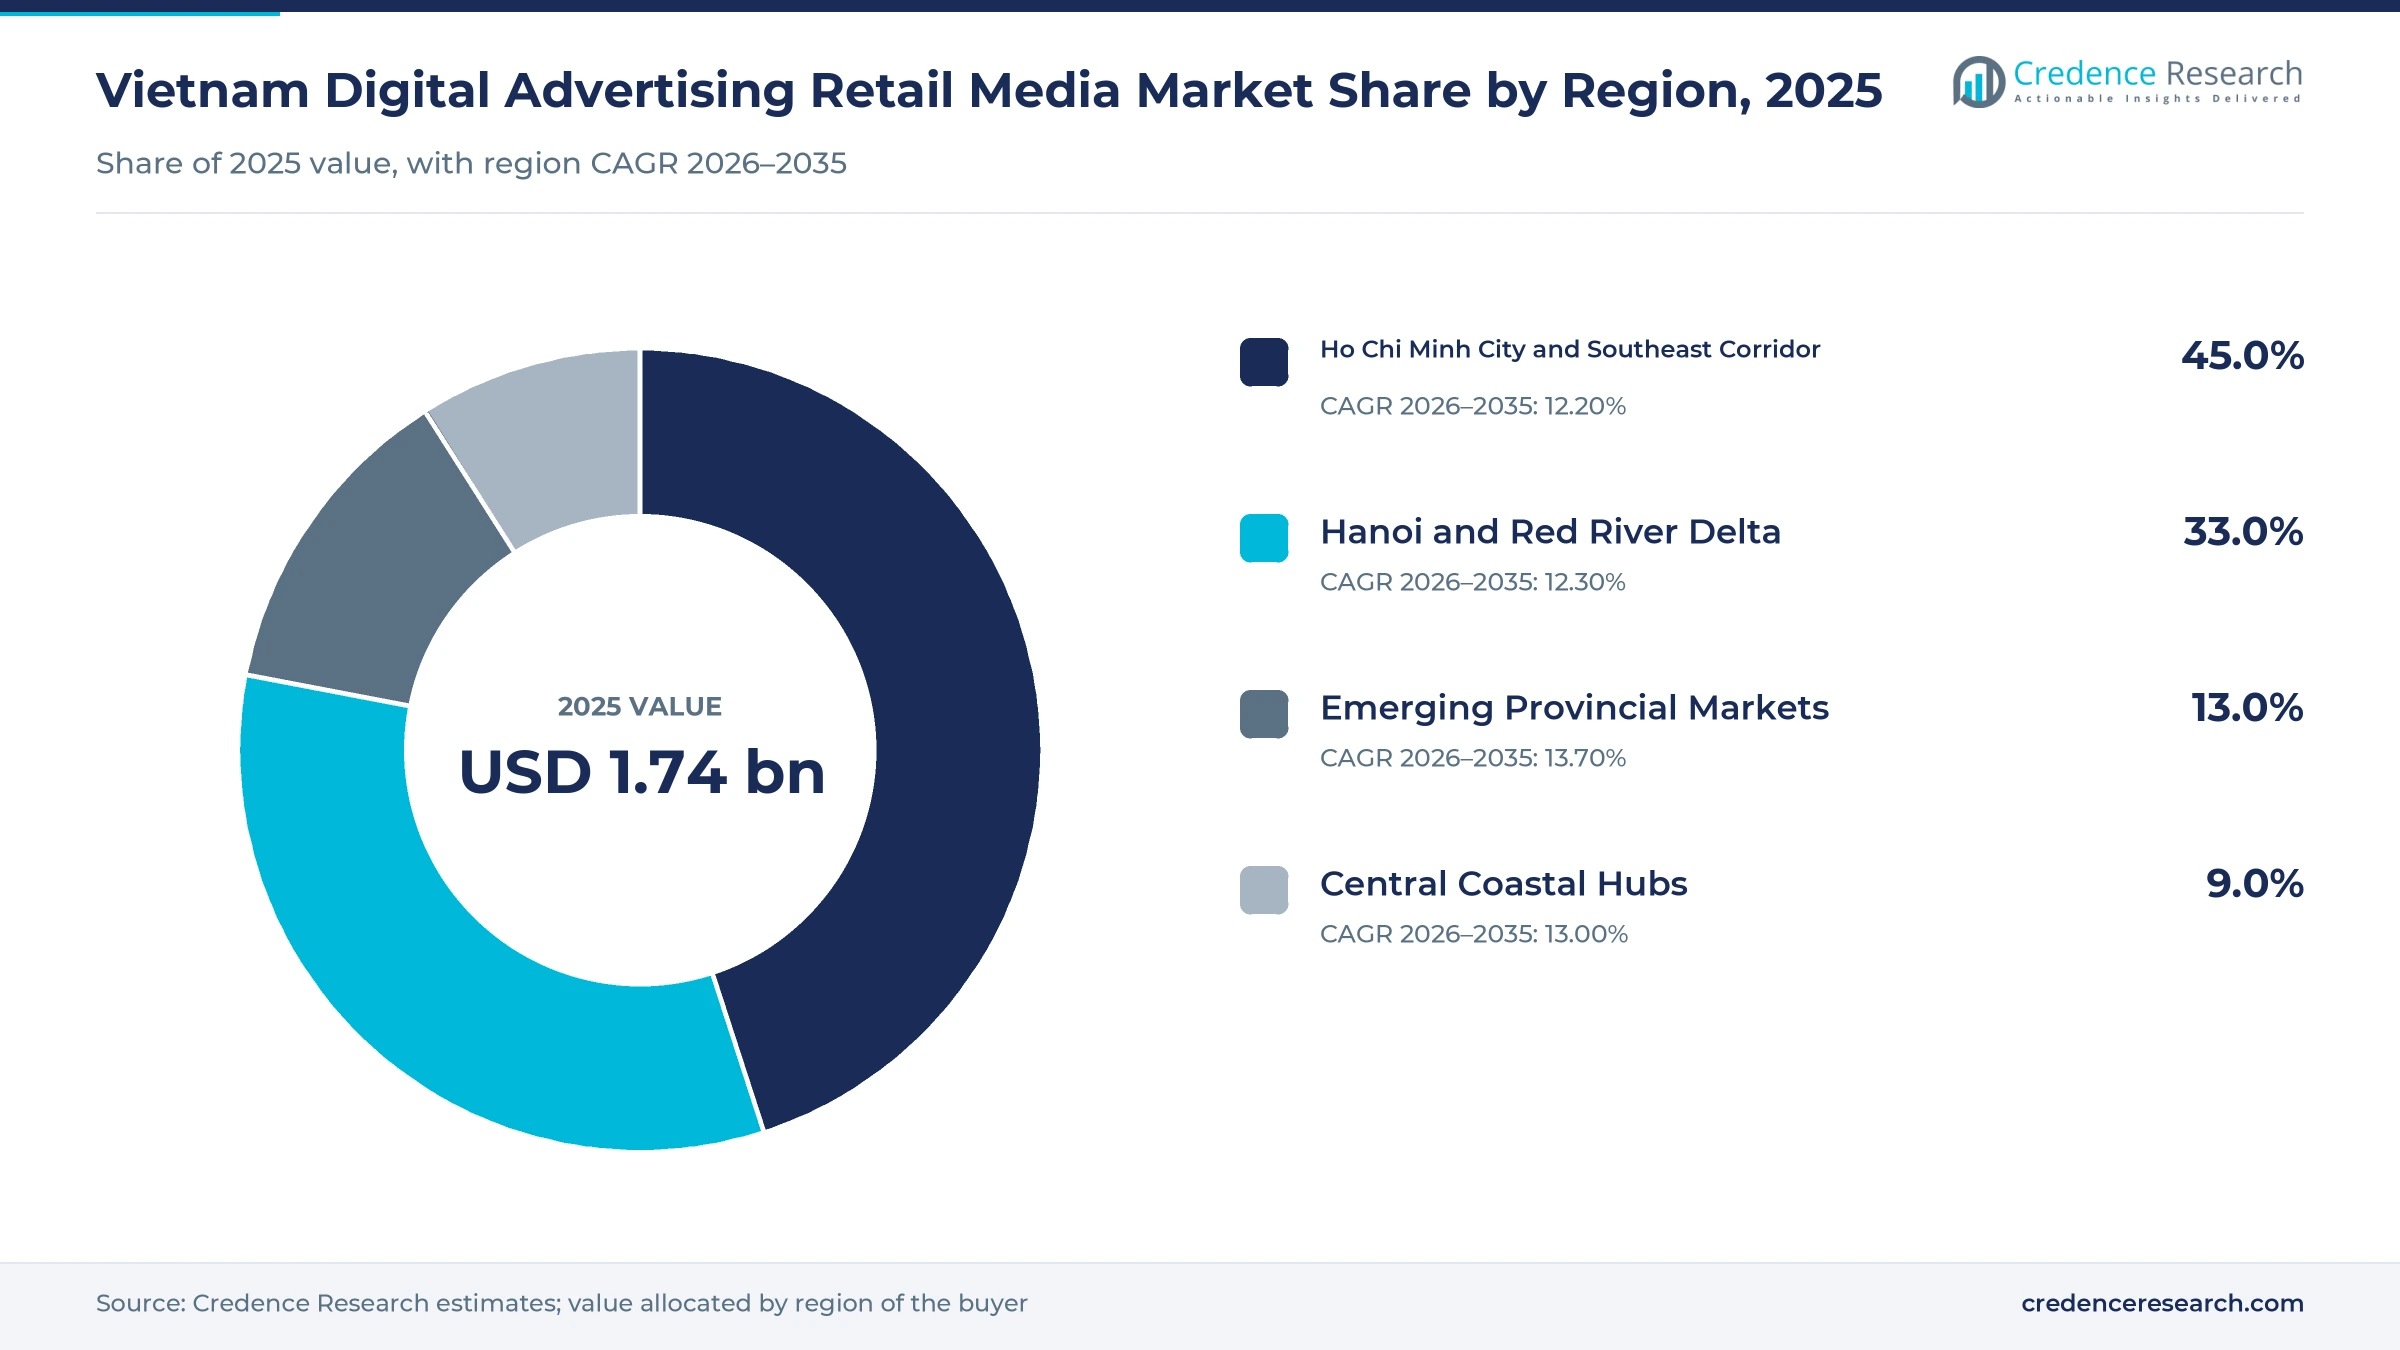
Two metro clusters hold most ad spending in 2025
| Region | Value, 2025 (USD billion) | Share, 2025 | CAGR, 2026–2035 |
|---|---|---|---|
| Ho Chi Minh City and Southeast Corridor | 0.79 | 45.0% | 12.20% |
| Hanoi and Red River Delta | 0.58 | 33.0% | 12.30% |
| Emerging Provincial Markets | 0.23 | 13.0% | 13.70% |
| Central Coastal Hubs | 0.16 | 9.0% | 13.00% |
Agency and marketplace weight in the southern hub
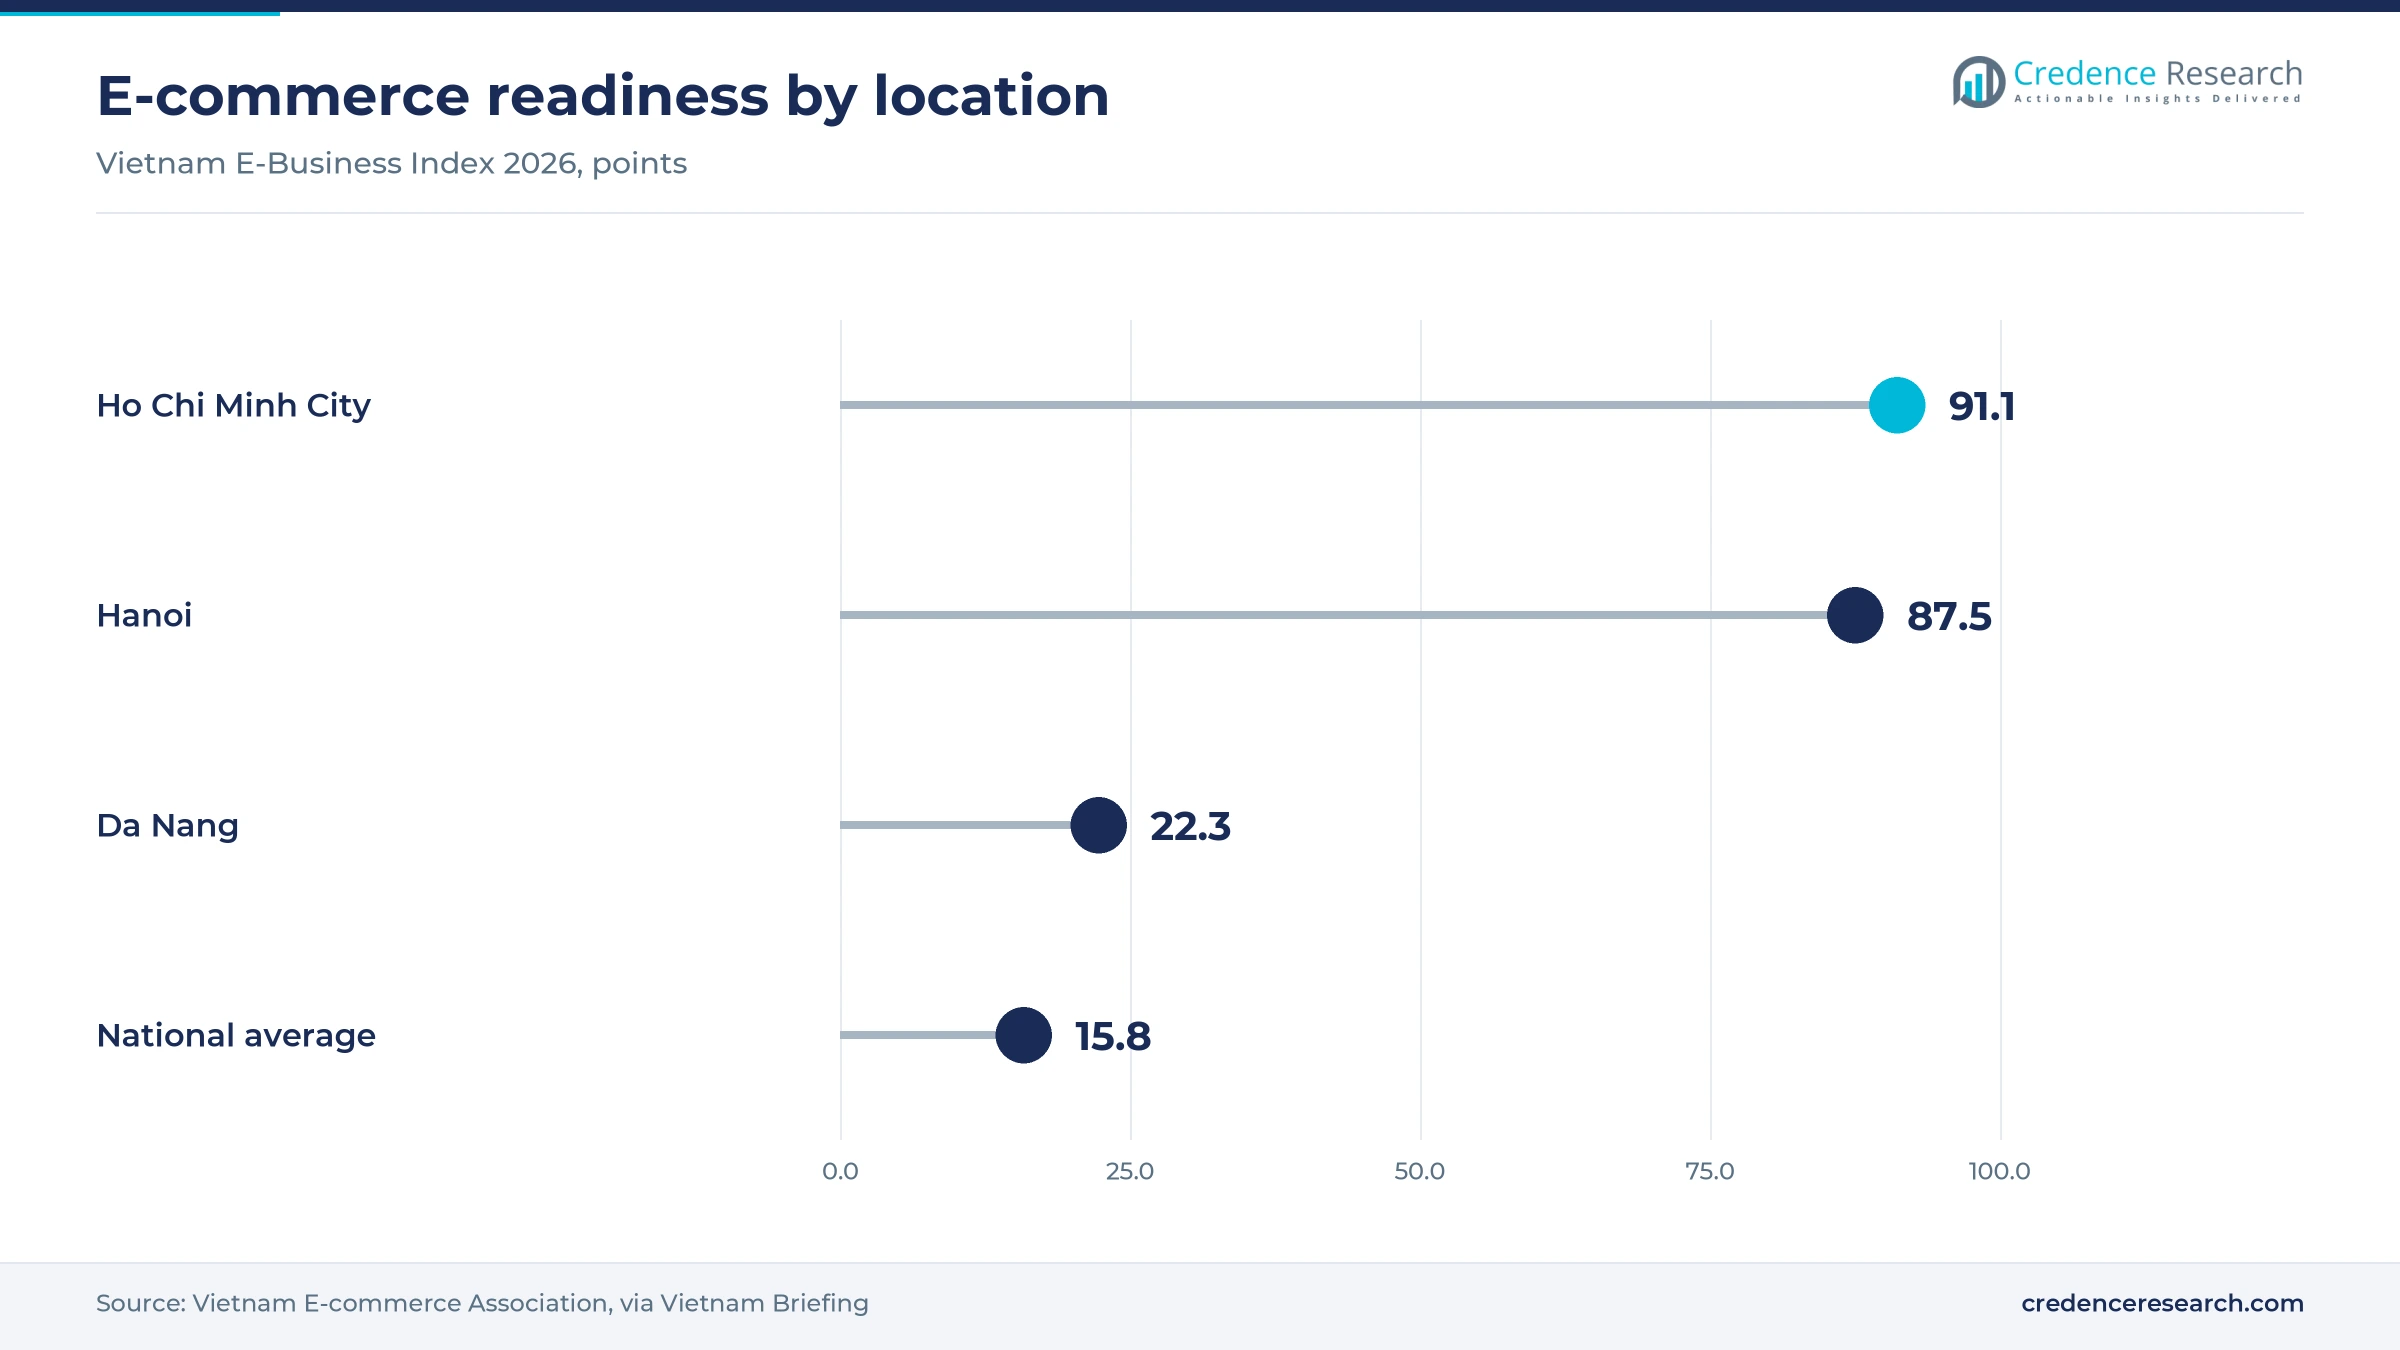
Ho Chi Minh City and Southeast Corridor held a 45.0% regional share of 2025 value and grows at 12.20% a year. The city ranked first in the Vietnam E-Business Index 2026 with 91.1 points, against a national average of 15.8. Metric attributed about 42% of Shopee sales in 2025 to the city, while Binh Duong sales rose 122.1% to VND3.81 trillion. Agency headquarters and consumer brand marketing teams also cluster here, which keeps both planning and buying close together.
Capital-region budgets and spillover provinces in the north
Hanoi and Red River Delta held a 33.0% regional share of 2025 value and grows at 12.30% a year. Hanoi scored 87.5 in the Vietnam E-Business Index 2026, close behind Ho Chi Minh City, and Metric attributed about 41% of Shopee sales in 2025 to the capital. Ministries, state banks and telecom operators based here add public-sector and institutional budgets to the consumer mix. Hung Yen sales rose 39.41% in 2025, which suggests buyers are spreading into neighboring provinces.
Tourism spending along the central coast
Central Coastal Hubs held a 9.0% regional share of 2025 value and grows at 13.00% a year, led by Da Nang and its tourism economy. Da Nang ranked third in the Vietnam E-Business Index 2026 at 22.3 points, far behind the two largest cities. Travel advertising lifts the region above that readiness score, since SGGP reported more than 180,000 Russian and CIS visitors to Da Nang from January through May 2026. Hotels and airlines therefore buy reach outside the country as well as inside it.
Small provincial bases gaining from wider network coverage
Emerging Provincial Markets held 13.0% of 2025 value and are the fastest-growing region at 13.70% a year. Their base is small, because the national E-Business Index average of 15.8 sits well below the leading cities. Growth comes from wider network coverage and marketplace reach, with Long An sales up 63.41% in 2025 according to Metric. VietNamNet reported that the Department of Telecommunications targets 99% population 5G coverage in 2026, which should support video formats in smaller towns over the forecast.
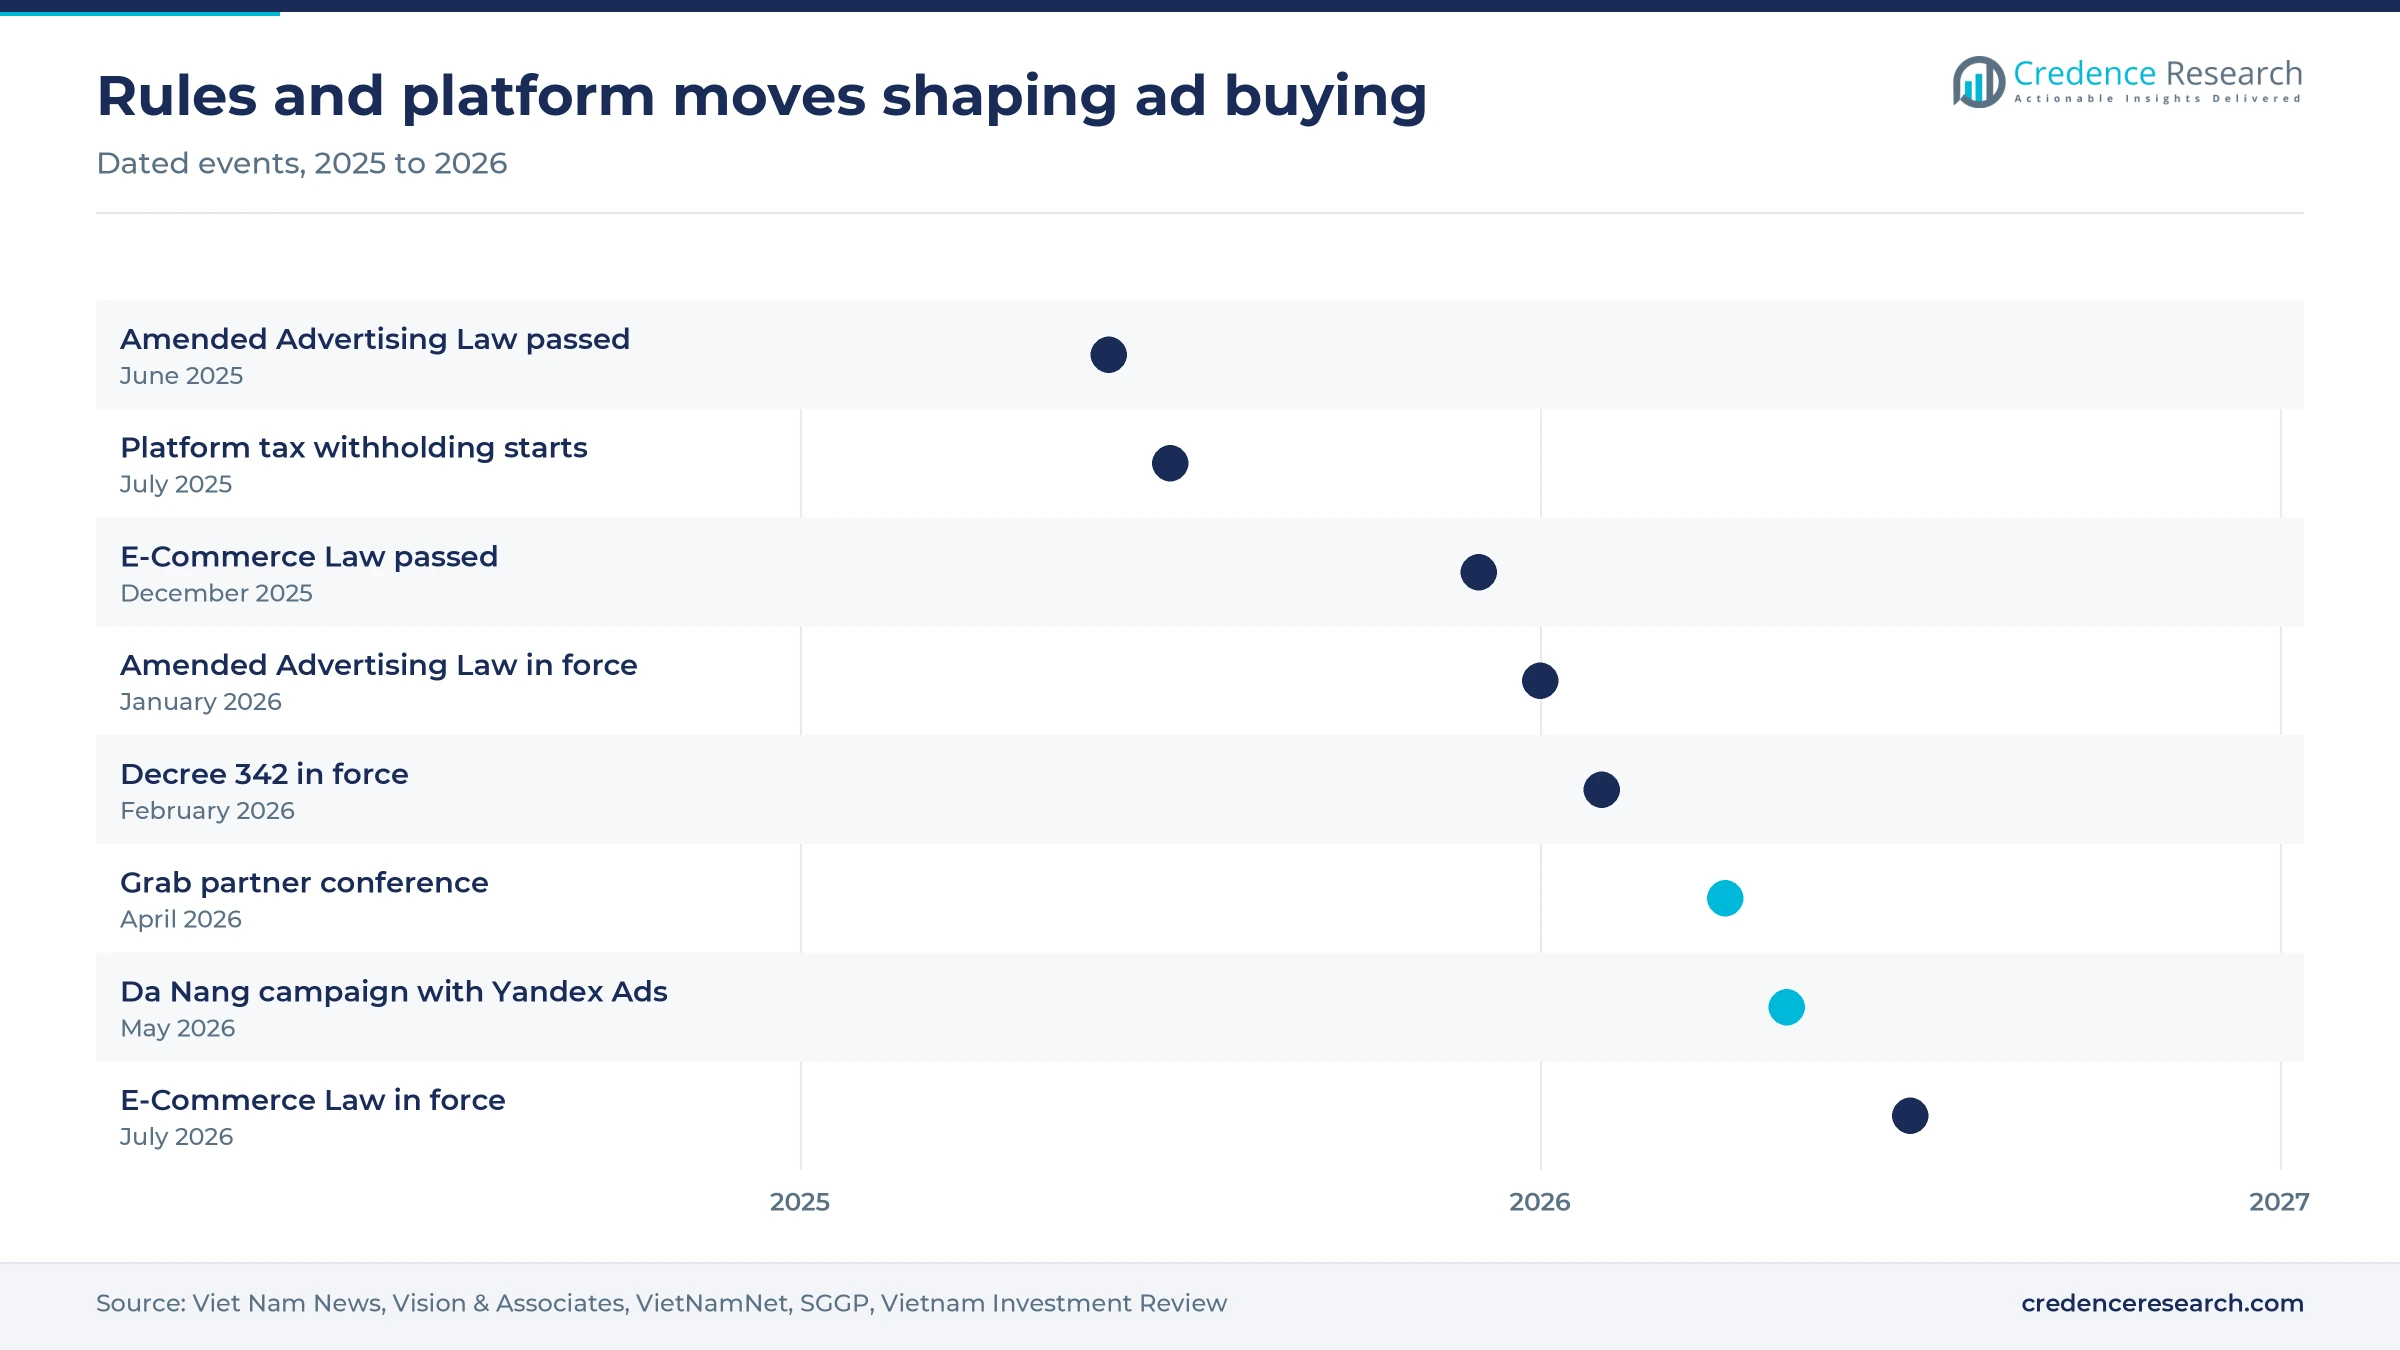
Laws and platform moves that changed buying since 2025
| Development | Status and market relevance |
|---|---|
| In June 2025, the National Assembly passed the amended Law on Advertising with 453 of 461 deputies present voting in favor, effective Jan. 1, 2026. | In force; influencers must label paid content and verify advertisers |
| In December 2025, lawmakers passed the new E-Commerce Law, effective July 1, 2026, with livestream sellers required to verify identity with platforms. | In force; ties seller identification to VNeID |
| In February 2026, Decree 342/2025/ND-CP took effect, capping forced video ad waits at five seconds and banning waits on static image ads. | In force; reshapes video creative and buying |
| In May 2026, Da Nang launched a digital tourism campaign with Yandex Ads aimed at Russian-speaking travelers. | First month produced over 1.1 million site interactions |
| In July 2026, Viet Nam News reported that 259 overseas suppliers had registered on the foreign supplier tax portal, up from 176 in September 2025. | Tax paid reached VND12.5 trillion in the first half of 2026 |
First-party data and AI tools change campaign delivery
- First-party commerce signals let Grab and marketplaces target on in-app behavior, which also reduces exposure to the consent limits in Decree 356.
- Generative creative tools now help small merchants produce banners and images, and Grab reported that more than 42% of partners use its AI Assistant.
- Shorter video formats have become the default planning unit since Decree 342 limited forced video waits to five seconds in February 2026.
- National identity checks through VNeID now support seller verification under the E-Commerce Law, which should make sponsored listings easier to audit.
Need a Custom Version of This Report?
Tailor the scope, geography, or segments to your exact requirements.
- Custom geography or segment scope
- Direct access to our analyst team
Global platforms set terms as local publishers specialize
Competition splits into global reach platforms, commerce platforms and domestic publishers. Google and Meta Platforms sell search, YouTube and social inventory, and tax authorities name both among the largest cross-border digital suppliers. ByteDance / TikTok competes on both sides of the funnel, because the same app sells attention and completes orders, while Sea Limited / Shopee Ads monetizes the largest marketplace through seller promotion. Alibaba Group / Lazada and Tiki Corporation hold far smaller positions, with Lazada at about 3% of third-quarter 2025 sales according to Vietnam Investment Review. Grab Holdings / GrabAds adds self-service and vehicle formats tied to food and transport use. Coc Coc holds 4.62% of browser use in October 2026 according to Statcounter, which gives it a local search and browser audience. FPT Online pairs VnExpress with events such as its 100,000-participant marathon series, and it offers marketing and advertising solutions to businesses.
Companies profiled and their roles in this market
| Company | Type | Role in the market |
|---|---|---|
| Global platform | Search and YouTube inventory; named by tax authorities among the largest cross-border suppliers | |
| Meta Platforms | Global platform | Facebook, Messenger and Instagram ad inventory with wide adult reach |
| ByteDance / TikTok | Commerce and video platform | Short video ads, sponsored labels and TikTok Shop at 41.31% of 2025 marketplace sales |
| Sea Limited / Shopee Ads | Marketplace | Seller promotion on the largest marketplace, at 56.04% of 2025 sales |
| Alibaba Group / Lazada | Marketplace | Smaller marketplace at about 3% of sales in the third quarter of 2025 |
| Grab Holdings / GrabAds | Super app | Self-service Ad Manager, native, rewarded and vehicle formats |
| Tiki Corporation | Marketplace | Domestic marketplace among the four platforms tracked by Metric in 2025, holding a small share of sales |
| Coc Coc | Local browser | Vietnamese browser with 4.62% browser share in October 2026 |
| FPT Online | Domestic publisher | VnExpress content, events and sponsorship packages for brands |
Commerce-linked formats should outgrow pure reach buying
Credence Research's view is that commerce-linked formats will take share from pure reach buying through 2035, since an advertiser can tie those formats to orders on the same app. Social media remains the largest line because the audience is already near saturation and cheap to reach. Growth, however, depends on seller margins, and marketplace fee increases in 2025 have shown how quickly small sellers can leave. Brands should build measurement around profit per order, keep direct publisher relationships for brand safety and treat compliance review as a standard media cost.
How the estimates were built from public sources
The report uses 2025 as the base year and 2026 through 2035 as the forecast period. Market values come from the Credence Research model, and segment and regional splits are Credence Research estimates informed by public data. Inputs include DataReportal audience counts, World Bank income data, Ministry of Science and Technology network statistics, General Department of Taxation collections, Vietnam E-commerce Association index scores, Metric marketplace data and published legal texts. No interviews or surveys were conducted for this edition of the report.
Marketplace ads and provincial demand shape the next decade
The market is expected to reach USD 5.72 billion by 2035, with marketplace and app-based formats gaining most. Regulation should stay active, since the Advertising Law, E-Commerce Law and data protection rules all began operating during 2026 and enforcement practice is still forming. Provincial demand should rise as network coverage improves and online shopping spreads beyond the two largest metro areas. The principal risks are sustained fee pressure on sellers and further platform concentration, and either one could slow growth among smaller advertisers before larger brands fill the gap.
Frequently Asked Questions
How big is the Vietnam digital advertising retail media market?
Which solution type leads the market?
Which solution type is growing fastest?
Which region holds the largest share?
Which region is growing fastest?
What did Decree 342 change for video buyers?
How do the new influencer rules affect campaigns?
Who are the major companies in this market?
Table of Content
Chapter 1 Market Segmentation
- 1.1 Segmentation Framework
- 1.1.1 Product and Service Classification
- 1.1.2 Application and End-Use Classification
- 1.1.3 Technology and Solution Classification
- 1.1.4 Customer and Distribution Channel Classification
- 1.1.5 Geographic Segmentation
- 1.1.6 Market Segment Definitions and Boundaries
- 1.2 By Solution Type
- 1.2.1 Search Advertising
- 1.2.2 Social Media Advertising
- 1.2.3 Digital Video and Display Advertising
- 1.2.4 Retail Media Networks
- 1.2.5 Influencer and Native Advertising
- 1.3 By End-Use Industry
- 1.3.1 Consumer Goods and Retail
- 1.3.2 Financial Services
- 1.3.3 Mobility and Travel
- 1.3.4 Technology and Telecommunications
- 1.3.5 Healthcare and Education
- 1.4 By Customer Type
- 1.4.1 National Brand Advertisers
- 1.4.2 Digital-Native Brands
- 1.4.3 Local Merchants and Microbusinesses
- 1.4.4 Government and Public-Sector Buyers
- 1.5 By Revenue Model
- 1.5.1 Cost per Click
- 1.5.2 Cost per Mille
- 1.5.3 Cost per Action
- 1.5.4 Sponsored Listing and Commission
- 1.5.5 Managed Service Fee
Chapter 2 Introduction
- 2.1 Report Objectives and Scope
- 2.2 Product Definition and Industry Terminology
- 2.3 Market Inclusions and Exclusions
- 2.4 Research Process
- 2.4.1 Primary Research and Expert Interviews
- 2.4.2 Secondary Research and Source Review
- 2.4.3 Top-Down and Bottom-Up Estimation
- 2.4.4 Data Triangulation and Verification
- 2.5 Market Size Measurement Basis
- 2.5.1 2025: USD 1.74 billion → 2035: USD 5.72 billion
- 2.6 Historical and Forecast Reference Periods
- 2.6.1 Historical Period: 2018-2025
- 2.6.2 Base Year: 2025
- 2.6.3 Forecast Period: 2025-2035
- 2.7 Research Assumptions and Limitations
Chapter 3 Executive Summary
- 3.1 Market Snapshot and Key Findings
- 3.2 Base-Year Market Size, 2025
- 3.3 Forecast Market Size, 2035
- 3.4 Revenue and Volume Growth Outlook
- 3.5 Key Demand and Supply Indicators
- 3.6 Leading Market Segments
- 3.7 Fastest-Growing Market Opportunities
- 3.8 Regional Performance Highlights
- 3.9 Technology and Industry Transformation
- 3.10 Competitive Landscape Summary
- 3.11 Analyst View and Strategic Implications
Chapter 4 Vietnam Digital Advertising Retail Media Market Trends and Developments
- 4.1 Historical Industry Development, 2018-2025
- 4.2 Recent Market Trends and Developments
- 4.3 Demand and Customer Behavior Trends
- 4.4 Technology and Product Innovation
- 4.5 Artificial Intelligence, Automation and Digitalization
- 4.6 Local Manufacturing and Supply Chain Realignment
- 4.7 Industry Partnerships, Mergers and Acquisitions
- 4.8 Sustainability and Circular Economy Developments
- 4.9 Government and Private Sector Investment Trends
- 4.10 Emerging Business Models and Commercialization
- 4.11 Industry Developments and Announcements
Chapter 5 Vietnam Digital Advertising Retail Media Market Production, Supply and Demand Analysis
- 5.1 Demand Trend and Consumption Analysis, 2018-2025
- 5.2 Demand Forecast, 2025-2035
- 5.3 Production and Output Trend, 2018-2025
- 5.4 Production and Output Forecast, 2025-2035
- 5.5 Installed Capacity and Capacity Utilization
- 5.6 Company-Wise Production Plants and Statistics
- 5.6.1 Installed Production Capacity
- 5.6.2 Actual Production
- 5.6.3 Planned Capacity and Expansion Targets
- 5.7 Supply Chain Structure and Procurement Trends
- 5.8 Supply-Demand Gap and Bottlenecks
- 5.9 Import Dependence and Sourcing Structure
- 5.10 Contract Manufacturing and Outsourcing
- 5.11 Regional Supply and Demand Concentration
Chapter 6 Vietnam Digital Advertising Retail Media Market Pricing Analysis
- 6.1 Pricing Structure and Measurement
- 6.2 Historical Pricing Trends, 2018-2025
- 6.3 Pricing Outlook, 2025-2035
- 6.4 Average Selling Price and Unit Economics
- 6.5 Pricing by Product and Market Segment
- 6.6 Geographic Pricing Differences
- 6.7 Key Input, Energy, Labor and Logistics Costs
- 6.8 Contract Pricing and Purchasing Models
- 6.9 Pricing Sensitivity and Competitive Positioning
- 6.10 Price, Margin and Profitability Implications
Chapter 7 Vietnam Digital Advertising Retail Media Market Dynamics
- 7.1 Market Growth Drivers
- 7.1.1 Demand-Side Drivers
- 7.1.2 Technology and Innovation Drivers
- 7.1.3 Infrastructure and Investment Drivers
- 7.1.4 Regulatory and Policy Drivers
- 7.2 Market Restraints
- 7.2.1 Cost and Affordability Constraints
- 7.2.2 Technology and Adoption Barriers
- 7.2.3 Supply Chain and Operational Constraints
- 7.3 Market Challenges
- 7.3.1 Competitive Pressure and Margin Erosion
- 7.3.2 Skills, Infrastructure and Implementation Gaps
- 7.4 Emerging Market Opportunities
- 7.5 Market Dynamics Impact and Time-Horizon Assessment
Chapter 8 Vietnam Digital Advertising Retail Media Value Chain Analysis
- 8.1 Industry Value Chain Overview
- 8.2 Upstream Suppliers and Critical Inputs
- 8.3 Technology and Component Providers
- 8.4 Manufacturing or Service Delivery
- 8.5 Distribution, Channel Partners and Integrators
- 8.6 Downstream Applications and End Users
- 8.7 Value Addition and Profit Pools
- 8.8 Vertical Integration and Outsourcing
- 8.9 Supplier Concentration and Risk
- 8.10 Supply Chain Localization and Resilience
Chapter 9 Vietnam Digital Advertising Retail Media Market Regulations and Policies
- 9.1 Relevant Laws, Standards and Compliance Frameworks
- 9.2 Product, Service, Safety and Quality Requirements
- 9.3 Government Policies, Incentives and Subsidies
- 9.4 Imports, Exports and Trade Barriers
- 9.5 Public Procurement and Local Content Requirements
- 9.6 Environmental and Sustainability Compliance
- 9.7 Data Protection, AI and Cybersecurity Compliance
- 9.8 Upcoming Policy Changes and Market Implications
Chapter 10 Vietnam Digital Advertising Retail Media Market Hotspots and Opportunities
- 10.1 Market Opportunity Mapping and Growth Hotspots
- 10.2 High-Growth Applications and Customer Groups
- 10.3 Underserved Markets and White-Space Opportunities
- 10.4 Emerging Technology and Product Opportunities
- 10.5 New Capacity and Investment Hotspots
- 10.6 Market Entry and Expansion Opportunities
- 10.7 Distribution and Partnership Opportunities
- 10.8 Near-Term and Long-Term Commercial Potential
- 10.9 Opportunity Attractiveness and Execution Risks
Chapter 11 Vietnam Digital Advertising Retail Media Market Outlook, 2025-2035
- 11.1 Market Size and Analysis
- 11.1.1 Revenue (Market Measurement: 2025: USD 1.74 billion → 2035: USD 5.72 billion)
- 11.1.2 Market Volume and Quantity Sold
- 11.1.3 Historical Market Size, 2018-2025
- 11.1.4 Base-Year Market Size, 2025
- 11.2 Market Forecast, 2025-2035
- 11.2.1 Revenue Forecast to 2035
- 11.2.2 Volume Forecast to 2035
- 11.2.3 CAGR and Year-on-Year Growth
- 11.2.4 Incremental Revenue Opportunity
- 11.3 Forecast Assumptions and Scenario Analysis
- 11.3.1 Base-Case Forecast
- 11.3.2 Optimistic and Conservative Scenarios
- 11.3.3 Technology, Pricing and Policy Sensitivities
- 11.4 Market Attractiveness and Growth Outlook
Chapter 12 Vietnam Digital Advertising Retail Media Market Segmentation and Outlook
- 12.1 Segmentation Summary and Market Shares, 2025
- 12.2 Largest and Fastest-Growing Segments
- 12.3 By Solution Type - Market Size and Forecast, 2025-2035
- 12.3.1 Segment Definition and Scope
- 12.3.2 Historical Market Size, 2018-2025
- 12.3.3 Revenue Forecast, 2025-2035
- 12.3.4 Volume Forecast, 2025-2035
- 12.3.5 Base-Year Market Share, 2025
- 12.3.6 Segment CAGR and Growth Drivers
- 12.3.7 Subsegment Market Size and Forecast
- 12.3.7.1 Search Advertising
- 12.3.7.2 Social Media Advertising
- 12.3.7.3 Digital Video and Display Advertising
- 12.3.7.4 Retail Media Networks
- 12.3.7.5 Influencer and Native Advertising
- 12.3.8 Subsegment Pricing and Adoption Trends
- 12.3.9 Leading Suppliers and Competition
- 12.3.10 Regional Demand and Opportunities
- 12.4 By End-Use Industry - Market Size and Forecast, 2025-2035
- 12.4.1 Segment Definition and Scope
- 12.4.2 Historical Market Size, 2018-2025
- 12.4.3 Revenue Forecast, 2025-2035
- 12.4.4 Volume Forecast, 2025-2035
- 12.4.5 Base-Year Market Share, 2025
- 12.4.6 Segment CAGR and Growth Drivers
- 12.4.7 Subsegment Market Size and Forecast
- 12.4.7.1 Consumer Goods and Retail
- 12.4.7.2 Financial Services
- 12.4.7.3 Mobility and Travel
- 12.4.7.4 Technology and Telecommunications
- 12.4.7.5 Healthcare and Education
- 12.4.8 Subsegment Pricing and Adoption Trends
- 12.4.9 Leading Suppliers and Competition
- 12.4.10 Regional Demand and Opportunities
- 12.5 By Customer Type - Market Size and Forecast, 2025-2035
- 12.5.1 Segment Definition and Scope
- 12.5.2 Historical Market Size, 2018-2025
- 12.5.3 Revenue Forecast, 2025-2035
- 12.5.4 Volume Forecast, 2025-2035
- 12.5.5 Base-Year Market Share, 2025
- 12.5.6 Segment CAGR and Growth Drivers
- 12.5.7 Subsegment Market Size and Forecast
- 12.5.7.1 National Brand Advertisers
- 12.5.7.2 Digital-Native Brands
- 12.5.7.3 Local Merchants and Microbusinesses
- 12.5.7.4 Government and Public-Sector Buyers
- 12.5.8 Subsegment Pricing and Adoption Trends
- 12.5.9 Leading Suppliers and Competition
- 12.5.10 Regional Demand and Opportunities
- 12.6 By Revenue Model - Market Size and Forecast, 2025-2035
- 12.6.1 Segment Definition and Scope
- 12.6.2 Historical Market Size, 2018-2025
- 12.6.3 Revenue Forecast, 2025-2035
- 12.6.4 Volume Forecast, 2025-2035
- 12.6.5 Base-Year Market Share, 2025
- 12.6.6 Segment CAGR and Growth Drivers
- 12.6.7 Subsegment Market Size and Forecast
- 12.6.7.1 Cost per Click
- 12.6.7.2 Cost per Mille
- 12.6.7.3 Cost per Action
- 12.6.7.4 Sponsored Listing and Commission
- 12.6.7.5 Managed Service Fee
- 12.6.8 Subsegment Pricing and Adoption Trends
- 12.6.9 Leading Suppliers and Competition
- 12.6.10 Regional Demand and Opportunities
- 12.7 Segment Growth Comparison
- 12.8 Segment Attractiveness and Priority Matrix
Chapter 13 Vietnam Digital Advertising Retail Media End-Use and Application Market Outlook
- 13.1 End-Use Industry and Customer Demand Structure
- 13.2 Leading Applications and Customer Groups
- 13.3 End-Use Market Size, Share and Forecast
- 13.4 Major End-Use Industry Deep Dives
- 13.4.1 Customer Requirements and Use Cases
- 13.4.2 Demand and Replacement Cycles
- 13.4.3 Technical and Regulatory Considerations
- 13.4.4 Purchasing and Procurement Models
- 13.4.5 Leading Vendors and Distribution Channels
- 13.4.6 Forecast and Commercial Opportunities
- 13.5 Emerging Applications and Cross-Segment Demand
- 13.6 End-Use Industry Investment Priorities
Chapter 14 Vietnam Digital Advertising Retail Media Geographic Market Outlook, 2025-2035
- 14.1 Domestic Market Distribution and Demand Clusters
- 14.2 State- or Province-Wise Market Size and Forecast, 2025-2035
- 14.3 City and Metropolitan Market Outlook
- 14.4 Industrial, Manufacturing and Commercial Clusters
- 14.5 Geographic Concentration of Key End Users
- 14.6 Local Pricing and Purchasing Differences
- 14.7 Domestic Production Facilities and Capacity Map
- 14.8 Local Infrastructure and Project Pipeline
- 14.9 State-Level Policy and Incentive Differences
- 14.10 Subnational Investment Hotspots and Opportunities
- 14.11 Distribution and Logistics Networks
- 14.12 Domestic Competitive Footprint
Chapter 15 Vietnam Digital Advertising Retail Media Technology, Innovation and Sustainability Outlook
- 15.1 Technology Landscape and Maturity
- 15.2 Product, Process and Service Innovation
- 15.3 AI, Automation and Digital Tools in the Industry
- 15.4 Technology Adoption and Performance Benchmarking
- 15.5 Innovation Pipeline and R&D Investment
- 15.6 Patent and Intellectual Property Trends
- 15.7 Energy Efficiency and Resource Management
- 15.8 Sustainability, Recycling and Circularity
- 15.9 Technology Roadmap, 2025-2035
- 15.10 Risks of Obsolescence and Technology Substitution
Chapter 16 Vietnam Digital Advertising Retail Media Market Key Strategic Imperatives
- 16.1 Growth and Market Entry Priorities
- 16.2 High-Return Products and Segments
- 16.3 Pricing, Profitability and Cost Optimization
- 16.4 Technology Investment and Product Differentiation
- 16.5 Supply Chain Localization and Resilience
- 16.6 Distribution and Customer Acquisition
- 16.7 Partnership, Acquisition and Capacity Strategy
- 16.8 Regional Expansion Priorities
- 16.9 Short-, Medium- and Long-Term Actions
Chapter 17 Competition Outlook
- 17.1 Industry Competition Characteristics
- 17.2 Market Structure and Concentration
- 17.3 Market Share and Competitive Positioning, 2025
- 17.4 Company-Wise Revenue and Product Benchmarking
- 17.5 Production and Service Capacity Benchmarking
- 17.6 Technology, Pricing and Differentiation
- 17.7 Regional Footprint and Distribution Strength
- 17.8 Mergers, Acquisitions and Strategic Alliances
- 17.9 New Entrants and Competitive Threats
- 17.10 Porter's Five Forces and Industry Attractiveness
- 17.11 Competitive Outlook, 2025-2035
Chapter 18 Company Profiles
- 18.1 Company Coverage and Selection Criteria
- 18.2 Google
- 18.2.1 Business Description
- 18.2.2 Company Ownership and Geographic Presence
- 18.2.3 Product and Service Portfolio
- 18.2.4 Manufacturing and Operating Footprint
- 18.2.5 Production Capacity and Expansion Plans
- 18.2.6 Financial Performance and Investment
- 18.2.7 Market Share and Competitive Position
- 18.2.8 Technology and Innovation Capabilities
- 18.2.9 Strategic Alliances or Partnerships
- 18.2.10 Recent Developments
- 18.2.11 Growth Strategy and Outlook
- 18.3 Meta Platforms
- 18.4 ByteDance / TikTok
- 18.5 Sea Limited / Shopee Ads
- 18.6 Alibaba Group / Lazada Sponsored Solutions
- 18.7 Coc Coc
- 18.8 Grab Holdings / GrabAds
- 18.9 FPT Online
- 18.10 Tiki Corporation
- 18.11 Other Relevant Market Participants
Note: Every listed company is profiled on the structure shown under the first company. The company list is preliminary and may change based on research findings, market developments, data availability and client requirements.
Chapter 19 Disclaimer
- 19.1 Research and Forecast Disclaimer
- 19.2 Data Source and Estimation Limitations
Note: The depth of individual sections depends on data availability for this market. Volume, capacity, trade and other unit-based metrics are included where applicable.

