
Market Overview:
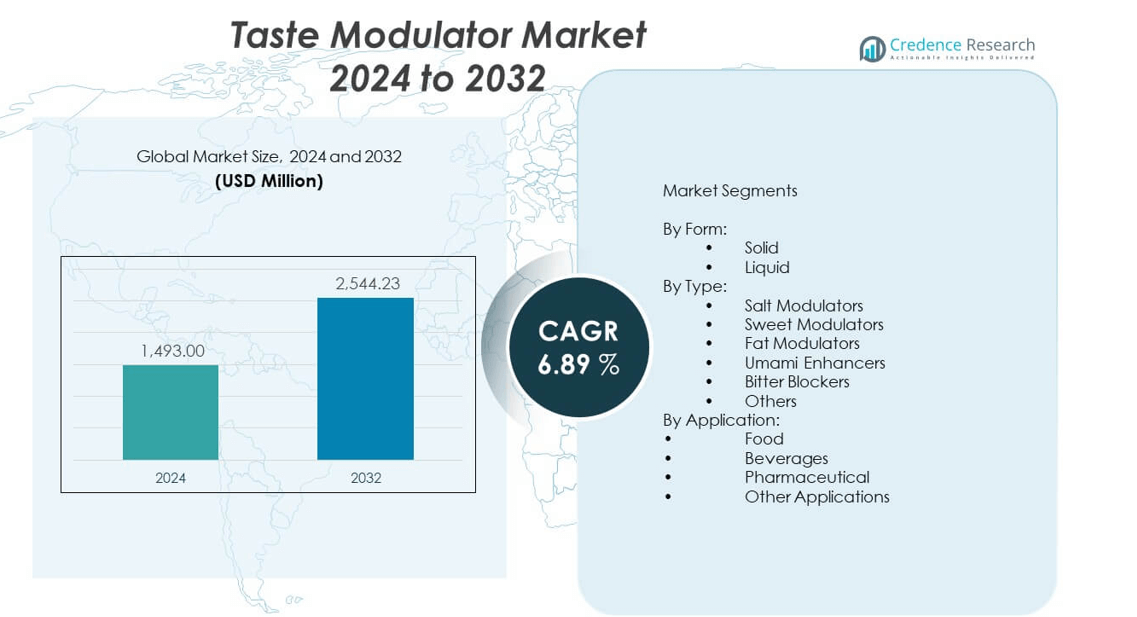
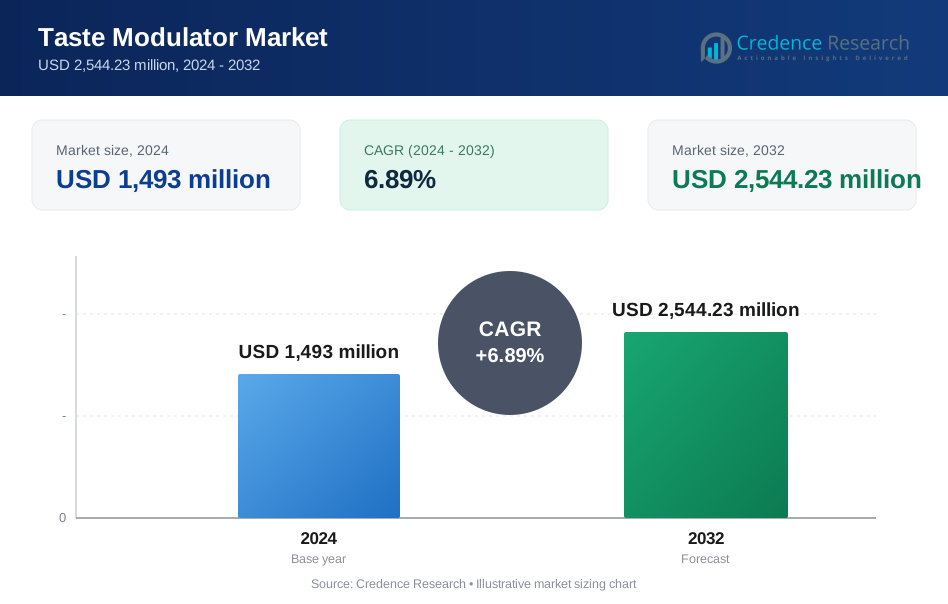
The Taste modulator market is projected to grow from USD 1,493 million in 2024 to an estimated USD 2,544.23 million by 2032, registering a compound annual growth rate (CAGR) of 6.89% during the forecast period.
| REPORT ATTRIBUTE | DETAILS |
|---|---|
| Historical Period | 2020-2023 |
| Base Year | 2024 |
| Forecast Period | 2025-2032 |
| Taste Modulator Market Size 2024 | USD 1,493 million |
| Taste Modulator Market, CAGR | 6.89% |
| Taste Modulator Market Size 2032 | USD 2,544.23 million |
The market’s expansion is fueled by increasing health consciousness among consumers, leading to higher demand for low-calorie and reduced-sugar products. Food and beverage companies are actively reformulating their products to comply with evolving regulatory guidelines on sugar and sodium reduction. Continuous advancements in food technology, particularly in flavor enhancement and masking, are enabling manufacturers to maintain taste profiles in healthier formulations. Growing investments in R&D by ingredient companies are further supporting innovation and product diversification in the taste modulator market.
North America leads the taste modulator market due to strong demand for low-sugar and reduced-sodium products, driven by health awareness and regulatory pressure. Europe follows closely, with high adoption in processed food and beverage sectors supported by stringent nutritional regulations. The Asia-Pacific region is emerging as a high-growth market, fueled by urbanization, rising disposable incomes, and the growing influence of Western dietary trends. Countries such as China, India, and Japan are witnessing increased use of taste modulators in packaged foods, beverages, and functional products, creating significant opportunities for global suppliers.
Market Insights:
- The taste modulator market is valued at USD 1,493 million in 2024 and is projected to reach USD 2,544.23 million by 2032, growing at a CAGR of 6.89% during the forecast period.
- Rising health awareness and regulatory initiatives for sugar and sodium reduction are driving demand for modulators that maintain flavor in reformulated food and beverages.
- Increasing adoption in functional, plant-based, and fortified products is boosting market expansion, supported by technological advancements in flavor masking and enhancement.
- Formulation complexity and variability in performance across product categories remain key restraints, requiring extensive R&D and application-specific solutions.
- North America leads the market, driven by strict nutritional regulations and strong consumer demand for healthier products.
- Europe follows with significant adoption supported by stringent labeling laws and a mature food processing sector.
- Asia-Pacific is the fastest-growing region, fueled by urbanization, changing dietary patterns, and rising demand for low-sugar and low-sodium packaged foods and beverages.
Market Drivers:
Rising Consumer Demand for Low-Calorie and Reduced-Sugar Products without Compromising Taste:
The taste modulator market benefits from a global surge in consumer preference for healthier food and beverages that retain appealing flavors. Consumers are increasingly aware of the health risks linked to high sugar, sodium, and fat intake, prompting brands to reformulate products. Regulatory guidelines in several countries encourage the reduction of unhealthy ingredients while maintaining sensory appeal. Taste modulators enable manufacturers to mask bitterness or enhance sweetness without adding excess sugar. The clean-label movement further strengthens their adoption in reformulated products. Growth in functional and fortified food categories adds more scope for integration. Brands are leveraging these solutions to meet both health and taste expectations. Continuous demand from health-conscious urban consumers sustains the market momentum.
- For example, PepsiCo committed to reducing added sugars in their beverage portfolio by 25% from their 2006 baseline by 2020. They removed approximately 402,000 metric tons of added sugar from their North American beverage portfolio compared to 2006.
Strong Influence of Government Regulations and Nutritional Reformulation Mandates:
Government-imposed restrictions on sugar and sodium content in food and drinks have created a strong push for taste modulators. Regulatory bodies in North America, Europe, and Asia-Pacific encourage product reformulation to meet public health objectives. Manufacturers use these modulators to ensure compliance while maintaining competitive product profiles. The technology allows brands to adapt quickly to evolving health standards. In several markets, reformulation has become an industry-wide priority. These regulatory pressures drive companies to invest in R&D for innovative taste enhancement solutions. The demand extends beyond beverages into baked goods, dairy, snacks, and sauces. This regulatory landscape positions the taste modulator market as a critical solution for compliance-driven innovation.
- For example, Tropicana Light offers 50% less sugar than regular orange juice, sustaining vitamin C provision, as confirmed in PepsiCo's product launches.
Expanding Applications in Functional and Nutritionally Enhanced Food Products:
Functional foods fortified with proteins, vitamins, and minerals often face taste challenges due to bitter or metallic notes. The taste modulator market addresses this challenge by improving flavor profiles without compromising nutritional value. It is particularly effective in protein shakes, energy bars, and dietary supplements. The rise in sports nutrition and wellness products has widened the adoption scope. Modulators also find use in plant-based proteins, which often require flavor correction. The growing demand for vegan and vegetarian diets amplifies their relevance. Taste modulators help manufacturers align with evolving dietary trends. This application versatility makes them a cornerstone for innovation in modern food development.
Technological Advancements in Flavor Masking and Enhancement Solutions:
Innovation in food science has expanded the range and effectiveness of taste modulators. Advanced encapsulation technologies improve stability and release control. Natural and organic ingredient-based modulators are increasingly developed to align with consumer preferences. R&D focuses on multi-functional solutions that work across sweet, salty, and umami profiles. These advancements enable manufacturers to reduce reformulation cycles and improve product launch timelines. Partnerships between ingredient suppliers and food brands accelerate innovation adoption. Tailored solutions for specific product categories enhance commercial viability. The continued integration of biotechnology in flavor design further boosts potential.
Market Trends:
Rising Adoption of Plant-Based and Alternative Protein Products Driving Taste Modulator Use:
The growing popularity of plant-based diets fuels demand for taste modulators to overcome flavor and texture challenges in meat and dairy alternatives. Plant proteins often carry earthy, beany, or bitter undertones, which modulators help neutralize. This trend aligns with sustainability goals and consumer shifts toward environmentally friendly diets. The taste modulator market gains traction from its role in making these alternatives more palatable. Product launches in plant-based burgers, milk, and cheese regularly incorporate such solutions. Global brands collaborate with flavor houses to enhance sensory appeal. This alignment with the plant-based trend ensures long-term demand. The rapid pace of innovation in this segment sustains market momentum.
- For instance, Beyond Meat incorporated specific bitter blockers and umami enhancers in its formulation, reducing off-notes validated through triple-blind sensory panels involving participants.
Integration of Taste Modulators in Alcohol-Free and Low-Alcohol Beverages:
The demand for low-alcohol and alcohol-free beverages is expanding, driven by health trends and lifestyle choices. Taste modulators address the challenge of maintaining complexity and flavor depth in these products. They replicate the mouthfeel and sensory balance that alcohol traditionally provides. Beverage companies use these solutions to improve consumer acceptance and repeat purchases. This trend benefits both mainstream soft drink manufacturers and niche craft producers. The use of natural and botanical modulators adds to the premium appeal. The growing social acceptance of alcohol alternatives reinforces this adoption. This emerging category strengthens diversification in the taste modulator market.
Development of Region-Specific Flavor Profiles to Cater to Local Preferences:
Manufacturers are tailoring taste modulators to match cultural and regional taste preferences. In Asia, modulators enhance spice balance in savory snacks and noodles. In Western markets, they often focus on sweetness enhancement and bitter masking. This localization helps brands connect with diverse consumer bases. Ingredient suppliers are investing in regional R&D facilities to develop culturally aligned solutions. This strategy increases acceptance rates for reformulated products. It also opens opportunities for premiumization by offering authentic flavor experiences. The taste modulator market benefits from these localized innovations, creating competitive advantages for global players.
Growing Use of AI and Data-Driven Formulation in Flavor Optimization:
Artificial intelligence is increasingly applied to develop targeted taste modulator solutions. AI-driven formulation accelerates product development cycles by predicting optimal flavor combinations. This approach reduces trial-and-error in R&D and improves cost efficiency. Data analytics helps identify evolving consumer taste trends and preferences. Ingredient companies use these insights to design solutions with higher acceptance potential. This technological integration also supports personalized nutrition, where flavors are tailored to individual profiles. The use of machine learning in sensory analysis enhances consistency across product lines. The adoption of AI-driven solutions reflects a forward-looking trend in the taste modulator market.
Market Challenges Analysis:
Complexity in Achieving Consistent Taste Profiles Across Multiple Product Formats:
The taste modulator market faces the challenge of ensuring consistent performance across different food and beverage categories. Variations in product matrices, processing methods, and ingredient interactions can alter modulator effectiveness. This complexity demands extensive testing and reformulation, increasing time-to-market. In beverages, for instance, modulators may behave differently in carbonated and still formats. Similarly, bakery applications face stability issues during baking. These inconsistencies impact scalability and commercial viability. Manufacturers must invest in specialized formulation expertise. Overcoming these challenges is critical to building consumer trust and maintaining brand loyalty.
Limited Consumer Awareness and Perception Barriers for Ingredient Acceptance:
Consumer awareness about taste modulators remains low compared to other functional ingredients. Many buyers are unfamiliar with their role in improving health-oriented products without compromising taste. Misconceptions about artificial additives can create resistance, even when solutions are natural. Transparent labeling and education campaigns are essential to address this barrier. Brands must communicate the health and sensory benefits clearly. Regulatory requirements for ingredient disclosure vary across markets, adding complexity. Without consumer acceptance, adoption rates may slow despite technical advantages. Building trust through clean-label solutions can mitigate these challenges.
Market Opportunities:
Rising Demand for Reformulated Products in Emerging Economies:
Emerging markets present significant growth potential for the taste modulator market. Rapid urbanization, expanding middle-class populations, and rising disposable incomes are boosting demand for healthier packaged foods. Manufacturers have opportunities to introduce taste modulators in reformulated local products. Collaborations with regional food brands can accelerate adoption. Tailoring solutions to local taste preferences strengthens competitive positioning. The growth of modern retail and e-commerce expands distribution reach.
Expansion into Niche and Premium Product Categories:
Premium confectionery, gourmet snacks, and specialty beverages are incorporating taste modulators to enhance flavor sophistication. These high-margin segments value innovation and sensory differentiation. Ingredient suppliers can develop bespoke solutions for premium brands seeking unique taste experiences. This expansion into niche categories supports diversification beyond mainstream applications. It also reinforces brand reputation in innovation-led markets.
Market Segmentation Analysis:
By Form
The taste modulator market is categorized into solid and liquid formats. Solid modulators dominate due to their stability, extended shelf life, and ease of incorporation into various food manufacturing processes. Liquid modulators are projected to experience the highest growth, supported by increasing demand in beverages where uniform dispersion and integration are essential. This growth is particularly visible in low-sugar, functional, and fortified drinks, where taste plays a decisive role in consumer acceptance and brand loyalty.
- For instance, Salt modulators are dominant in segments like snacks, processed meats, and sauces, enabling sodium reduction while preserving flavor. As an illustration, Ajinomoto Health and Nutrition North America utilizes monosodium glutamate (MSG) and potassium salts to reduce sodium levels by up to half in snacks and sauces while enhancing savory flavor.
By Type
Salt modulators hold the leading share, especially in food segments such as snacks, processed meats, and sauces, enabling sodium reduction while preserving flavor. Sweet modulators are extensively used in dairy, confectionery, and sugar-free products to align with global health initiatives targeting sugar intake. Fat modulators replicate the mouthfeel and richness of higher-fat formulations in dairy and bakery items. Umami enhancers intensify savory notes, enhancing overall taste complexity. Bitter blockers address undesirable flavors in fortified foods, plant-based products, and pharmaceuticals. Other modulators serve niche applications, offering tailored flavor solutions.
- For instance, Food remains the largest application, with bakery, dairy, savory snacks, meat, and seafood segments integrating modulators to improve taste in reformulated products.
By Application
Food is the dominant application segment, with bakery, dairy, savory snacks, meat, and seafood categories integrating modulators to enhance taste in reformulated products. Beverages are anticipated to record rapid growth, driven by rising demand for healthy, low-sugar, and fortified drink options. Pharmaceuticals utilize modulators to mask bitterness and improve compliance, particularly in pediatric and geriatric formulations. Other applications, including nutraceuticals and functional products, are expanding steadily, reflecting the adaptability and broad utility of the taste modulator market across diverse industries.
Segmentation:
By Form:
- Solid
- Liquid
By Type:
- Salt Modulators
- Sweet Modulators
- Fat Modulators
- Umami Enhancers
- Bitter Blockers
- Others
By Application:
- Food
- Beverages
- Pharmaceutical
- Other Applications
- North America
- U.S.
- Canada
- Mexico
- Europe
- Germany
- France
- U.K.
- Italy
- Spain
- Rest of Europe
- Asia Pacific
- China
- Japan
- India
- South Korea
- South-east Asia
- Rest of Asia Pacific
- Latin America
- Brazil
- Argentina
- Rest of Latin America
- Middle East & Africa
- GCC Countries
- South Africa
- Rest of the Middle East and Africa
Regional Analysis:
North America – Regulatory Leadership and High Consumer Health Awareness
North America leads the taste modulator market, holding the largest share, supported by stringent health regulations and consumer demand for reduced sugar and sodium. Major food and beverage companies actively reformulate products to comply with guidelines. The U.S. dominates regional adoption, leveraging advanced R&D and innovation partnerships. The clean-label trend further strengthens the market position. Canada also shows strong growth potential due to rising functional food consumption.
Europe – Stringent Nutritional Policies Driving Innovation
Europe follows closely, with significant market share driven by strict nutritional labeling and reformulation mandates. Countries like the U.K., Germany, and France lead adoption through public health initiatives. The region’s mature food processing sector supports rapid integration of modulators in multiple categories. Plant-based and organic product growth further boosts demand. Collaborations between ingredient suppliers and FMCG companies enhance innovation speed.
Asia-Pacific – Fastest-Growing Market with Expanding Applications
Asia-Pacific is the fastest-growing region in the taste modulator market, fueled by urbanization and changing dietary habits. China, India, and Japan are key markets for adoption in packaged foods and beverages. The rise of modern retail, coupled with increased health awareness, supports expansion. Local taste preferences encourage tailored solutions for savory and sweet profiles. The growing influence of Western diets adds to adoption rates.
Key Player Analysis:
- DSM (Netherlands)
- International Flavors & Fragrances Inc. (IFF) (USA)
- Givaudan (Switzerland)
- Kerry Group PLC (Ireland)
- Ingredion Incorporated (USA)
- Symrise (Germany)
- Sensient Technologies Corporation (USA)
- Tate & Lyle (UK)
- Corbion (Netherlands)
- Takasago International Corporation (Japan)
Competitive Analysis:
The taste modulator market is characterized by the presence of global flavor houses and ingredient suppliers competing through innovation, product portfolio expansion, and partnerships. Leading players invest heavily in R&D to develop natural, clean-label, and multi-functional modulators. It maintains a competitive environment where differentiation is achieved through application versatility and regional customization. Strategic alliances with food and beverage manufacturers strengthen market penetration. The presence of established distribution networks ensures widespread reach. Intense competition fosters continuous improvement in formulation efficiency and cost-effectiveness.
Recent Developments:
- In DSM (Netherlands), the company made a significant move in July 2025, launching ModulaSENSE, a new line of maskers designed to address bitterness and astringency, further solidifying its position in the taste modulator market. Earlier, in March 2025, DSM‑Firmenich (via their merged entity) unveiled a comprehensive taste solutions portfolio—including flavors, maskers, blockers, and sensates—tailored for pharmaceutical formulations to enhance drug palatability.
- In Kerry Group PLC (Ireland), the company has been particularly active: in April 2024, Kerry launched Tastesense™ Salt, a sodium reduction technology that preserves rich savory taste while achieving more than 60% sodium reduction in some applications. In June 2023, it introduced Tastesense™ Advanced, targeting low or zero-sugar products, providing enhanced sweetness, mouthfeel, and sustainability benefits.
- More recently, in May 2025, Kerry employed Tastesense™ Masking to successfully reformulate a zero-sugar energy drink, improving taste and achieving a cleaner label in European and North American markets
Market Concentration & Characteristics:
The taste modulator market demonstrates moderate to high concentration, with a few multinational players holding significant shares. It is marked by innovation-driven competition, where product differentiation, clean-label formulations, and regional adaptation are key strategies. Strong R&D capabilities and established global distribution networks give top players a competitive edge. Emerging regional players are entering with localized solutions to address cultural taste preferences. The market favors companies with the ability to provide scalable, application-specific solutions across multiple food and beverage categories.
Report Coverage:
The research report offers an in-depth analysis based on By Form, By Type, and By Application. Under By Form. It details leading market players, providing an overview of their business, product offerings, investments, revenue streams, and key applications. Additionally, the report includes insights into the competitive environment, SWOT analysis, current market trends, as well as the primary drivers and constraints. Furthermore, it discusses various factors that have driven market expansion in recent years. The report also explores market dynamics, regulatory scenarios, and technological advancements that are shaping the industry. It assesses the impact of external factors and global economic changes on market growth. Lastly, it provides strategic recommendations for new entrants and established companies to navigate the complexities of the market.
Future Outlook:
- Increased integration in plant-based food and beverages.
- Stronger adoption in emerging economies.
- Expansion of natural and clean-label product lines.
- Wider use in premium confectionery and snacks.
- Growth in alcohol-free and low-alcohol beverages.
- AI-driven product development in flavor optimization.
- Rising collaborations between ingredient suppliers and FMCG brands.
- Broader application in functional and fortified foods.
- Tailored solutions for region-specific flavor preferences.
- Enhanced R&D investment in multi-functional modulators.
Request a Free Sample
Fill in your details and we'll send you a free sample report.
- Sample data tables & charts
- Research methodology
Need a Custom Version of This Report?
Tailor the scope, geography, or segments to your exact requirements.
- Custom geography or segment scope
- Direct access to our analyst team
Frequently Asked Questions
What is the current market size for the taste modulator market, and what is its projected size in 2032?
Which taste modulator market segment held the largest share in 2024?
What are the primary factors fueling the growth of the taste modulator market?
Who are the leading companies in the taste modulator market?
Table of Content
Chapter 1. Report Introduction
- 1.1 Report Description & Purpose
- 1.1.1 Report Title & Market Definition
- 1.1.2 Unique Selling Propositions (USP) & Key Differentiators
- 1.1.3 Value Proposition for Stakeholders
- 1.2 Research Objectives
- 1.2.1 Market Sizing Objectives (Volume & Revenue)
- 1.2.2 Segmentation Objectives
- 1.2.3 Competitive Intelligence Objectives
- 1.2.4 Forecast & Scenario Objectives
- 1.3 Report Scope
- 1.3.1 Taste Modulator Scope – Types & Subtypes Covered
- 1.3.2 Geographic Scope – Regions & Countries Covered
- 1.3.3 Historical Period, Base Year & Forecast Period (2024; forecast to 2032)
- 1.3.4 Inclusions & Exclusions
- 1.4 HS Code & Classification Framework
- 1.5 Currency, Units & Pricing Basis
- 1.6 Target Stakeholders
- 1.7 Limitations & Assumptions
Chapter 2. Executive Summary
- 2.1 Global Taste Modulator Market Snapshot
- 2.1.1 Market Size – Historical (2024) & Forecast (2024-2032) (2024: USD 1,493 million → 2032: USD 2,544.23 million)
- 2.1.2 Volume & Revenue – Global Totals
- 2.1.3 Key Market Highlights – Top Five Facts
- 2.2 Taste Modulator Market Segmentation Snapshot
- 2.2.1 Market Split by Region – 2024 vs. 2032
- 2.3 Competitive Snapshot
- 2.3.1 Top 10 Players by Revenue Share – 2024
- 2.3.2 Top 10 Players by Volume Share – 2024
- 2.3.3 Recent Strategic Developments (18-Month Summary)
- 2.4 Key Investment Highlights & Strategic Conclusions
Chapter 3. Taste Modulator Market Dynamics & Industry Analysis
- 3.1 Market Overview & Context
- 3.1.1 Taste Modulator Market Position in the Broader Automotive Value Chain
- 3.1.2 OEM vs. Replacement Market Dynamics
- 3.1.3 Market Maturity & Development Stage by Region
- 3.2 Taste Modulator Market Drivers
- 3.3 Taste Modulator Market Restraints & Challenges
- 3.4 Taste Modulator Market Opportunities
- 3.5 Porter's Five Forces Analysis
- 3.5.1 Threat of New Entrants
- 3.5.2 Bargaining Power of Suppliers
- 3.5.3 Bargaining Power of Buyers
- 3.5.4 Threat of Substitutes
- 3.5.5 Competitive Rivalry – Intensity Assessment
- 3.6 Taste Modulator Value Chain Analysis
- 3.6.1 Upstream – Raw Material/Input Suppliers
- 3.6.1.1 Raw Material/Input 1
- 3.6.1.2 Raw Material/Input 2
- 3.6.1.3 Raw Material/Input 3
- 3.6.2 Midstream – Production/Manufacturing/Service Delivery
- 3.6.2.1 Production/Process Overview
- 3.6.2.2 Key Facility Locations & Capacity by Manufacturer
- 3.6.3 Downstream – Distribution & End Consumer
- 3.6.3.1 Primary Channel – B2B/OEM
- 3.6.3.2 Secondary Channels – Dealer, Retail, Online, Direct
- 3.6.4 Value Chain Profitability Analysis
- 3.6.1 Upstream – Raw Material/Input Suppliers
- 3.7 PESTEL Analysis
- 3.7.1 Political Factors
- 3.7.2 Economic Factors
- 3.7.3 Social Factors
- 3.7.4 Technological Factors
- 3.7.5 Environmental Factors
- 3.7.6 Legal Factors
- 3.8 Taste Modulator Supply Chain Analysis
- 3.8.1 Raw Material/Input Supply Risk Assessment
- 3.8.2 Manufacturing Concentration Risk (Geographic Exposure)
- 3.8.3 Trade Disruption Impact Analysis
- 3.9 Regulatory & Policy Landscape
Note: The regulatory and policy landscape section covers regulations based on their applicability to the market, Taste Modulator category, geography, and scope of the study. Only regulatory frameworks with a material impact on operations, compliance, trade, sustainability, or market access are analyzed in detail.
Chapter 4. Key Investment Pockets & Opportunity Analysis
- 4.1 Taste Modulator Market Attractiveness Analysis
- 4.1.1 By Region – Investment Attractiveness Matrix (Volume × CAGR)
- 4.2 Absolute Revenue Growth Opportunity
- 4.2.1 By Region – Absolute USD Growth Through 2032
- 4.3 Incremental Volume Opportunity
- 4.3.1 By Region – Incremental Volume Through 2032
- 4.3.2 Segment – Incremental Volume
- 4.4 Emerging Submarket Opportunity Deep Dive (Subject to Applicability)
- 4.5 Emerging Market Opportunity Scorecards
- 4.5.1 United States
- 4.5.2 Europe
- 4.5.3 Asia
- 4.5.4 Middle East & Africa
Note: Emerging Market Opportunity Scorecards will be included based on relevance and strategic importance. Regions listed are indicative and may vary depending on data availability and market dynamics.
Chapter 5. Taste Modulator Import-Export Analysis & Trade Flows
- 5.1 Global Trade Overview
- 5.1.1 Global Export Value by Country (2024)
- 5.1.2 Global Export Volume by Country (2024)
- 5.1.3 Global Import Value by Country (2024)
- 5.1.4 Global Import Volume by Country (2024)
- 5.1.5 Net Trade Balance by Country (2024)
- 5.2 Export Analysis – Segment
- 5.2.1 Type 1 (HS Code)
- 5.2.2 Type 2 (HS Code)
- 5.2.3 Type 3 (HS Code)
- 5.2.4 Type 4 (HS Code)
- 5.2.5 Type 5 (HS Code)
- 5.3 Import Analysis – Segment
- 5.3.1 Type 1 (HS Code)
- 5.3.2 Type 2 (HS Code)
- 5.3.3 Type 3 (HS Code)
- 5.3.4 Type 4 (HS Code)
- 5.3.5 Type 5 (HS Code)
- 5.4 Average Unit Trade Prices
- 5.4.1 Average Export Price – Segment & Country
- 5.4.2 Average Import Price – Segment & Source Country
- 5.4.3 Price Trends (2024)
- 5.5 Key Trade Route Analysis
- 5.5.1 Trade Route 1
- 5.5.2 Trade Route 2
- 5.5.3 Trade Route 3
- 5.5.4 Trade Route 4
- 5.5.5 Trade Route 5
- 5.6 Trade Policy Impact Assessment
- 5.6.1 US Anti-Dumping & Section 301 Tariffs
- 5.6.2 EU Customs Union Impact
- 5.6.3 Major Free Trade Agreements
- 5.6.4 USMCA Rules of Origin
Note: Trade policy analysis will be included only where relevant to the Taste Modulator market.
Chapter 6. Competitive Landscape & Company Benchmarking
- 6.1 Taste Modulator Market Concentration & Structure
- 6.1.1 Herfindahl-Hirschman Index (HHI) – vs. 2024
- 6.1.2 Tier 1, Tier 2 & Tier 3 Market Structure
- 6.1.3 Global, Regional & Local Player Dynamics
- 6.2 Taste Modulator Market Share Analysis – 2024
- 6.2.1 Global Revenue Share by Company
- 6.2.2 Global Volume Share by Company
- 6.2.3 Regional Revenue Share
- 6.2.4 Market Share Evolution ( vs. 2024)
- 6.2.5 OEM Segment Share by Company
- 6.2.6 Replacement Segment Share by Company
- 6.3 Production/Delivery Capacity & Facility Analysis
- 6.3.1 Global Installed Capacity
- 6.3.2 Capacity Utilization Rates
- 6.3.3 Production/Output Volume
- 6.3.4 Facility Locations & Capacity Map
- 6.3.5 Planned Capacity Additions
- 6.4 Taste Modulator Competitive Benchmarking Matrix
- 6.4.1 Revenue, Volume, CAGR & Profitability Comparison
- 6.4.2 Channel Revenue Mix
- 6.4.3 Geographic Revenue Exposure
- 6.4.4 R&D Intensity
- 6.4.5 Sustainability Maturity
- 6.5 Strategic Developments in Taste Modulator (Last 24 Months)
- 6.5.1 Mergers, Acquisitions & Divestments
- 6.5.2 New Taste Modulator Launches
- 6.5.3 Facility Expansions
- 6.5.4 Strategic Alliances, Joint Ventures & Partnerships
- 6.5.5 Distribution Expansion & Market Entry
- 6.5.6 Sustainability & ESG Initiatives
- 6.6 Competitive Strategy Mapping
- 6.6.1 Leader, Challenger, Follower & Niche Classification
- 6.6.2 Pricing Strategy Comparison
- 6.6.3 Channel Strategy Matrix
Note: Strategic developments are included based on their materiality and the availability of reliable information.
Chapter 7. Global Taste Modulator Market – By Distribution Channel
- 7.1 Segment Overview
- 7.1.1 Volume & Revenue Split by Channel (2024 & 2032)
- 7.1.2 Channel Mix Evolution (2024-2032)
Chapter 8. Regional Market Analysis – Global Overview
- 8.1 Global Regional Overview
- 8.1.1 Regional Volume Share
- 8.1.2 Regional Revenue Share
- 8.1.3 Regional Volume by Region
- 8.1.4 Regional Revenue by Region
- 8.1.5 Regional Forecast Through 2032
- 8.2 Cross-Regional Segment Analysis
- 8.2.1 By Distribution Channel
- 8.2.2 By Brand/Price Tier
Chapter 9. North America Taste Modulator Market
- 9.1 United States
- 9.2 Canada
- 9.3 Mexico
Chapter 10. Europe Taste Modulator Market
- 10.1 Germany
- 10.2 France
- 10.3 Italy
- 10.4 United Kingdom
- 10.5 Spain
- 10.6 Poland
- 10.7 Russia
- 10.8 Netherlands
- 10.9 Belgium
- 10.10 Sweden
- 10.11 Denmark
- 10.12 Norway
- 10.13 Rest of Europe
Chapter 11. Asia Pacific Taste Modulator Market
- 11.1 China
- 11.2 India
- 11.3 Japan
- 11.4 South Korea
- 11.5 Thailand
- 11.6 Indonesia
- 11.7 Vietnam
- 11.8 Malaysia
- 11.9 Australia
- 11.10 Rest of Asia Pacific
Chapter 12. Latin America Taste Modulator Market
- 12.1 Brazil
- 12.2 Argentina
- 12.3 Colombia
- 12.4 Chile
- 12.5 Rest of Latin America
Chapter 13. Middle East Taste Modulator Market
- 13.1 Saudi Arabia
- 13.2 United Arab Emirates
- 13.3 Turkey
- 13.4 Israel
- 13.5 Iran
- 13.6 Rest of the Middle East
Chapter 14. Africa Taste Modulator Market
- 14.1 South Africa
- 14.2 Egypt
- 14.3 Nigeria
- 14.4 Morocco
- 14.5 Rest of Africa
Chapter 15. Taste Modulator Company Profiles
- 15.1 [Company 01]
- 15.1.1 Company Overview
- 15.1.2 Key Management Personnel
- 15.1.3 Products & Services Portfolio
- 15.1.4 Financial Performance
- 15.1.5 Key Market Focus & Geographic Presence
- 15.1.6 Recent Developments & Strategic Initiatives
Note: The company profile list is preliminary and may change based on research findings, market developments, data availability, and client requirements.
Chapter 16. Appendices
- Appendix A – List of Abbreviations & Acronyms
- Appendix B – Industry Classification Code Reference – Full Series
- Appendix C – Production & Capacity Data Tables
- Appendix D – End-Use & Demand Base Tables
- Appendix E – Consumption & Replacement Rate Assumptions
- Appendix F – ASP Reference Tables
- Appendix G – Manufacturing & Facility Database
- Appendix H – Import-Export Data Tables
- Appendix I – Regulatory Summary Tables
- Appendix J – Primary Research Participant List (Anonymized)
- Appendix K – Primary Research Questionnaire Framework
- Appendix L – Data Sources & Bibliography
- Appendix M – Market Size Divergence & Source Comparison
Chapter 17. Research Methodology
- 17.1 Research Framework & Philosophy
- 17.2 Secondary Research – Sources, Hierarchy & Data Extraction
- 17.3 Data Modeling – Bottom-Up & Top-Down Market Sizing
- 17.4 Primary Research – Stakeholder Framework, LOI & Sample Sizes
- 17.5 Forecast Methodology – Regression, Scenario & Sensitivity Analysis
- 17.6 Quality Control – Four-Layer Validation Framework
- 17.7 Limitations & Standard Assumptions
- 17.8 Disclaimer
