Home » Automotive & Transportation » Shipping Containers Market

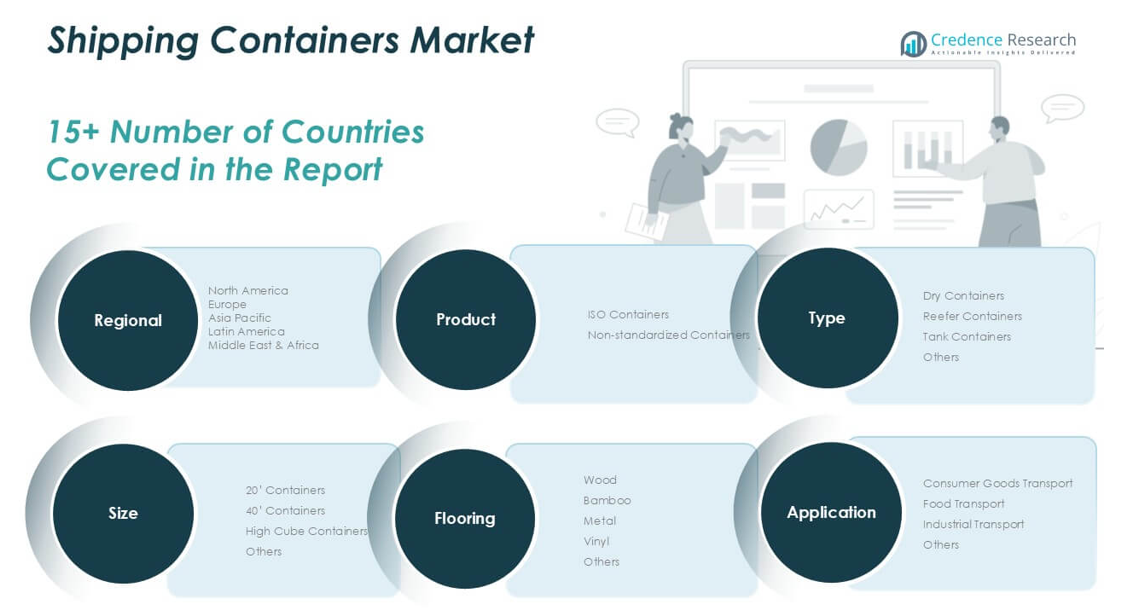
Shipping Containers Market By Size (Small (20 Feet), High (40 Feet), High Cube), By Type (Dry Container, Refrigerated Container, Tank Container, Others), By Deployment (On-shore Container, Off-shore Container) – Growth, Future Prospects, And Competitive Analysis, 2018 – 2026

Price: $4999

Published: | Report ID: 10735 | Report Format : PDF

Industry Outlook

Cargo shipping, also known as maritime transportation of goods, has played an important role in shaping the modern world. Prior to aviation, the only way to connect and trade between continents was to transport goods across vast seas and oceans. The shipping industry has experienced consistent growth since its inception and has reached its pinnacle in recent years. Consistently growing global trade through ships has certainly encouraged the need for shipping containers across the globe. Shipping containers are secure and provide a medium to carry a variety of cargo with ease. Owing to its significance in the shipping industry, the demand for shipping containers is expected to stay healthy throughout the forecast period.

Market Synopsis

In terms of market value, large containers have a clear dominance over small and high-cube containers.

Based on the size, shipping containers are classified into small containers with a length of 20 feet, large containers with a length of 40 feet, and high-cube containers. In the shipping container market, large shipping containers claim a considerable market share of about 2/3 of the total number of shipping containers across the globe. These shipping containers have a considerably high storage capacity, so they are preferred by the majority of shipping companies. Small containers trail large containers in terms of market value as well as volume. These containers are as reliable as the large variants and are available for a lower price. However, the lack of storage capacity has dragged down the growth potential of small containers. High-cube containers are special containers with added height to accommodate more cargo. High-cube containers are a special type of container used for very specific applications, such as the shipping of cars and other such cargo.

Design Element 2

Access crucial information at unmatched prices!

Request your free sample report today & start making informed decisions powered by Credence Research!

Download Free Sample
CTA Design Element 3

In the coming year, the dry container will maintain its dominance over other container types.

By far, in 2017, dry containers claimed the majority of the market share in the overall shipping container market. These are the most commonly available shipping containers and are used to transport a number of building materials through the sea, rails, roads, and any other transportation medium. These are simply corrugated steel containers and can be customized in a number of ways to suit cargo requirements. Refrigerated containers are used to transport food, vegetables, and flora over a longer distance. With perpetually growing world trade and lowering transportation times, refrigerated containers are gaining momentum in terms of market share.

Due to China, Asia Pacific reigns supreme in the global shipping container market.

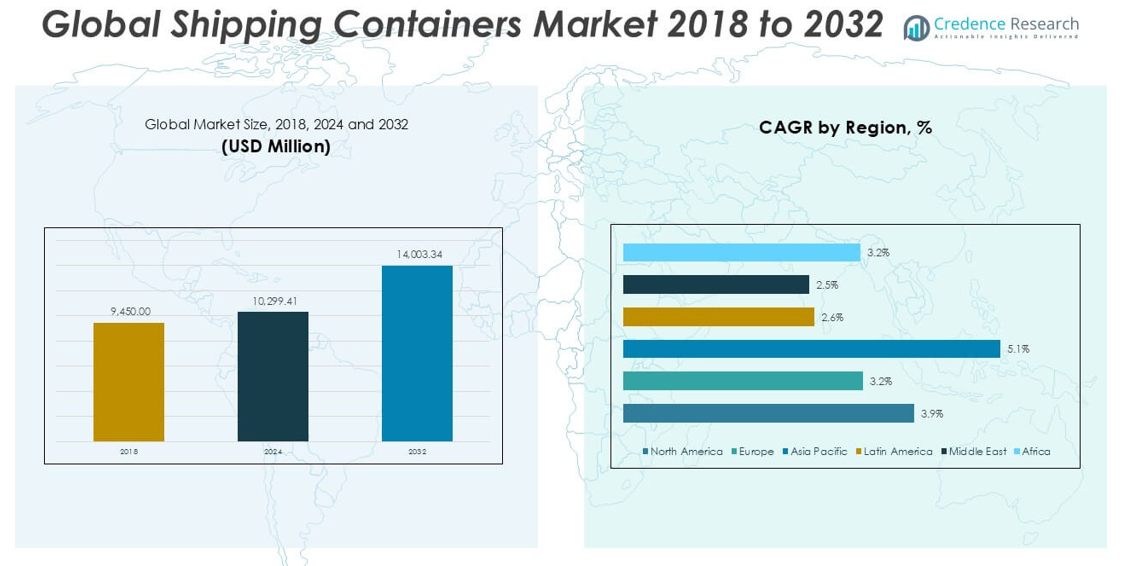
Unarguably, China manufactures the majority of shipping containers used across the globe. China’s share in the global market is more than 90%, and it also hosts the world’s busiest port, Shanghai, in terms of twenty-foot equivalent units (TEU) in 2017. Owing to the aforementioned factors, Asia-Pacific reigns as the most lucrative region among others in the shipping container market. Other regions, including Europe and North America, are expected to contribute little in the coming years as these regions are unable to match the lower labor rates in the Asia Pacific.

Market Segmentation

Competitive Landscape   

The research study covers some of the leading shipping container companies, including Maersk Container Industry AS, TLS Offshore Containers International Pvt. Ltd., China International Marine Containers (Group) Ltd. (CIMC), W&K Containers Inc., Singamas Container Holdings Limited, YMC Container Solutions, Sea Box Inc., Dong Fang International Container (Hong Kong) Co. Ltd., CXIC Group Containers Company Limited, Storstac Inc., Jindo Co. Ltd., and MSC Mediterranean Shipping Company S.A. The shipping container market is quite fragmented with respect to several Asia-Pacific companies asserting their dominance.

The market is expected to remain saturated, with very few new entrants projected to enter the mainstream. However, the consistently growing demand for shipping containers will keep container manufacturers on their toes. These companies have to overcome some issues, such as fluctuating material costs and the availability of affordable labor, in order to maintain their profit share and market position.

Shape Your Report to Specific Countries or Regions & Enjoy 30% Off!

Key questions are answered in this report.

  • How have exponential world trade and globalization helped the shipping container market flourish?
  • How does the expansion of end-use industries and global marketplaces affect the shipping container market?
  • What are the different types of shipping containers based on their size, type, and deployment, and what is their standing in terms of market value?
  • How vital is the growth of the maritime transportation and shipping industry, and what is its effect on the sales of shipping containers?
  • In the coming years, what role will Asia-Pacific play as the global leader in the shipping container market?

1. Preface
1.1. Report Description
1.1.1. Purpose of the Report
1.1.2. Target Audience
1.1.3. USP and Key Offerings
1.2. Research Scope
1.3. Research Methodology
1.3.1. Phase I-Secondary Research
1.3.2. Phase II-Primary Research
1.3.3. Approach Adopted
1.3.4. Top-Down Approach
1.3.5. Bottom-Up Approach
1.3.6. Phase III-Expert Panel Review
1.3.7. Assumptions
1.4. Market Segmentation

2. Executive Summary
2.1. Global SC Market Snapshot
2.2. Global SC Market, by Size
2.3. Global SC Market, by Type
2.4. Global SC Market, by Deployment
2.5. Global SC Market, by Geography

3. Global Shipping Containers (SC) Market Analysis
3.1. Global SC Market Overview
3.2. Market Dynamics
3.2.1. Market Drivers
3.2.2. Market Challenges
3.3. See-Saw Analysis
3.3.1. Impact Analysis
3.4. Attractive Investment Proposition
3.5. Competitive Landscape
3.5.1. Market Positioning of Key Industry Participants
3.5.2. Major Strategies Adopted by Key Industry Participants

4. Global Shipping Containers (SC) Market Value, by Size, 2016 – 2026 (US$ Mn)
4.1. Overview
4.1.1. Global SC Market Value Share, by Size, 2017 & 2026 (Value %)
4.1.2. Global SC Market Value, by Size, 2016 – 2026 (US$ Mn)
4.2. Small (20 Feet)
4.2.1. Global Small (20 Feet) SC Market, 2016 – 2026 (US$ Mn)
4.3. High (40 Feet)
4.3.1. Global High (40 Feet) SC Market, 2016 – 2026 (US$ Mn)
4.4. High Cube
4.4.1. Global High Cube SC Market, 2016 – 2026 (US$ Mn)

5. Global Shipping Containers (SC) Market Value, by Type, 2016 – 2026 (US$ Mn)
5.1. Overview
5.1.1. Global SC Market Value Share, by Type, 2017 & 2026 (Value %)
5.1.2. Global SC Market Value, by Type, 2016 – 2026 (US$ Mn)
5.2. Dry Containers
5.2.1. Global Dry SC Market, 2016 – 2026 (US$ Mn)
5.3. Refrigerated Containers
5.3.1. Global Refrigerated SC Market, 2016 – 2026 (US$ Mn)
5.4. Tank Containers
5.4.1. Global Tank SC Market, 2016 – 2026 (US$ Mn)
5.5. Others
5.5.1. Global Shipping Containers for Other Application Market, 2016 – 2026 (US$ Mn)

6. Global Shipping Containers (SC) Market Value, by Deployment, 2016 – 2026 (US$ Mn)
6.1. Overview
6.1.1. Global SC Market Value Share, by Deployment, 2017 & 2026 (Value %)
6.1.2. Global SC Market Value, by Deployment, 2016 – 2026 (US$ Mn)
6.2. On-shore Containers
6.2.1. Global On-shore SC Market, 2016 – 2026 (US$ Mn)
6.3. Off-shore Containers
6.3.1. Global Off-shore SC Market, 2016 – 2026 (US$ Mn)

7. North America Shipping Containers (SC) Market Analysis, 2016 – 2026 (US$ Mn)
7.1. Overview
7.1.1. North America SC Market Value, 2016 – 2026, (US$ Mn)
7.2. North America SC Market, by Size, 2016 – 2026 (US$ Mn)
7.2.1. Comparative Analysis
7.3. North America SC Market, by Type, 2016 – 2026 (US$ Mn)
7.3.1. Comparative Analysis
7.4. North America SC Market, by Deployment, 2016 – 2026 (US$ Mn)
7.4.1. Comparative Analysis
7.5. North America SC Market Value, by Country, 2016 – 2026 (US$ Mn)
7.5.1. U.S.
7.5.1.1. U.S. SC Market, by Size, 2016 – 2026 (US$ Mn)
7.5.1.2. U.S. SC Market, by Type, 2016 – 2026 (US$ Mn)
7.5.1.3. U.S. SC Market, by Deployment, 2016 – 2026 (US$ Mn)
7.5.2. Canada
7.5.2.1. Canada SC Market, by Size, 2016 – 2026 (US$ Mn)
7.5.2.2. Canada SC Market, by Type, 2016 – 2026 (US$ Mn)
7.5.2.3. Canada SC Market, by Deployment, 2016 – 2026 (US$ Mn)

8. Europe Shipping Containers (SC) Market Analysis, 2016 – 2026 (US$ Mn)
8.1. Overview
8.1.1. Europe SC Market Value, 2016 – 2026, (US$ Mn)
8.2. Europe SC Market, by Size, 2016 – 2026 (US$ Mn)
8.2.1. Comparative Analysis
8.3. Europe SC Market, by Type, 2016 – 2026 (US$ Mn)
8.3.1. Comparative Analysis
8.4. Europe SC Market, by Deployment, 2016 – 2026 (US$ Mn)
8.4.1. Comparative Analysis
8.5. Europe SC Market Value, by Country, 2016 – 2026 (US$ Mn)
8.5.1. U.K.
8.5.1.1. U.K. SC Market, by Size, 2016 – 2026 (US$ Mn)
8.5.1.2. U.K. SC Market, by Type, 2016 – 2026 (US$ Mn)
8.5.1.3. U.K. SC Market, by Deployment, 2016 – 2026 (US$ Mn)
8.5.2. Germany
8.5.2.1. Germany SC Market, by Size, 2016 – 2026 (US$ Mn)
8.5.2.2. Germany SC Market, by Type, 2016 – 2026 (US$ Mn)
8.5.2.3. Germany SC Market, by Deployment, 2016 – 2026 (US$ Mn)
8.5.3. France
8.5.3.1. France SC Market, by Size, 2016 – 2026 (US$ Mn)
8.5.3.2. France SC Market, by Type, 2016 – 2026 (US$ Mn)
8.5.3.3. France SC Market, by Deployment, 2016 – 2026 (US$ Mn)
8.5.4. Rest of Europe
8.5.4.1. Rest of Europe SC Market, by Size, 2016 – 2026 (US$ Mn)
8.5.4.2. Rest of Europe SC Market, by Type, 2016 – 2026 (US$ Mn)
8.5.4.3. Rest of Europe SC Market, by Deployment, 2016 – 2026 (US$ Mn)

9. Asia Pacific Shipping Containers (SC) Market Analysis, 2016 – 2026 (US$ Mn)
9.1. Overview
9.1.1. Asia Pacific SC Market Value, 2016 – 2026, (US$ Mn)
9.2. Asia Pacific SC Market, by Size, 2016 – 2026 (US$ Mn)
9.2.1. Comparative Analysis
9.3. Asia Pacific SC Market, by Type, 2016 – 2026 (US$ Mn)
9.3.1. Comparative Analysis
9.4. Asia Pacific SC Market, by Deployment, 2016 – 2026 (US$ Mn)
9.4.1. Comparative Analysis
9.5. Asia Pacific SC Market Value, by Country, 2016 – 2026 (US$ Mn)
9.5.1. China
9.5.1.1. China SC Market, by Size, 2016 – 2026 (US$ Mn)
9.5.1.2. China SC Market, by Type, 2016 – 2026 (US$ Mn)
9.5.1.3. China SC Market, by Deployment, 2016 – 2026 (US$ Mn)
9.5.2. Japan
9.5.2.1. Japan SC Market, by Size, 2016 – 2026 (US$ Mn)
9.5.2.2. Japan SC Market, by Type, 2016 – 2026 (US$ Mn)
9.5.2.3. Japan SC Market, by Deployment, 2016 – 2026 (US$ Mn)
9.5.3. India
9.5.3.1. India SC Market, by Size, 2016 – 2026 (US$ Mn)
9.5.3.2. India SC Market, by Type, 2016 – 2026 (US$ Mn)
9.5.3.3. India SC Market, by Deployment, 2016 – 2026 (US$ Mn)
9.5.4. Rest of Asia Pacific
9.5.4.1. Rest of Asia Pacific SC Market, by Size, 2016 – 2026 (US$ Mn)
9.5.4.2. Rest of Asia Pacific SC Market, by Type, 2016 – 2026 (US$ Mn)
9.5.4.3. Rest of Asia Pacific SC Market, by Deployment, 2016 – 2026 (US$ Mn)

10. Rest of World (RoW) Shipping Containers (SC) Market Analysis, 2016 – 2026 (US$ Mn)
10.1. Overview
10.1.1. RoW SC Market Value, 2016 – 2026, (US$ Mn)
10.2. RoW SC Market, by Size, 2016 – 2026 (US$ Mn)
10.2.1. Comparative Analysis
10.3. RoW SC Market, by Type, 2016 – 2026 (US$ Mn)
10.3.1. Comparative Analysis
10.4. RoW SC Market, by Deployment, 2016 – 2026 (US$ Mn)
10.4.1. Comparative Analysis
10.5. RoW SC Market Value, by Country, 2016 – 2026 (US$ Mn)
10.5.1. Middle East & Africa
10.5.1.1. Middle East & Africa SC Market, by Size, 2016 – 2026 (US$ Mn)
10.5.1.2. Middle East & Africa SC Market, by Type, 2016 – 2026 (US$ Mn)
10.5.1.3. Middle East & Africa SC Market, by Deployment, 2016 – 2026 (US$ Mn)
10.5.2. Latin America
10.5.2.1. Latin America SC Market, by Size, 2016 – 2026 (US$ Mn)
10.5.2.2. Latin America SC Market, by Type, 2016 – 2026 (US$ Mn)
10.5.2.3. Latin America SC Market, by Deployment, 2016 – 2026 (US$ Mn)

11. Company Profiles
11.1. Maersk Containers Industry AS
11.2. TLS Offshore Containerss International Pvt. Ltd.
11.3. China International Marine Containerss (Group) Ltd. (CIMC)
11.4. W&K Containerss Inc.
11.5. Singamas Containers Holdings Limited
11.6. YMC Containers Solutions
11.7. Sea Box Inc.
11.8. Dong Fang International Containers (Hong Kong) Co. Ltd
11.9. CXIC Group Containerss Company Limited
11.10. Storstac Inc.
11.11. Jindo Co. Ltd.
11.12. MSC Mediterranean Shipping Company S.A.

List of Figures

FIG. 1 Global Shipping Containers (SC) Market Segmentation
FIG. 2 Global SC Market: Research Methodology
FIG. 3 Top-Down and Bottom Up Approach
FIG. 4 Global SC Market Segmentation
FIG. 5 Global SC Market, by Size, 2017 (US$ Mn)
FIG. 6 Global SC Market, by Type, 2017 (US$ Mn)
FIG. 7 Global SC Market, by Deployment, 2017 (US$ Mn)
FIG. 8 Global SC Market, by Geography, 2017 (US$ Mn)
FIG. 9 Global SC Market Value, 2016 – 2026, (US$ Mn)
FIG. 10 See-Saw Analysis : Global SC Market
FIG. 11 Market Positioning of Key Industry Participants, 2017
FIG. 12 Global SC Market Value Contribution, by Size, 2017 & 2026 (Value %)
FIG. 13 Global Small (20 Feet) SC Market Value, 2016 – 2026, (US$ Mn)
FIG. 14 Global High (40 Feet) SC Market Value, 2016 – 2026, (US$ Mn)
FIG. 15 Global Hig Cube SC Market Value, 2016 – 2026, (US$ Mn)
FIG. 16 Global SC Market Value Contribution, by Type, 2017 & 2026 (Value %)
FIG. 17 Global Dry Containers SC Market Value, 2016 – 2026, (US$ Mn)
FIG. 18 Global Refrigerated SC Market Value, 2016 – 2026, (US$ Mn)
FIG. 19 Global Tank SC Market Value, 2016 – 2026, (US$ Mn)
FIG. 20 Global Others SC Market Value, 2016 – 2026, (US$ Mn)
FIG. 21 Global SC Market Value Contribution, by Deployment, 2017 & 2026 (Value %)
FIG. 22 Global SC Market Value for On-shore Containers, 2016 – 2026, (US$ Mn)
FIG. 23 Global SC Market Value for Off-shore Containers, 2016 – 2026, (US$ Mn)
FIG. 24 North America SC Market Value, 2016 – 2026, (US$ Mn)
FIG. 25 U.S. SC Market Value, 2016 – 2026, (US$ Mn)
FIG. 26 Canada SC Market Value, 2016 – 2026, (US$ Mn)
FIG. 27 Europe SC Market Value, 2016 – 2026, (US$ Mn)
FIG. 28 U.K. SC Market Value, 2016 – 2026, (US$ Mn)
FIG. 29 Germany SC Market Value, 2016 – 2026, (US$ Mn)
FIG. 30 France SC Market Value, 2016 – 2026, (US$ Mn)
FIG. 31 Rest of Europe SC Market Value, 2016 – 2026, (US$ Mn)
FIG. 32 Asia Pacific SC Market Value, 2016 – 2026, (US$ Mn)
FIG. 33 China SC Market Value, 2016 – 2026, (US$ Mn)
FIG. 34 Japan SC Market Value, 2016 – 2026, (US$ Mn)
FIG. 35 India SC Market Value, 2016 – 2026, (US$ Mn)
FIG. 36 Rest of Asia Pacific SC Market Value, 2016 – 2026, (US$ Mn)
FIG. 37 RoW SC Market Value, 2017– 2026, (US$ Mn)
FIG. 38 Middle East & Africa SC Market Value, 2017– 2026, (US$ Mn)
FIG. 39 Latin America SC Market Value, 2017– 2026, (US$ Mn)

List of Tables

TABLE 1 Market Snapshot: Global Shipping Containers (SC) Market
TABLE 2 Impact Indicators
TABLE 3 Impact Analysis of Drivers and Restraints
TABLE 4 North America SC Market Value, by Size, 2016 – 2026 (US$ Mn)
TABLE 5 North America SC Market Value, by Type, 2016 – 2026 (US$ Mn)
TABLE 5 North America SC Market Value, by Deployment, 2016 – 2026 (US$ Mn)
TABLE 6 North America SC Market Value, by Country, 2016 – 2026 (US$ Mn)
TABLE 7 U.S. SC Market Value, by Size, 2016 – 2026 (US$ Mn)
TABLE 8 U.S. SC Market Value, by Type, 2016 – 2026 (US$ Mn)
TABLE 9 U.S. SC Market Value, by Deployment, 2016 – 2026 (US$ Mn)
TABLE 10 Canada SC Market Value, by Size, 2016 – 2026 (US$ Mn)
TABLE 11 Canada SC Market Value, by Type, 2016 – 2026 (US$ Mn)
TABLE 12 Canada SC Market Value, by Deployment, 2016 – 2026 (US$ Mn)
TABLE 13 Europe SC Market Value, by Size, 2016 – 2026 (US$ Mn)
TABLE 14 Europe SC Market Value, by Type, 2016 – 2026 (US$ Mn)
TABLE 15 Europe SC Market Value, by Deployment, 2016 – 2026 (US$ Mn)
TABLE 16 Europe SC Market Value, by Country, 2016 – 2026 (US$ Mn)
TABLE 17 U.K. SC Market Value, by Size, 2016 – 2026 (US$ Mn)
TABLE 18 U.K. SC Market Value, by Type, 2016 – 2026 (US$ Mn)
TABLE 19 U.K. SC Market Value, by Deployment, 2016 – 2026 (US$ Mn)
TABLE 20 Germany SC Market Value, by Size, 2016 – 2026 (US$ Mn)
TABLE 21 Germany SC Market Value, by Type, 2016 – 2026 (US$ Mn)
TABLE 22 Germany SC Market Value, by Deployment, 2016 – 2026 (US$ Mn)
TABLE 23 France SC Market Value, by Size, 2016 – 2026 (US$ Mn)
TABLE 24 France SC Market Value, by Type, 2016 – 2026 (US$ Mn)
TABLE 25 France SC Market Value, by Deployment, 2016 – 2026 (US$ Mn)
TABLE 26 Rest of Europe SC Market Value, by Size, 2016 – 2026 (US$ Mn)
TABLE 27 Rest of Europe SC Market Value, by Type, 2016 – 2026 (US$ Mn)
TABLE 28 Rest of Europe SC Market Value, by Deployment, 2016 – 2026 (US$ Mn)
TABLE 29 Asia Pacific SC Market Value, by Size, 2016 – 2026 (US$ Mn)
TABLE 30 Asia Pacific SC Market Value, by Type, 2016 – 2026 (US$ Mn)
TABLE 31 Asia Pacific SC Market Value, by Deployment, 2016 – 2026 (US$ Mn)
TABLE 32 Asia Pacific SC Market Value, by Country, 2016 – 2026 (US$ Mn)
TABLE 33 China SC Market Value, by Size, 2016 – 2026 (US$ Mn)
TABLE 34 China SC Market Value, by Type, 2016 – 2026 (US$ Mn)
TABLE 35 China SC Market Value, by Deployment, 2016 – 2026 (US$ Mn)
TABLE 36 Japan SC Market Value, by Size, 2016 – 2026 (US$ Mn)
TABLE 37 Japan SC Market Value, by Type, 2016 – 2026 (US$ Mn)
TABLE 38 Japan SC Market Value, by Deployment, 2016 – 2026 (US$ Mn)
TABLE 39 India SC Market Value, by Size, 2016 – 2026 (US$ Mn)
TABLE 40 India SC Market Value, by Type, 2016 – 2026 (US$ Mn)
TABLE 41 India SC Market Value, by Type, 2016 – 2026 (US$ Mn)
TABLE 42 Rest of Asia Pacific SC Market Value, by Size, 2016 – 2026 (US$ Mn)
TABLE 43 Rest of Asia Pacific SC Market Value, by Type, 2016 – 2026 (US$ Mn)
TABLE 44 Rest of Asia Pacific SC Market Value, by Deployment, 2016 – 2026 (US$ Mn)
TABLE 45 Rest of World SC Market Value, by Size, 2016 – 2026 (US$ Mn)
TABLE 46 Rest of World SC Market Value, by Type, 2016 – 2026 (US$ Mn)
TABLE 47 Rest of World SC Market Value, by Deployment, 2016 – 2026 (US$ Mn)
TABLE 48 Rest of World SC Market Value, by Region, 2016 – 2026 (US$ Mn)
TABLE 49 Middle East & Africa SC Market Value, by Size, 2016 – 2026 (US$ Mn)
TABLE 50 Middle East & Africa SC Market Value, by Type, 2016 – 2026 (US$ Mn)
TABLE 51 Middle East & Africa SC Market Value, by Deployment, 2016 – 2026 (US$ Mn)
TABLE 52 Latin America SC Market Value, by Size, 2016 – 2026 (US$ Mn)
TABLE 53 Latin America SC Market Value, by Type, 2016 – 2026 (US$ Mn)
TABLE 54 Latin America SC Market Value, by Deployment, 2016 – 2026 (US$ Mn)
TABLE 55 Maersk Containers Industry AS: Company Snapshot (Company Details, Geographical Presence, Product Portfolio, Key Industries Served, Recent Developments)
TABLE 56 TLS Offshore Containerss International Pvt. Ltd.: Company Snapshot (Company Details, Geographical Presence, Product Portfolio, Key Industries Served, Recent Developments)
TABLE 57 China International Marine Containerss (Group) Ltd. (CIMC): Company Snapshot (Company Details, Geographical Presence, Product Portfolio, Key Industries Served, Recent Developments)
TABLE 58 W&K Containerss Inc.: Company Snapshot (Company Details, Geographical Presence, Product Portfolio, Key Industries Served, Recent Developments)
TABLE 59 Singamas Containers Holdings Limited: Company Snapshot (Company Details, Geographical Presence, Product Portfolio, Key Industries Served, Recent Developments)
TABLE 60 YMC Containers Solutions: Company Snapshot (Company Details, Geographical Presence, Product Portfolio, Key Industries Served, Recent Developments)
TABLE 61 Sea Box Inc.: Company Snapshot (Company Details, Geographical Presence, Product Portfolio, Key Industries Served, Recent Developments)
TABLE 62 Dong Fang International Containers (Hong Kong) Co. Ltd.: Company Snapshot (Company Details, Geographical Presence, Product Portfolio, Key Industries Served, Recent Developments)
TABLE 63 CXIC Group Containerss Company Limited: Company Snapshot (Company Details, Geographical Presence, Product Portfolio, Key Industries Served, Recent Developments)
TABLE 64 Storstac Inc.: Company Snapshot (Company Details, Geographical Presence, Product Portfolio, Key Industries Served, Recent Developments)
TABLE 65 Jindo Co. Ltd.: Company Snapshot (Company Details, Geographical Presence, Product Portfolio, Key Industries Served, Recent Developments)
TABLE 66 MSC Mediterranean Shipping Company S.A.: Company Snapshot (Company Details, Geographical Presence, Product Portfolio, Key Industries Served, Recent Developments)

Frequently Asked Questions:

What is the size of Shipping Containers Market?

The market for Shipping Containers Market is expected to reach US$ XX Bn By 2026.

What is the Shipping Containers Market CAGR?

The Shipping Containers Market is expected to see significant CAGR growth over the coming years, at XX%.

What is the Forecast period considered for Shipping Containers Market?

The report is forecasted from 2018-2026.

What is the base year considered for Shipping Containers Market?

The base year of this report is 2017.

Who are the major players in this market?

Singamas Container Holdings Limited, YMC Container Solutions, Sea Box Inc., Dong Fang International Container (Hong Kong) Co. Ltd., CXIC Group Containers Company Limited, Storstac Inc. are some of the major players in the global market.

Airless Tires Market

Published:
Report ID: 1175

Singapore Electric Vehicle (EV) Market

Published:
Report ID: 35964

Asia Pacific Automotive Infotainment Systems Market

Published:
Report ID: 35958

Peer-To-Peer Electric Vehicle Charging Market

Published:
Report ID: 9059

Japan Tire Market

Published:
Report ID: 32634

Automotive Steel Wheels Market

Published:
Report ID: 35559

Automotive Alloy Wheels Market

Published:
Report ID: 35549

Automotive Active Safety System Market

Published:
Report ID: 35497

Driving Apparel Market

Published:
Report ID: 35443

Automotive Air Filters Market

Published:
Report ID: 16439

Personal Watercraft (PWC) Market

Published:
Report ID: 34935

X-ray Tire Inspection System Market

Published:
Report ID: 9315

Purchase Options

$2999
Delivery Format: Excel.
$4999
Designed for the individual purchaser.
$6999
Users located at a single corporate site or regional office.
$7999
Allowed for unlimited sharing globally within one company.
Smallform of Sample request

Have a question?

User Profile

Don’t settle for less – trust Mitul to help you find the best solution.

Report delivery within 24 to 48 hours

– Other Info –

What people say?-

User Review

I am very impressed with the information in this report. The author clearly did their research when they came up with this product and it has already given me a lot of ideas.

Jana Schmidt
CEDAR CX Technologies

– Connect with us –

Phone

+91 6232 49 3207


support

24/7 Research Support


sales@credenceresearch.com

– Research Methodology –

Going beyond the basics: advanced techniques in research methodology

– Trusted By –

Pepshi, LG, Nestle
Motorola, Honeywell, Johnson and johnson
LG Chem, SIEMENS, Pfizer
Unilever, Samsonite, QIAGEN