
Registered business texting becomes core U.S. infrastructure
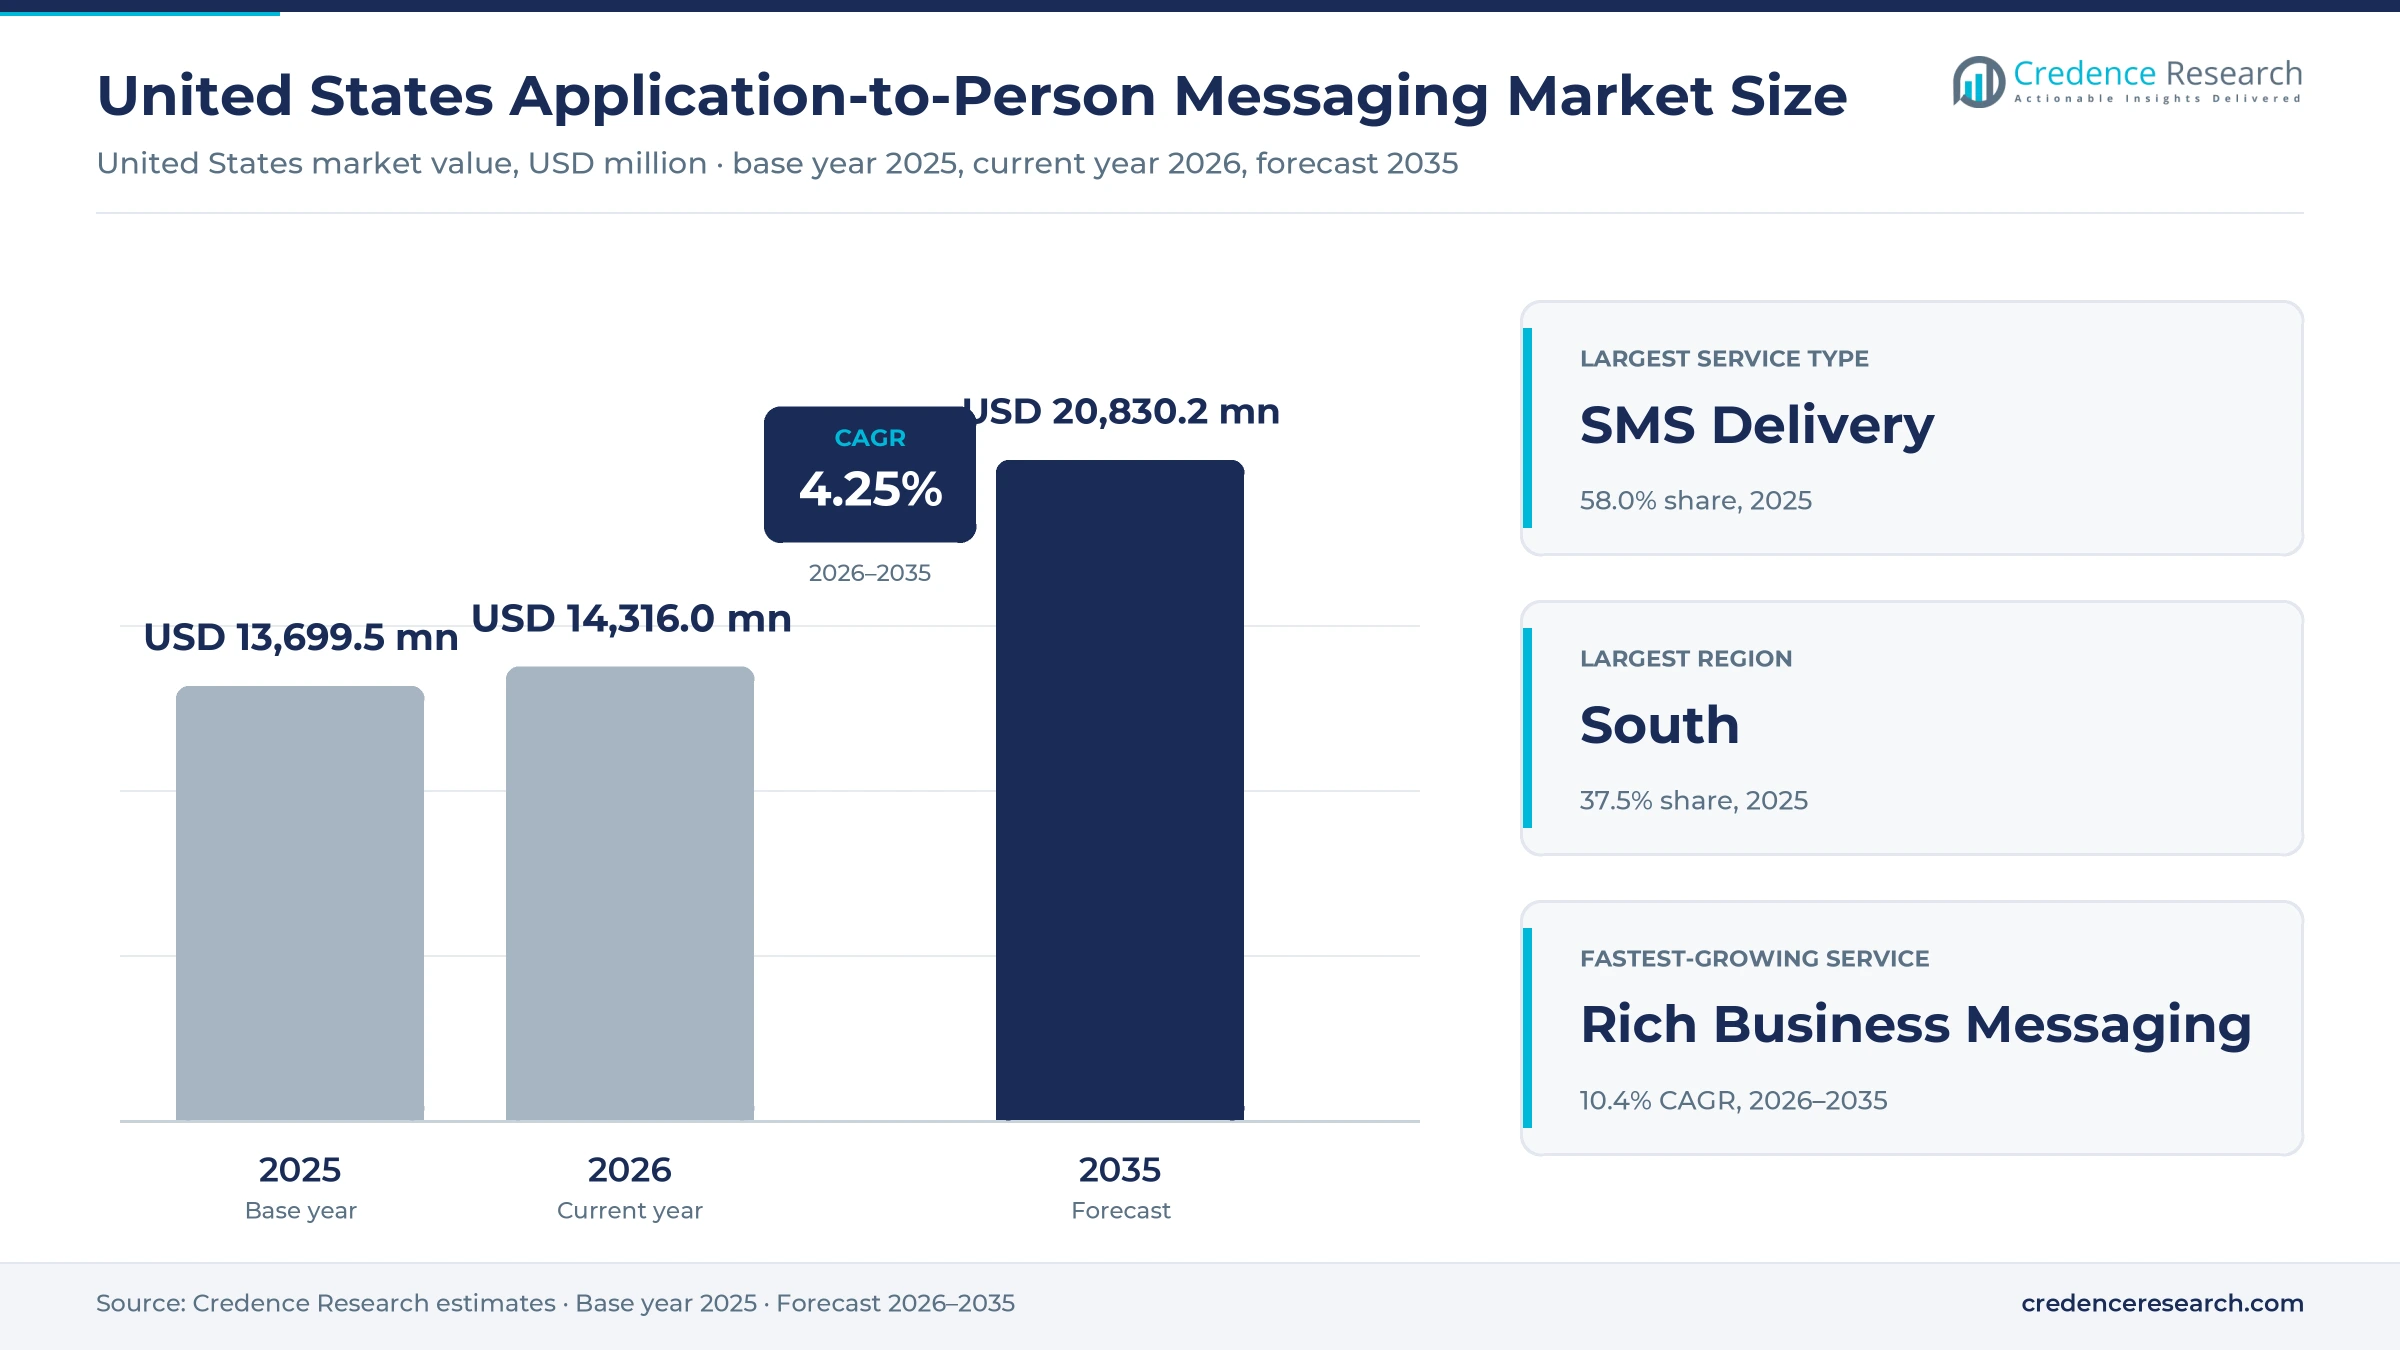
The United States application-to-person messaging market was valued at USD 13.70 billion in 2025 and is projected to increase from USD 14.32 billion in 2026 to USD 20.83 billion by 2035, registering a CAGR of 4.25% during 2026–2035. Demand comes from retailers, banks, health systems and software platforms that send order alerts, login codes, appointment reminders and consented promotions from registered numbers. The South held the largest regional share, 37.5% in 2025, and it is also the fastest-growing region at 4.5% a year as its population and sender base expand. SMS still carries most traffic and value, while branded RCS threads grow fastest after all major national carriers enabled business RCS during 2025. Costs also shifted in 2026, when two national carriers raised the per-message surcharges that every sender pays on top of provider fees.
Usage fees, carrier surcharges and sender platforms form spending
The market counts what U.S. businesses and public bodies pay to send automated messages from software to mobile subscribers, including SMS, MMS and RCS business messages, carrier surcharges, number and short code leases, and the platforms used to register senders, manage consent and run campaigns. Buyers pay through usage-based API billing, subscriptions bundled with message credits or fixed enterprise contracts.
Person-to-person texting between subscribers, consumer chat apps and voice services are outside the scope. The value chain runs from brands and software vendors through messaging providers and aggregators to the national wireless carriers, which deliver the message and set the surcharge for each one.
United States Application-to-Person Messaging Market Insights
- The United States application-to-person messaging market grows from USD 13.70 billion in 2025 to USD 20.83 billion by 2035 at a 4.25% CAGR as alerts, codes and rich threads spread.
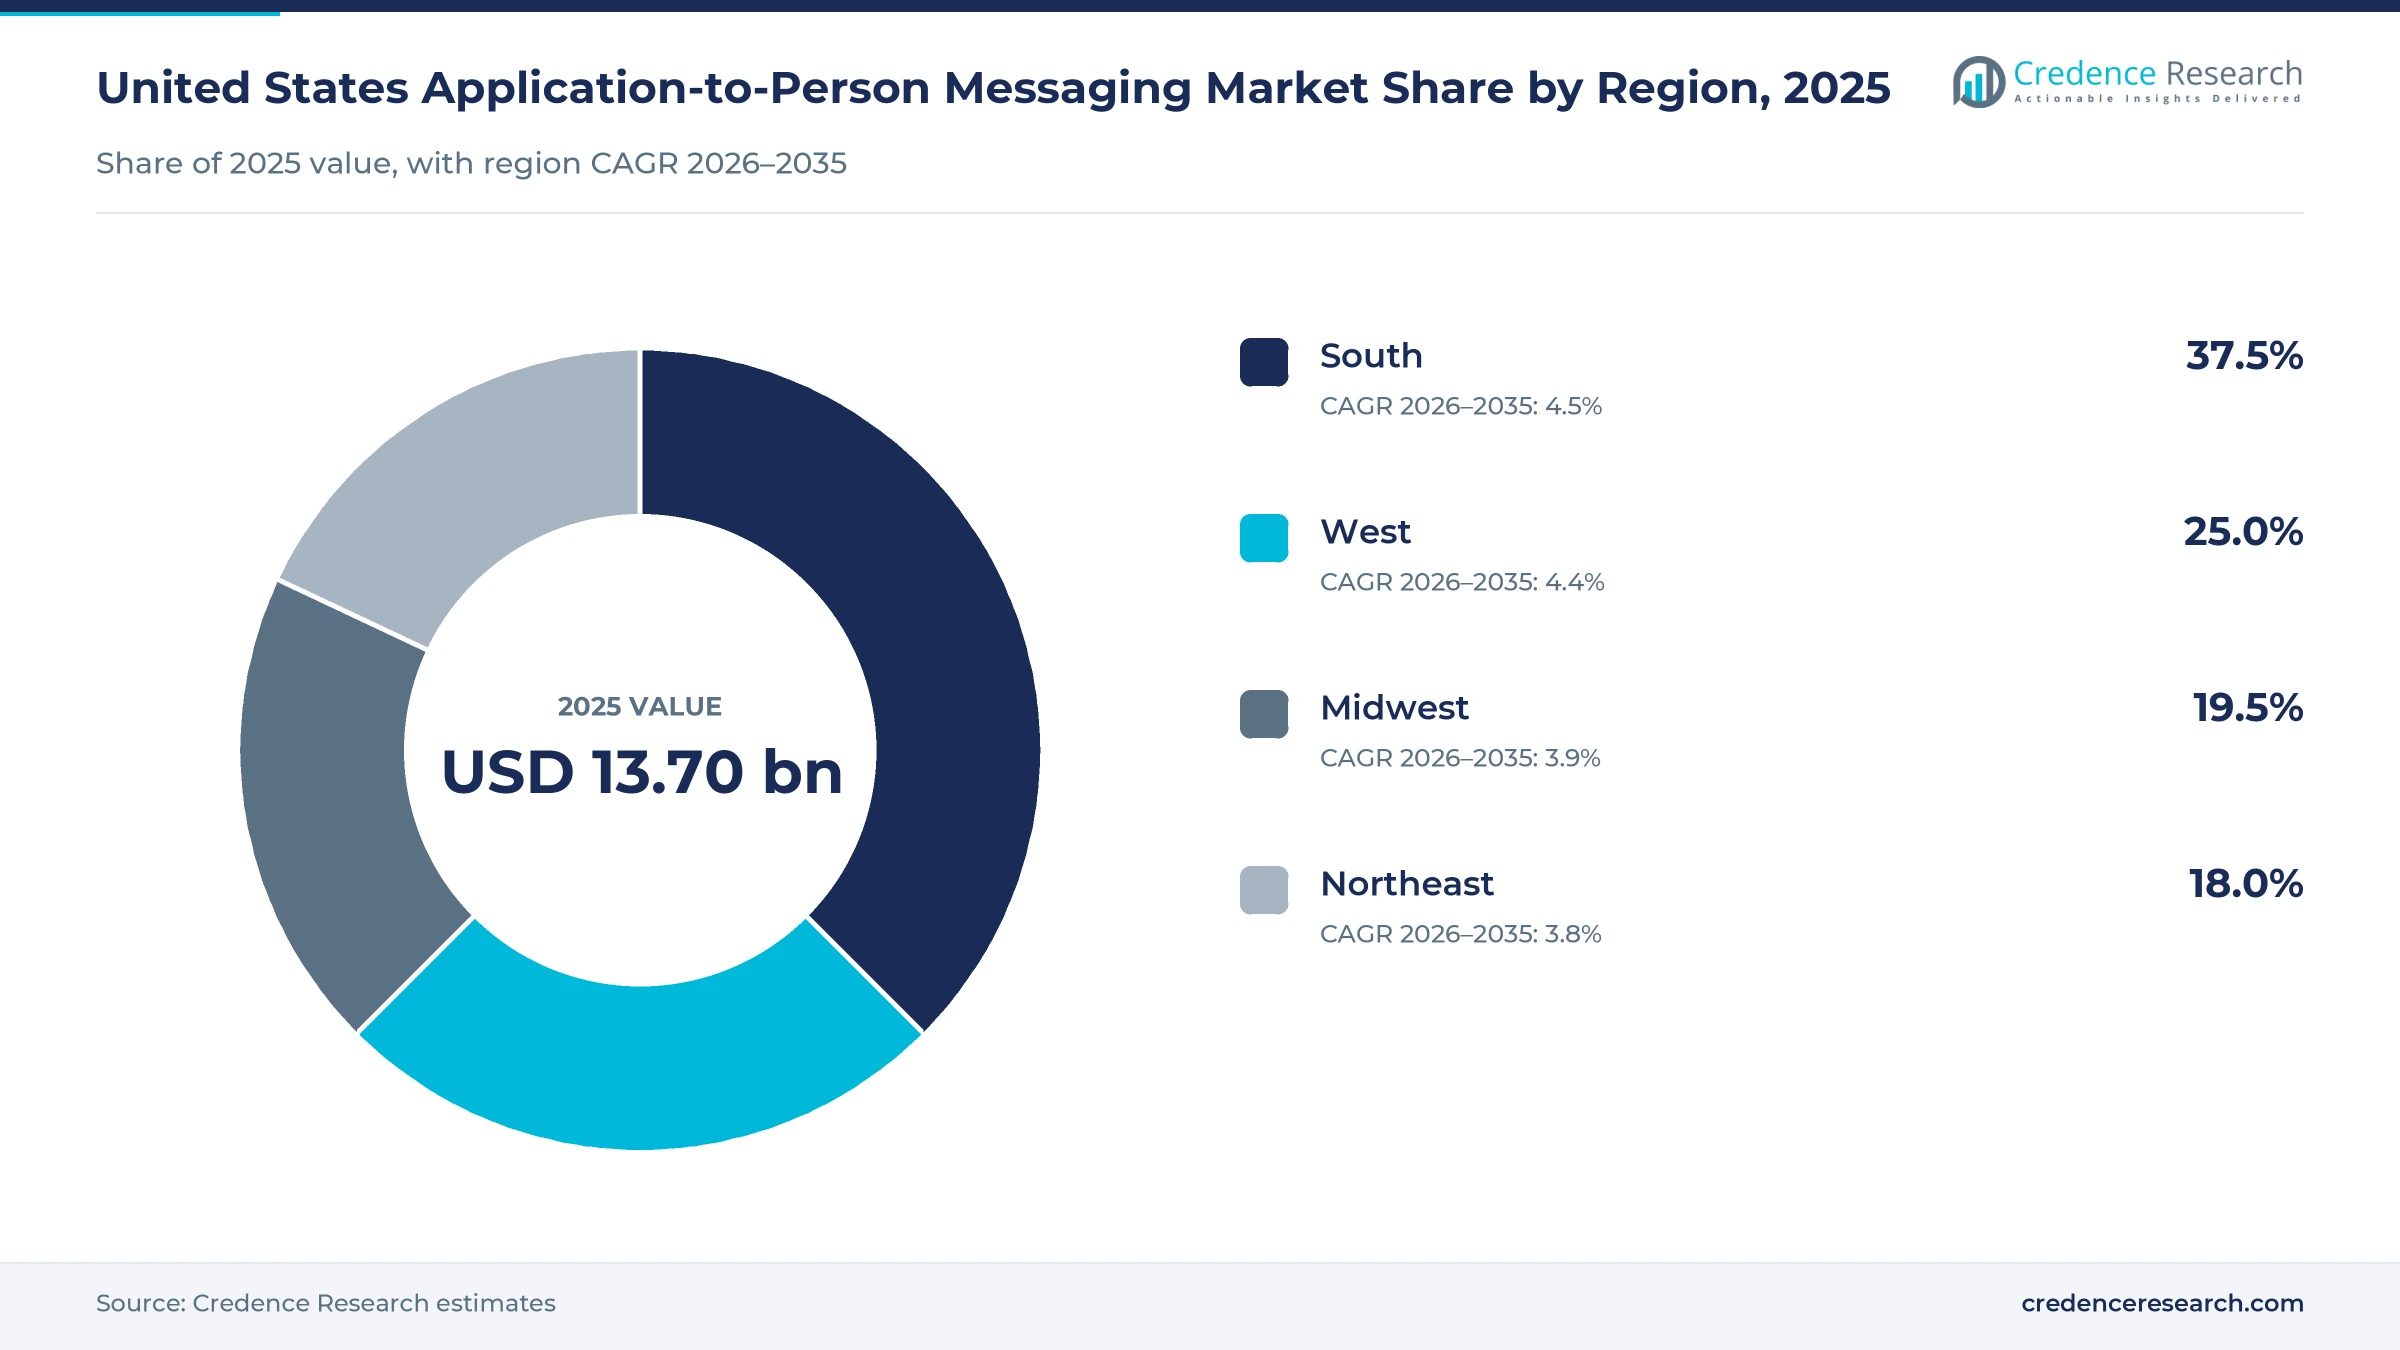
- The South held the largest regional share at 37.5% in 2025 and grows fastest at 4.5% a year, in line with its leading population growth.
- SMS delivery led with 58.0% of 2025 value, while rich business messaging grows fastest at 10.4% a year.
- T-Mobile raised its outbound SMS surcharge to USD 0.0045 in January 2026 and AT&T raised its 10DLC SMS surcharge to USD 0.0035 on April 1, 2026.
- Twilio completed its acquisition of identity platform Stytch on Nov. 14, 2025, linking login codes with wider identity services.
SMS keeps most value as branded RCS grows fastest
SMS delivery holds most value as RCS grows fastest
Based on service type, the market is categorized into SMS delivery, MMS delivery, rich business messaging and platform and compliance services. SMS Delivery led with 58.0% of 2025 value because it is the only business channel that reaches every U.S. handset, so login codes and delivery alerts default to it and RCS campaigns keep it as the fallback. Rich Business Messaging grows fastest at 10.4% a year as Infobip reported in June 2025 that RCS usage grew 500% year on year in its trend data. RCS still starts from a small base, so most senders run it beside SMS fallback.
Transactional alerts lead while promotions grow fastest
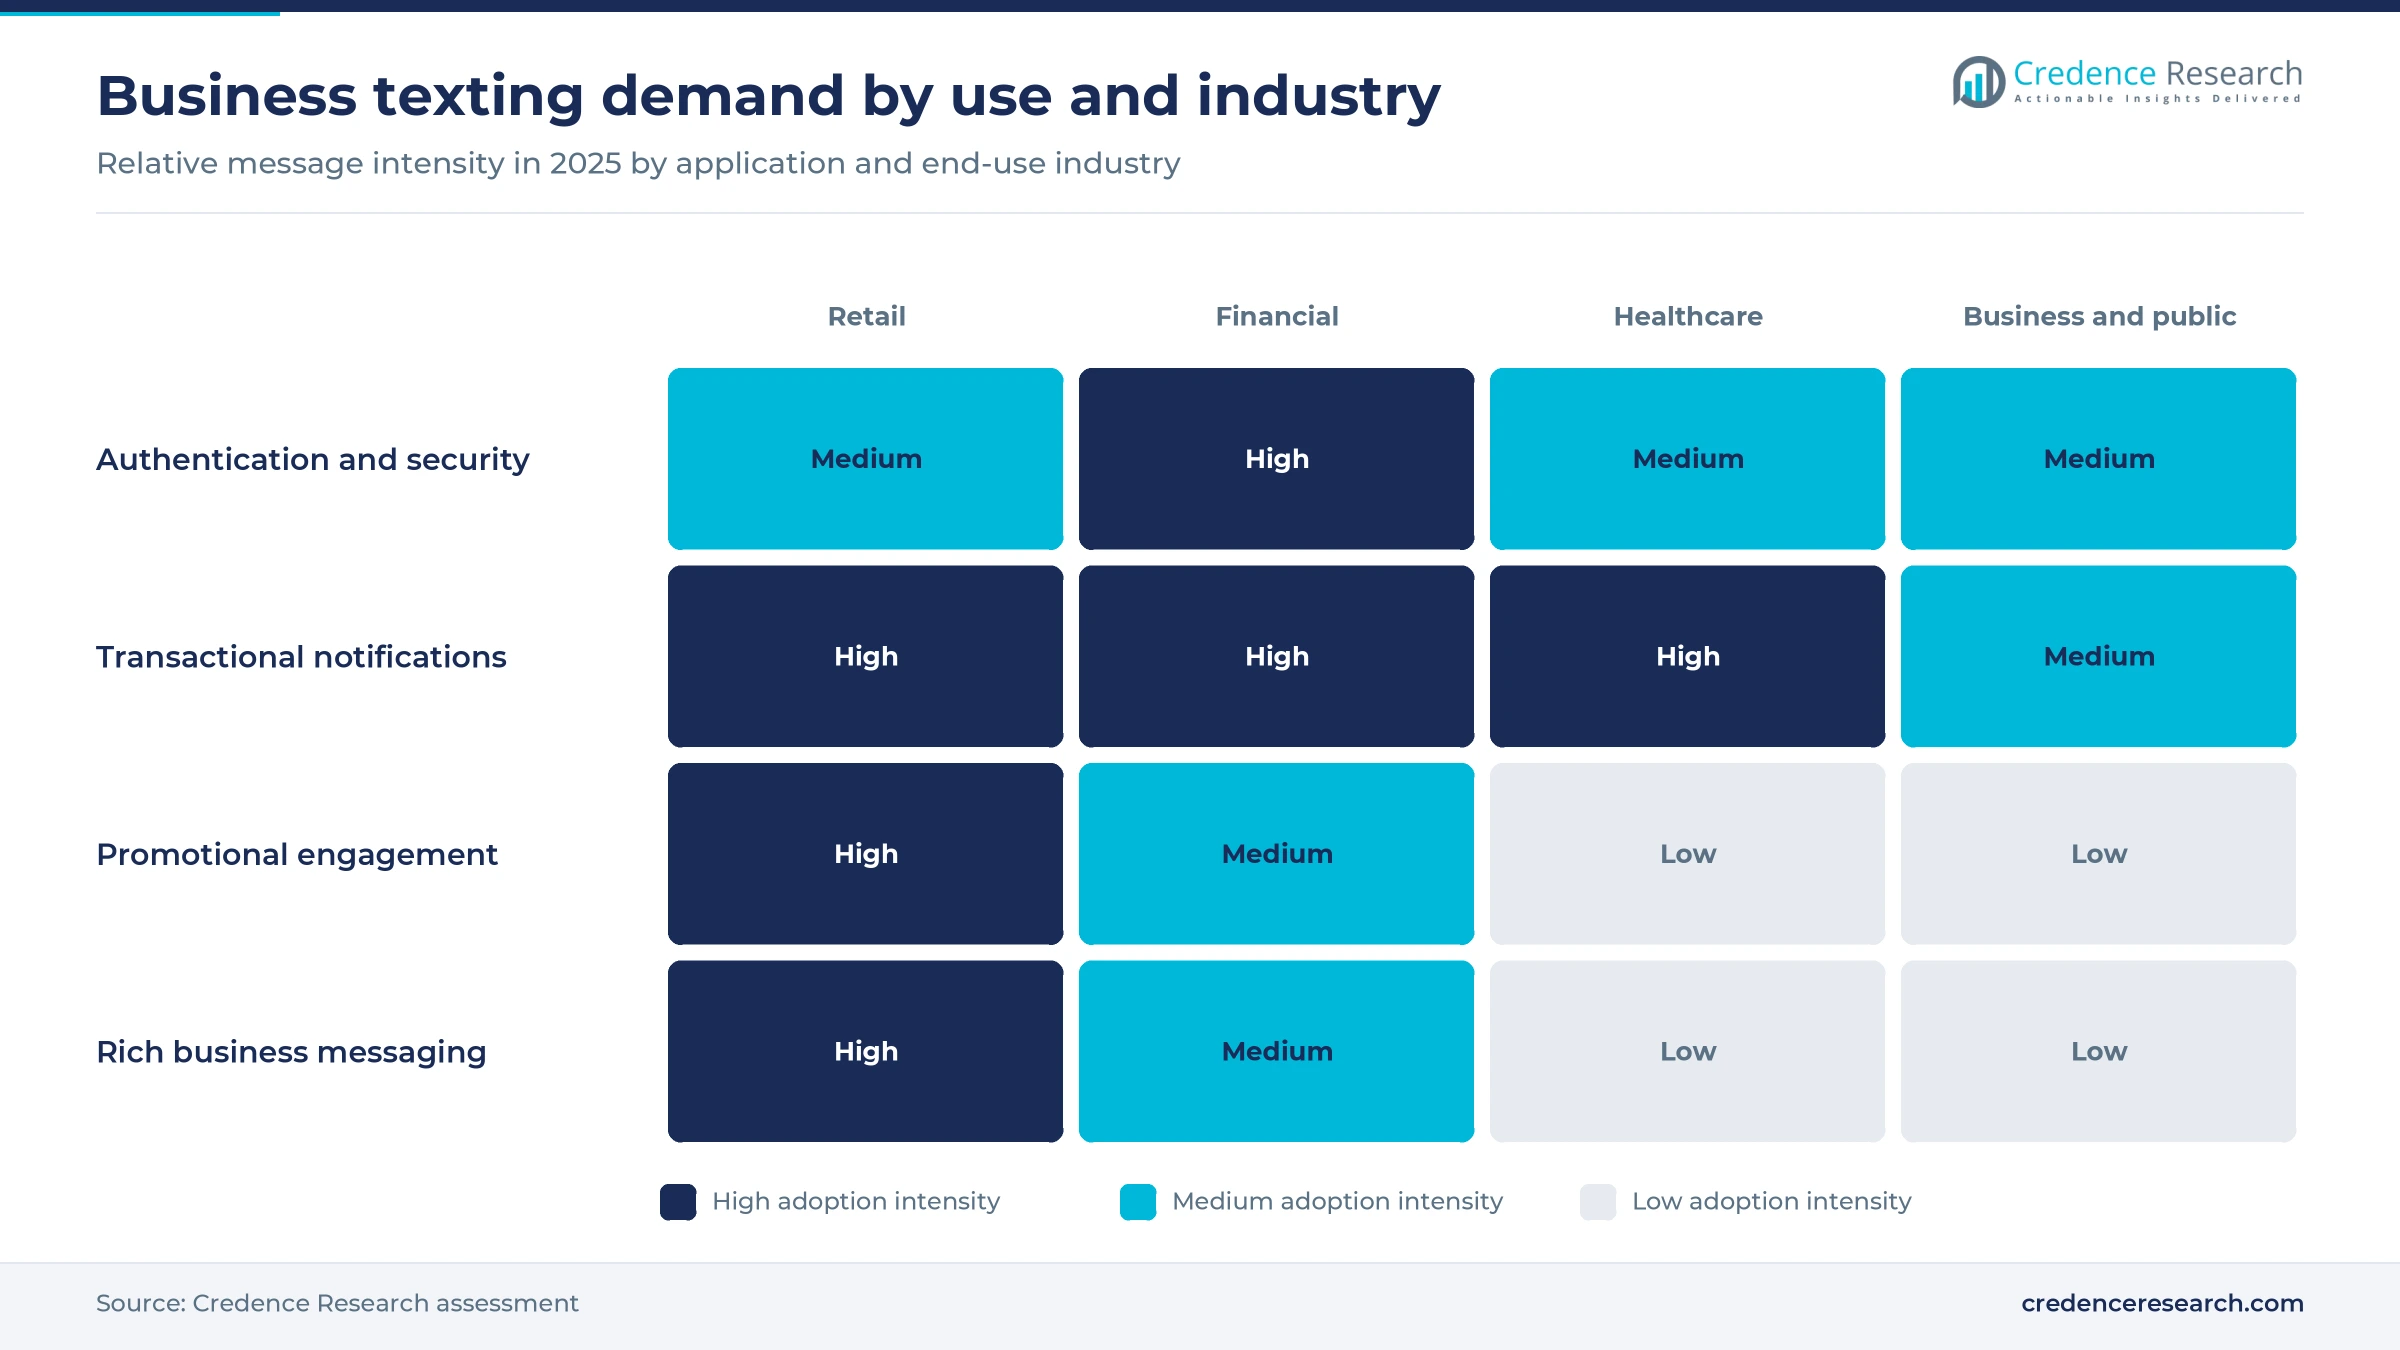
Based on application, the market is categorized into authentication and security, transactional notifications and promotional engagement. Transactional Notifications led with 41.0% of 2025 value because order, delivery, payment and appointment alerts recur with every transaction, so their volume tracks retail and service activity rather than marketing budgets. Promotional Engagement grows fastest at 5.1% a year, as Attentive sent 5.7 billion messages for more than 8,000 brands in Cyber Week 2025, up 46% from a year earlier. Marketing texts carry higher margins than alerts, so platforms compete hardest for them.
Retail leads as healthcare texting grows fastest
Based on end-use industry, the market is categorized into retail and e-commerce, financial services, healthcare and life sciences, and business and public services. Retail and E-Commerce led with 33.0% of 2025 value because every online order triggers confirmation, shipping and delivery texts, and online sales reached 17.1% of U.S. retail sales in the second quarter of 2026. Healthcare and Life Sciences grows fastest at 5.0% a year, as 90% of patients preferred texts for healthcare communication in a Sinch survey of 1,000 U.S. patients published in January 2026. Providers that offer two-way texting therefore keep patients who would otherwise switch.
Strategic accounts lead while small senders grow fastest
Based on customer type, the market is categorized into strategic accounts, mid-market accounts and small-business accounts. Strategic Accounts led with 46.0% of 2025 value because large banks, retailers and technology firms send the most traffic, and Sinch says it is trusted by 8 of the 10 largest U.S. technology companies. Small-Business Accounts grow fastest at 4.9% a year as Twilio counted 402,000 active customer accounts at the end of 2025, up from 325,000 a year earlier. Small senders pay list prices rather than negotiated rates, which keeps their spend per message higher.
| Segment Group | Leading Sub-segment | Share, 2025 | Fastest-growing Sub-segment | CAGR, 2026–2035 |
|---|---|---|---|---|
| By Service Type | SMS Delivery | 58.0% | Rich Business Messaging | 10.4% |
| By Application | Transactional Notifications | 41.0% | Promotional Engagement | 5.1% |
| By End-Use Industry | Retail and E-Commerce | 33.0% | Healthcare and Life Sciences | 5.0% |
| By Customer Type | Strategic Accounts | 46.0% | Small-Business Accounts | 4.9% |
U.S. senders pay about USD 0.008 a text plus carrier fees
U.S. business texting is priced in two separate layers by providers and carriers. Providers charge a per-message rate that falls with volume, and the carrier adds a surcharge per segment that the provider passes through on the invoice. Surcharges are the part that moved most in 2026, because T-Mobile and AT&T both raised them, while list rates held steady. Short codes add a fixed monthly lease, and platforms charge extra for link tracking and compliance checks. Large senders therefore negotiate provider rates but cannot avoid the carrier layer.
| Offer or fee | Typical price or fee | Basis |
|---|---|---|
| Outbound SMS, long code, toll-free or short code (Twilio) | USD 0.0083 per message | Twilio lists, November 2026 |
| Outbound MMS (Twilio) | USD 0.022 per message | Twilio lists, November 2026 |
| T-Mobile outbound SMS surcharge, 10DLC, short code and toll-free | USD 0.0045 per message, up from USD 0.0030 or USD 0.0025 | Twilio carrier notice, January 2026 |
| AT&T 10DLC surcharge, SMS and MMS | USD 0.0035 per SMS and USD 0.0090 per MMS | Bandwidth carrier notice, effective April 1, 2026 |
| Short code lease | USD 500 a month random, USD 1,000 a month selected | U.S. Short Code Registry lists, November 2026 |
| Compliance or engagement add-on (Twilio) | USD 0.015 per message | Twilio lists, November 2026 |
Request a Free Sample
Fill in your details and we'll send you a free sample report.
- Sample data tables & charts
- Research methodology
Alerts, RCS reach and formal consent widen the base
Order, payment and care alerts move into texts
Operational notifications are the steadiest source of volume because they are tied to transactions that businesses must confirm anyway. The Census Bureau estimated that e-commerce sales rose 12.2% in the second quarter of 2026 from a year earlier, and each online order typically creates confirmation, shipping and delivery texts. In healthcare, 97% of patients in the Sinch survey wanted appointment reminders by text and 81% wanted prescription refill updates, while 84% said a text reminder makes them more likely to attend an appointment. Senders that wire alerts directly into order and scheduling systems create recurring traffic that does not depend on marketing budgets.
RCS now reaches Apple devices and every national carrier
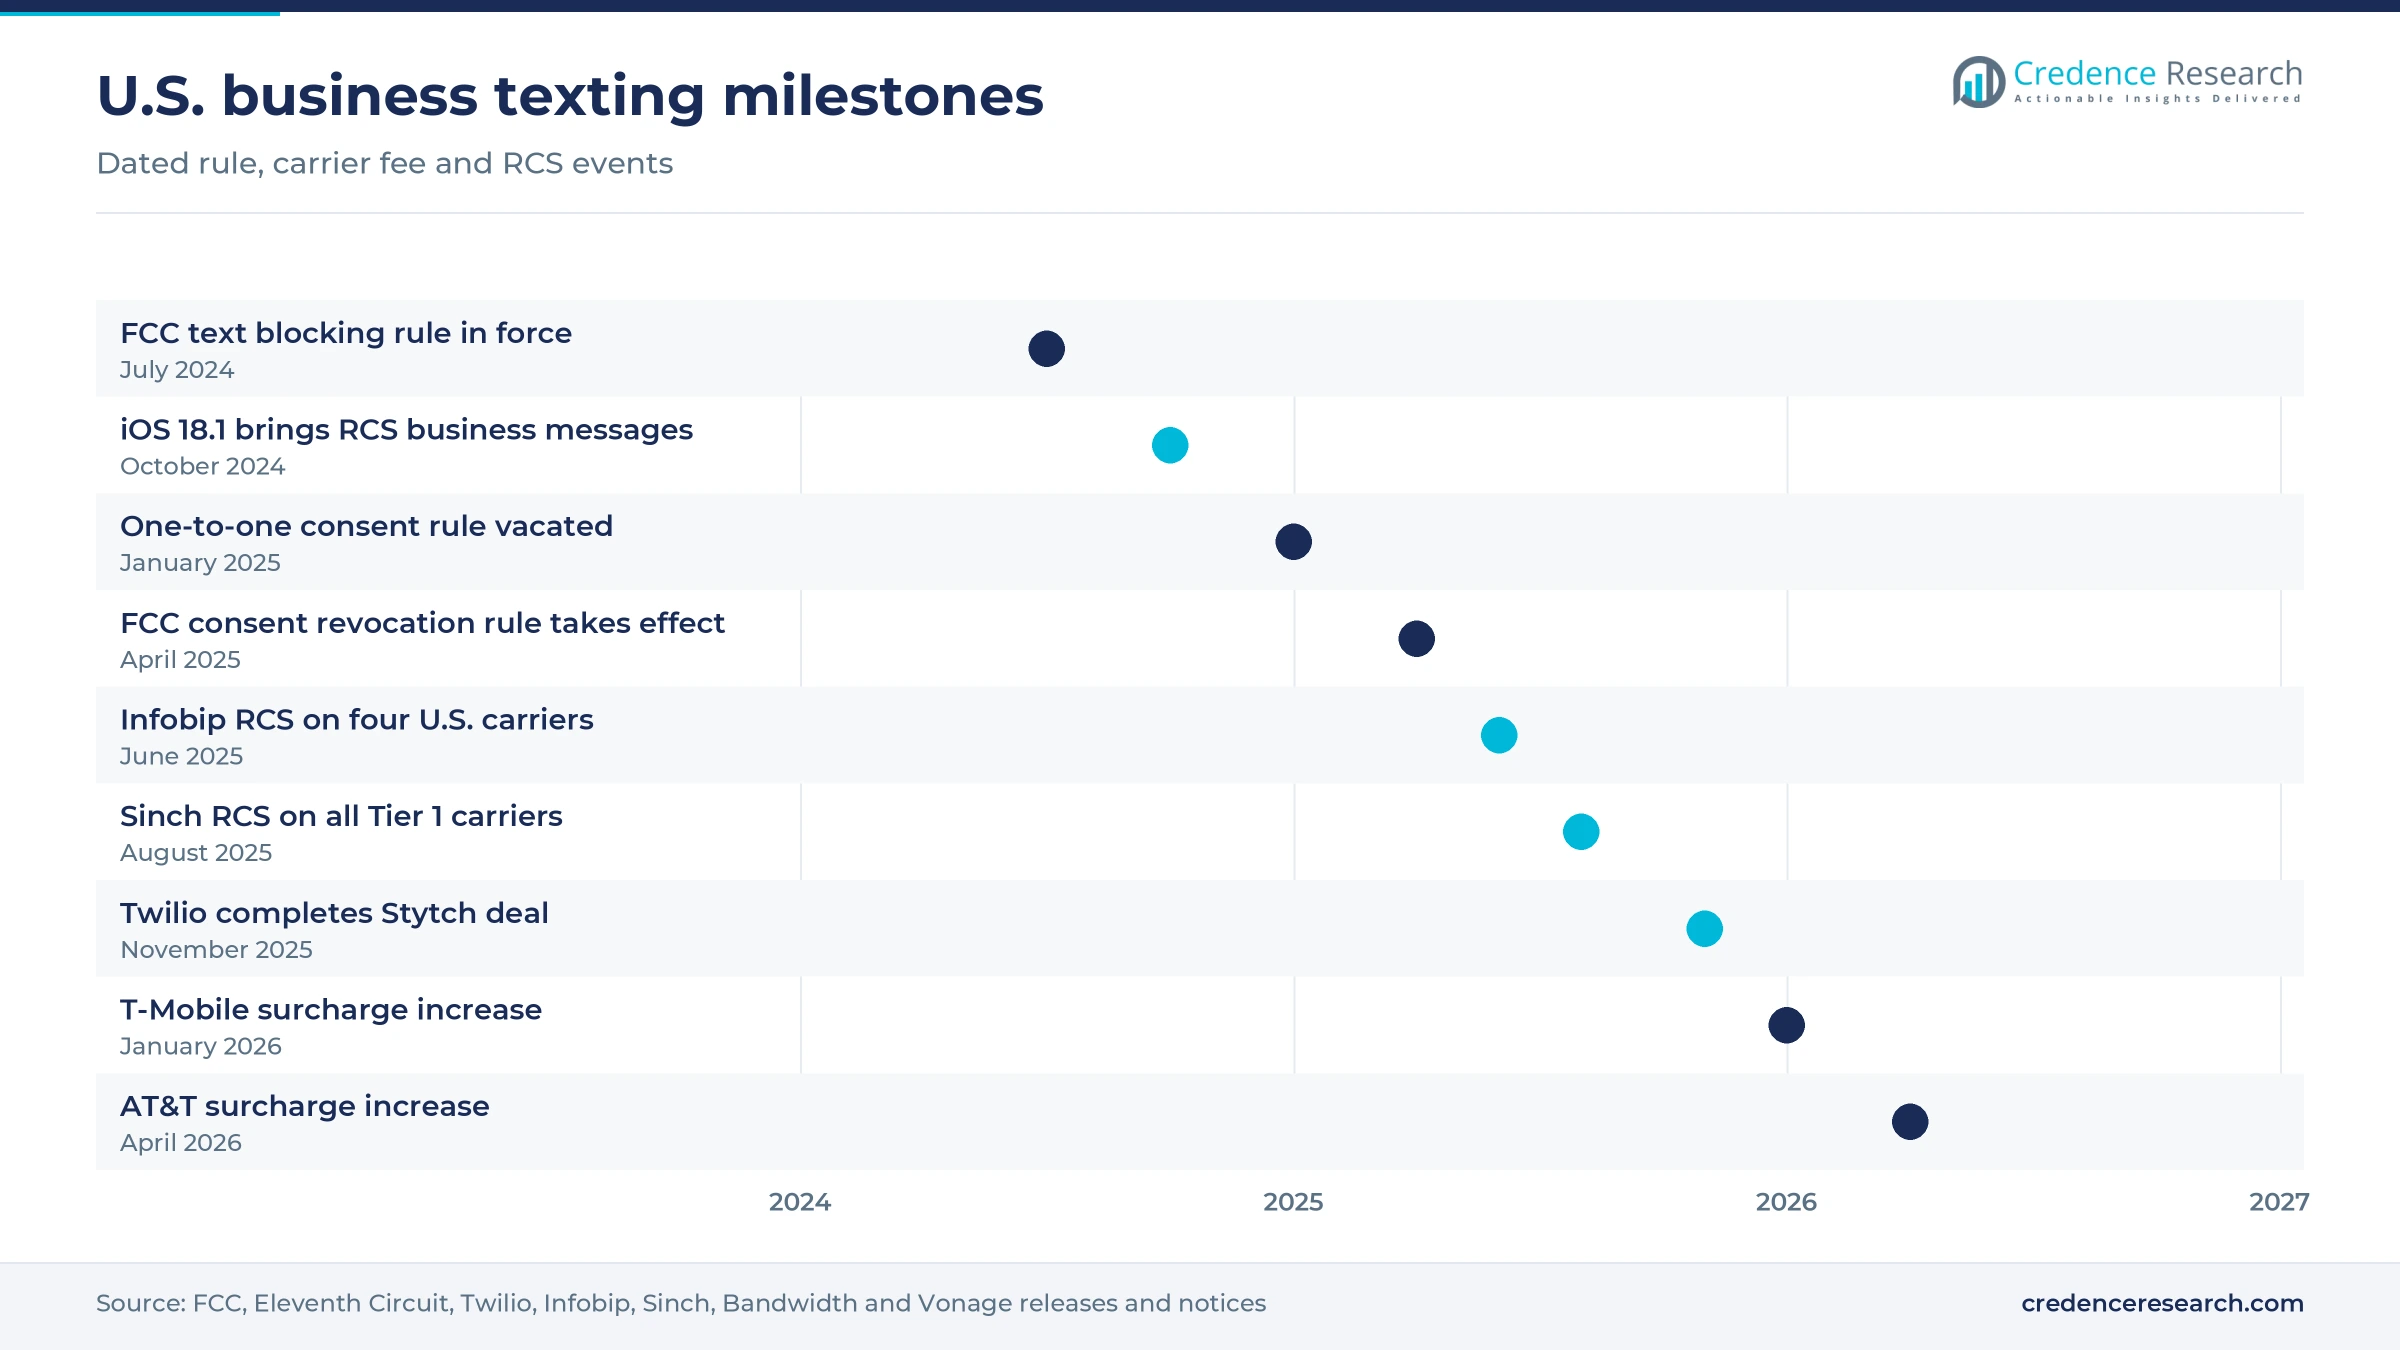
Rich messaging became a practical U.S. channel once both major phone platforms and all national carriers supported it. Apple released iOS 18.1 on Oct. 28, 2024, which let iPhone users receive RCS business messages, according to Twilio. Infobip launched RCS with all four major U.S. carriers on June 17, 2025, and Sinch said on Aug. 18, 2025 that RCS reaches up to 75% of handsets among its customers after going live with every Tier 1 operator. Bandwidth reported in February 2025 that 66% of businesses plan to increase their messaging once RCS is widely available. Brands can now send verified, branded threads with images and buttons at national scale.
Federal consent rules push senders onto registered routes
Formal consent and sender registration are turning business texting into a regulated, auditable channel, which favors established providers. The FCC order published on Jan. 26, 2024 extended Do-Not-Call protections to texts from March 26, 2024 and required carriers to block numbers flagged by its Enforcement Bureau from July 24, 2024. The Eleventh Circuit vacated the separate one-to-one consent rule on Jan. 24, 2025, so lead-generated consent remains possible. The rest of the FCC consent revocation order took effect on April 11, 2025, so senders must honor opt-outs by any reasonable means. Carriers now require 10DLC brand and campaign registration, and Twilio applies onboarding fees to it. Senders that keep clean consent records gain delivery, while unregistered traffic is filtered.
Login codes and identity checks keep volumes steady
Authentication traffic is a durable driver because banks, retailers and apps still send one-time codes at sign-up, login and payment. Twilio describes its Verify product as multi-channel user verification that sends one-time passwords over SMS, voice and email, and it includes Fraud Guard to block artificially inflated traffic. Twilio completed its acquisition of identity platform Stytch on Nov. 14, 2025, according to its 2025 annual report. Sinch says it powers more than 900 billion customer engagements a year across channels, many of them codes and alerts. Code traffic grows with account sign-ups even as apps add passkeys and multi-factor authentication options, because SMS remains the fallback that works on every phone.
Branded threads and AI-run campaigns change the channel
Branded RCS threads lift returns on retail campaigns
Retailers are shifting part of their campaign traffic from plain SMS to branded RCS because early tests show higher returns per message. Attentive launched Visibility AI for RCS on May 20, 2026 and reported that branded RCS threads lifted click-through rates by 45% and revenue per send by 36% against SMS in early FragranceNet tests. Infobip said RCS more than doubled revenue per send against SMS and MMS in a 2024 holiday test for the Dooney handbag brand. Twilio said in its 2025 annual report that it is working on a channel for Apple Messages for Business. RCS budgets are therefore coming from marketing teams first, ahead of alert senders.
AI agents and CRM suites take over campaign control
Campaign control is moving from standalone texting tools into CRM suites and AI agents that decide when and where to send. Vonage launched Conversations for Agentforce Marketing on Jan. 14, 2026, adding SMS, RCS and WhatsApp inside the Salesforce platform. Attentive said brands using its agentic AI grew twice as fast as other brands during Cyber Week 2025. Twilio now lists an AI compliance toolkit that checks for non-compliant SMS as a paid add-on at USD 0.015 per message. Marketing teams gain one place to plan email, push and text. Providers that plug into the CRM where marketers already work gain share, while conversational marketing software vendors become partners.
Payments and two-way service open new revenue in threads
Two-way texting that lets customers pay, reschedule or ask questions is an opening because it adds value per thread beyond one-way alerts. Syniverse partnered with Authvia in September 2025 to add TXT2PAY payments to its SMS and RCS messaging, with Authvia citing more than 250 gateway integrations. In the Sinch patient survey, 68% wanted two-way texting and 30% would consider switching providers if texting were not offered. Health systems and utilities that answer by text cut call volumes, so providers can sell agent seats and payment features on top of message fees. Each resolved thread also replaces a phone call that costs the business far more to handle.
Election and civic texting returns in 2026
Political and civic texting is an opening in even-numbered years because campaigns and agencies send large bursts over a few months. Bandwidth told investors in February 2026 that it expected political campaign traffic to start around mid-summer. It added that political customers have diversified into commercial and civic messaging, which makes this traffic more durable. The Nov. 3, 2026 midterm elections concentrate that demand in the autumn, and Bandwidth said it expects no political benefit in the first half. Campaign texts must still meet the carrier registration rules described above, and short code leases at USD 500 to USD 1,000 a month suit the high-throughput bursts that campaigns need. Providers with registered high-throughput routes and consent tools capture this seasonal peak.
Scam texts, carrier surcharges and rule shifts raise costs
Scam texts erode trust and tighten carrier filters
Fraudulent texts are a trust risk that makes consumers wary of legitimate business messages and pushes carriers toward stricter filtering. Consumers reported losing USD 470 million to scams that started with a text in 2024, five times the 2020 level, according to the FTC. The FCC estimated in its December 2023 order that consumers receive 225.7 billion spam texts a year. Legitimate senders face more blocked or delayed messages, so they invest in registration, SMS firewall checks and verified branding.
Carrier surcharge increases squeeze provider margins
Carriers raised the per-message surcharges that every provider must pay, which adds cost pressure without adding value for senders. T-Mobile raised its outbound 10DLC and toll-free SMS surcharge from USD 0.0030 to USD 0.0045 in January 2026, and AT&T raised its 10DLC SMS rate to USD 0.0035 on April 1, 2026. Providers pass these fees through, but Twilio said in its 2025 annual report that they will create a modest headwind on its margins. High-volume alert senders feel the rise most and look harder at RCS and email fallback.
Shifting consent rules keep compliance costs high
Consent rules keep changing, which forces senders and providers to rebuild opt-out and record systems more than once. An FCC bureau order of Jan. 6, 2026 delayed the rule that a revocation must apply to all of a sender's messages until Jan. 31, 2027, after an earlier delay to April 2026. In Bandwidth's 2025 survey, 25% of businesses said they paid more because of recent changes to messaging rules. Smaller senders carry these costs on fewer messages, which favors managed platforms.
Carrier consolidation narrows delivery routes
Business texts reach U.S. phones through a shrinking number of carriers, which gives each one more pricing power over senders. T-Mobile completed its purchase of UScellular's wireless operations on Aug. 1, 2025, adding those subscribers to its network. The UScellular toll-free MMS surcharge doubled from USD 0.005 to USD 0.01 on Jan. 19, 2026, according to Twilio. Senders have little room to negotiate, so providers compete on routing quality and support rather than on fees.
The South leads on population and sender headquarters
| Region | Value, 2025 (USD billion) | Share, 2025 | CAGR, 2026–2035 |
|---|---|---|---|
| South | 5.14 | 37.5% | 4.5% |
| West | 3.42 | 25.0% | 4.4% |
| Midwest | 2.67 | 19.5% | 3.9% |
| Northeast | 2.47 | 18.0% | 3.8% |
The South leads on population growth and sender hubs
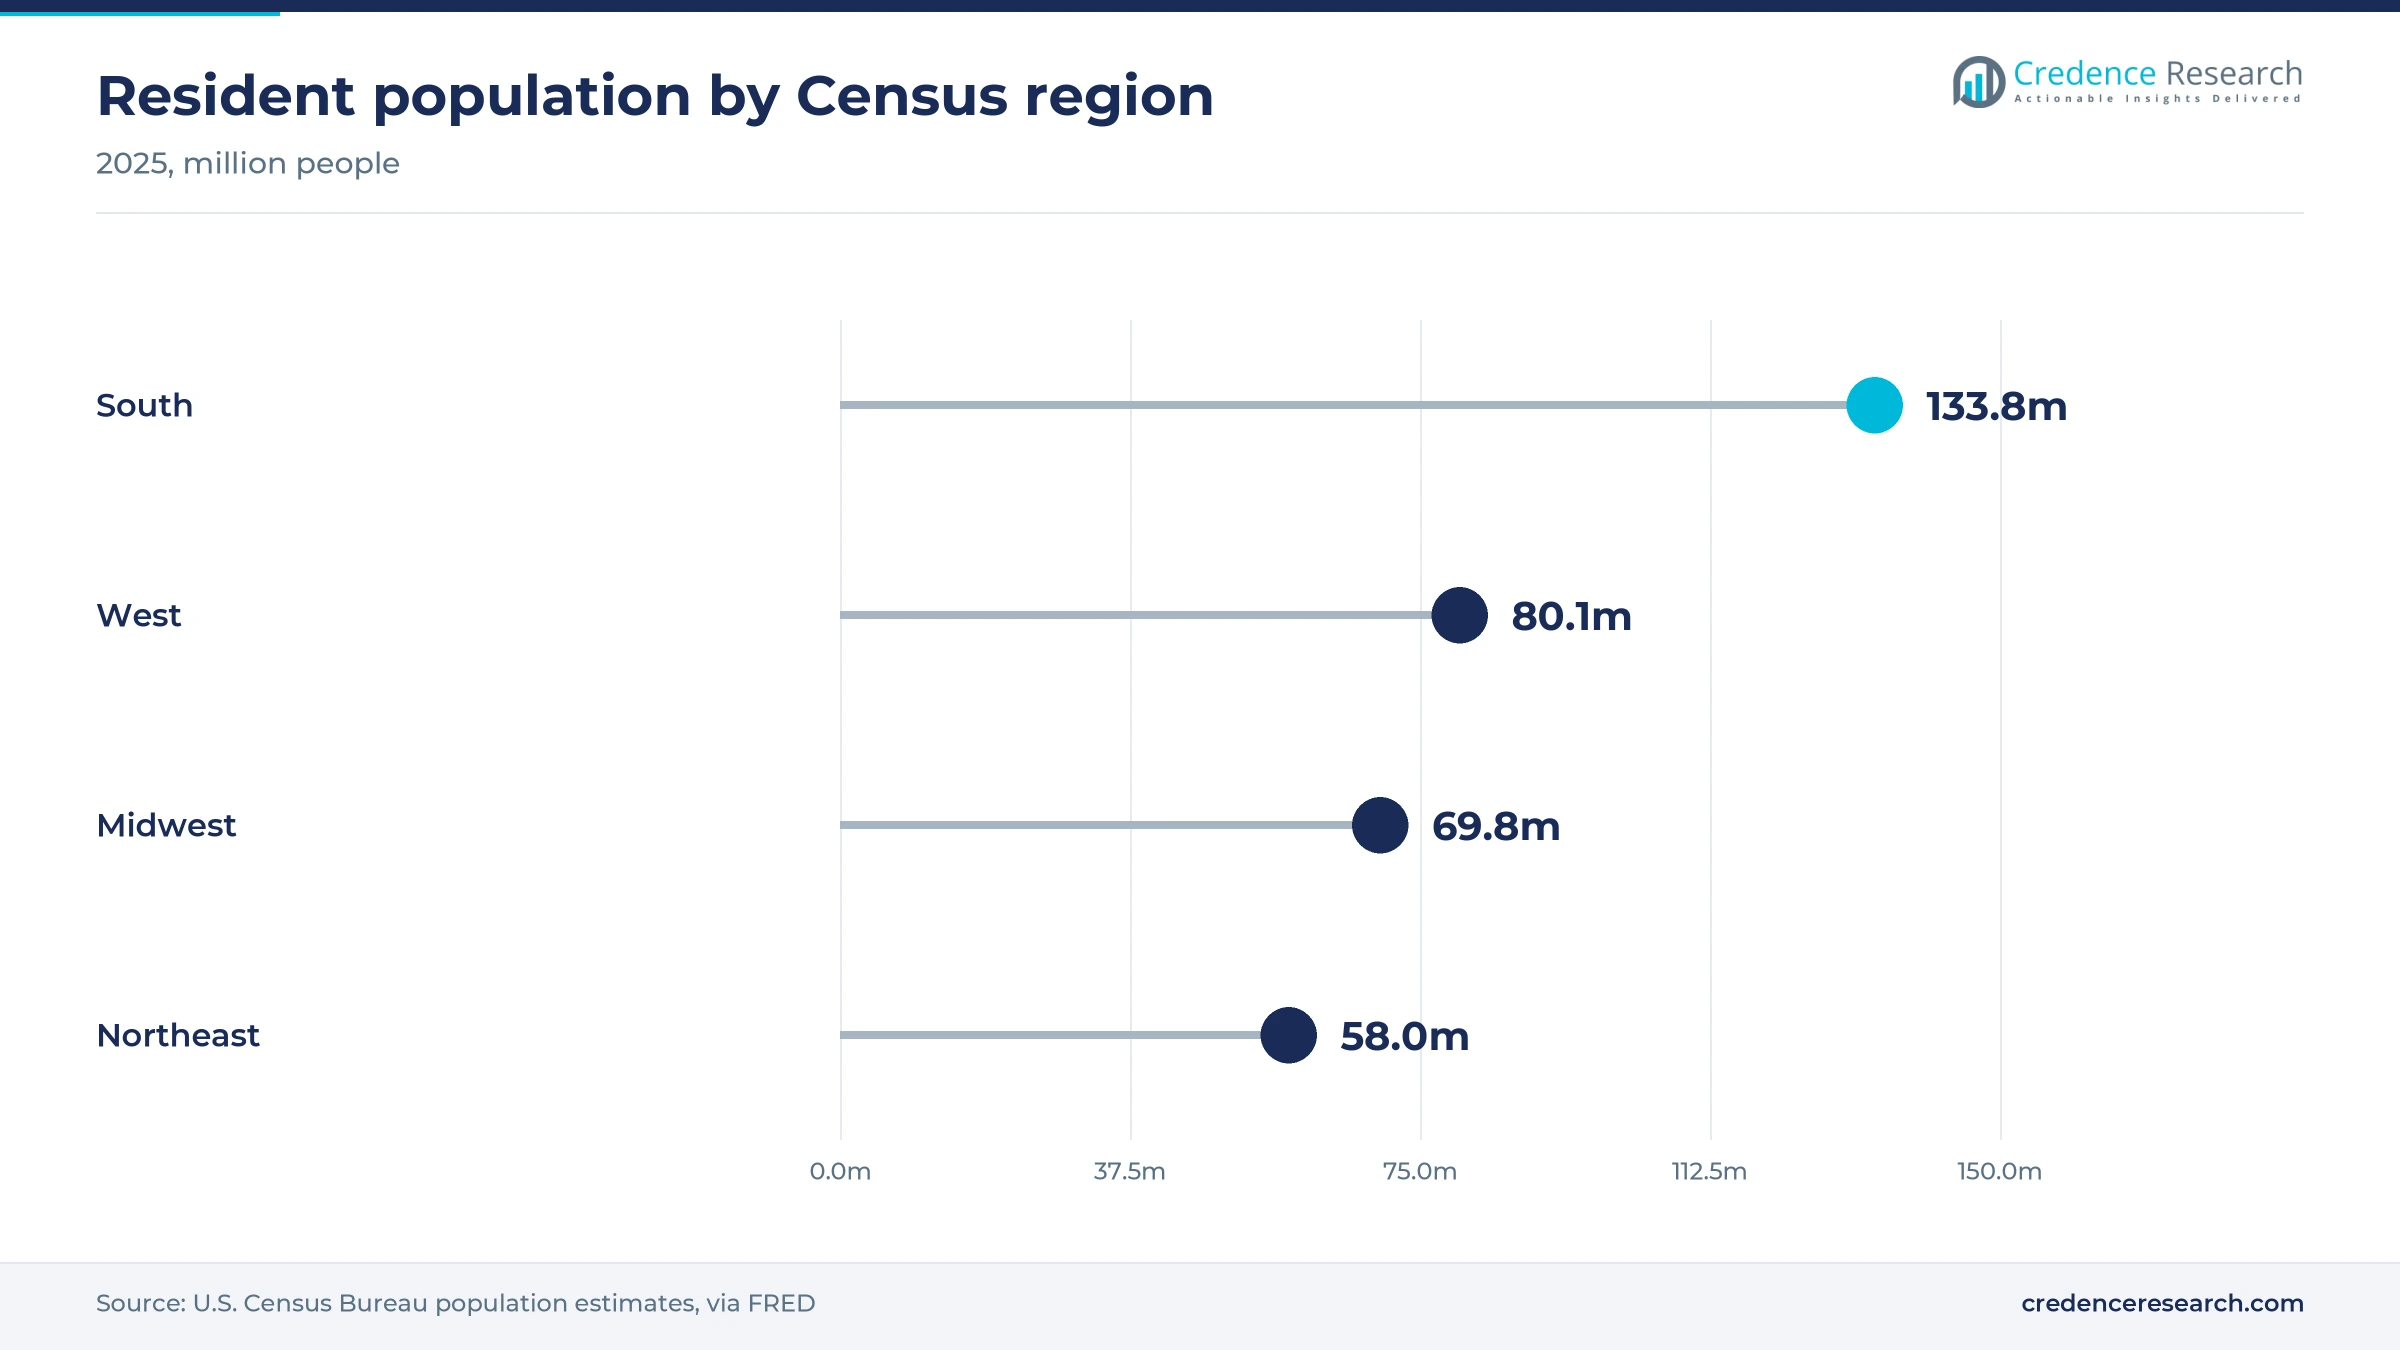
The South held 37.5% of 2025 value and grows at 4.5% a year, the fastest of the four regions. Its resident population reached 133.8 million in 2025, up about 1.2 million from 2024 and the largest gain of any region, according to Census Bureau estimates. More residents mean more accounts, orders and appointments that trigger texts. Bandwidth in Raleigh, N.C. and Syniverse in Tampa, Fla. also run their U.S. operations from the region.
The West holds platform builders and early RCS buyers
The West held a 25.0% share of 2025 value and grows at 4.4% a year. Its population reached 80.1 million in 2025, up about 0.26 million from 2024, according to the same Census series. Many software platforms that embed texting in their apps are based in the region, as is Twilio, whose headquarters are in San Francisco, where Stytch is also based. Technology buyers there tend to test RCS and AI-run campaigns before other regions.
The Midwest relies on banks, insurers and health systems
The Midwest held a 19.5% share of 2025 value and grows at 3.9% a year. Its population reached 69.8 million in 2025, up about 0.24 million from 2024, according to Census Bureau estimates, so growth depends on more texts per person rather than more people. Regional banks, insurers and health systems send steady alert and code traffic, and Infobip announced its four-carrier U.S. RCS launch from Chicago in June 2025.
The Northeast concentrates finance and retail brands
The Northeast held an 18.0% share of 2025 value and grows at 3.8% a year, the slowest of the four regions. Its population reached 58.0 million in 2025, up only about 0.1 million from 2024, according to the Census Bureau. Spending per sender is high because large banks and national retail brands are based there, and Attentive, which runs campaigns for thousands of retail brands, is headquartered in New York.
RCS coverage, identity and CRM deals marked 2025 and 2026
| Development | Status and market relevance |
|---|---|
| In June 2025, Infobip launched RCS business messaging with all four major U.S. carriers. | Live; national RCS reach for enterprise senders |
| In August 2025, Sinch went live with RCS for Business across all U.S. Tier 1 carriers. | Live; RCS reaches up to 75% of handsets among its customers |
| In November 2025, Twilio completed its acquisition of identity platform Stytch. | Completed; adds identity services beside verification codes |
| In January 2026, Vonage launched Conversations for Agentforce Marketing with SMS, RCS and WhatsApp. | Launched; texting inside the Salesforce platform |
| In May 2026, Attentive launched Visibility AI to target RCS for Business campaigns. | Launched; early tests show higher revenue per send than SMS |
Sender registration and RCS reshape U.S. delivery
- 10DLC and toll-free sender registration ties every local or toll-free number to a vetted brand and campaign, which carriers use to set throughput and filtering.
- RCS for Business adds verified sender names, images, carousels and read receipts, with SMS fallback for phones that cannot receive it.
- Verification APIs and fraud controls send one-time codes and block artificially inflated traffic that would otherwise raise costs for senders.
- Platform routing lets communications platform as a service providers pick routes, retry failed messages and track delivery across carriers.
Need a Custom Version of This Report?
Tailor the scope, geography, or segments to your exact requirements.
- Custom geography or segment scope
- Direct access to our analyst team
CPaaS providers, carriers and marketing platforms compete
Competition turns on carrier connections, delivery quality and the software that sits around each message. Twilio anchors developer-led integration with its messaging and verification APIs, while Sinch and Infobip compete for large enterprises with RCS coverage across every national carrier. Bandwidth sells messaging APIs to software platforms that resell texting to hundreds of brands, and Vonage, owned by Ericsson, embeds texting in CRM workflows. Syniverse supplies carrier-grade routing to operators and adds payments inside business threads. AT&T Business, Verizon Business and T-Mobile for Business deliver every message and set the surcharges that all providers pass through. Attentive competes for retail marketing budgets with subscription software rather than per-message routing. Price competition is sharpest in plain SMS routes, while RCS, identity and AI campaign tools are won on features and integrations.
Carriers own the last mile while providers own the customer
The U.S. supply side has three layers with different economics. AT&T, Verizon and T-Mobile deliver every message and set the surcharge per segment, so they earn a fee on all traffic without competing for the sender. CPaaS providers such as Twilio, Sinch, Bandwidth, Infobip and Vonage sell APIs and routes and charge per message on top of the carrier fee. Marketing platforms such as Attentive sit on top and price by subscription. Margins are highest in platform software and lowest in pure routing, while carrier connections and registration tools are the main barriers to entry.
Companies profiled and their roles in this market
| Company | Type | Role in the market |
|---|---|---|
| Twilio | CPaaS provider | Completed the Stytch identity acquisition in November 2025 |
| Sinch | CPaaS provider | Live with RCS for Business across all U.S. Tier 1 carriers since August 2025 |
| Vonage | CPaaS provider owned by Ericsson | Launched Conversations for Agentforce Marketing in January 2026 |
| AT&T Business | National carrier | Raised its 10DLC SMS and MMS surcharges on April 1, 2026 |
| Verizon Business | National carrier | Expanded RCS business messaging for its subscribers with Sinch in March 2025 |
| Attentive | Retail marketing platform | Sent 5.7 billion messages for brands in Cyber Week 2025 |
| Syniverse | Carrier-grade messaging network | Added TXT2PAY payments to SMS and RCS with Authvia in 2025 |
| Infobip | CPaaS provider | Launched RCS with the four major U.S. carriers in June 2025 |
| T-Mobile for Business | National carrier | Raised outbound SMS surcharges in January 2026 after buying UScellular |
| Bandwidth | Network-owning CPaaS provider | Runs first production RCS campaigns for consumer brands |
Carrier economics and trust will decide the winners
Credence Research's view is that U.S. business texting will keep growing because alerts and codes are tied to everyday transactions, but value will shift toward the software around each message. Carrier surcharges now rise faster than provider list prices, which squeezes pure routing margins. RCS, consent management and AI-run campaigns let providers charge for outcomes rather than for delivery alone. The strongest positions belong to providers that combine direct carrier routes with registration tools and rich channels, because senders choose them on deliverability first and price second.
Provider filings and carrier fee notices anchor the model
The report uses 2025 as the base year and 2026 to 2035 as the forecast period. Market values come from the Credence Research model, which combines provider disclosures on customer counts and usage with published per-message rates, carrier surcharge notices and short code lease prices. Segment and regional splits are Credence Research estimates built from Census Bureau population and retail data, FCC and FTC records, company filings, investor calls and announcements, and provider price lists. No interviews or primary surveys were conducted for this edition.
Rich threads add value while SMS volume stays the base
The United States application-to-person messaging market is expected to grow from USD 14.32 billion in 2026 to USD 20.83 billion by 2035 at a 4.25% CAGR. Order, delivery and appointment alerts should remain the base of volume, while promotions move steadily into branded RCS threads with images and buttons. Carrier fees will keep rising slowly, which pushes providers to earn more from software and compliance tools. The South will add the most new subscribers as population growth concentrates there. By 2035, more customer service, payments and rescheduling are likely to happen inside a single business thread.
RCS uptake and carrier fees set the 2035 range
The range of outcomes depends on how fast brands move campaigns to RCS and on how far carriers keep raising surcharges. A downside case assumes more scam filtering, further fee increases and a shift of codes to passkeys and app push. The base case assumes steady alert growth and gradual RCS adoption by retailers. An upside case needs fast RCS uptake across industries and wider use of payments and service inside threads, which would raise value per conversation.
| Scenario | CAGR, 2026–2035 | Value, 2035 | What has to hold |
|---|---|---|---|
| Downside | 3.1% | USD 18.93 billion | Scam filtering tightens, surcharges rise again and login codes move to passkeys |
| Base | 4.25% | USD 20.83 billion | Alerts grow with commerce and retailers adopt RCS gradually |
| Upside | 5.5% | USD 23.28 billion | RCS spreads across industries and payments move into message threads |
Frequently Asked Questions
How big is the United States application-to-person messaging market?
Which service type leads U.S. business texting?
Which U.S. region leads the market?
How much does a business text cost in the United States?
Why are carrier surcharges rising?
How do scam texts affect legitimate senders?
Who are the key companies in the United States application-to-person messaging market?
Which application grows fastest?
Table of Content
Chapter 1 Market Segmentation
- 1.1 Segmentation Framework
- 1.1.1 Product and Service Classification
- 1.1.2 Application and End-Use Classification
- 1.1.3 Technology and Solution Classification
- 1.1.4 Customer and Distribution Channel Classification
- 1.1.5 Geographic Segmentation
- 1.1.6 Market Segment Definitions and Boundaries
- 1.2 By Service Type
- 1.2.1 SMS Delivery
- 1.2.2 MMS Delivery
- 1.2.3 Rich Business Messaging
- 1.2.4 Platform and Compliance Services
- 1.3 By Application
- 1.3.1 Transactional Notifications
- 1.3.2 Authentication and Security
- 1.3.3 Promotional Engagement
- 1.4 By End-Use Industry
- 1.4.1 Retail and E-Commerce
- 1.4.2 Financial Services
- 1.4.3 Healthcare and Life Sciences
- 1.4.4 Business and Public Services
- 1.5 By Customer Type
- 1.5.1 Strategic Accounts
- 1.5.2 Mid-Market Accounts
- 1.5.3 Small-Business Accounts
Chapter 2 Introduction
- 2.1 Report Objectives and Scope
- 2.2 Product Definition and Industry Terminology
- 2.3 Market Inclusions and Exclusions
- 2.4 Research Process
- 2.4.1 Primary Research and Expert Interviews
- 2.4.2 Secondary Research and Source Review
- 2.4.3 Top-Down and Bottom-Up Estimation
- 2.4.4 Data Triangulation and Verification
- 2.5 Market Size Measurement Basis
- 2.5.1 2025: USD 13.70 billion → 2035: USD 20.83 billion
- 2.6 Historical and Forecast Reference Periods
- 2.6.1 Historical Period: 2018-2025
- 2.6.2 Base Year: 2025
- 2.6.3 Forecast Period: 2025-2035
- 2.7 Research Assumptions and Limitations
Chapter 3 Executive Summary
- 3.1 Market Snapshot and Key Findings
- 3.2 Base-Year Market Size, 2025
- 3.3 Forecast Market Size, 2035
- 3.4 Revenue and Volume Growth Outlook
- 3.5 Key Demand and Supply Indicators
- 3.6 Leading Market Segments
- 3.7 Fastest-Growing Market Opportunities
- 3.8 Regional Performance Highlights
- 3.9 Technology and Industry Transformation
- 3.10 Competitive Landscape Summary
- 3.11 Analyst View and Strategic Implications
Chapter 4 United States Application-to-Person Messaging Market Trends and Developments
- 4.1 Historical Industry Development, 2018-2025
- 4.2 Recent Market Trends and Developments
- 4.3 Demand and Customer Behavior Trends
- 4.4 Technology and Product Innovation
- 4.5 Artificial Intelligence, Automation and Digitalization
- 4.6 Local Manufacturing and Supply Chain Realignment
- 4.7 Industry Partnerships, Mergers and Acquisitions
- 4.8 Sustainability and Circular Economy Developments
- 4.9 Government and Private Sector Investment Trends
- 4.10 Emerging Business Models and Commercialization
- 4.11 Industry Developments and Announcements
Chapter 5 United States Application-to-Person Messaging Market Production, Supply and Demand Analysis
- 5.1 Demand Trend and Consumption Analysis, 2018-2025
- 5.2 Demand Forecast, 2025-2035
- 5.3 Production and Output Trend, 2018-2025
- 5.4 Production and Output Forecast, 2025-2035
- 5.5 Installed Capacity and Capacity Utilization
- 5.6 Company-Wise Production Plants and Statistics
- 5.6.1 Installed Production Capacity
- 5.6.2 Actual Production
- 5.6.3 Planned Capacity and Expansion Targets
- 5.7 Supply Chain Structure and Procurement Trends
- 5.8 Supply-Demand Gap and Bottlenecks
- 5.9 Import Dependence and Sourcing Structure
- 5.10 Contract Manufacturing and Outsourcing
- 5.11 Regional Supply and Demand Concentration
Chapter 6 United States Application-to-Person Messaging Market Pricing Analysis
- 6.1 Pricing Structure and Measurement
- 6.2 Historical Pricing Trends, 2018-2025
- 6.3 Pricing Outlook, 2025-2035
- 6.4 Average Selling Price and Unit Economics
- 6.5 Pricing by Product and Market Segment
- 6.6 Geographic Pricing Differences
- 6.7 Key Input, Energy, Labor and Logistics Costs
- 6.8 Contract Pricing and Purchasing Models
- 6.9 Pricing Sensitivity and Competitive Positioning
- 6.10 Price, Margin and Profitability Implications
Chapter 7 United States Application-to-Person Messaging Market Dynamics
- 7.1 Market Growth Drivers
- 7.1.1 Demand-Side Drivers
- 7.1.2 Technology and Innovation Drivers
- 7.1.3 Infrastructure and Investment Drivers
- 7.1.4 Regulatory and Policy Drivers
- 7.2 Market Restraints
- 7.2.1 Cost and Affordability Constraints
- 7.2.2 Technology and Adoption Barriers
- 7.2.3 Supply Chain and Operational Constraints
- 7.3 Market Challenges
- 7.3.1 Competitive Pressure and Margin Erosion
- 7.3.2 Skills, Infrastructure and Implementation Gaps
- 7.4 Emerging Market Opportunities
- 7.5 Market Dynamics Impact and Time-Horizon Assessment
Chapter 8 United States Application-to-Person Messaging Value Chain Analysis
- 8.1 Industry Value Chain Overview
- 8.2 Upstream Suppliers and Critical Inputs
- 8.3 Technology and Component Providers
- 8.4 Manufacturing or Service Delivery
- 8.5 Distribution, Channel Partners and Integrators
- 8.6 Downstream Applications and End Users
- 8.7 Value Addition and Profit Pools
- 8.8 Vertical Integration and Outsourcing
- 8.9 Supplier Concentration and Risk
- 8.10 Supply Chain Localization and Resilience
Chapter 9 United States Application-to-Person Messaging Market Regulations and Policies
- 9.1 Relevant Laws, Standards and Compliance Frameworks
- 9.2 Product, Service, Safety and Quality Requirements
- 9.3 Government Policies, Incentives and Subsidies
- 9.4 Imports, Exports and Trade Barriers
- 9.5 Public Procurement and Local Content Requirements
- 9.6 Environmental and Sustainability Compliance
- 9.7 Data Protection, AI and Cybersecurity Compliance
- 9.8 Upcoming Policy Changes and Market Implications
Chapter 10 United States Application-to-Person Messaging Market Hotspots and Opportunities
- 10.1 Market Opportunity Mapping and Growth Hotspots
- 10.2 High-Growth Applications and Customer Groups
- 10.3 Underserved Markets and White-Space Opportunities
- 10.4 Emerging Technology and Product Opportunities
- 10.5 New Capacity and Investment Hotspots
- 10.6 Market Entry and Expansion Opportunities
- 10.7 Distribution and Partnership Opportunities
- 10.8 Near-Term and Long-Term Commercial Potential
- 10.9 Opportunity Attractiveness and Execution Risks
Chapter 11 United States Application-to-Person Messaging Market Outlook, 2025-2035
- 11.1 Market Size and Analysis
- 11.1.1 Revenue (Market Measurement: 2025: USD 13.70 billion → 2035: USD 20.83 billion)
- 11.1.2 Market Volume and Quantity Sold
- 11.1.3 Historical Market Size, 2018-2025
- 11.1.4 Base-Year Market Size, 2025
- 11.2 Market Forecast, 2025-2035
- 11.2.1 Revenue Forecast to 2035
- 11.2.2 Volume Forecast to 2035
- 11.2.3 CAGR and Year-on-Year Growth
- 11.2.4 Incremental Revenue Opportunity
- 11.3 Forecast Assumptions and Scenario Analysis
- 11.3.1 Base-Case Forecast
- 11.3.2 Optimistic and Conservative Scenarios
- 11.3.3 Technology, Pricing and Policy Sensitivities
- 11.4 Market Attractiveness and Growth Outlook
Chapter 12 United States Application-to-Person Messaging Market Segmentation and Outlook
- 12.1 Segmentation Summary and Market Shares, 2025
- 12.2 Largest and Fastest-Growing Segments
- 12.3 By Service Type - Market Size and Forecast, 2025-2035
- 12.3.1 Segment Definition and Scope
- 12.3.2 Historical Market Size, 2018-2025
- 12.3.3 Revenue Forecast, 2025-2035
- 12.3.4 Volume Forecast, 2025-2035
- 12.3.5 Base-Year Market Share, 2025
- 12.3.6 Segment CAGR and Growth Drivers
- 12.3.7 Subsegment Market Size and Forecast
- 12.3.7.1 SMS Delivery
- 12.3.7.2 MMS Delivery
- 12.3.7.3 Rich Business Messaging
- 12.3.7.4 Platform and Compliance Services
- 12.3.8 Subsegment Pricing and Adoption Trends
- 12.3.9 Leading Suppliers and Competition
- 12.3.10 Regional Demand and Opportunities
- 12.4 By Application - Market Size and Forecast, 2025-2035
- 12.4.1 Segment Definition and Scope
- 12.4.2 Historical Market Size, 2018-2025
- 12.4.3 Revenue Forecast, 2025-2035
- 12.4.4 Volume Forecast, 2025-2035
- 12.4.5 Base-Year Market Share, 2025
- 12.4.6 Segment CAGR and Growth Drivers
- 12.4.7 Subsegment Market Size and Forecast
- 12.4.7.1 Transactional Notifications
- 12.4.7.2 Authentication and Security
- 12.4.7.3 Promotional Engagement
- 12.4.8 Subsegment Pricing and Adoption Trends
- 12.4.9 Leading Suppliers and Competition
- 12.4.10 Regional Demand and Opportunities
- 12.5 By End-Use Industry - Market Size and Forecast, 2025-2035
- 12.5.1 Segment Definition and Scope
- 12.5.2 Historical Market Size, 2018-2025
- 12.5.3 Revenue Forecast, 2025-2035
- 12.5.4 Volume Forecast, 2025-2035
- 12.5.5 Base-Year Market Share, 2025
- 12.5.6 Segment CAGR and Growth Drivers
- 12.5.7 Subsegment Market Size and Forecast
- 12.5.7.1 Retail and E-Commerce
- 12.5.7.2 Financial Services
- 12.5.7.3 Healthcare and Life Sciences
- 12.5.7.4 Business and Public Services
- 12.5.8 Subsegment Pricing and Adoption Trends
- 12.5.9 Leading Suppliers and Competition
- 12.5.10 Regional Demand and Opportunities
- 12.6 By Customer Type - Market Size and Forecast, 2025-2035
- 12.6.1 Segment Definition and Scope
- 12.6.2 Historical Market Size, 2018-2025
- 12.6.3 Revenue Forecast, 2025-2035
- 12.6.4 Volume Forecast, 2025-2035
- 12.6.5 Base-Year Market Share, 2025
- 12.6.6 Segment CAGR and Growth Drivers
- 12.6.7 Subsegment Market Size and Forecast
- 12.6.7.1 Strategic Accounts
- 12.6.7.2 Mid-Market Accounts
- 12.6.7.3 Small-Business Accounts
- 12.6.8 Subsegment Pricing and Adoption Trends
- 12.6.9 Leading Suppliers and Competition
- 12.6.10 Regional Demand and Opportunities
- 12.7 Segment Growth Comparison
- 12.8 Segment Attractiveness and Priority Matrix
Chapter 13 United States Application-to-Person Messaging End-Use and Application Market Outlook
- 13.1 End-Use Industry and Customer Demand Structure
- 13.2 Leading Applications and Customer Groups
- 13.3 End-Use Market Size, Share and Forecast
- 13.4 Major End-Use Industry Deep Dives
- 13.4.1 Customer Requirements and Use Cases
- 13.4.2 Demand and Replacement Cycles
- 13.4.3 Technical and Regulatory Considerations
- 13.4.4 Purchasing and Procurement Models
- 13.4.5 Leading Vendors and Distribution Channels
- 13.4.6 Forecast and Commercial Opportunities
- 13.5 Emerging Applications and Cross-Segment Demand
- 13.6 End-Use Industry Investment Priorities
Chapter 14 United States Application-to-Person Messaging Geographic Market Outlook, 2025-2035
- 14.1 Domestic Market Distribution and Demand Clusters
- 14.2 State- or Province-Wise Market Size and Forecast, 2025-2035
- 14.3 City and Metropolitan Market Outlook
- 14.4 Industrial, Manufacturing and Commercial Clusters
- 14.5 Geographic Concentration of Key End Users
- 14.6 Local Pricing and Purchasing Differences
- 14.7 Domestic Production Facilities and Capacity Map
- 14.8 Local Infrastructure and Project Pipeline
- 14.9 State-Level Policy and Incentive Differences
- 14.10 Subnational Investment Hotspots and Opportunities
- 14.11 Distribution and Logistics Networks
- 14.12 Domestic Competitive Footprint
Chapter 15 United States Application-to-Person Messaging Technology, Innovation and Sustainability Outlook
- 15.1 Technology Landscape and Maturity
- 15.2 Product, Process and Service Innovation
- 15.3 AI, Automation and Digital Tools in the Industry
- 15.4 Technology Adoption and Performance Benchmarking
- 15.5 Innovation Pipeline and R&D Investment
- 15.6 Patent and Intellectual Property Trends
- 15.7 Energy Efficiency and Resource Management
- 15.8 Sustainability, Recycling and Circularity
- 15.9 Technology Roadmap, 2025-2035
- 15.10 Risks of Obsolescence and Technology Substitution
Chapter 16 United States Application-to-Person Messaging Market Key Strategic Imperatives
- 16.1 Growth and Market Entry Priorities
- 16.2 High-Return Products and Segments
- 16.3 Pricing, Profitability and Cost Optimization
- 16.4 Technology Investment and Product Differentiation
- 16.5 Supply Chain Localization and Resilience
- 16.6 Distribution and Customer Acquisition
- 16.7 Partnership, Acquisition and Capacity Strategy
- 16.8 Regional Expansion Priorities
- 16.9 Short-, Medium- and Long-Term Actions
Chapter 17 Competition Outlook
- 17.1 Industry Competition Characteristics
- 17.2 Market Structure and Concentration
- 17.3 Market Share and Competitive Positioning, 2025
- 17.4 Company-Wise Revenue and Product Benchmarking
- 17.5 Production and Service Capacity Benchmarking
- 17.6 Technology, Pricing and Differentiation
- 17.7 Regional Footprint and Distribution Strength
- 17.8 Mergers, Acquisitions and Strategic Alliances
- 17.9 New Entrants and Competitive Threats
- 17.10 Porter's Five Forces and Industry Attractiveness
- 17.11 Competitive Outlook, 2025-2035
Chapter 18 Company Profiles
- 18.1 Company Coverage and Selection Criteria
- 18.2 Twilio
- 18.2.1 Business Description
- 18.2.2 Company Ownership and Geographic Presence
- 18.2.3 Product and Service Portfolio
- 18.2.4 Manufacturing and Operating Footprint
- 18.2.5 Production Capacity and Expansion Plans
- 18.2.6 Financial Performance and Investment
- 18.2.7 Market Share and Competitive Position
- 18.2.8 Technology and Innovation Capabilities
- 18.2.9 Strategic Alliances or Partnerships
- 18.2.10 Recent Developments
- 18.2.11 Growth Strategy and Outlook
- 18.3 Sinch
- 18.4 Vonage
- 18.5 AT&T Business
- 18.6 Verizon Business
- 18.7 Attentive
- 18.8 Syniverse
- 18.9 Infobip
- 18.10 T-Mobile for Business
- 18.11 Bandwidth
- 18.12 Other Relevant Market Participants
Note: Every listed company is profiled on the structure shown under the first company. The company list is preliminary and may change based on research findings, market developments, data availability and client requirements.
Chapter 19 Disclaimer
- 19.1 Research and Forecast Disclaimer
- 19.2 Data Source and Estimation Limitations
Note: The depth of individual sections depends on data availability for this market. Volume, capacity, trade and other unit-based metrics are included where applicable.

