
U.S. operators turn network and customer data into decisions
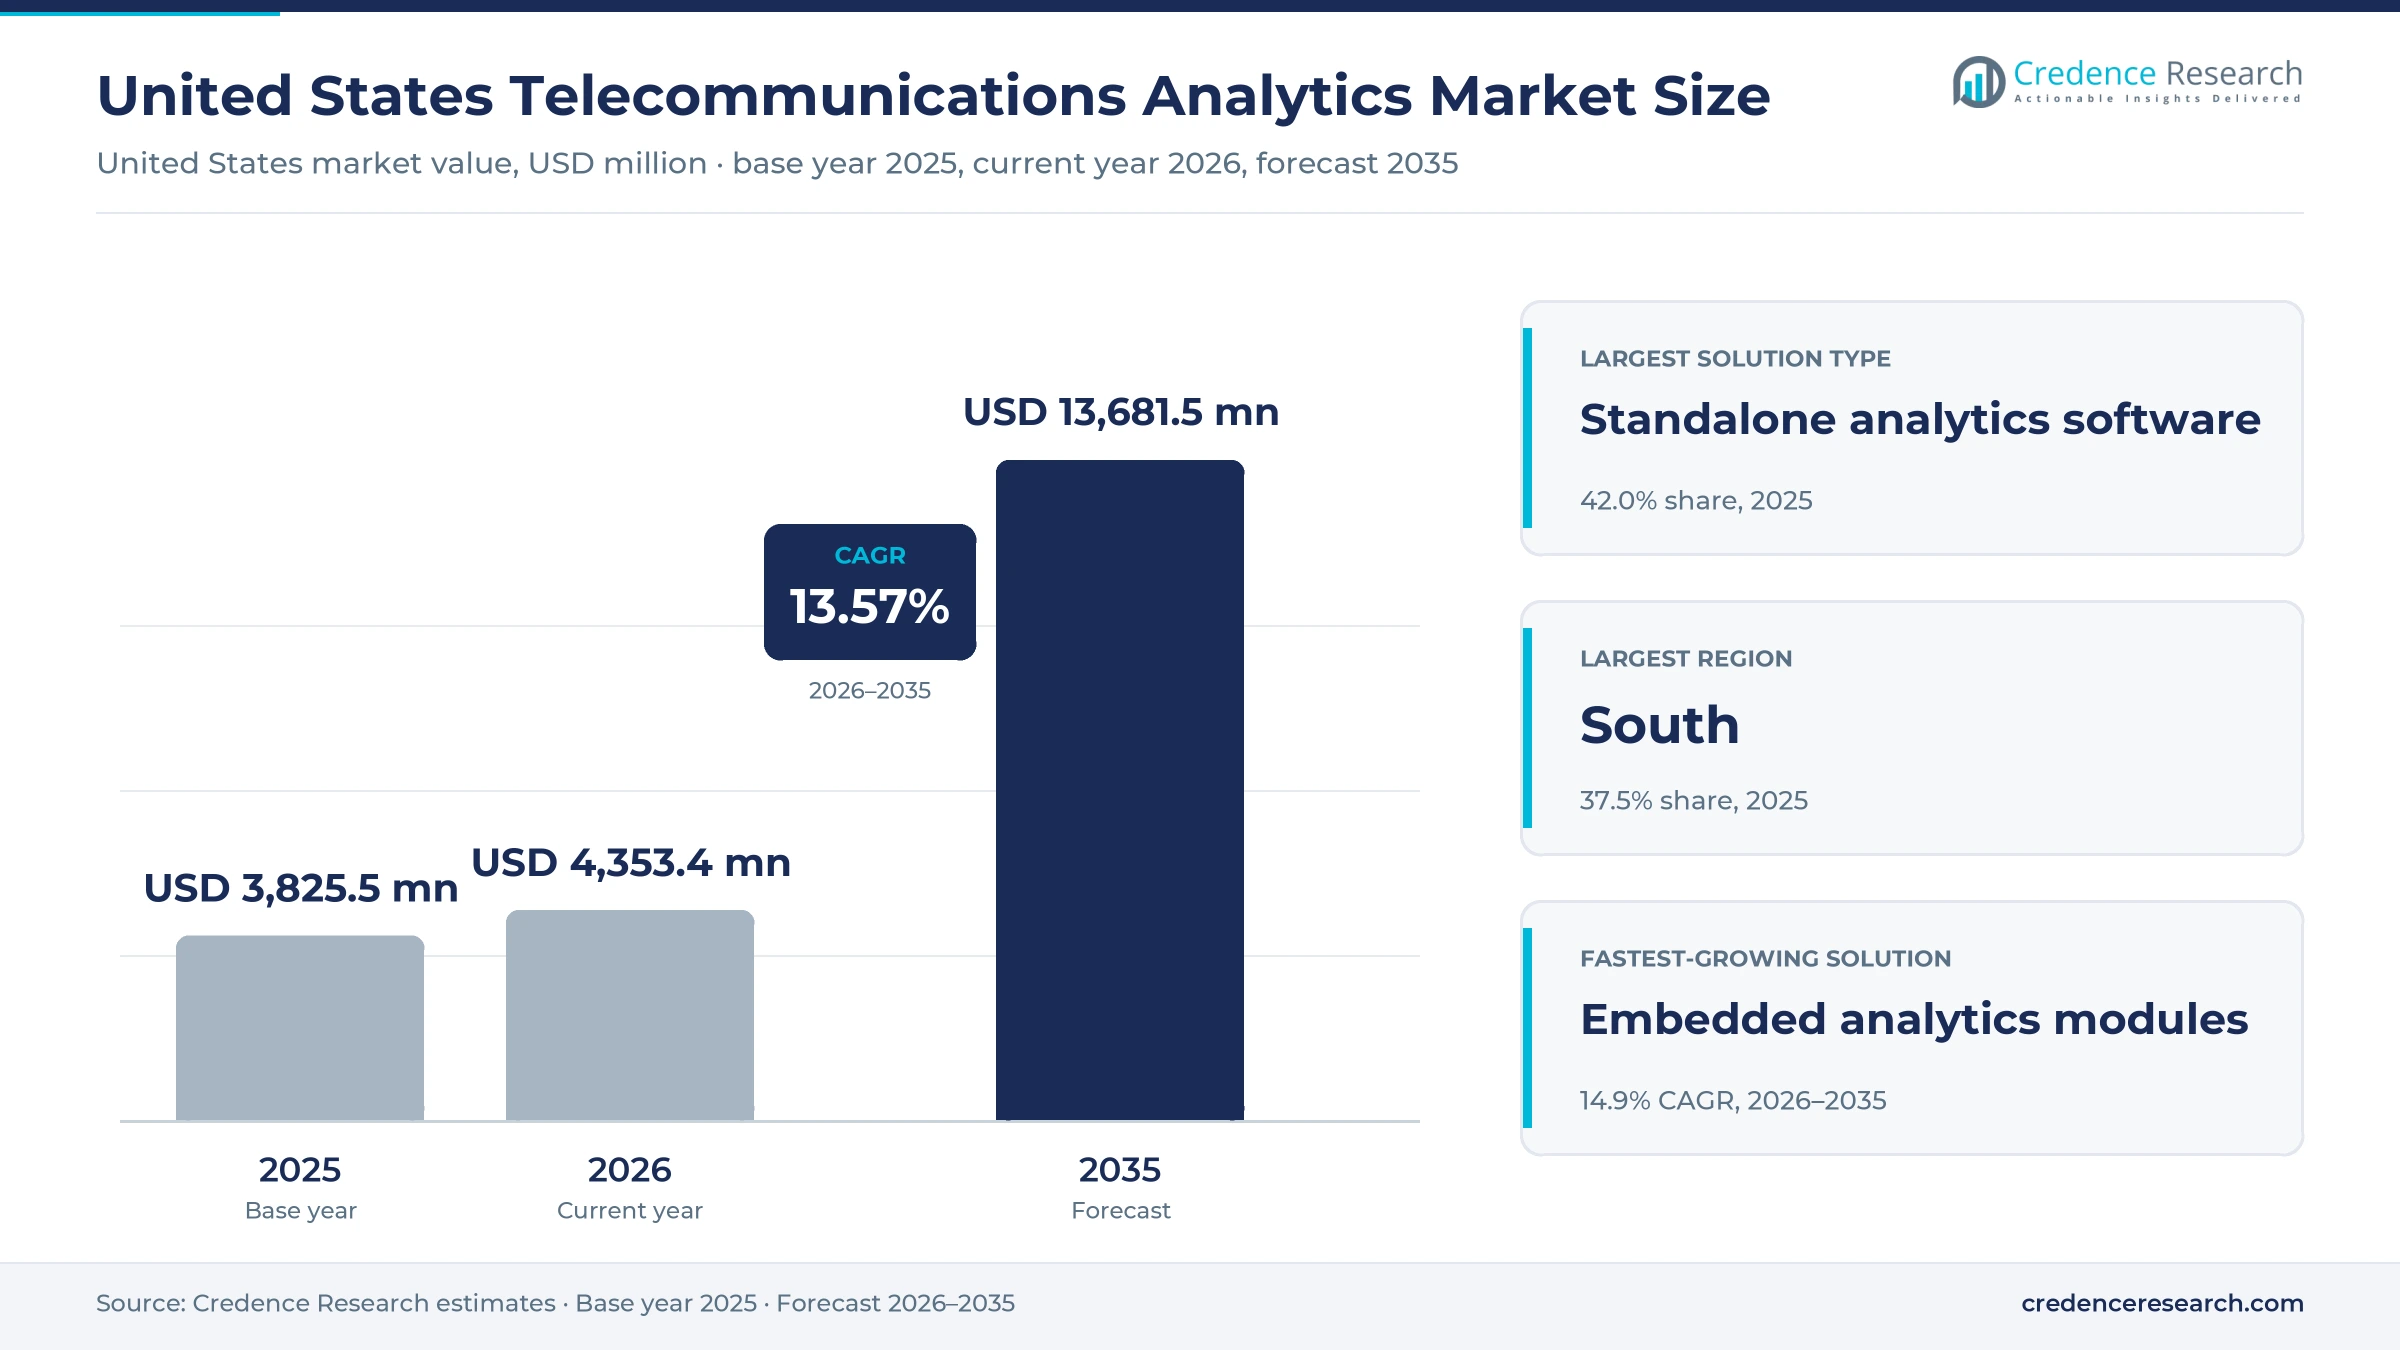
The United States telecommunications analytics market was valued at USD 3.83 billion in 2025 and is projected to increase from USD 4.35 billion in 2026 to USD 13.68 billion by 2035, registering a CAGR of 13.57% during 2026–2035. Spending is driven by carriers that need to plan capacity as mobile data keeps climbing, by customer care and retention teams that now run generative AI on billing and usage records, and by security and privacy rules that require operators to log, monitor and report what happens to customer data. The South held the largest regional share, 37.5% in 2025, and it is also the fastest-growing region at 14.0% a year as population and new network sites keep moving there. Standalone software still takes the largest slice, but analytics embedded in billing, care and network platforms grows faster. AT&T signed an eight-year agreement with Amdocs in November 2026 to modernize its business and customer operations with an agentic AI operating system.
Software, embedded modules and services form the market
The market counts spending by U.S. mobile, fixed and virtual network operators on analytics software, analytics modules built into billing, care, network management and orchestration platforms, and the consulting, integration and managed services that run them. Operators buy through multi-year vendor contracts, cloud marketplaces and systems integrators, and pay through licenses, subscriptions and service fees.
General enterprise business intelligence bought by non-telecom companies, network equipment without analytics software, and raw cloud storage that is not tied to an analytics workload are outside the scope. The value chain runs from data platform and cloud providers through telecom software and network vendors to integrators and, finally, to nationwide operator groups, regional operators and specialist access providers.
United States Telecommunications Analytics Market Insights
- The United States telecommunications analytics market grows from USD 3.83 billion in 2025 to USD 13.68 billion by 2035 at a 13.57% CAGR as operators move AI into network and care operations.
- The South held the largest regional share at 37.5% in 2025 and grows fastest, helped by population growth of 6.0% since 2020.
- Standalone analytics software led solution types with 42.0% in 2025, while embedded analytics modules grow fastest at 14.9% a year.
- Americans used 159.3 trillion MB of mobile data in 2025, 20% more than in 2024, according to CTIA, which keeps capacity planning budgets rising.
- AT&T signed an eight-year agreement with Amdocs on Nov. 3, 2026 to run its business and customer operations on an agentic AI operating system.
Standalone software leads as embedded modules gain fastest
Standalone software leads as embedded modules scale fastest
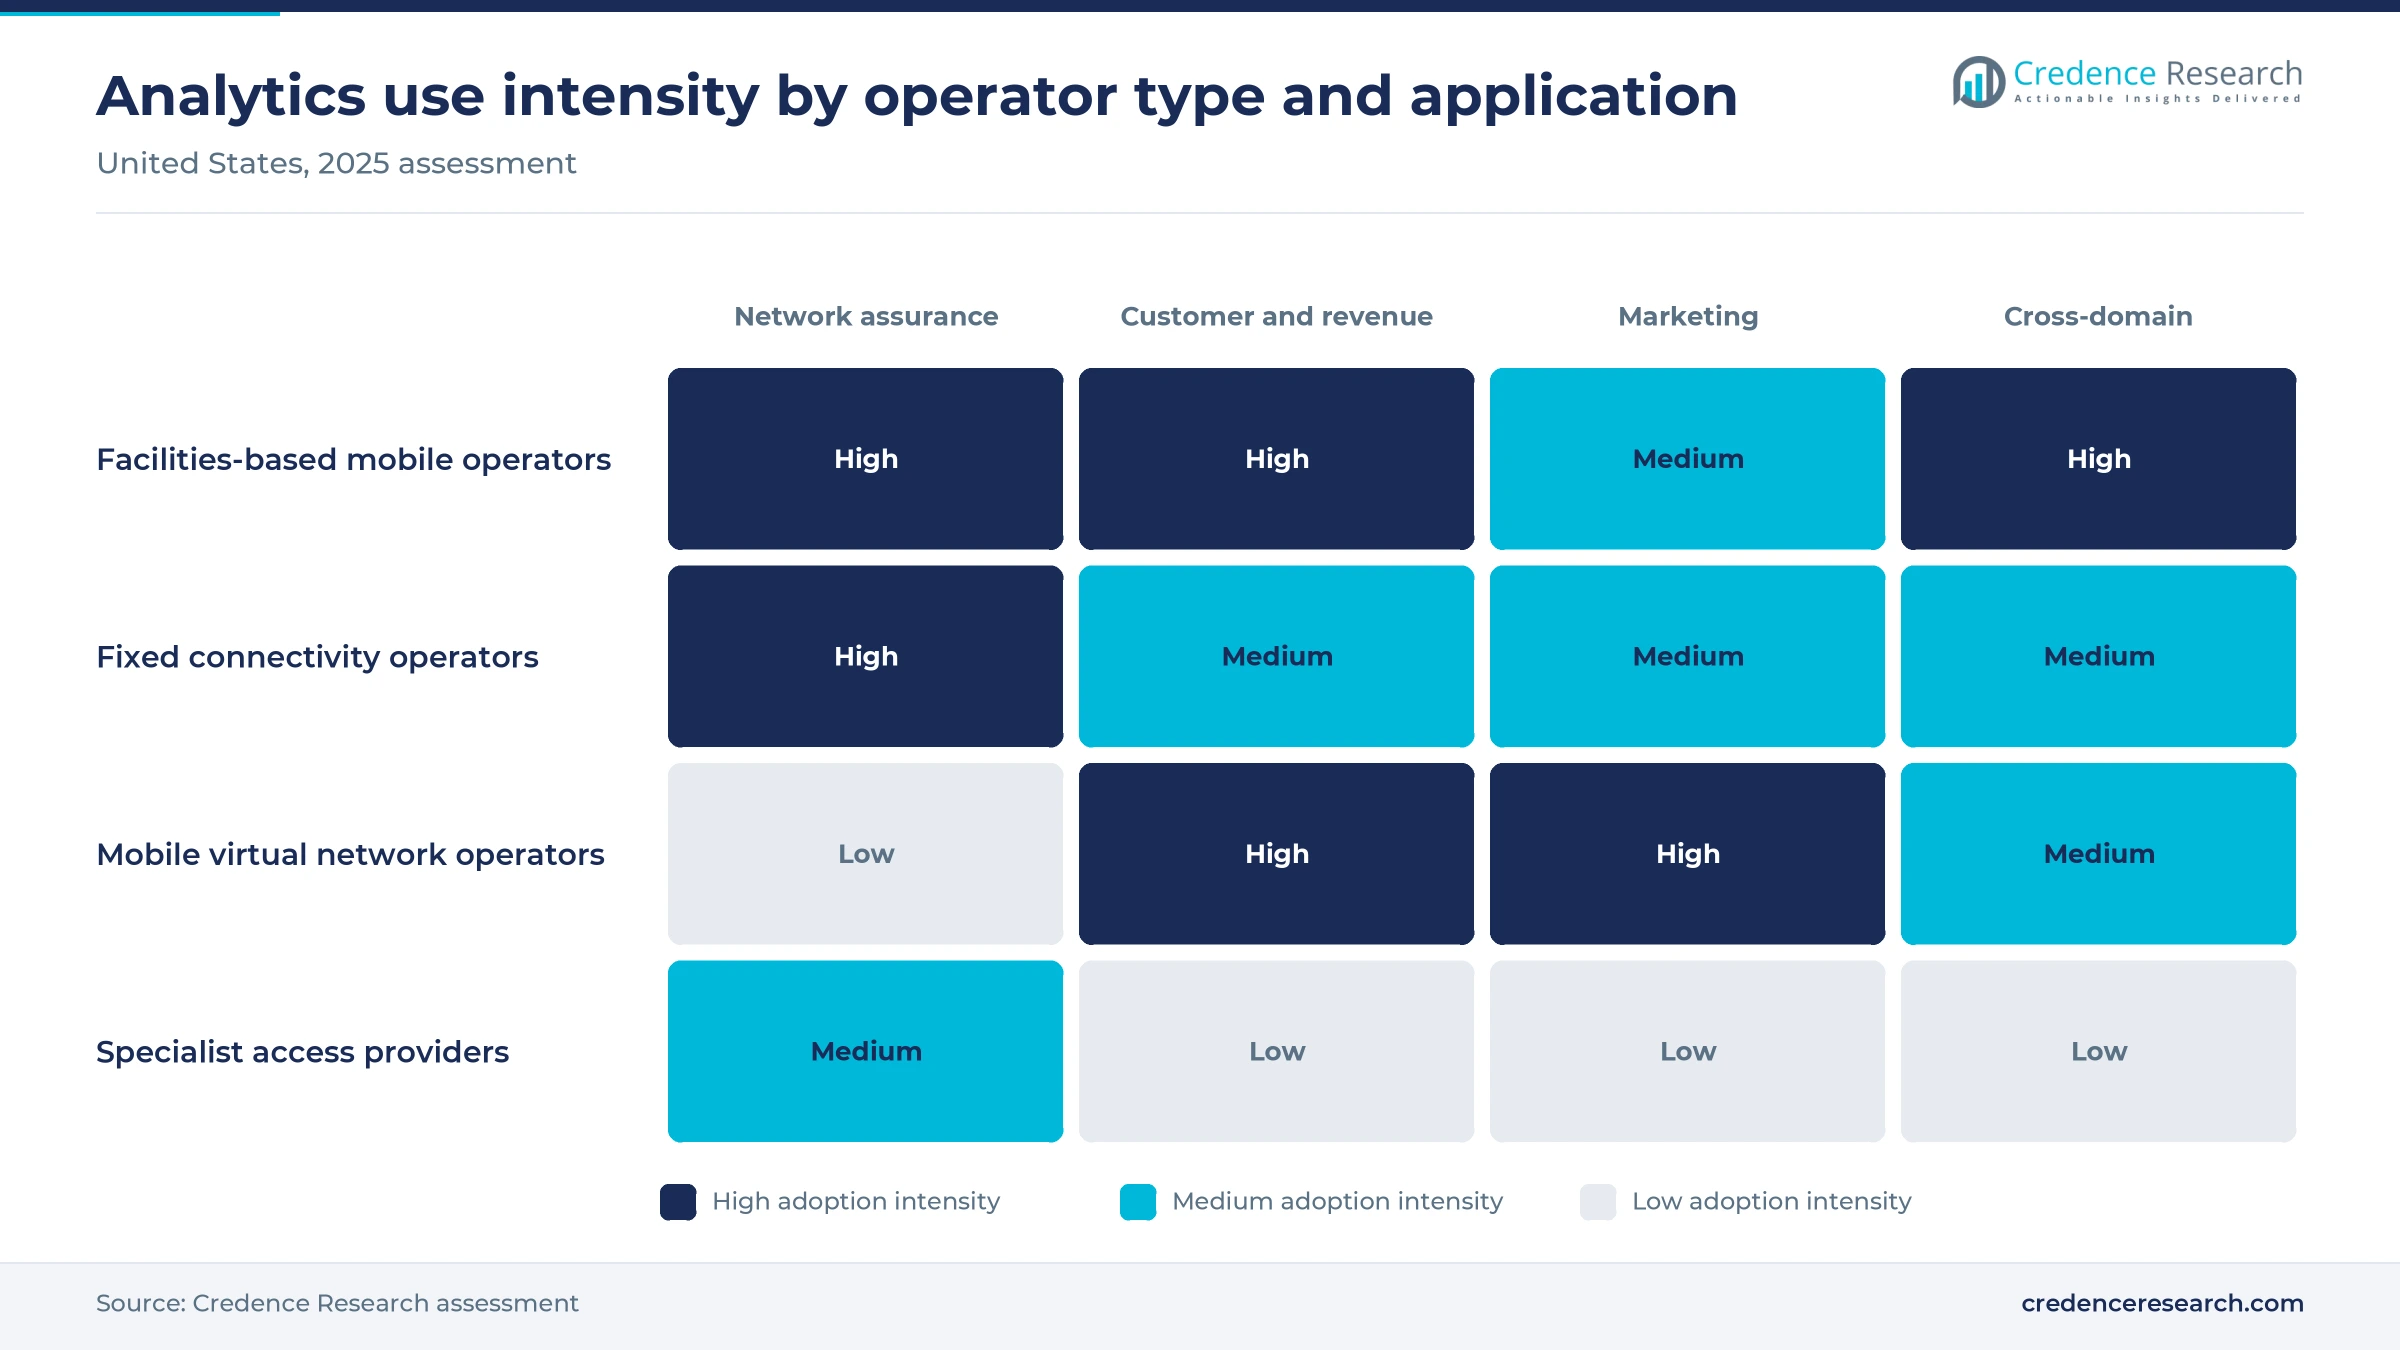
Based on solution type, the market is categorized into standalone analytics software, embedded analytics modules and analytics services. Standalone analytics software led with 42.0% of 2025 value because security and assurance teams run separate platforms that pull data from every network domain, and joint guidance issued by CISA, the NSA and the FBI in December 2024 asked operators to centralize logs and correlate them in SIEM tools. Embedded analytics modules grow fastest at 14.9% a year because operators now want AI inside billing and care systems rather than in separate dashboards, the approach behind the AT&T agreement described above.
Hybrid estates lead as public cloud grows fastest
Based on deployment model, the market is categorized into public cloud, hybrid and on-premises deployments. Hybrid led with 41.0% of 2025 value because operators keep subscriber records under tight control while sending heavy workloads to the cloud, a caution reinforced when AT&T agreed on Sept. 17, 2024 to pay a USD 13 million FCC penalty over customer data held in a vendor cloud. Public cloud grows fastest at 15.1% a year as Verizon built its April 2025 care assistant for 28,000 representatives on Google Cloud Vertex AI and Gemini models.
Mobile network owners lead while virtual operators grow fastest
Based on customer type, the market is categorized into facilities-based mobile operators, fixed connectivity operators and mobile virtual network operators. Facilities-based mobile operators led with 58.0% of 2025 value because they run radio networks that need constant optimization, and T-Mobile extended its Nokia deal on April 24, 2025 to include MantaRay SON for AI-based network tuning. Mobile virtual network operators grow fastest at 15.5% a year as cable carriers scale mobile, with Comcast adding 368,000 wireless lines in the third quarter of 2026 and Charter adding 406,000 mobile lines in the second quarter.
Assurance leads while cross-domain enablement grows fastest
Based on application, the market is categorized into network and service assurance, customer and revenue analytics, marketing analytics and cross-domain analytics enablement. Network and service assurance led with 36.0% of 2025 value because paid service tiers now depend on measured performance, and T-Mobile charges USD 7.50 a month for access to its T-Priority network slice on one first responder plan. Cross-domain analytics enablement grows fastest at 15.7% a year as T-Mobile designed IntentCX, announced Sept. 18, 2024 with OpenAI, to analyze network and service data in real time during a customer contact.
| Segment Group | Leading Sub-segment | Share, 2025 | Fastest-growing Sub-segment | CAGR, 2026–2035 |
|---|---|---|---|---|
| By Solution Type | Standalone analytics software | 42.0% | Embedded analytics modules | 14.9% |
| By Deployment Model | Hybrid | 41.0% | Public cloud | 15.1% |
| By Customer Type | Facilities-based mobile operators | 58.0% | Mobile virtual network operators | 15.5% |
| By Application | Network and service assurance | 36.0% | Cross-domain analytics enablement | 15.7% |
Usage-based cloud fees reshape operator analytics pricing
Operator analytics is priced three ways, and the mix decides supplier margins. Large carriers still sign multi-year license and support contracts for network and billing platforms, which give vendors predictable income but long sales cycles. Cloud data platforms charge by use instead, so Google lists BigQuery on-demand queries at USD 6.25 per tebibyte scanned after a free first tebibyte each month. That shifts cost control to the operator, which must manage query volumes as data grows. Services fees for integration and model tuning are the third stream, and they rise when operators move AI into core systems.
| Offer or revenue model | Typical price or fee | Basis |
|---|---|---|
| Google BigQuery on-demand query, cloud data platform | USD 6.25 per TiB scanned a month, first TiB free | Google Cloud pricing page, November 2026 |
| T-Priority network slice access, Essentials First Responder plan | USD 7.50 per line a month | Urgent Communications, 2025 |
| Network or billing analytics license and support, nationwide operator | About USD 2 million to USD 10 million a year per domain | Credence Research estimate from operator scale and vendor contract terms |
| Analytics subscription, regional or specialist operator | About USD 150,000 to USD 900,000 a year | Credence Research estimate from operator size and cloud usage |
| Analytics integration and data science services | About USD 1,500 to USD 2,600 per consultant day | Credence Research estimate from systems integrator rate cards |
Request a Free Sample
Fill in your details and we'll send you a free sample report.
- Sample data tables & charts
- Research methodology
Traffic growth, AI care and data rules lift budgets
Network telemetry guides capacity spending
Carriers buy analytics to decide where each capacity dollar goes, because traffic keeps growing faster than revenue. Americans used 159.3 trillion MB of mobile data in 2025, up 20% from 2024, according to CTIA, which also put operator network investment near USD 30 billion for the year. Ericsson expects average North American smartphone use to climb from 25 GB a month in 2025 to 52 GB by 2031. Small cells now make up about 40% of cell sites, CTIA said, so planners must model far more locations than in the macro era. Telemetry platforms that predict congestion site by site protect capital budgets as well as service quality.
Customer data powers AI care and revenue defense
Operators are turning billing, usage and care records into real-time decisions because cheaper data plans squeeze revenue per gigabyte. CTIA said the price per megabyte fell 21% in 2025, so retention and upsell carry more of the margin. T-Mobile said its IntentCX platform with OpenAI would draw on billions of data points from customer interactions and start in 2025. Verizon reported 95% answerability for customer inquiries after it rolled out its Gemini-based assistant in April 2025. Vendors of billing and revenue management systems now sell analytics modules alongside rating and charging, which lifts the value of each contract.
Governed cloud and AI raise data control budgets
Rules on customer data push operators to buy analytics that track, log and report how information moves. The FCC adopted updated breach rules on Dec. 13, 2023 that cover personally identifiable information as well as network data and require notice to the Commission within seven days when more than 500 customers are affected. CISA, the NSA and the FBI asked operators in December 2024 to baseline normal traffic and alert on configuration changes. When AT&T signed its eight-year agreement with Amdocs to modernize business and customer operations with AI, the two firms said they would work as one delivery team, which places data handling inside one accountable contract. Operators now budget for governed AI as a core system rather than as a pilot.
Broadband subsidies and fixed wireless widen the buyer base
Federal broadband money and fixed wireless growth add new networks that need planning and assurance tools. NTIA restructured the USD 42.45 billion BEAD program on June 6, 2025 under a Benefit of the Bargain approach meant to stretch taxpayer value. CTIA counted nearly 16 million 5G home subscribers at the end of 2025 after 3.9 million net additions in the year, which raises demand for fixed wireless access capacity models. The FCC reported about 136 million fixed connections at the end of 2025, with fiber at 29.7% and fixed wireless at 9.1%. Regional builders winning subsidies will need subscription analytics they can deploy quickly.
Radio apps, network APIs and cable mobile reshape demand
Radio optimization shifts into third-party radio apps
Network tuning is moving from vendor-locked tools to apps that run on an open management layer. Ericsson called its December 2023 deal with AT&T, worth about USD 14 billion over five years, the largest in its history, and it includes the Ericsson Intelligent Automation Platform. Light Reading reported in May 2024 that Ericsson was evaluating 53 rApps from 17 partners for AT&T and had about 700 registered developers. AT&T is looking at rApps for energy use, spectrum sharing and AI. Analytics suppliers that package their models as rApps can reach a nationwide network without replacing the radio vendor, much like AIOps platforms did in enterprise IT.
Network APIs emerge as a new data product
Operators are starting to sell network data to developers through standard interfaces, which needs analytics behind every call. AT&T, T-Mobile and Verizon said on Feb. 27, 2025 that they would offer Number Verification and SIM Swap APIs nationwide through Aduna during 2025. Aduna delivers them through Google Cloud, Infobip, Sinch and Vonage, using the CAMARA open-source project. IEEE ComSoc reported in July 2025 that Ericsson had completed the Aduna joint venture with 12 operators. Fraud signals and network slicing performance data both depend on analytics that can answer within seconds, so API revenue rises with analytics quality.
Cable mobile growth adds a new class of buyers
Cable companies selling mobile service on host networks form a fast-growing buyer group for analytics vendors. Charter served 12.5 million mobile lines on June 30, 2026, including about 441,000 small business lines, according to its second-quarter release. These operators do not own most of the radio network, so they rely on usage, device and roaming data to manage costs and offload traffic to their own Wi-Fi. CTIA said 46% of U.S. connected devices in 2025 were not phones, which adds tablets, watches and sensors to each account. Suppliers offering subscription analytics sized for virtual operators can win these buyers faster than nationwide carriers.
AI traffic and edge services open enterprise data deals
AI workloads are creating a new class of traffic that operators can measure, price and sell, which opens room for analytics. CTIA expects AI traffic to grow about three times faster than conventional wireless traffic and to reach nearly a third of broadband traffic by 2034. Verizon agreed on Nov. 3, 2025 to build new long-haul fiber paths connecting AWS data centers for AI workloads. Lumen and IBM announced on May 6, 2025 that they would combine watsonx with Lumen edge infrastructure offering latency below five milliseconds. Operators that can prove latency and throughput per customer will sell premium enterprise contracts.
Liability, rule reversals and price cuts test budgets
Vendor data liability slows cloud projects
Sharing customer records with outside platforms now carries direct regulatory cost for operators. The USD 13 million AT&T settlement noted above followed a January 2023 breach in which attackers took customer data from a vendor cloud long after it should have been destroyed, according to Telecompetitor. The consent decree requires vendor oversight, a data inventory program and retention controls. Operators therefore add legal and security reviews to every analytics contract, which lengthens sales cycles for cloud vendors.
Shifting cybersecurity rules blur security spending plans
Federal cyber policy has changed direction twice in a year, which makes long-term security analytics budgets harder to set. The FCC voted 2-1 in November 2025 to rescind its January 2025 CALEA ruling that required carriers to secure their networks, according to The Register, and moved to voluntary commitments. Operators that had planned spending around the mandate must now justify it on risk alone. Vendors selling compliance-led analytics face slower approvals until the policy settles.
Price competition squeezes software budgets
Lower consumer prices leave operators less room to expand analytics spending without clear payback. CTIA said the real price of a typical unlimited plan fell more than 10% in 2025, while average speeds rose 51%. Finance teams therefore ask vendors to tie fees to churn reduction, cost savings or new revenue. Suppliers that cannot show measured outcomes within a year risk losing renewals to in-house teams or cloud tools.
Single-vendor radio stacks limit open analytics
Large radio contracts can narrow which analytics tools reach the network edge. Light Reading reported in May 2024 that AT&T was removing Nokia equipment and that Ericsson did not support xApps, so developers such as Cohere Technologies could not yet submit near-real-time apps to its store. Third-party suppliers are limited to slower rApps on that network. Independent vendors must partner with the radio supplier, which shifts margin toward the incumbent.
The South leads on population and network build activity
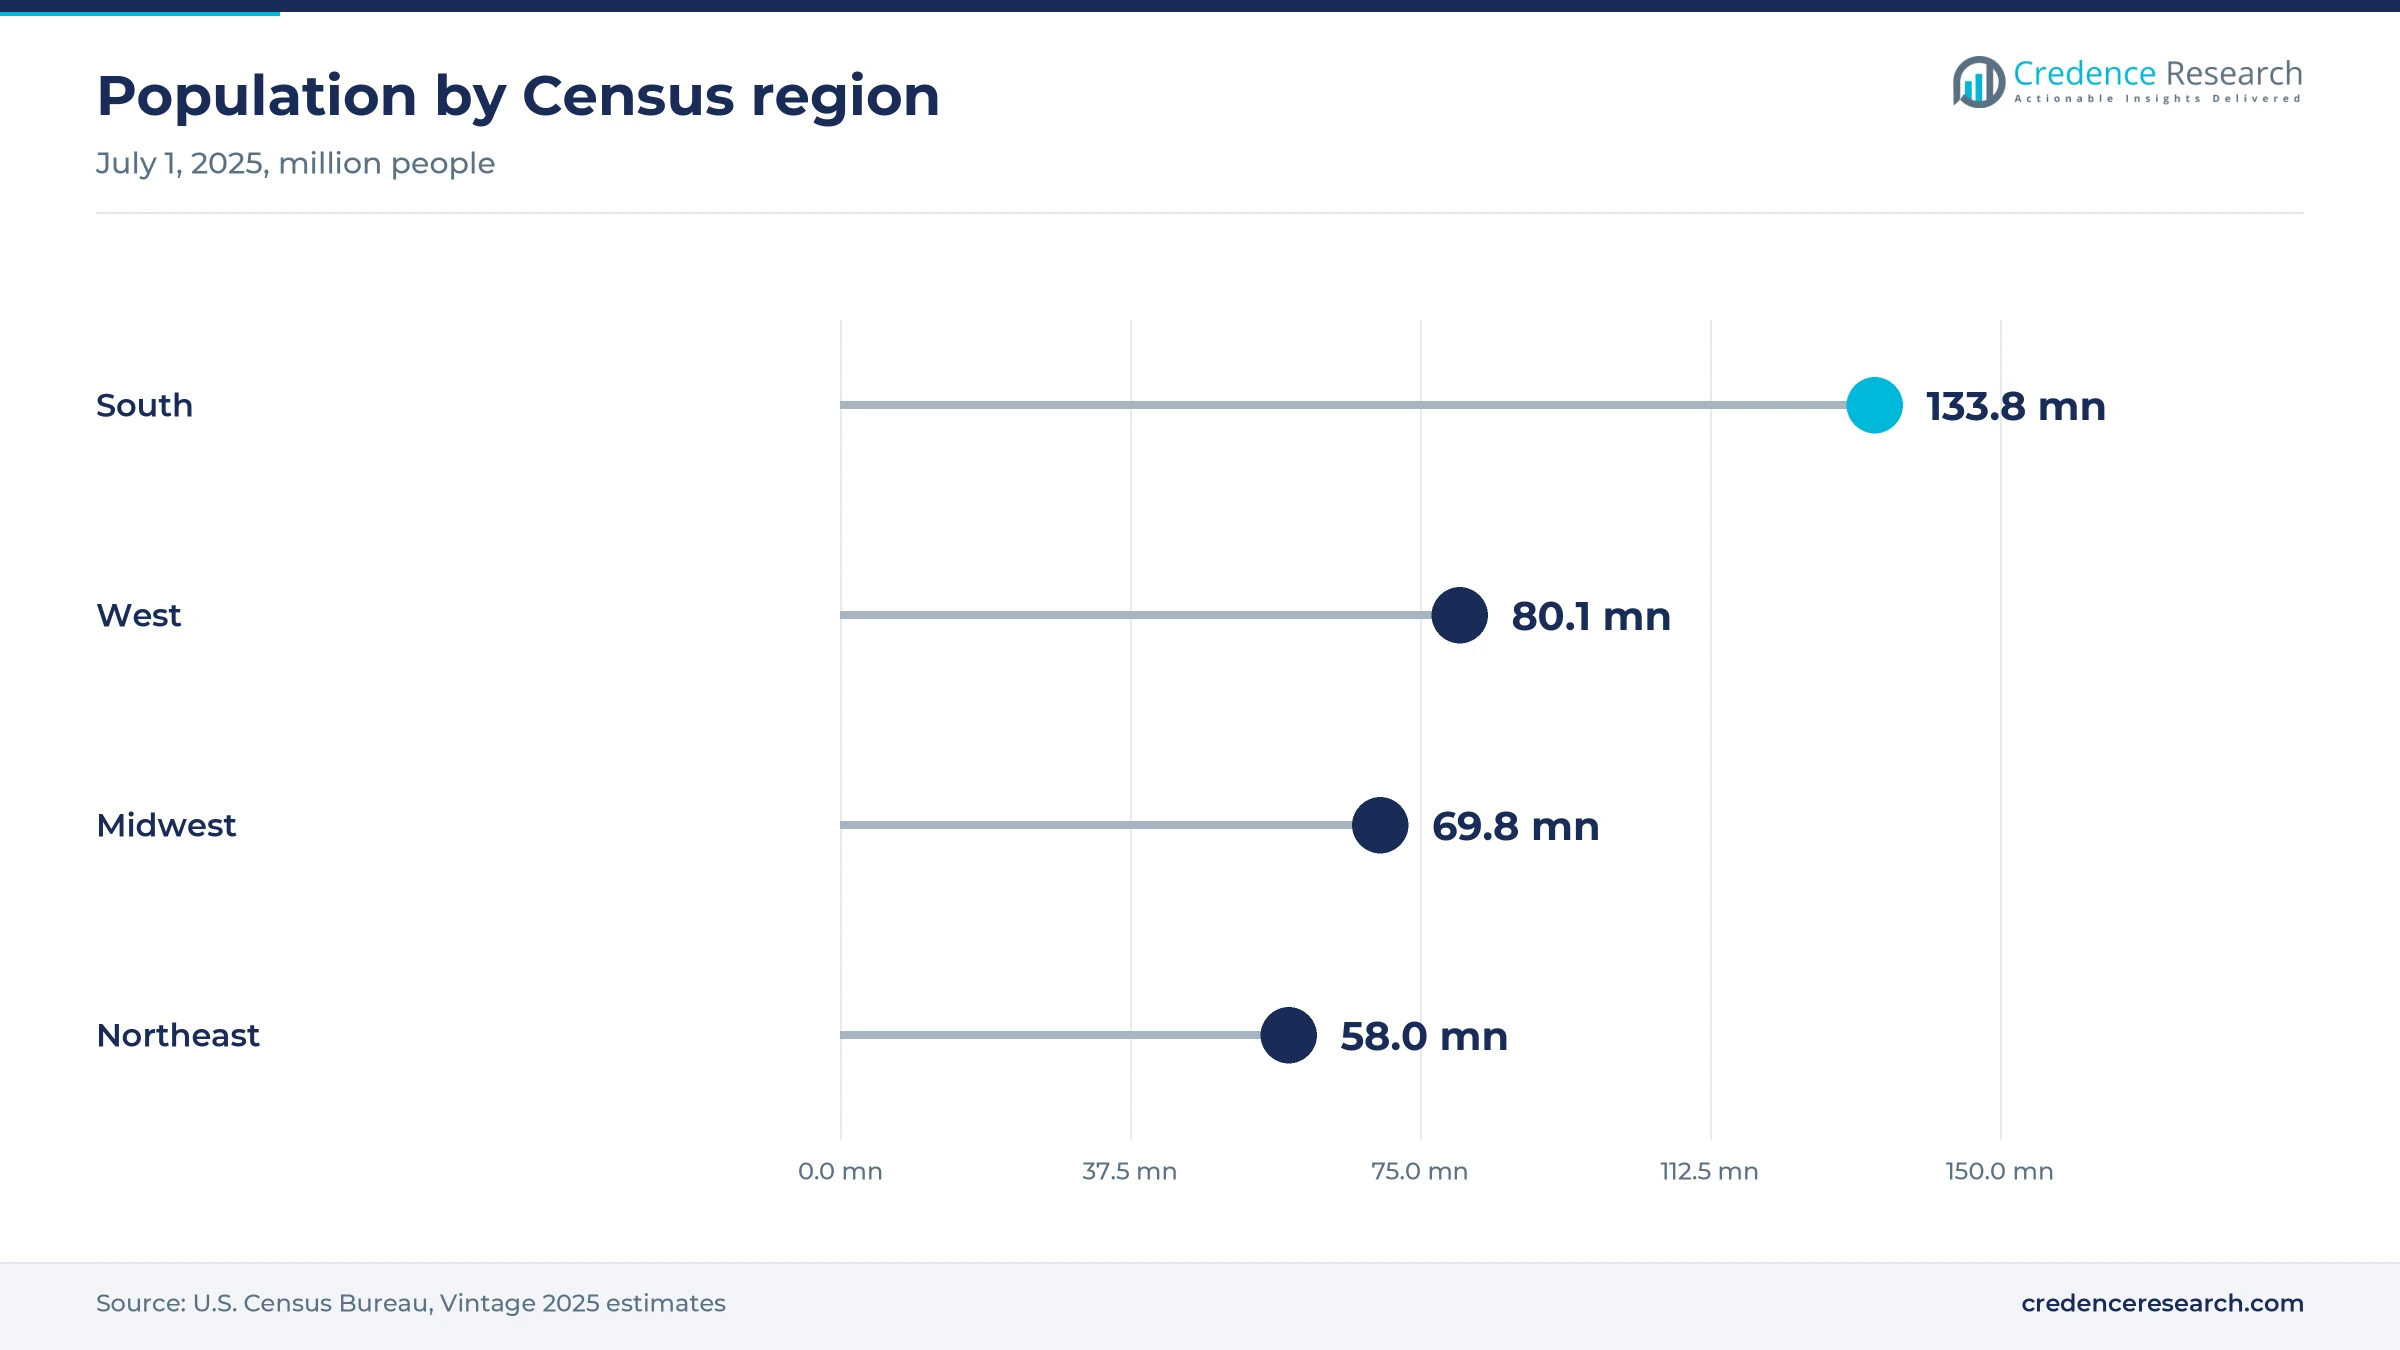
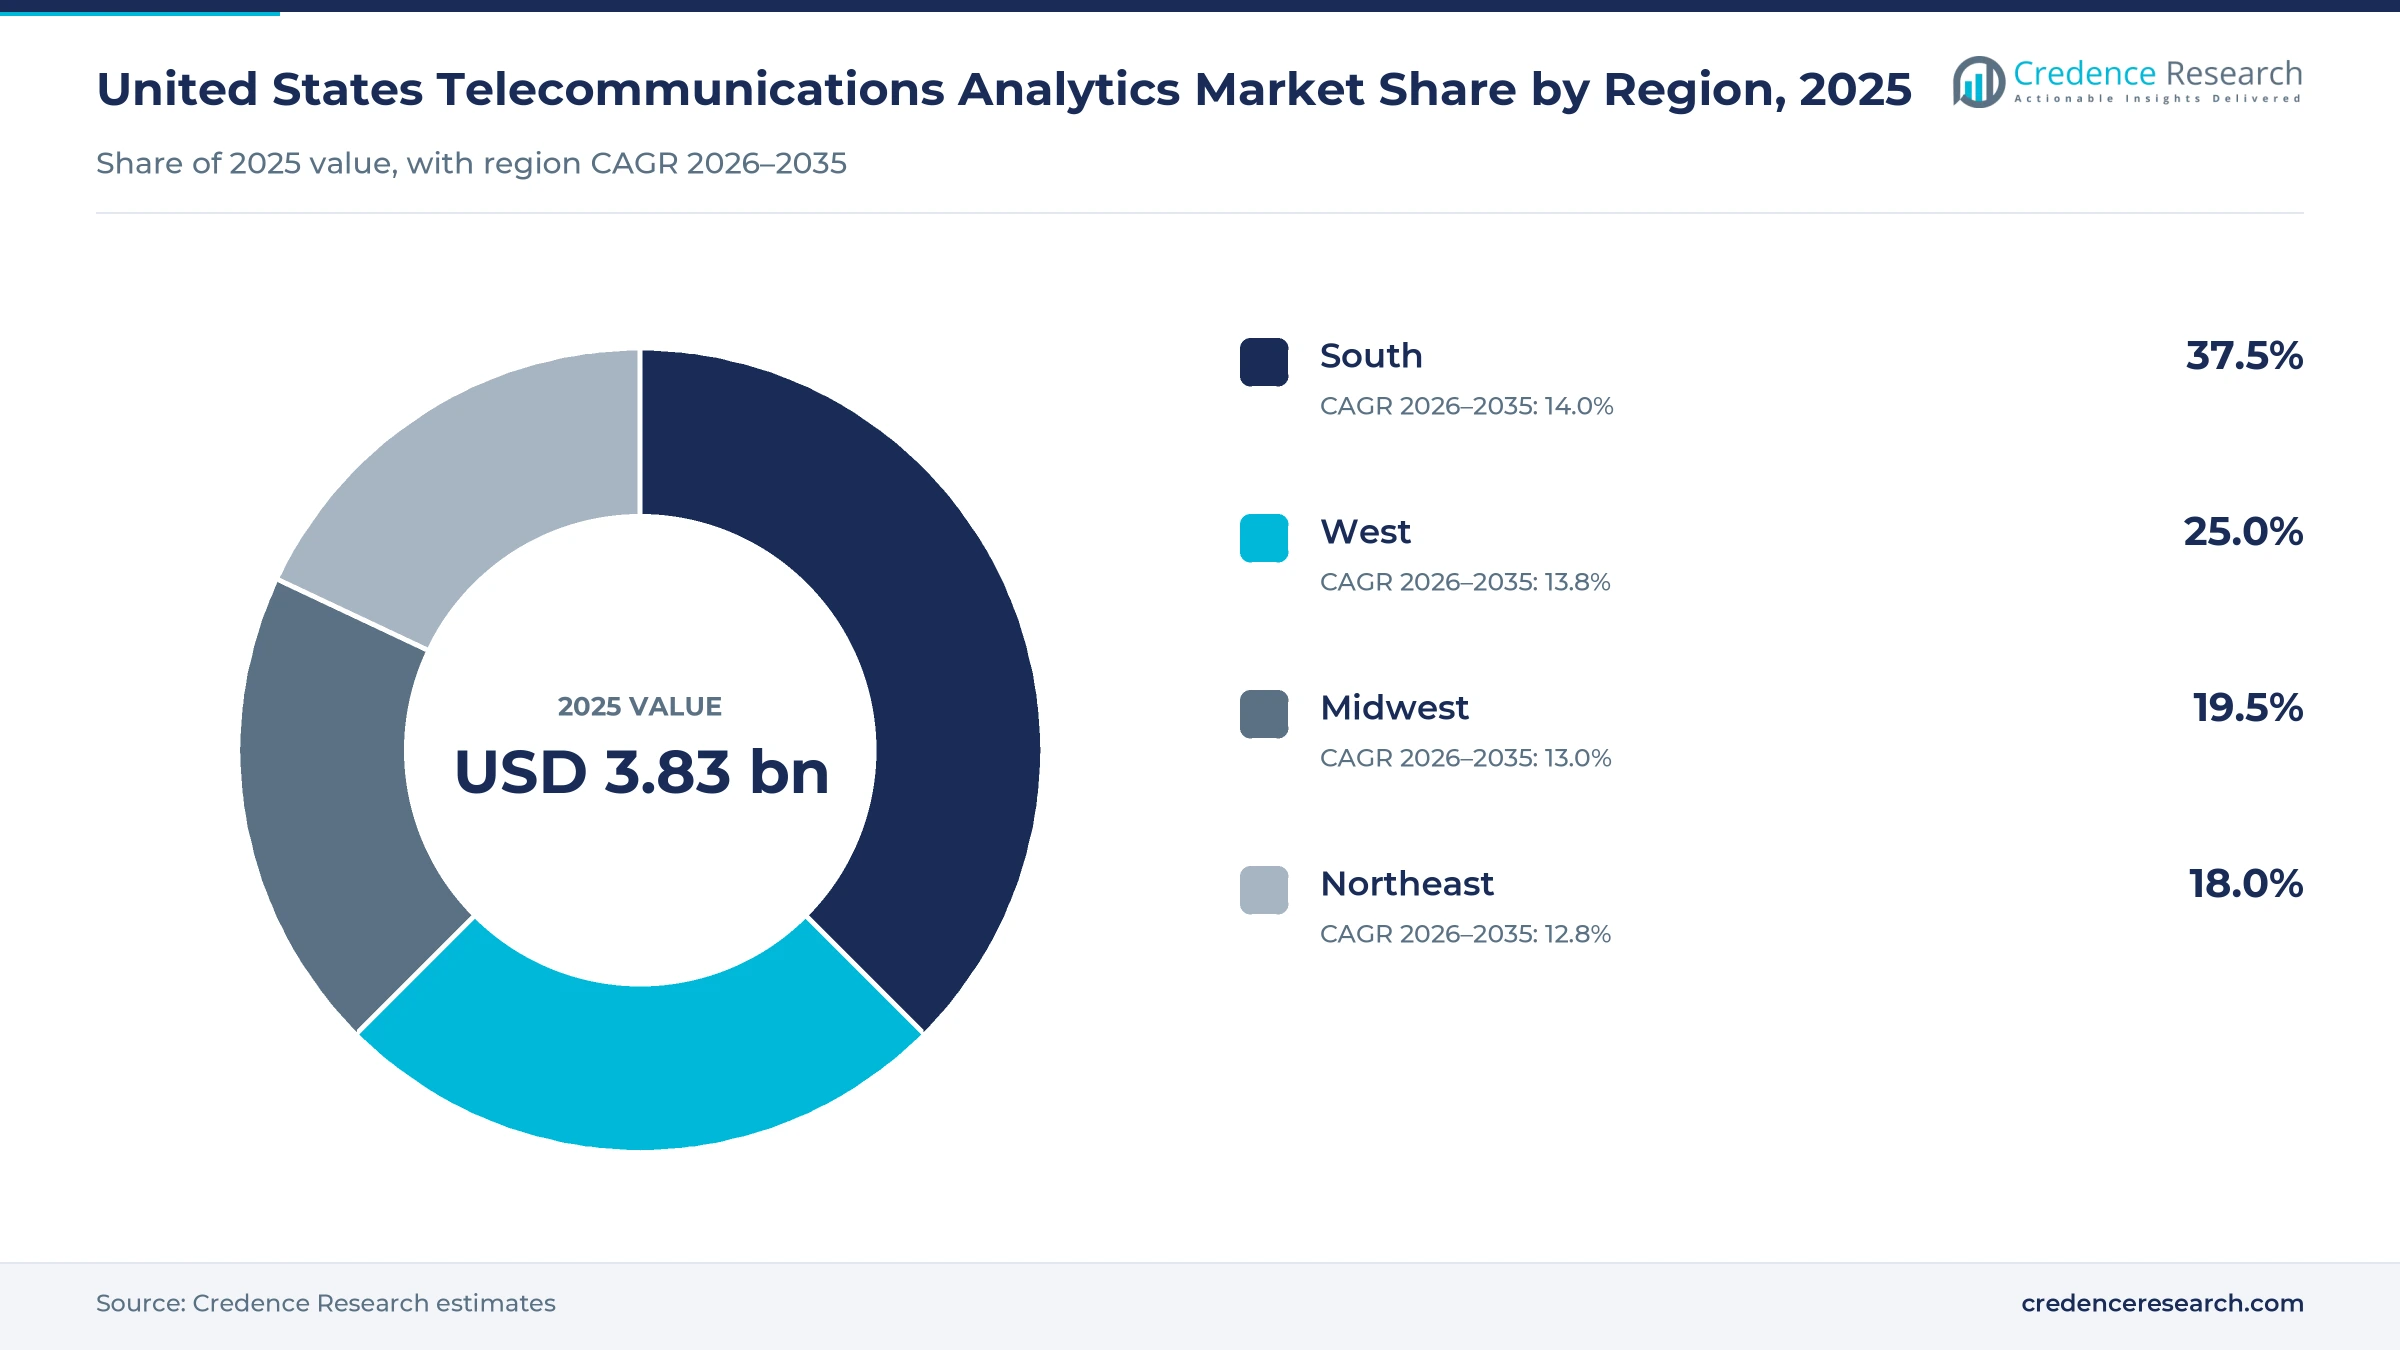
United States telecommunications analytics spending is split across four Census regions that held 341.8 million residents in 2025, according to the Census Bureau. Regional shares are Credence Research estimates that weight population, subscriber counts, network site activity and operator operations in each region.
| Region | Value, 2025 (USD billion) | Share, 2025 | CAGR, 2026–2035 |
|---|---|---|---|
| South | 1.43 | 37.5% | 14.0% |
| West | 0.96 | 25.0% | 13.8% |
| Midwest | 0.75 | 19.5% | 13.0% |
| Northeast | 0.69 | 18.0% | 12.8% |
The South leads as population and networks expand
The South held 37.5% of 2025 value and grows at 14.0% a year, the fastest of the four regions. Census Bureau estimates put its population at 133.8 million on July 1, 2025, up 6.0% since 2020 and nearly twice the national rate of 3.1%. New subdivisions and data center campuses need fresh cell sites, fiber and capacity planning. AT&T, headquartered in Dallas, runs large network and care operations in the region, which keeps analytics contracts concentrated there.
The West pairs dense metros with early AI adoption
The West held 25.0% of 2025 value and grows at 13.8% a year. Its population reached 80.1 million in 2025, up 1.9% since 2020, according to the Census Bureau. Dense coastal metros carry heavy mobile data loads and many small cells, so operators spend more on congestion and assurance analytics per subscriber. Technology buyers in the region also take up AI-driven care and network API services early.
The Midwest grows through rural broadband builds
The Midwest held 19.5% of 2025 value and grows at 13.0% a year. Its population rose 1.1% from 2020 to 69.8 million in 2025, according to the Census Bureau, so subscriber growth is modest. Demand comes from regional and rural operators building fiber and fixed wireless with BEAD funds, which need planning and assurance tools sized for smaller networks. Subscription pricing suits these smaller buyers better than large multi-year licenses.
The Northeast relies on upgrades in dense cities
The Northeast held 18.0% of 2025 value and grows at 12.8% a year, the slowest of the four regions. Its population of 58.0 million in 2025 was only 0.7% above the 2020 level, according to the Census Bureau. Dense cities, older copper and cable plants, and heavy enterprise traffic keep spending per site high. Most demand comes from replacing legacy network management tools rather than from new subscribers.
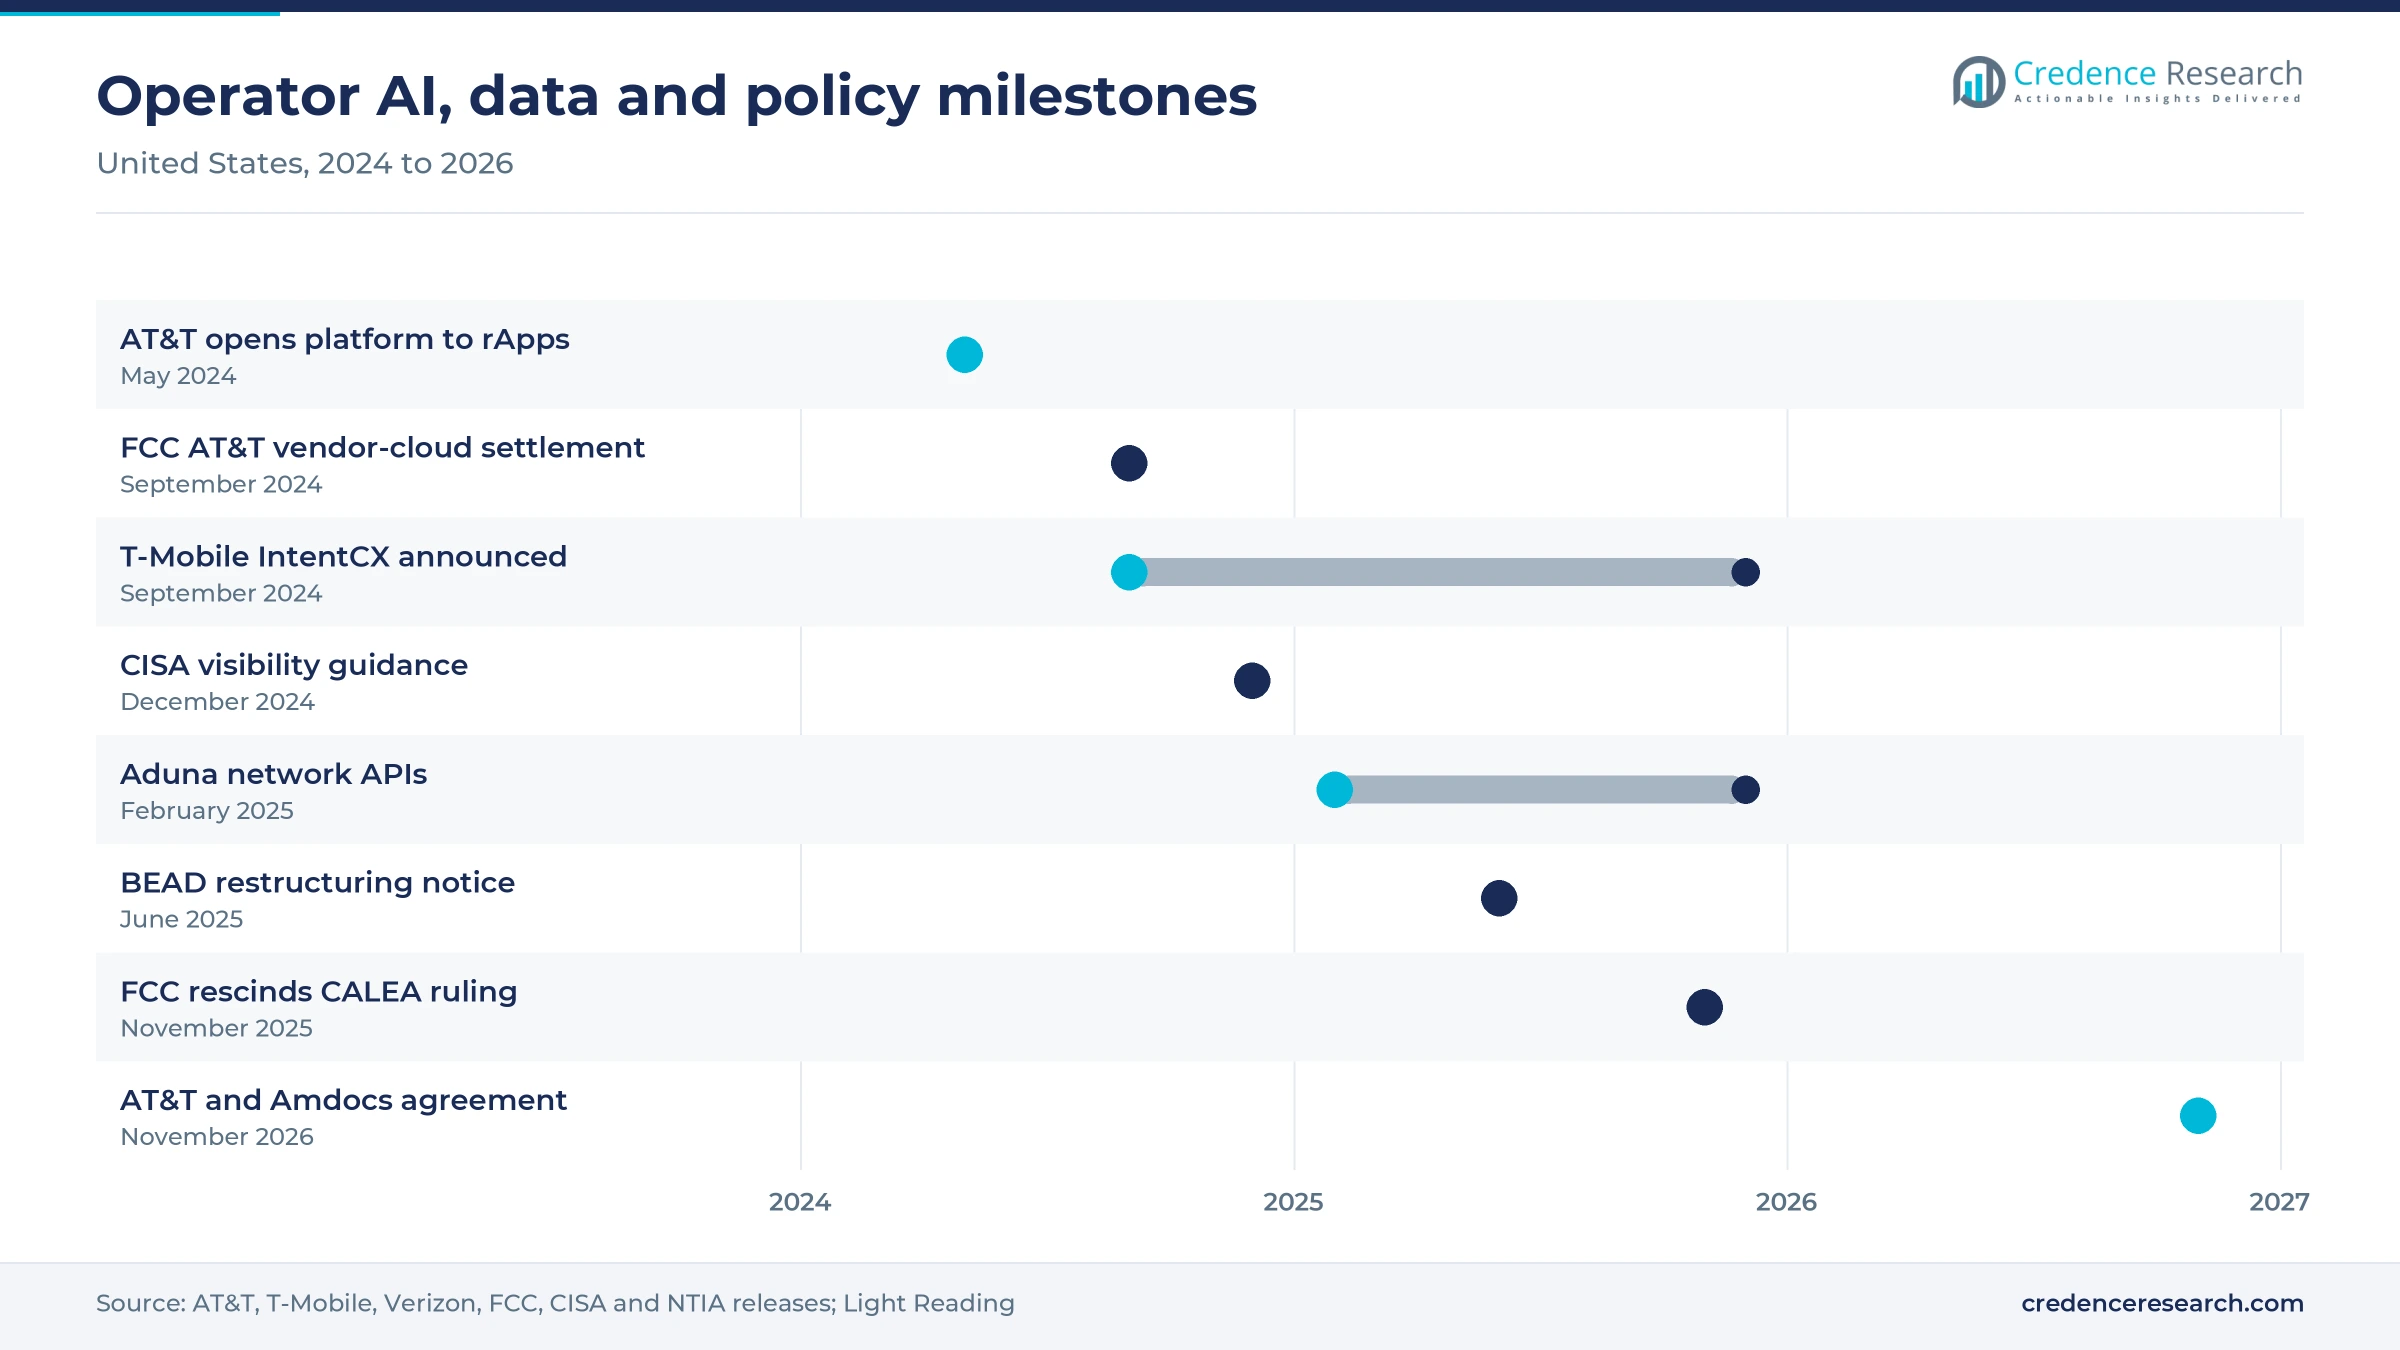
Operator AI deals defined 2024 to 2026 buying decisions
| Development | Status and market relevance |
|---|---|
| In May 2024, AT&T opened its Ericsson-run management platform to third-party rApps for energy, spectrum and AI uses. | In progress; widens network analytics suppliers |
| In September 2024, T-Mobile and OpenAI announced IntentCX, an AI decision platform using real-time customer and network data. | Announced; launch planned for 2025 |
| In February 2025, AT&T, T-Mobile and Verizon agreed to offer Number Verification and SIM Swap APIs through Aduna. | Launched; network data sold to developers |
| In April 2025, Verizon deployed a Gemini-based research assistant for 28,000 care representatives with Google Cloud. | Deployed; cloud AI in customer care |
| In November 2026, AT&T and Amdocs signed an eight-year agreement to modernize operations with the Amdocs aOS platform. | Signed; embedded AI in core systems |
SIEM, NWDAF, radio apps and AI agents shape analytics stacks
- SIEM and log analytics collect configuration, authentication and flow records from routers and firewalls, which the December 2024 federal guidance asks operators to centralize and store securely.
- Network data analytics functions sit inside the 5G standalone core and feed load and quality predictions to other network functions, and Oracle Communications lists an NWDAF product for this role.
- rApps on service management platforms automate radio tuning, energy saving and spectrum sharing on a non-real-time controller, as AT&T is testing with Ericsson partners.
- Generative AI agents read billing, usage and network records during a customer contact and suggest or take actions, which ties care analytics to revenue.
Need a Custom Version of This Report?
Tailor the scope, geography, or segments to your exact requirements.
- Custom geography or segment scope
- Direct access to our analyst team
Platform owners and network vendors vie for operator data
Competition in United States telecommunications analytics turns on who controls the data that links the network to the customer account. Amdocs leads in business and customer operations through its expanded AT&T agreement and its aOS agentic platform. Ericsson supplies AT&T radio, core software and the management platform that hosts third-party rApps, and it holds a stake in Aduna, which sells network APIs from the three national carriers. Nokia supplies T-Mobile radios and MantaRay SON automation under a multi-year extension signed in April 2025. IBM partners with Lumen to run watsonx models on edge infrastructure, with IBM Consulting as the preferred integrator. Oracle renewed a five-year cloud agreement with AT&T covering databases, Fusion Cloud ERP and Fusion Cloud CX. Cloud providers such as Google Cloud and AWS compete for the data and AI layer, so suppliers increasingly partner with them rather than build every component alone.
Platform owners, network vendors and integrators form three tiers
The U.S. supply side splits into three tiers with different economics. Billing, care and data platform owners such as Amdocs and Oracle hold long contracts with nationwide operator groups and earn most margin on licenses and managed operations. Network vendors such as Ericsson and Nokia bundle analytics and automation with radio and core equipment, which gives them privileged access to telemetry. IBM and other integrators build and run models across both layers. Regional operator groups and specialist access providers buy smaller subscriptions, and contract length and data access keep the top tier concentrated.
Companies profiled and their roles in this market
| Company | Type | Role in the market |
|---|---|---|
| Amdocs | Billing, care and AI platform provider | Eight-year AT&T operations modernization on Amdocs aOS from November 2026 |
| Ericsson | Network vendor and API venture partner | AT&T radio and management platform with third-party rApps; Aduna network APIs |
| Nokia | Network vendor | T-Mobile radio supply with MantaRay SON automation under an April 2025 extension |
| IBM | AI platform and integrator | watsonx edge AI with Lumen, with IBM Consulting as preferred integrator |
| Oracle | Cloud, database and CX provider | Five-year AT&T cloud renewal for databases, ERP and customer experience applications |
Analytics spending follows AI into operator core systems
Credence Research's view is that United States telecommunications analytics budgets are shifting from separate dashboards toward AI that runs inside billing, care and network platforms. Contracts such as the AT&T and Amdocs agreement show buyers want vendors to share delivery risk and cost, not only sell software. The strongest growth sits where network and customer data meet, in care, fraud prevention and API services. Suppliers that can show measured churn, cost or revenue results, and that meet federal data rules, will take share from point tools as operators consolidate vendors. Demand for analytics tied to network APIs and slicing should rise fastest after 2027, once carriers turn AI pilots into contracts.
Operator data, filings and list prices anchor the estimate
The report uses 2025 as the base year and forecasts to 2035. Market values come from the Credence Research model, built from operator investment and subscriber data, published vendor agreements, list prices of cloud data platforms and a check against operator spending on IT. Segment and regional splits are Credence Research estimates informed by CTIA, Census Bureau, FCC and NTIA data, company releases and filings, and trade press. No interviews or surveys were conducted for this edition of the report.
Analytics becomes the control layer of U.S. networks
Between 2026 and 2035, United States telecommunications analytics grows from USD 4.35 billion to USD 13.68 billion, and analytics becomes the layer that decides how U.S. operators spend capital, serve customers and price new services. Embedded modules and public cloud gain share as AI moves into core systems, while hybrid estates stay the norm for subscriber records. Network APIs, network slicing and AI traffic give operators new data products to measure and sell. Virtual operators and regional builders widen the buyer base, which favors subscription pricing. The pace depends on how quickly operators turn AI pilots into contracts with measurable results.
Outcomes depend on how fast AI moves into core systems
The range of outcomes to 2035 depends mainly on how quickly operators move AI from pilots into billing, care and network platforms, and on whether federal data rules stay stable. A downside case follows if price competition cuts software budgets and data liability slows cloud projects. The upside case needs network APIs and AI traffic to create paid services that justify larger analytics contracts.
| Scenario | CAGR, 2026–2035 | Value, 2035 | What has to hold |
|---|---|---|---|
| Downside | 11.6% | USD 11.66 billion | Price cuts and data liability keep AI in pilots and delay cloud moves |
| Base | 13.57% | USD 13.68 billion | Operators embed AI in care and network platforms at the current pace |
| Upside | 15.1% | USD 15.40 billion | Network APIs, slicing and AI traffic turn analytics into paid services |
Frequently Asked Questions
How big is the United States telecommunications analytics market?
Which solution type leads the market?
Which region holds the largest share?
What drives demand for telecom analytics in the United States?
Why do virtual network operators grow fastest by customer type?
How is telecom analytics priced?
What are the main challenges for the market?
Which companies compete in the market?
Table of Content
Chapter 1 Market Segmentation
- 1.1 Segmentation Framework
- 1.1.1 Product and Service Classification
- 1.1.2 Application and End-Use Classification
- 1.1.3 Technology and Solution Classification
- 1.1.4 Customer and Distribution Channel Classification
- 1.1.5 Geographic Segmentation
- 1.1.6 Market Segment Definitions and Boundaries
- 1.2 By Solution Type
- 1.2.1 Standalone analytics software
- 1.2.2 Embedded analytics modules
- 1.2.3 Analytics services
- 1.3 By Deployment Model
- 1.3.1 Hybrid
- 1.3.2 Public cloud
- 1.3.3 On-premises
- 1.4 By Customer Type
- 1.4.1 Facilities-based mobile operators
- 1.4.2 Fixed connectivity operators
- 1.4.3 Mobile virtual network operators
- 1.5 By Application
- 1.5.1 Network and service assurance
- 1.5.2 Customer and revenue analytics
- 1.5.3 Cross-domain analytics enablement
- 1.5.4 Marketing analytics
Chapter 2 Introduction
- 2.1 Report Objectives and Scope
- 2.2 Product Definition and Industry Terminology
- 2.3 Market Inclusions and Exclusions
- 2.4 Research Process
- 2.4.1 Primary Research and Expert Interviews
- 2.4.2 Secondary Research and Source Review
- 2.4.3 Top-Down and Bottom-Up Estimation
- 2.4.4 Data Triangulation and Verification
- 2.5 Market Size Measurement Basis
- 2.5.1 2025: USD 3.83 billion → 2035: USD 13.68 billion
- 2.6 Historical and Forecast Reference Periods
- 2.6.1 Historical Period: 2018-2025
- 2.6.2 Base Year: 2025
- 2.6.3 Forecast Period: 2025-2035
- 2.7 Research Assumptions and Limitations
Chapter 3 Executive Summary
- 3.1 Market Snapshot and Key Findings
- 3.2 Base-Year Market Size, 2025
- 3.3 Forecast Market Size, 2035
- 3.4 Revenue and Volume Growth Outlook
- 3.5 Key Demand and Supply Indicators
- 3.6 Leading Market Segments
- 3.7 Fastest-Growing Market Opportunities
- 3.8 Regional Performance Highlights
- 3.9 Technology and Industry Transformation
- 3.10 Competitive Landscape Summary
- 3.11 Analyst View and Strategic Implications
Chapter 4 United States Telecommunications Analytics Market Trends and Developments
- 4.1 Historical Industry Development, 2018-2025
- 4.2 Recent Market Trends and Developments
- 4.3 Demand and Customer Behavior Trends
- 4.4 Technology and Product Innovation
- 4.5 Artificial Intelligence, Automation and Digitalization
- 4.6 Local Manufacturing and Supply Chain Realignment
- 4.7 Industry Partnerships, Mergers and Acquisitions
- 4.8 Sustainability and Circular Economy Developments
- 4.9 Government and Private Sector Investment Trends
- 4.10 Emerging Business Models and Commercialization
- 4.11 Industry Developments and Announcements
Chapter 5 United States Telecommunications Analytics Market Supply and Demand Analysis
- 5.1 Demand Trend and Consumption Analysis, 2018-2025
- 5.2 Demand Forecast, 2025-2035
- 5.3 Supply Chain Structure and Procurement Trends
- 5.4 Supply-Demand Gap and Bottlenecks
- 5.5 Import Dependence and Sourcing Structure
- 5.6 Regional Supply and Demand Concentration
Chapter 6 United States Telecommunications Analytics Market Pricing Analysis
- 6.1 Pricing Structure and Measurement
- 6.2 Historical Pricing Trends, 2018-2025
- 6.3 Pricing Outlook, 2025-2035
- 6.4 Pricing by Product and Market Segment
- 6.5 Geographic Pricing Differences
- 6.6 Key Input, Energy, Labor and Logistics Costs
- 6.7 Contract Pricing and Purchasing Models
- 6.8 Pricing Sensitivity and Competitive Positioning
- 6.9 Price, Margin and Profitability Implications
Chapter 7 United States Telecommunications Analytics Market Dynamics
- 7.1 Market Growth Drivers
- 7.1.1 Demand-Side Drivers
- 7.1.2 Technology and Innovation Drivers
- 7.1.3 Infrastructure and Investment Drivers
- 7.1.4 Regulatory and Policy Drivers
- 7.2 Market Restraints
- 7.2.1 Cost and Affordability Constraints
- 7.2.2 Technology and Adoption Barriers
- 7.2.3 Supply Chain and Operational Constraints
- 7.3 Market Challenges
- 7.3.1 Competitive Pressure and Margin Erosion
- 7.3.2 Skills, Infrastructure and Implementation Gaps
- 7.4 Emerging Market Opportunities
- 7.5 Market Dynamics Impact and Time-Horizon Assessment
Chapter 8 United States Telecommunications Analytics Value Chain Analysis
- 8.1 Industry Value Chain Overview
- 8.2 Upstream Suppliers and Critical Inputs
- 8.3 Technology and Component Providers
- 8.4 Manufacturing or Service Delivery
- 8.5 Distribution, Channel Partners and Integrators
- 8.6 Downstream Applications and End Users
- 8.7 Value Addition and Profit Pools
- 8.8 Vertical Integration and Outsourcing
- 8.9 Supplier Concentration and Risk
- 8.10 Supply Chain Localization and Resilience
Chapter 9 United States Telecommunications Analytics Market Regulations and Policies
- 9.1 Relevant Laws, Standards and Compliance Frameworks
- 9.2 Product, Service, Safety and Quality Requirements
- 9.3 Government Policies, Incentives and Subsidies
- 9.4 Imports, Exports and Trade Barriers
- 9.5 Public Procurement and Local Content Requirements
- 9.6 Data Protection, AI and Cybersecurity Compliance
- 9.7 Upcoming Policy Changes and Market Implications
Chapter 10 United States Telecommunications Analytics Market Hotspots and Opportunities
- 10.1 Market Opportunity Mapping and Growth Hotspots
- 10.2 High-Growth Applications and Customer Groups
- 10.3 Underserved Markets and White-Space Opportunities
- 10.4 Emerging Technology and Product Opportunities
- 10.5 New Capacity and Investment Hotspots
- 10.6 Market Entry and Expansion Opportunities
- 10.7 Distribution and Partnership Opportunities
- 10.8 Near-Term and Long-Term Commercial Potential
- 10.9 Opportunity Attractiveness and Execution Risks
Chapter 11 United States Telecommunications Analytics Market Outlook, 2025-2035
- 11.1 Market Size and Analysis
- 11.1.1 Revenue (Market Measurement: 2025: USD 3.83 billion → 2035: USD 13.68 billion)
- 11.1.2 Historical Market Size, 2018-2025
- 11.1.3 Base-Year Market Size, 2025
- 11.2 Market Forecast, 2025-2035
- 11.2.1 Revenue Forecast to 2035
- 11.2.2 CAGR and Year-on-Year Growth
- 11.2.3 Incremental Revenue Opportunity
- 11.3 Forecast Assumptions and Scenario Analysis
- 11.3.1 Base-Case Forecast
- 11.3.2 Optimistic and Conservative Scenarios
- 11.3.3 Technology, Pricing and Policy Sensitivities
- 11.4 Market Attractiveness and Growth Outlook
Chapter 12 United States Telecommunications Analytics Market Segmentation and Outlook
- 12.1 Segmentation Summary and Market Shares, 2025
- 12.2 Largest and Fastest-Growing Segments
- 12.3 By Solution Type - Market Size and Forecast, 2025-2035
- 12.3.1 Segment Definition and Scope
- 12.3.2 Historical Market Size, 2018-2025
- 12.3.3 Revenue Forecast, 2025-2035
- 12.3.4 Base-Year Market Share, 2025
- 12.3.5 Segment CAGR and Growth Drivers
- 12.3.6 Subsegment Market Size and Forecast
- 12.3.6.1 Standalone analytics software
- 12.3.6.2 Embedded analytics modules
- 12.3.6.3 Analytics services
- 12.3.7 Subsegment Pricing and Adoption Trends
- 12.3.8 Leading Suppliers and Competition
- 12.3.9 Regional Demand and Opportunities
- 12.4 By Deployment Model - Market Size and Forecast, 2025-2035
- 12.4.1 Segment Definition and Scope
- 12.4.2 Historical Market Size, 2018-2025
- 12.4.3 Revenue Forecast, 2025-2035
- 12.4.4 Base-Year Market Share, 2025
- 12.4.5 Segment CAGR and Growth Drivers
- 12.4.6 Subsegment Market Size and Forecast
- 12.4.6.1 Hybrid
- 12.4.6.2 Public cloud
- 12.4.6.3 On-premises
- 12.4.7 Subsegment Pricing and Adoption Trends
- 12.4.8 Leading Suppliers and Competition
- 12.4.9 Regional Demand and Opportunities
- 12.5 By Customer Type - Market Size and Forecast, 2025-2035
- 12.5.1 Segment Definition and Scope
- 12.5.2 Historical Market Size, 2018-2025
- 12.5.3 Revenue Forecast, 2025-2035
- 12.5.4 Base-Year Market Share, 2025
- 12.5.5 Segment CAGR and Growth Drivers
- 12.5.6 Subsegment Market Size and Forecast
- 12.5.6.1 Facilities-based mobile operators
- 12.5.6.2 Fixed connectivity operators
- 12.5.6.3 Mobile virtual network operators
- 12.5.7 Subsegment Pricing and Adoption Trends
- 12.5.8 Leading Suppliers and Competition
- 12.5.9 Regional Demand and Opportunities
- 12.6 By Application - Market Size and Forecast, 2025-2035
- 12.6.1 Segment Definition and Scope
- 12.6.2 Historical Market Size, 2018-2025
- 12.6.3 Revenue Forecast, 2025-2035
- 12.6.4 Base-Year Market Share, 2025
- 12.6.5 Segment CAGR and Growth Drivers
- 12.6.6 Subsegment Market Size and Forecast
- 12.6.6.1 Network and service assurance
- 12.6.6.2 Customer and revenue analytics
- 12.6.6.3 Cross-domain analytics enablement
- 12.6.6.4 Marketing analytics
- 12.6.7 Subsegment Pricing and Adoption Trends
- 12.6.8 Leading Suppliers and Competition
- 12.6.9 Regional Demand and Opportunities
- 12.7 Segment Growth Comparison
- 12.8 Segment Attractiveness and Priority Matrix
Chapter 13 United States Telecommunications Analytics End-Use and Application Market Outlook
- 13.1 End-Use Industry and Customer Demand Structure
- 13.2 Leading Applications and Customer Groups
- 13.3 End-Use Market Size, Share and Forecast
- 13.4 Major End-Use Industry Deep Dives
- 13.4.1 Customer Requirements and Use Cases
- 13.4.2 Demand and Replacement Cycles
- 13.4.3 Technical and Regulatory Considerations
- 13.4.4 Purchasing and Procurement Models
- 13.4.5 Leading Vendors and Distribution Channels
- 13.4.6 Forecast and Commercial Opportunities
- 13.5 Emerging Applications and Cross-Segment Demand
- 13.6 End-Use Industry Investment Priorities
Chapter 14 United States Telecommunications Analytics Geographic Market Outlook, 2025-2035
- 14.1 Domestic Market Distribution and Demand Clusters
- 14.2 State- or Province-Wise Market Size and Forecast, 2025-2035
- 14.3 City and Metropolitan Market Outlook
- 14.4 Industrial, Manufacturing and Commercial Clusters
- 14.5 Geographic Concentration of Key End Users
- 14.6 Local Pricing and Purchasing Differences
- 14.7 Domestic Production Facilities and Capacity Map
- 14.8 Local Infrastructure and Project Pipeline
- 14.9 State-Level Policy and Incentive Differences
- 14.10 Subnational Investment Hotspots and Opportunities
- 14.11 Distribution and Logistics Networks
- 14.12 Domestic Competitive Footprint
Chapter 15 United States Telecommunications Analytics Technology, Innovation and Sustainability Outlook
- 15.1 Technology Landscape and Maturity
- 15.2 Product, Process and Service Innovation
- 15.3 AI, Automation and Digital Tools in the Industry
- 15.4 Technology Adoption and Performance Benchmarking
- 15.5 Innovation Pipeline and R&D Investment
- 15.6 Patent and Intellectual Property Trends
- 15.7 Energy Efficiency and Resource Management
- 15.8 Sustainability, Recycling and Circularity
- 15.9 Technology Roadmap, 2025-2035
- 15.10 Risks of Obsolescence and Technology Substitution
Chapter 16 United States Telecommunications Analytics Market Key Strategic Imperatives
- 16.1 Growth and Market Entry Priorities
- 16.2 High-Return Products and Segments
- 16.3 Pricing, Profitability and Cost Optimization
- 16.4 Technology Investment and Product Differentiation
- 16.5 Supply Chain Localization and Resilience
- 16.6 Distribution and Customer Acquisition
- 16.7 Partnership, Acquisition and Capacity Strategy
- 16.8 Regional Expansion Priorities
- 16.9 Short-, Medium- and Long-Term Actions
Chapter 17 Competition Outlook
- 17.1 Industry Competition Characteristics
- 17.2 Market Structure and Concentration
- 17.3 Market Share and Competitive Positioning, 2025
- 17.4 Company-Wise Revenue and Product Benchmarking
- 17.5 Production and Service Capacity Benchmarking
- 17.6 Technology, Pricing and Differentiation
- 17.7 Regional Footprint and Distribution Strength
- 17.8 Mergers, Acquisitions and Strategic Alliances
- 17.9 New Entrants and Competitive Threats
- 17.10 Porter's Five Forces and Industry Attractiveness
- 17.11 Competitive Outlook, 2025-2035
Chapter 18 Company Profiles
- 18.1 Company Coverage and Selection Criteria
- 18.2 Amdocs
- 18.2.1 Business Description
- 18.2.2 Company Ownership and Geographic Presence
- 18.2.3 Product and Service Portfolio
- 18.2.4 Manufacturing and Operating Footprint
- 18.2.5 Financial Performance and Investment
- 18.2.6 Market Share and Competitive Position
- 18.2.7 Technology and Innovation Capabilities
- 18.2.8 Strategic Alliances or Partnerships
- 18.2.9 Recent Developments
- 18.2.10 Growth Strategy and Outlook
- 18.3 Oracle
- 18.4 IBM
- 18.5 Nokia
- 18.6 Ericsson
- 18.7 Other Relevant Market Participants
Note: Every listed company is profiled on the structure shown under the first company. The company list is preliminary and may change based on research findings, market developments, data availability and client requirements.
Chapter 19 Disclaimer
- 19.1 Research and Forecast Disclaimer
- 19.2 Data Source and Estimation Limitations
Note: The depth of individual sections depends on data availability for this market. Volume, capacity, trade and other unit-based metrics are included where applicable.

