
About 200 faults a year keep repair ships on standby
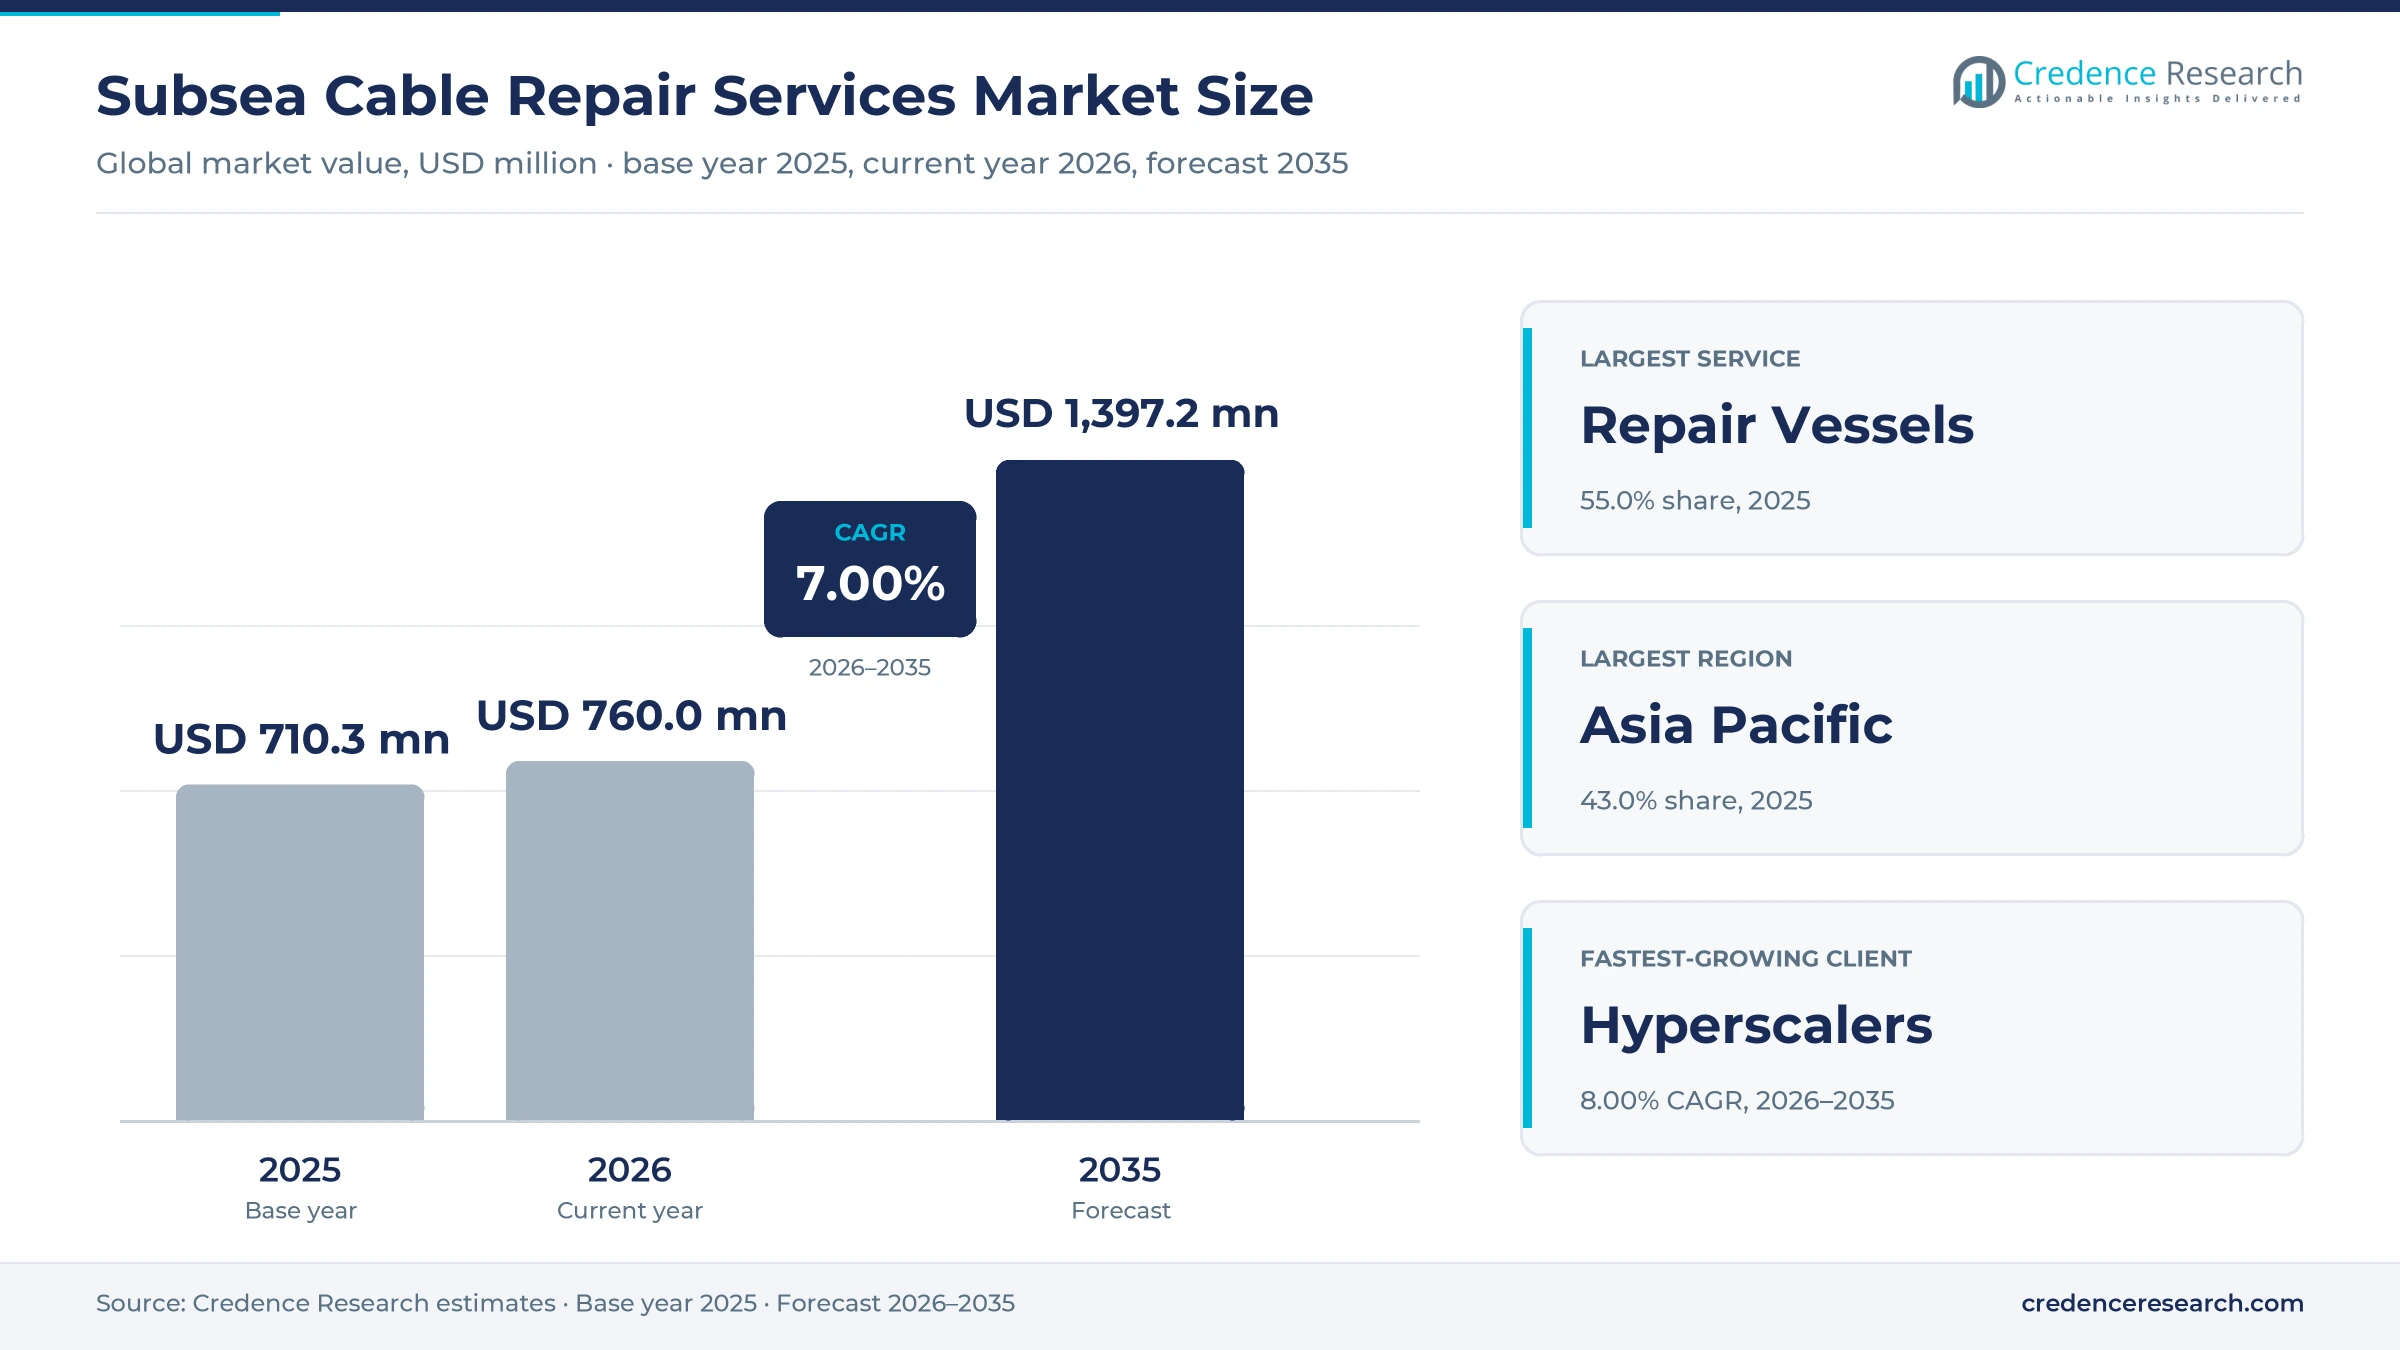
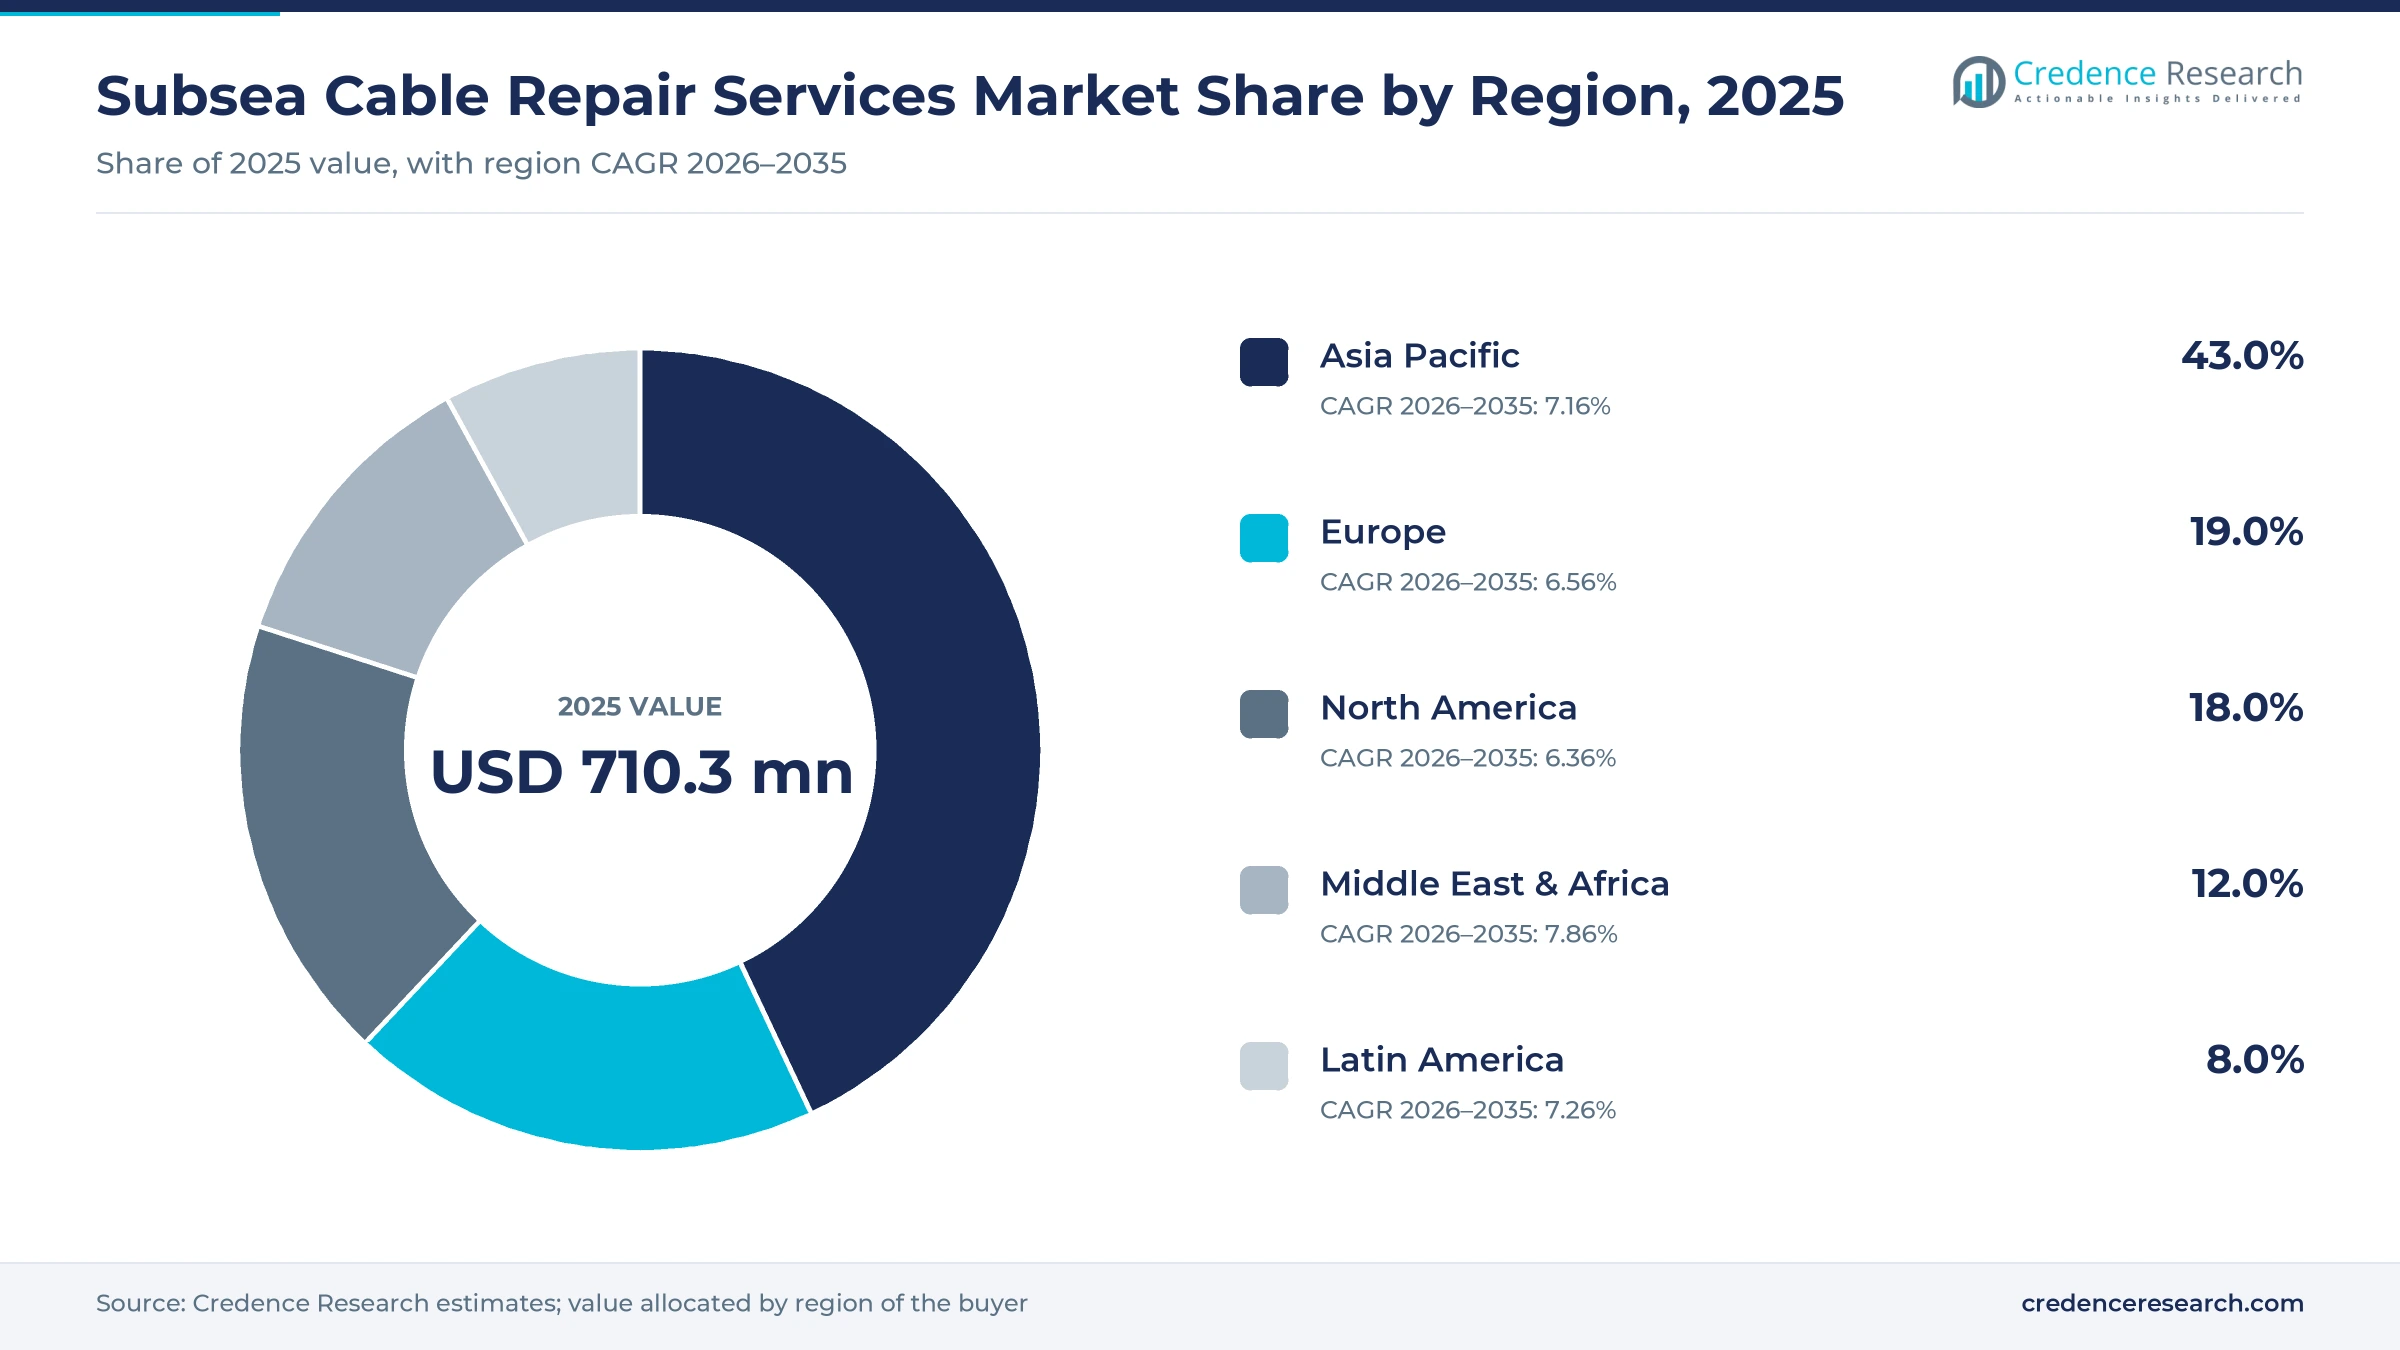
The global subsea cable repair services market was valued at USD 710.3 million in 2025 and is projected to increase from USD 760.0 million in 2026 to USD 1.40 billion by 2035, registering a CAGR of 7.00% during 2026–2035. Spending comes from cable consortia and content companies that pay specialist ship operators to locate, recover, splice and rebury damaged telecom cables, and to keep vessels and spare cable on standby. Asia Pacific held the largest regional share, 43.0% in 2025, because dense intra-Asian and trans-Pacific routes cross busy fishing grounds and shipping lanes. Middle East & Africa is the fastest-growing region at 7.86% a year as repeated Red Sea and West African cable cuts raise demand for nearby ships and depots. Governments have also become buyers, with the European Union, the United States and India all moving in 2025 and 2026 to fund or speed up repair capacity. Owners are renewing their agreements as the cable ship fleet ages.
Which repair calls, standby fees and depots are counted here?
The subsea cable repair services market covers paid marine work that restores damaged submarine telecom cables. This includes call-out repairs by cable ships with grapnels and remotely operated vehicles, annual standby fees under shared maintenance agreements, and the storage and handling of spare cable and repair joints in coastal depots. Buyers pay per repair, per day of vessel time or through multi-year zone contracts.
The scope excludes new cable laying, route surveys for new systems, cable manufacturing and the repair of offshore power and wind farm cables. Value is counted at the service provider level, including vessel time, crew, jointing, spare cable handling and depot fees billed to cable owners.
Subsea Cable Repair Services Market Insights
- The market is valued at USD 710.3 million in 2025 and is projected to reach USD 1.40 billion by 2035, growing at a 7.00% CAGR as fault counts stay near 200 a year.
- Asia Pacific led with 43.0% of 2025 value, while Middle East & Africa grows fastest at 7.86% a year after repeated Red Sea cable cuts.
- Repair Vessels held 55.0% of 2025 value, and Maintenance Agreements is the fastest-growing service at 7.57% a year to 2035.
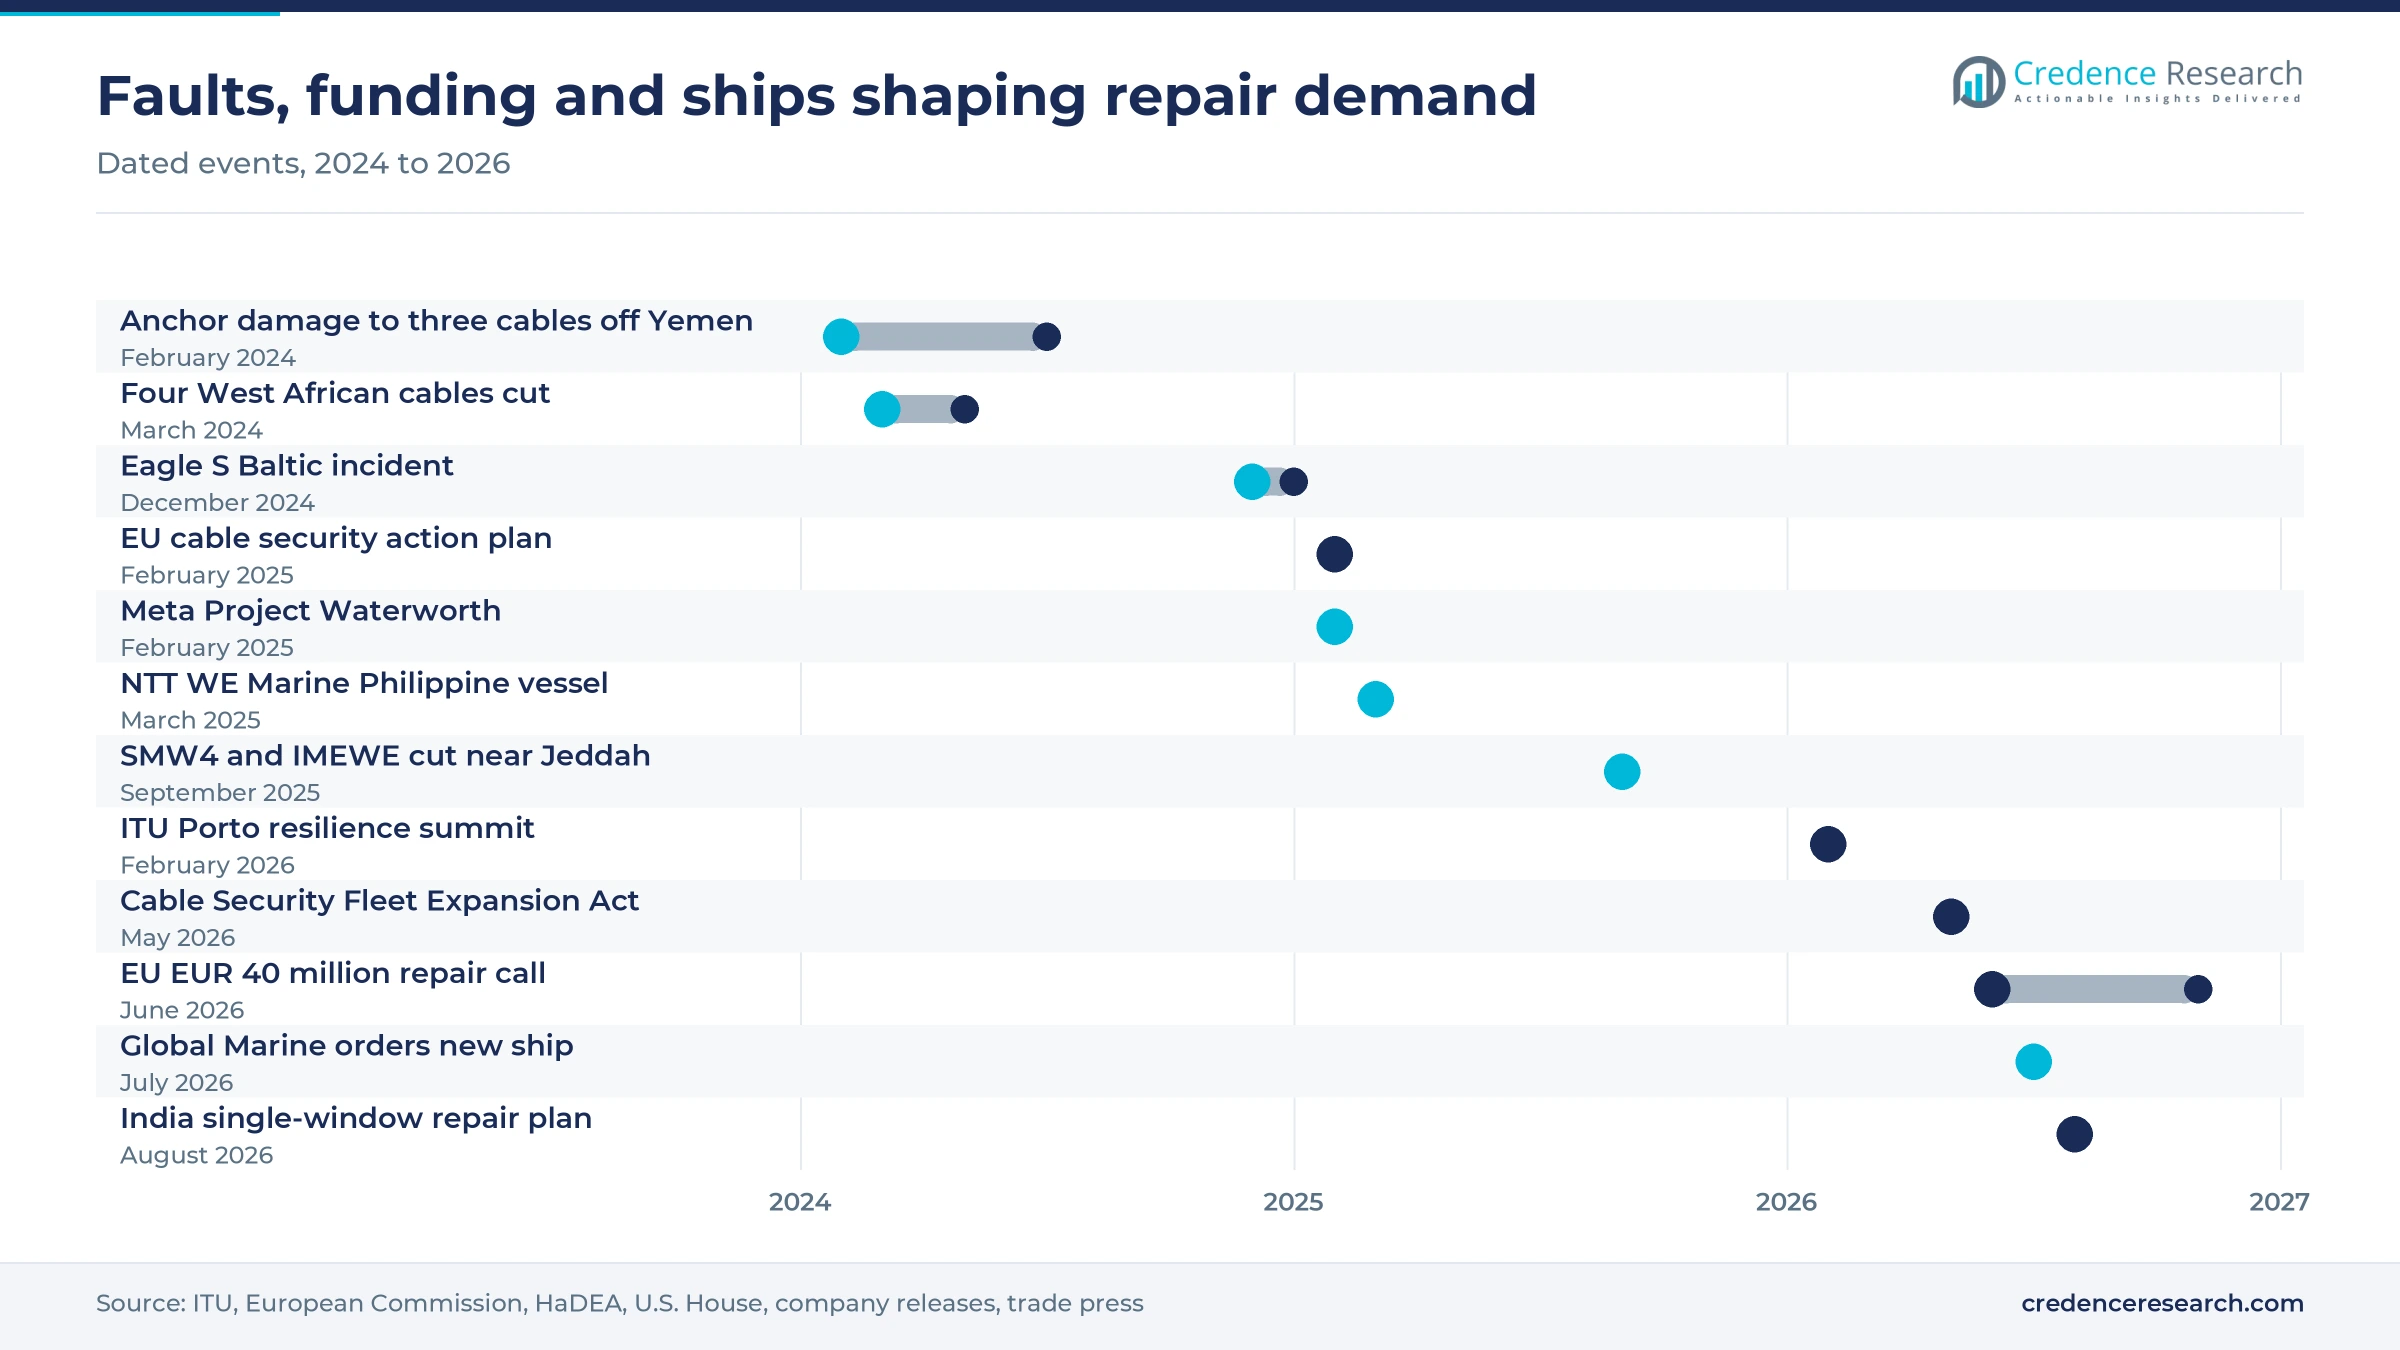
- The EU opened a EUR 40 million call for modular repair equipment on June 18, 2026, its second call for emergency repair capacity.
- Global Marine ordered a purpose-built cable maintenance vessel from Colombo Dockyard in July 2026, with delivery planned for late 2029.
Repair vessels lead while maintenance agreements grow
Why do repair vessels hold the largest share?
Based on service, the market is categorized into repair vessels, maintenance agreements and spare cable storage. Repair Vessels led with 55.0% of 2025 value because each fault needs a ship, crew and jointing team at sea. The International Cable Protection Committee recorded 206 repairs in 2023 across 136 jurisdictions, and it puts a typical repair at $1 million to $3 million, according to The National. Maintenance Agreements grow fastest at 7.57% a year as owners lock in standby capacity. Global Marine says it serves about 120 maintenance authorities and met 99.4% of contractual targets across its three zone agreements.
Why does the Pacific lead and the Red Sea grow fastest?
Based on ocean region, the market is categorized into the Atlantic, Pacific, Indian Ocean and Mediterranean and Red Sea. The Pacific led with 34.0% of 2025 value because dense routes around Japan, Taiwan and the Philippines need frequent ship visits. Chunghwa Telecom logged four faults on two Matsu cables between September 2024 and February 2025, according to the Taipei Times. The Mediterranean and Red Sea grows fastest at 7.68% a year as damage there keeps recurring. SMW4 and IMEWE were cut near Jeddah on Sept. 6, 2025, about 18 months after anchor damage to three cables off Yemen.
Why do consortia lead and hyperscalers grow fastest?
Based on client, the market is categorized into consortia and hyperscalers. Consortia led with 68.0% of 2025 value because most systems in service are jointly owned by carriers that share repair costs through zone agreements. The Atlantic Cable Maintenance Agreement alone had more than 60 members when Global Marine announced its extension in November 2020. Hyperscalers grow fastest at 8.00% a year as they own more of the network. Content and cloud networks used almost three quarters of international bandwidth in 2024, according to TeleGeography.
| Segment Group | Leading Sub-segment | Share, 2025 | Fastest-growing Sub-segment | CAGR, 2026–2035 |
|---|---|---|---|---|
| By Service | Repair Vessels | 55.0% | Maintenance Agreements | 7.57% |
| By Ocean Region | Pacific | 34.0% | Mediterranean and Red Sea | 7.68% |
| By Client | Consortia | 68.0% | Hyperscalers | 8.00% |
Request a Free Sample
Fill in your details and we'll send you a free sample report.
- Sample data tables & charts
- Research methodology
Traffic growth and aging networks lift repair budgets
Rising subsea data traffic increases repair needs
Rising data traffic makes every outage more costly, so cable owners pay for faster restoration and larger standby fleets. Subsea systems carry more than 99% of international data traffic over about 500 cables and 1.7 million km, according to the International Telecommunication Union in February 2026. Content and cloud networks accounted for at least 80% of demand on trans-Atlantic, trans-Pacific and intra-Asian routes in 2024, according to TeleGeography. Meta also announced Project Waterworth on Feb. 14, 2025, a 50,000 km system that will reach the United States, India, Brazil and South Africa. In the Credence Research model this driver adds about 2.94 percentage points to annual growth to 2035.
Aging cable networks need specialist maintenance
Aging cables and aging ships both raise the need for specialist maintenance contracts with experienced operators. TeleGeography estimated in July 2025 that about two thirds of cable maintenance ships will reach the end of their service life by 2040, with roughly $3 billion needed to buy 15 replacement ships and five additional ships. NTT WE Marine's largest ship, Subaru, was built in 1999 and needed shipyard work in early 2026, according to SubTel Forum. The SEAIOCMA zone agreement, first signed in 1986, still covers about one third of the world's oceans. In the Credence Research model this driver adds about 1.82 percentage points to annual growth to 2035.
Rapid-response vessels and spares cut outage exposure
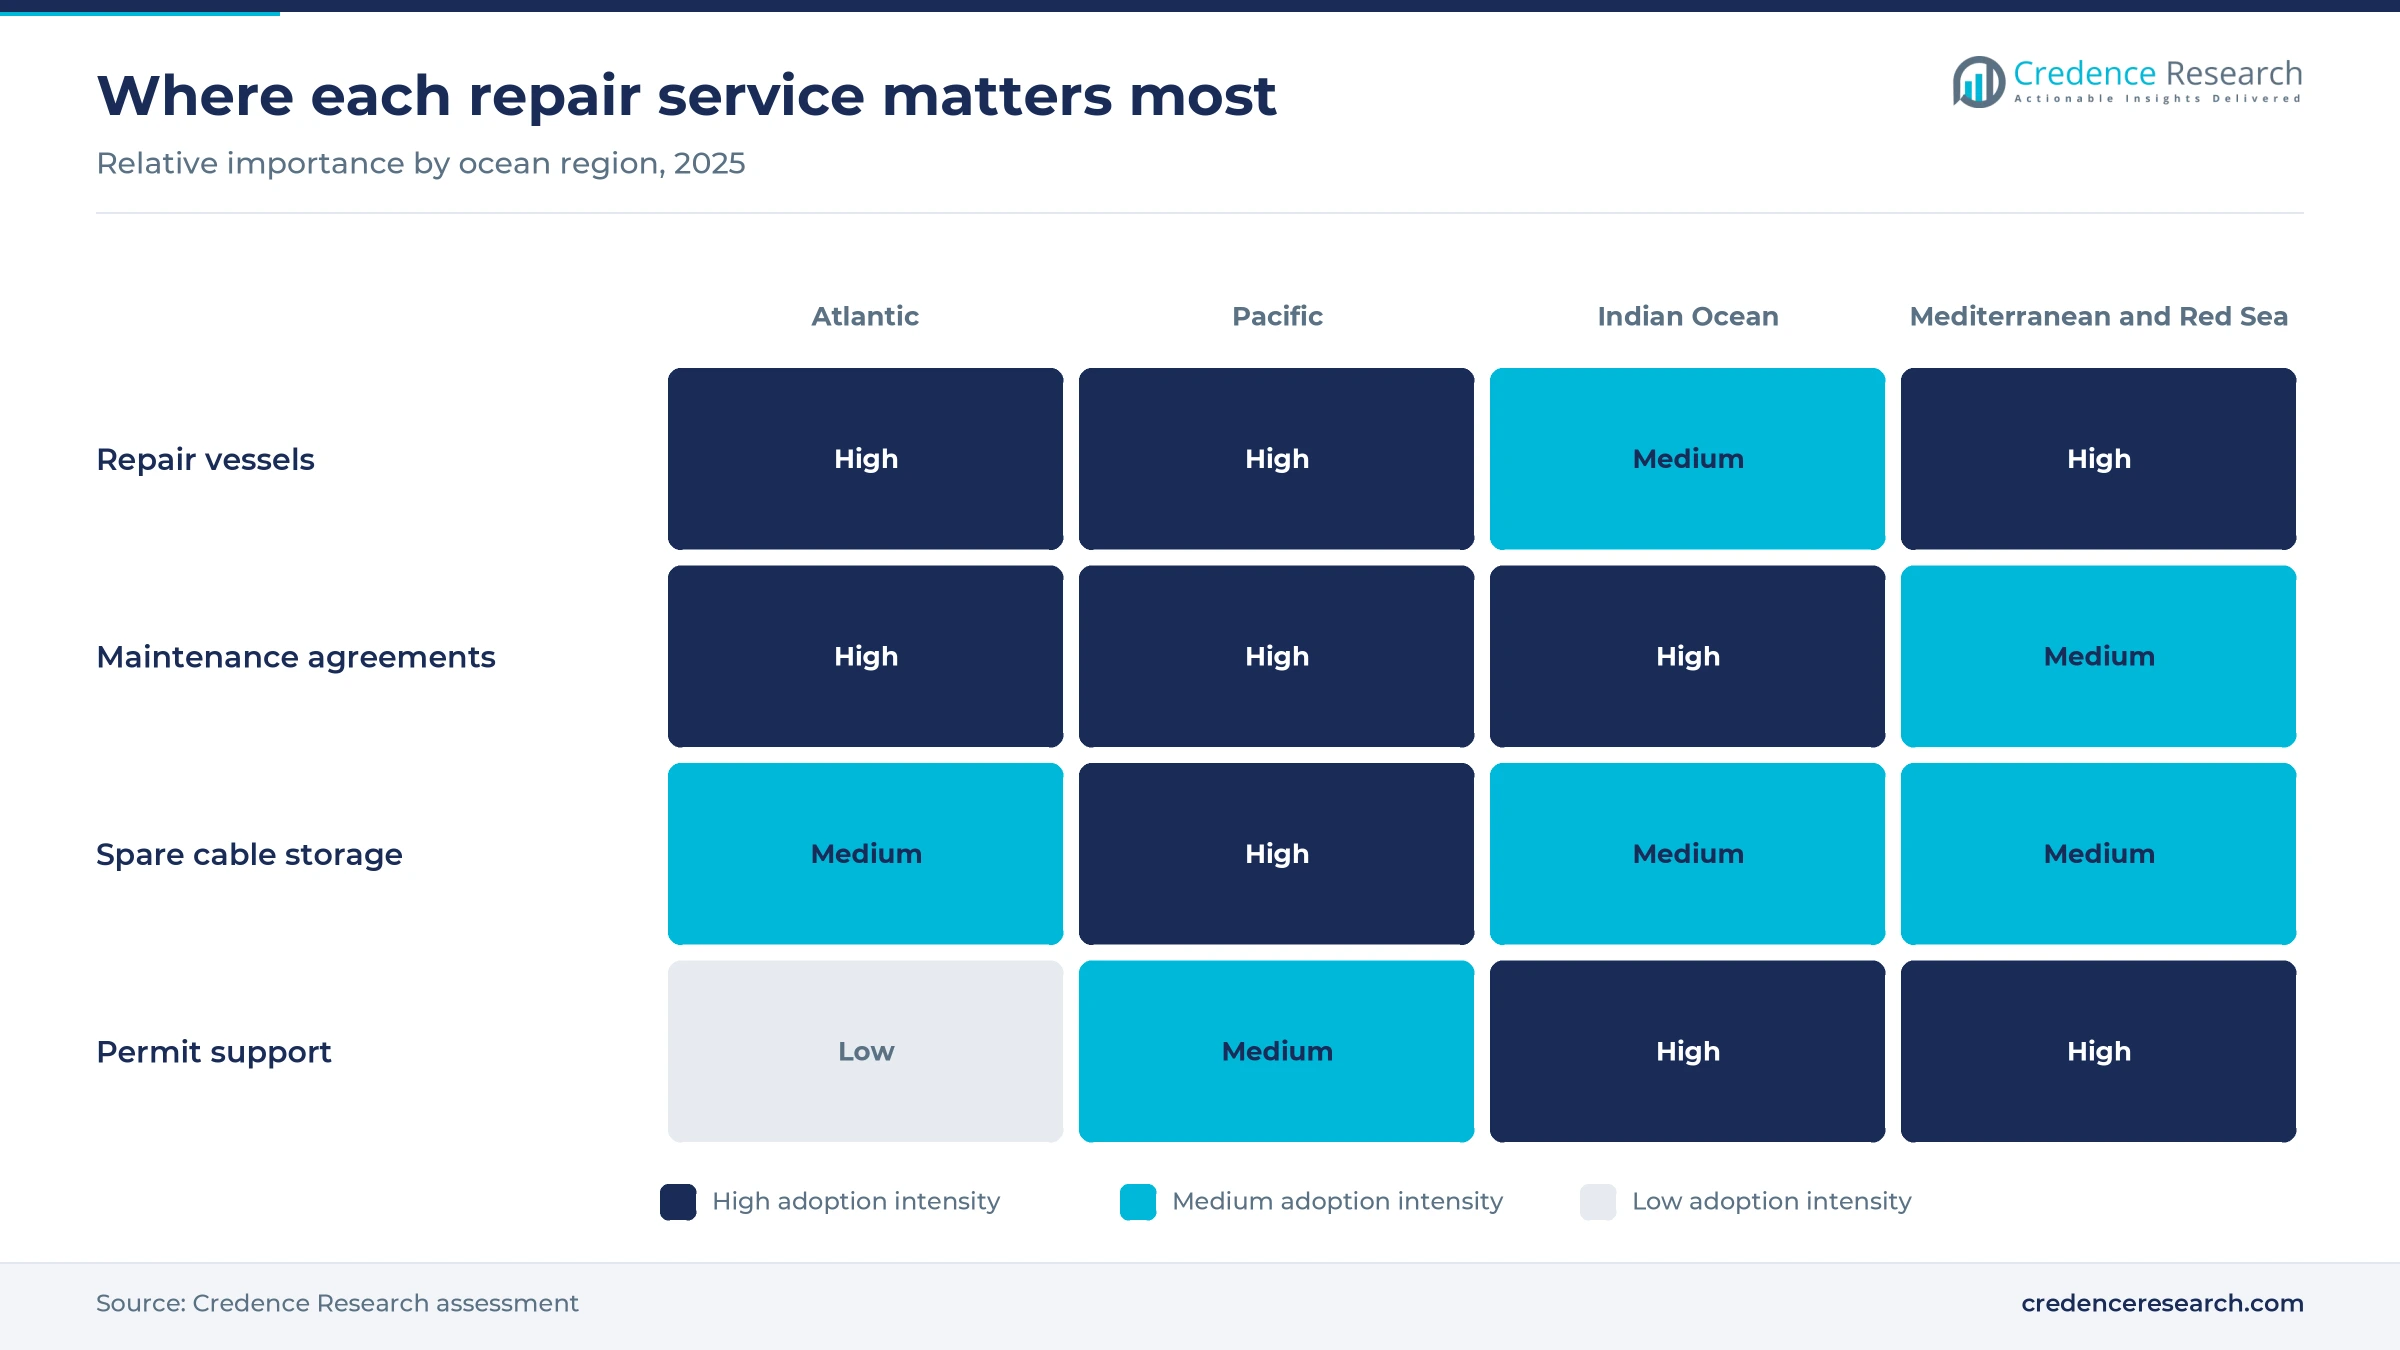
Owners pay for ships and spare cable stationed close to busy routes because a fast start shortens costly outages. Global Marine stations zone vessels in Portland, Curaçao, Victoria and Subic and keeps spare cable depots in places such as Bermuda and Tenerife, with call-out mobilization within 24 hours in two zones. The Taiwan repair in early 2025 still took several weeks for a vessel to arrive, according to TeleGeography. The EU plan of Feb. 21, 2025 proposed a reserve fleet of cable vessels with stored spare parts, according to Eunews. In the Credence Research model this driver adds about 1.19 percentage points to annual growth to 2035.
Anchor and fishing damage keeps fault counts high
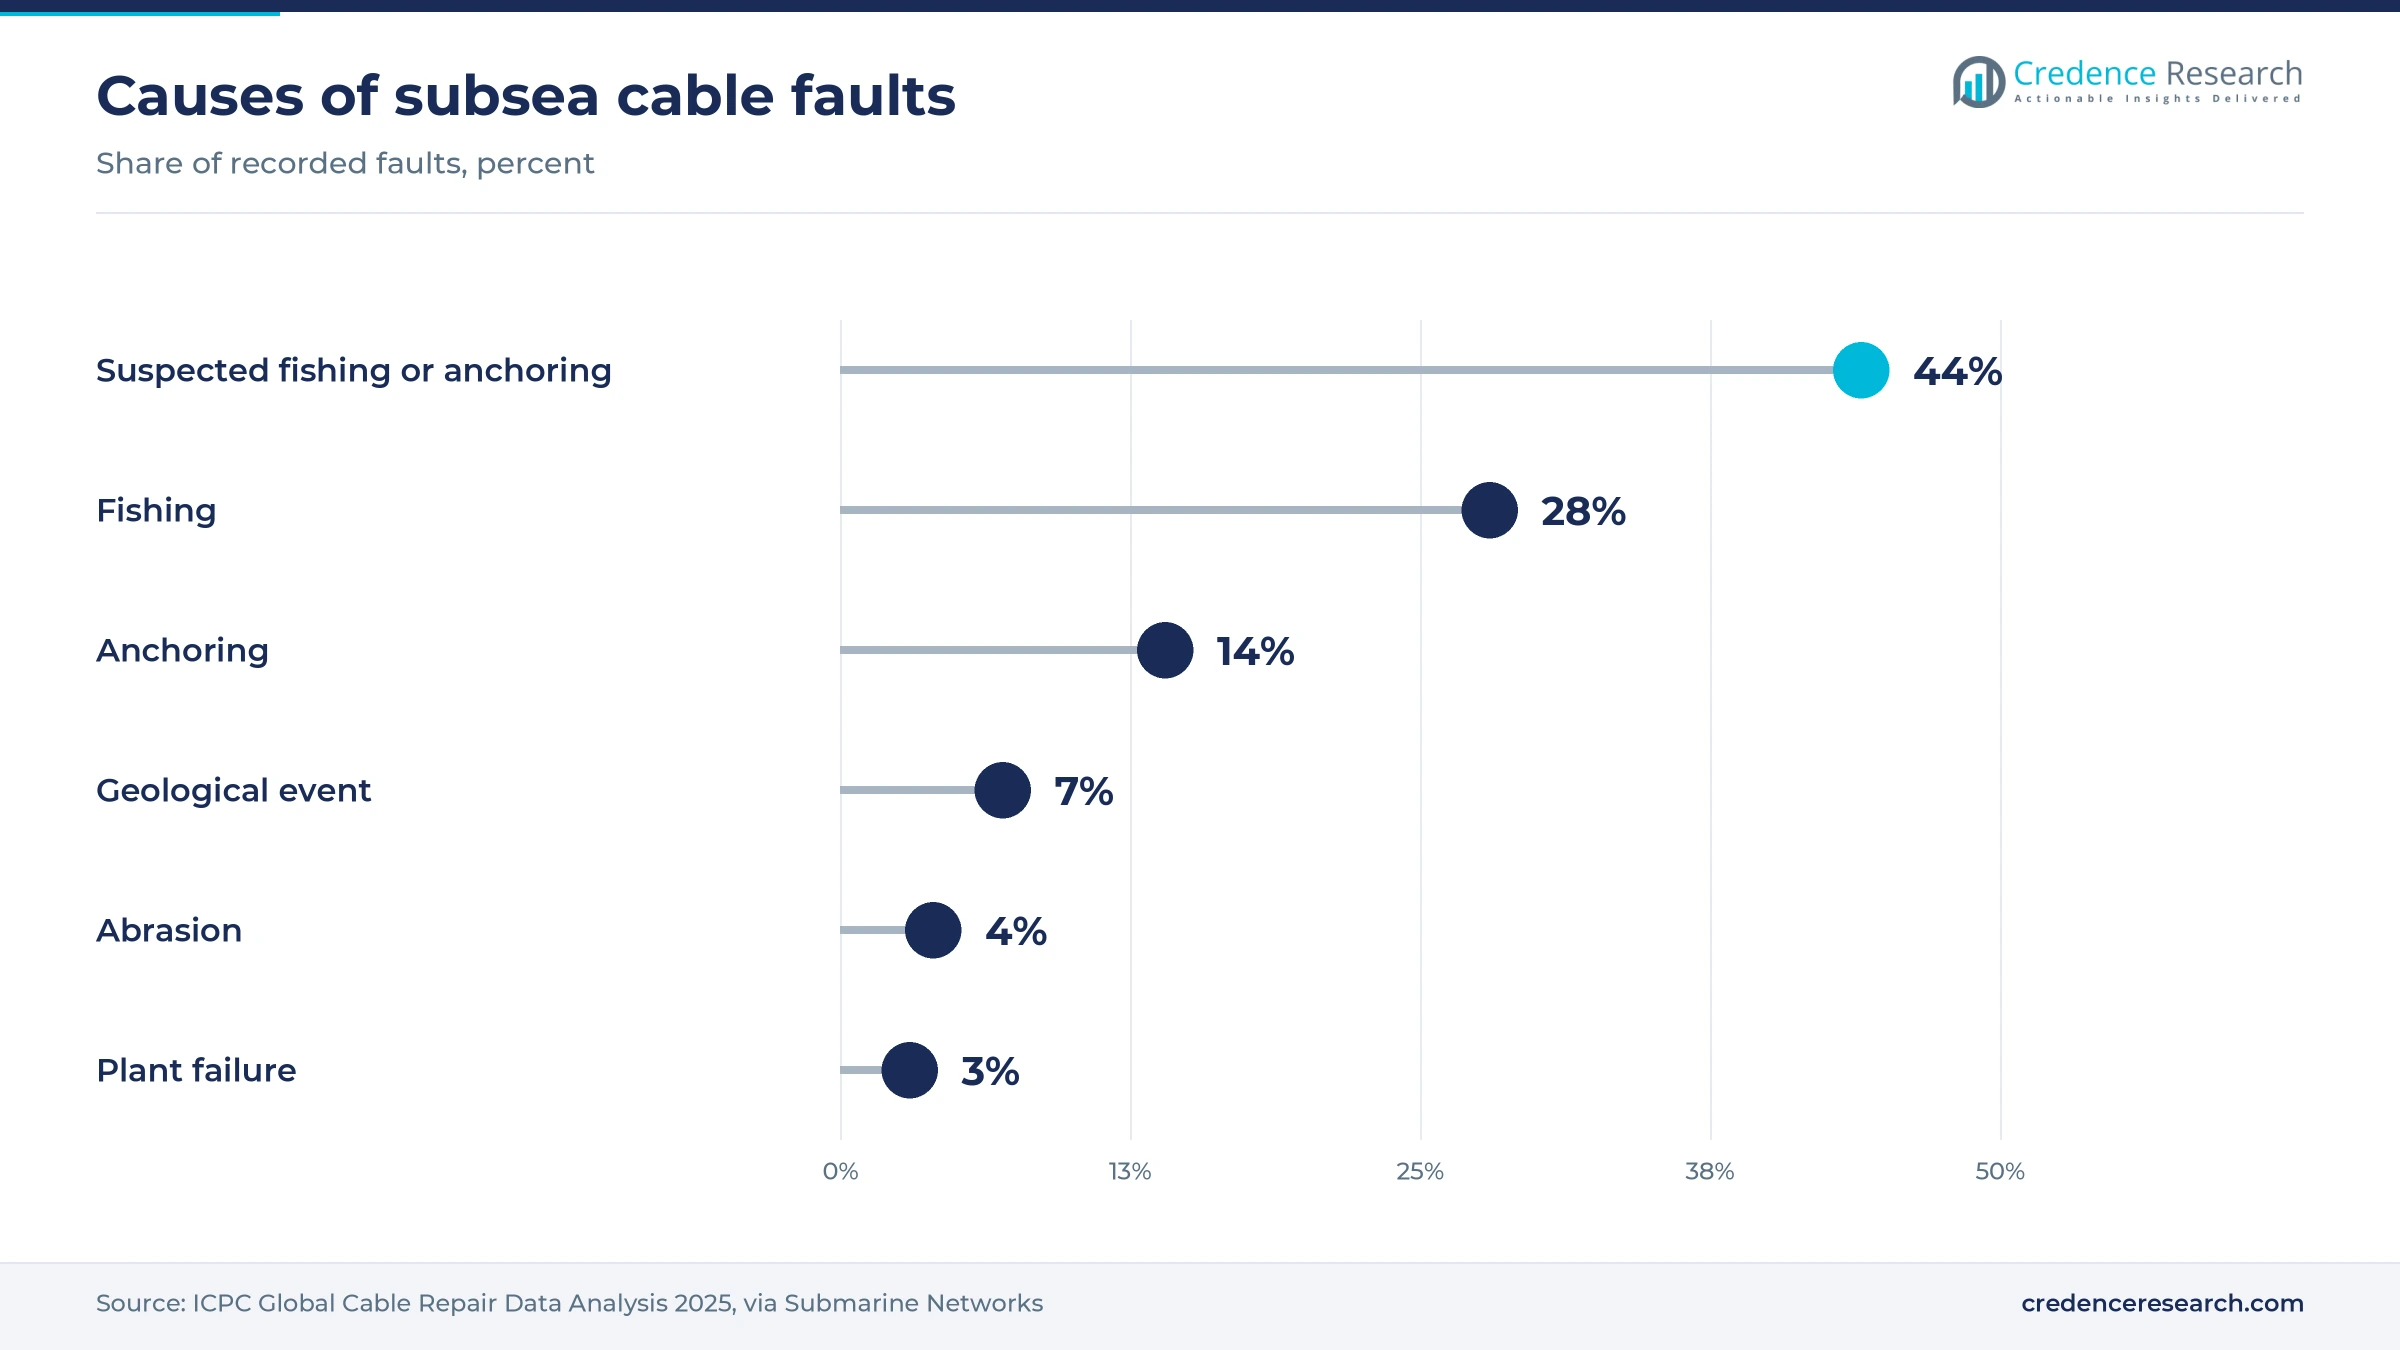
Fault counts have not fallen as the network has grown, so repair work rises steadily with total route length. The ICPC counted an average of 199 faults a year from 2010 to 2024, while route mileage rose 50%, according to Submarine Networks in June 2025. Fishing and anchoring caused 86% of faults in the 2025 ICPC analysis presented at SubOptic. The Eagle S tanker was seized by Finland on Dec. 26, 2024 on suspicion of dragging its anchor across four telecom cables and the Estlink 2 power line. Each such event sends repair ships to sea within days and adds billable vessel time for the zone provider.
Governments fund repair capacity as hyperscalers expand
Shift toward public funding of repair capacity
Governments are shifting from regulators to direct funders of repair capacity, which brings new public buyers into the market. The EU HaDEA agency opened a EUR 40 million call on June 18, 2026 for modular repair equipment that ports can fit to at least three vessels within three days. Representative Max Miller introduced the Cable Security Fleet Expansion Act on May 18, 2026 to raise the U.S. fleet from two ships to at least six at up to $7 million a year each. SubCom ships CS Dependable and CS Decisive already form the first U.S. fleet under a 2021 contract, according to Reuters via gCaptain. These programs add paid standby time on top of commercial zone fees.
Rise of hyperscaler-owned routes and repair demand
A rising share of cables is owned by content companies, which changes who signs repair contracts and how fast they expect restoration. Meta described Project Waterworth as a multibillion-dollar, multiyear investment with 24 fiber pairs and depths of up to 7,000 meters, according to DatacenterDynamics. TeleGeography expects more than $14 billion of new cables to enter service from 2025 to 2027, including over $3 billion across the Pacific. Microsoft warned Azure users that undersea fiber cuts can take time to repair after the Red Sea cuts of September 2025, according to The National. Hyperscalers grow at 8.00% a year in the Credence Research model.
Fleet renewal opens new vessel and charter openings
The aging fleet creates an opening for operators that invest early in new ships and long charters. Global Marine signed for a hybrid-powered cable maintenance vessel from Colombo Dockyard in July 2026, with delivery planned for the fourth quarter of 2029, according to OffshoreSource. Colombo Dockyard had delivered the 100-meter Sophie Germain, optimized for repairs, to Orange Marine in August 2023. NTT WE Marine introduced a Philippine-flag maintenance vessel on March 31, 2025, according to The Philippine Star. NTT WE Marine has also laid more than 51,000 km of cable, which gives it the crews to staff new ships. Each new ship can anchor a zone contract for two decades.
Faster permits open room for regional repair hubs
Faster permit regimes open room for regional repair hubs and locally based ships in markets that now rely on distant fleets. India has no Indian-flagged cable repair vessel and relies on fleets based in Singapore and Dubai, so repairs often take four to five months, according to Developing Telecoms in August 2026. The Department of Telecommunications plans a single-window clearance portal, with March 2027 as a tentative target. India has about 19 international cables carrying roughly 193 Tbps of lit capacity. Retrofitting existing vessels is an option because new ships can take three to four years to commission, which leaves room for charter deals with foreign operators.
Permits, aging ships and hostile waters slow repairs
Aging cable ships raise cost and downtime risk
The fleet that performs repairs is old, which raises operating costs and the risk of ships being out of service. TeleGeography estimated in July 2025 that about half of the global cable ship fleet is nearing the end of its service life. NTT WE Marine's Subaru, built in 1999, ran at just over 60% utilization in fiscal 2024. As a result, cable owners face higher standby fees at renewal. Operators respond with refits and orders such as Global Marine's 2029 vessel.
Permits and politics delay repairs in hostile waters
Repairs in contested waters can wait months for permits and safe passage, which extends outages for owners. AAE-1, Seacom and EIG were cut off Yemen in February 2024, and repairs waited about five months, according to TeleGeography. Yemen's rival authorities disputed the AAE-1 permit before E-Marine's ship Niwa restored it in July 2024, according to gCaptain. As a result, providers price higher risk into Red Sea work.
Long response times strain small and remote markets
Repair response has slowed, which hurts island and emerging markets that depend on one or two cables. The ICPC found that repair response time more than doubled over 10 years, and its longest repair in 2023 took 947 days, according to Submarine Networks. Four West African cables cut off Ivory Coast in March 2024 needed weeks of work before WACS returned at the end of April, according to Total Telecom. Owners respond by adding redundant routes and nearer standby ships.
Spare cable and jointing compatibility limits speed
Each repair needs matching spare cable and joints, and a missing type can delay work even when a ship is ready. Global Marine's database of more than 5,500 recorded faults spans many cable designs that depots must match. The EU plan of February 2025 named storage of spare parts as a reserve fleet task, according to Eunews. As a result, owners pay storage fees for many cable types and must keep inventories current.
Asia Pacific leads as Middle East & Africa grows fastest
| Region | Value, 2025 (USD million) | Share, 2025 | CAGR, 2026–2035 |
|---|---|---|---|
| Asia Pacific | 305.4 | 43.0% | 7.16% |
| Europe | 135.0 | 19.0% | 6.56% |
| North America | 127.9 | 18.0% | 6.36% |
| Middle East & Africa | 85.2 | 12.0% | 7.86% |
| Latin America | 56.8 | 8.0% | 7.26% |
Asia Pacific leads on dense routes and frequent faults
Asia Pacific held 43.0% of 2025 value and grows at 7.16% a year to 2035. The region leads because intra-Asian routes are dense and cross busy fishing and shipping areas. Global Marine bases Cable Retriever at Subic in the Philippines for the SEAIOCMA zone, which runs from Djibouti to Guam and from Taiwan to Australia. NTT WE Marine maintains 11 cable systems, and PLDT signed a three-year repair contract with its Philippine unit in 2024.
Europe builds public reserve repair capacity
Europe held 19.0% of 2025 value and grows at 6.56% a year to 2035. Baltic incidents in late 2024 led the Commission to present its cable security action plan in Helsinki on Feb. 21, 2025. Finnish operator Elisa said on Jan. 6, 2025 that both of its damaged cables had been repaired. The HaDEA call of June 2026 extends repair funding from the Baltic to the Mediterranean and Atlantic, with a deadline of Oct. 8, 2026.
North America adds security fleet demand
North America held 18.0% of 2025 value and grows at 6.36% a year to 2035. SubCom runs six cable ships, and two of them form the U.S. Cable Security Fleet under a contract reported at $10 million a year. The bill introduced in May 2026 would raise total funding to $56 million a year for at least six ships. Global Marine also bases Cable Innovator in Victoria, Canada, for the North American Zone.
Middle East & Africa grows fastest after repeated cuts
Middle East & Africa held 12.0% of 2025 value and is the fastest-growing region at 7.86% a year to 2035. The Red Sea corridor carries about 17% of traffic between Asia, Europe and Africa, according to The National. Cuts off Yemen in 2024 and near Jeddah in 2025, plus four West African cables cut in March 2024, raised demand for nearby ships. E-Marine, a subsidiary of the e& group, owns the repair ship Niwa.
Latin America relies on Atlantic zone ships
Latin America held 8.0% of 2025 value and grows at 7.26% a year to 2035. The region relies on Atlantic zone ships, and Global Marine keeps Wave Sentinel in Curaçao under the Atlantic agreement. Alcatel Submarine Networks also used its refitted Ile de Molène for maintenance work off Curaçao in 2023, according to Baird Maritime. New routes such as Project Waterworth, with a planned landing in Brazil, will add repair exposure over the forecast period.
New ships and repair funding marked 2025 and 2026
| Development | Status and market relevance |
|---|---|
| In July 2024, E-Marine's cable ship Niwa restored AAE-1 in Yemeni waters after months of permit talks. | Ended one of the longest Red Sea outages of recent years |
| In March 2025, NTT WE Marine introduced a Philippine-flag vessel to maintain domestic and international cables. | Adds maintenance capacity near busy intra-Asian routes |
| In December 2025, NTT WE Marine said it was considering a new large cable ship comparable to Subaru. | Signals fleet renewal in the Yokohama area |
| In June 2026, the EU HaDEA agency opened a EUR 40 million call for modular cable repair equipment. | Extends public repair funding to the Mediterranean and Atlantic |
| In July 2026, Global Marine contracted Colombo Dockyard to build a hybrid cable maintenance vessel. | Delivery planned for the fourth quarter of 2029 |
ROVs, modular gear and fault data shorten outages
- Remotely operated vehicles cut, inspect and rebury cables on the seabed, such as the 450 kW unit built in-house for Orange Marine's Sophie Germain.
- Grapnel recovery and jointing lift both cable ends to the deck, where crews splice in spare cable with joints approved for that cable type.
- Digital X-ray inspection checks each finished joint on board, and Global Marine reported delivering its 80th digital X-ray camera in 2023.
- Modular repair kits let ports fit repair equipment to ordinary ships within three days under the EU HaDEA program.
- Fault databases help planners place ships and spares, drawing on records such as Global Marine's database of more than 5,500 faults.
Need a Custom Version of This Report?
Tailor the scope, geography, or segments to your exact requirements.
- Custom geography or segment scope
- Direct access to our analyst team
Zone contracts and fleet depth decide competition
Competition in subsea cable repair centers on zone contracts, fleet location and proven repair times. Global Marine, Orange Marine, SubCom, Alcatel Submarine Networks, NTT WE Marine and E-Marine each hold ships near the routes their customers own. Zone agreements such as the Atlantic Cable Maintenance Agreement and SEAIOCMA reward providers that can keep a ship ready all year. Some operators also run offshore wind installation vessels, which competes for the same crews and shipyard slots. Owners of hyperscale data centers now negotiate directly for restoration terms. Fleet age is becoming the main competitive gap, as new purpose-built ships cost far more than refits. Zone agreements still shape the field, because Global Marine serves the ACMA, NAZ and SEAIOCMA zones while SubCom runs six cable ships of its own. As a result, newer entrants usually win work through private agreements tied to single cable systems rather than through zone membership.
Companies profiled and their roles in this market
| Company | Type | Role in the market |
|---|---|---|
| Global Marine | Zone maintenance provider | ACMA, NAZ and SEAIOCMA ships with depots in Portland, Bermuda and Subic |
| Orange Marine | Zone maintenance provider | Sophie Germain repair ship based at La Seyne-sur-Mer |
| SubCom | Supplier and marine operator | Six cable ships, two in the U.S. Cable Security Fleet |
| Alcatel Submarine Networks | Supplier and marine operator | Ile de Molène maintenance work in the Atlantic and North Sea |
| NTT WE Marine | Regional maintenance provider | Maintains 11 cable systems and a Philippine-flag vessel |
| E-Marine | Regional maintenance provider | Niwa restored AAE-1 in Yemeni waters in July 2024 |
Fleet renewal will decide who wins zone contracts
Credence Research's view is that fleet renewal, not price, will decide which providers win zone contracts through 2035. Fault counts near 200 a year mean steady demand, but the ships that answer those calls are aging fast. Providers that order new vessels, keep spare cable near busy routes and secure permits early will capture the growth from hyperscaler routes. Growth in optical fiber networks also adds new cable types that depots must stock. Maintenance agreements grow at 7.57% a year, the fastest rate of any service in the Credence Research model.
Model-based sizing checked against repair activity
The report uses 2025 as the base year and forecasts values from 2026 to 2035 in U.S. dollars. Market values come from the Credence Research model, and the regional, service, ocean region and client splits are Credence Research estimates. Inputs include International Telecommunication Union and European Union publications, industry fault statistics, company announcements, shipyard releases and trade press reports. The 2025 value was checked against public repair counts and cost ranges. No interviews or surveys were conducted for this edition of the report.
Ship renewal and new routes extend growth to 2035
The subsea cable repair services market is expected to grow from USD 760.0 million in 2026 to USD 1.40 billion by 2035 as route length and traffic keep rising. Maintenance agreements should gain share as hyperscalers and governments lock in standby ships. New vessels from Global Marine and possibly NTT WE Marine will replace ships built in the 1990s. Repair providers may also share yards and crews with growing offshore wind export work. Faster permits in India and public funding in Europe and the United States should shorten outages over the decade.
Frequently Asked Questions
How big is the subsea cable repair services market?
Which service holds the largest share?
Which service grows fastest?
Which region leads the market?
Which region grows fastest?
What causes most subsea cable faults?
Who are the key companies in the market?
What are the main challenges for the market?
Table of Content
Chapter 1 Market Segmentation
- 1.1 Segmentation Framework
- 1.1.1 Product and Service Classification
- 1.1.2 Application and End-Use Classification
- 1.1.3 Technology and Solution Classification
- 1.1.4 Customer and Distribution Channel Classification
- 1.1.5 Geographic Segmentation
- 1.1.6 Market Segment Definitions and Boundaries
- 1.2 By Service
- 1.2.1 Repair Vessels
- 1.2.2 Maintenance Agreements
- 1.2.3 Spare Cable Storage
- 1.3 By Ocean Region
- 1.3.1 Pacific
- 1.3.2 Atlantic
- 1.3.3 Indian Ocean
- 1.3.4 Mediterranean and Red Sea
- 1.4 By Client
- 1.4.1 Consortia
- 1.4.2 Hyperscalers
Chapter 2 Introduction
- 2.1 Report Objectives and Scope
- 2.2 Product Definition and Industry Terminology
- 2.3 Market Inclusions and Exclusions
- 2.4 Research Process
- 2.4.1 Primary Research and Expert Interviews
- 2.4.2 Secondary Research and Source Review
- 2.4.3 Top-Down and Bottom-Up Estimation
- 2.4.4 Data Triangulation and Verification
- 2.5 Market Size Measurement Basis
- 2.5.1 2025: USD 710.3 million → 2035: USD 1.40 billion
- 2.6 Historical and Forecast Reference Periods
- 2.6.1 Historical Period: 2018-2025
- 2.6.2 Base Year: 2025
- 2.6.3 Forecast Period: 2025-2035
- 2.7 Research Assumptions and Limitations
Chapter 3 Executive Summary
- 3.1 Market Snapshot and Key Findings
- 3.2 Base-Year Market Size, 2025
- 3.3 Forecast Market Size, 2035
- 3.4 Revenue and Volume Growth Outlook
- 3.5 Key Demand and Supply Indicators
- 3.6 Leading Market Segments
- 3.7 Fastest-Growing Market Opportunities
- 3.8 Regional Performance Highlights
- 3.9 Technology and Industry Transformation
- 3.10 Competitive Landscape Summary
- 3.11 Analyst View and Strategic Implications
Chapter 4 Global Subsea Cable Repair Services Market Trends and Developments
- 4.1 Historical Industry Development, 2018-2025
- 4.2 Recent Market Trends and Developments
- 4.3 Demand and Customer Behavior Trends
- 4.4 Technology and Product Innovation
- 4.5 Artificial Intelligence, Automation and Digitalization
- 4.6 Local Manufacturing and Supply Chain Realignment
- 4.7 Industry Partnerships, Mergers and Acquisitions
- 4.8 Sustainability and Circular Economy Developments
- 4.9 Government and Private Sector Investment Trends
- 4.10 Emerging Business Models and Commercialization
- 4.11 Industry Developments and Announcements
Chapter 5 Global Subsea Cable Repair Services Market Supply and Demand Analysis
- 5.1 Demand Trend and Consumption Analysis, 2018-2025
- 5.2 Demand Forecast, 2025-2035
- 5.3 Supply Chain Structure and Procurement Trends
- 5.4 Supply-Demand Gap and Bottlenecks
- 5.5 Import Dependence and Sourcing Structure
- 5.6 Regional Supply and Demand Concentration
Chapter 6 Global Subsea Cable Repair Services Market Pricing Analysis
- 6.1 Pricing Structure and Measurement
- 6.2 Historical Pricing Trends, 2018-2025
- 6.3 Pricing Outlook, 2025-2035
- 6.4 Pricing by Product and Market Segment
- 6.5 Geographic Pricing Differences
- 6.6 Key Input, Energy, Labor and Logistics Costs
- 6.7 Contract Pricing and Purchasing Models
- 6.8 Pricing Sensitivity and Competitive Positioning
- 6.9 Price, Margin and Profitability Implications
Chapter 7 Global Subsea Cable Repair Services Market Dynamics
- 7.1 Market Growth Drivers
- 7.1.1 Demand-Side Drivers
- 7.1.2 Technology and Innovation Drivers
- 7.1.3 Infrastructure and Investment Drivers
- 7.1.4 Regulatory and Policy Drivers
- 7.2 Market Restraints
- 7.2.1 Cost and Affordability Constraints
- 7.2.2 Technology and Adoption Barriers
- 7.2.3 Supply Chain and Operational Constraints
- 7.3 Market Challenges
- 7.3.1 Competitive Pressure and Margin Erosion
- 7.3.2 Skills, Infrastructure and Implementation Gaps
- 7.4 Emerging Market Opportunities
- 7.5 Market Dynamics Impact and Time-Horizon Assessment
Chapter 8 Global Subsea Cable Repair Services Value Chain Analysis
- 8.1 Industry Value Chain Overview
- 8.2 Upstream Suppliers and Critical Inputs
- 8.3 Technology and Component Providers
- 8.4 Manufacturing or Service Delivery
- 8.5 Distribution, Channel Partners and Integrators
- 8.6 Downstream Applications and End Users
- 8.7 Value Addition and Profit Pools
- 8.8 Vertical Integration and Outsourcing
- 8.9 Supplier Concentration and Risk
- 8.10 Supply Chain Localization and Resilience
Chapter 9 Global Subsea Cable Repair Services Market Regulations and Policies
- 9.1 Relevant Laws, Standards and Compliance Frameworks
- 9.2 Product, Service, Safety and Quality Requirements
- 9.3 Government Policies, Incentives and Subsidies
- 9.4 Imports, Exports and Trade Barriers
- 9.5 Public Procurement and Local Content Requirements
- 9.6 Data Protection, AI and Cybersecurity Compliance
- 9.7 Upcoming Policy Changes and Market Implications
Chapter 10 Global Subsea Cable Repair Services Market Hotspots and Opportunities
- 10.1 Market Opportunity Mapping and Growth Hotspots
- 10.2 High-Growth Applications and Customer Groups
- 10.3 Underserved Markets and White-Space Opportunities
- 10.4 Emerging Technology and Product Opportunities
- 10.5 New Capacity and Investment Hotspots
- 10.6 Market Entry and Expansion Opportunities
- 10.7 Distribution and Partnership Opportunities
- 10.8 Near-Term and Long-Term Commercial Potential
- 10.9 Opportunity Attractiveness and Execution Risks
Chapter 11 Global Subsea Cable Repair Services Market Outlook, 2025-2035
- 11.1 Market Size and Analysis
- 11.1.1 Revenue (Market Measurement: 2025: USD 710.3 million → 2035: USD 1.40 billion)
- 11.1.2 Historical Market Size, 2018-2025
- 11.1.3 Base-Year Market Size, 2025
- 11.2 Market Forecast, 2025-2035
- 11.2.1 Revenue Forecast to 2035
- 11.2.2 CAGR and Year-on-Year Growth
- 11.2.3 Incremental Revenue Opportunity
- 11.3 Forecast Assumptions and Scenario Analysis
- 11.3.1 Base-Case Forecast
- 11.3.2 Optimistic and Conservative Scenarios
- 11.3.3 Technology, Pricing and Policy Sensitivities
- 11.4 Market Attractiveness and Growth Outlook
Chapter 12 Global Subsea Cable Repair Services Market Segmentation and Outlook
- 12.1 Segmentation Summary and Market Shares, 2025
- 12.2 Largest and Fastest-Growing Segments
- 12.3 By Service - Market Size and Forecast, 2025-2035
- 12.3.1 Segment Definition and Scope
- 12.3.2 Historical Market Size, 2018-2025
- 12.3.3 Revenue Forecast, 2025-2035
- 12.3.4 Base-Year Market Share, 2025
- 12.3.5 Segment CAGR and Growth Drivers
- 12.3.6 Subsegment Market Size and Forecast
- 12.3.6.1 Repair Vessels
- 12.3.6.2 Maintenance Agreements
- 12.3.6.3 Spare Cable Storage
- 12.3.7 Subsegment Pricing and Adoption Trends
- 12.3.8 Leading Suppliers and Competition
- 12.3.9 Regional Demand and Opportunities
- 12.4 By Ocean Region - Market Size and Forecast, 2025-2035
- 12.4.1 Segment Definition and Scope
- 12.4.2 Historical Market Size, 2018-2025
- 12.4.3 Revenue Forecast, 2025-2035
- 12.4.4 Base-Year Market Share, 2025
- 12.4.5 Segment CAGR and Growth Drivers
- 12.4.6 Subsegment Market Size and Forecast
- 12.4.6.1 Pacific
- 12.4.6.2 Atlantic
- 12.4.6.3 Indian Ocean
- 12.4.6.4 Mediterranean and Red Sea
- 12.4.7 Subsegment Pricing and Adoption Trends
- 12.4.8 Leading Suppliers and Competition
- 12.4.9 Regional Demand and Opportunities
- 12.5 By Client - Market Size and Forecast, 2025-2035
- 12.5.1 Segment Definition and Scope
- 12.5.2 Historical Market Size, 2018-2025
- 12.5.3 Revenue Forecast, 2025-2035
- 12.5.4 Base-Year Market Share, 2025
- 12.5.5 Segment CAGR and Growth Drivers
- 12.5.6 Subsegment Market Size and Forecast
- 12.5.6.1 Consortia
- 12.5.6.2 Hyperscalers
- 12.5.7 Subsegment Pricing and Adoption Trends
- 12.5.8 Leading Suppliers and Competition
- 12.5.9 Regional Demand and Opportunities
- 12.6 Segment Growth Comparison
- 12.7 Segment Attractiveness and Priority Matrix
Chapter 13 Global Subsea Cable Repair Services Geographic Market Outlook, 2025-2035
- 13.1 Regional Market Size and Share, 2025
- 13.2 Regional Market Forecast, 2025-2035
- 13.3 Regional Pricing, Production and Demand Differences
- 13.4 North America
- 13.4.1 United States
- 13.4.2 Canada
- 13.4.3 Mexico
- 13.5 Europe
- 13.5.1 Germany
- 13.5.2 France
- 13.5.3 Italy
- 13.5.4 United Kingdom
- 13.5.5 Spain
- 13.5.6 Poland
- 13.5.7 Russia
- 13.5.8 Netherlands
- 13.5.9 Belgium
- 13.5.10 Sweden
- 13.5.11 Denmark
- 13.5.12 Norway
- 13.5.13 Rest of Europe
- 13.6 Asia Pacific
- 13.6.1 China
- 13.6.2 India
- 13.6.3 Japan
- 13.6.4 South Korea
- 13.6.5 Thailand
- 13.6.6 Indonesia
- 13.6.7 Vietnam
- 13.6.8 Malaysia
- 13.6.9 Australia
- 13.6.10 Rest of Asia Pacific
- 13.7 Latin America
- 13.7.1 Brazil
- 13.7.2 Argentina
- 13.7.3 Colombia
- 13.7.4 Chile
- 13.7.5 Rest of Latin America
- 13.8 Middle East
- 13.8.1 Saudi Arabia
- 13.8.2 United Arab Emirates
- 13.8.3 Turkey
- 13.8.4 Israel
- 13.8.5 Iran
- 13.8.6 Rest of the Middle East
- 13.9 Africa
- 13.9.1 South Africa
- 13.9.2 Egypt
- 13.9.3 Nigeria
- 13.9.4 Morocco
- 13.9.5 Rest of Africa
- 13.10 Regional Investment, Policy and Supply Chain Differences
- 13.11 Regional Competitive Landscape
- 13.12 Geographic Growth Hotspots
Chapter 14 Global Subsea Cable Repair Services Technology, Innovation and Sustainability Outlook
- 14.1 Technology Landscape and Maturity
- 14.2 Product, Process and Service Innovation
- 14.3 AI, Automation and Digital Tools in the Industry
- 14.4 Technology Adoption and Performance Benchmarking
- 14.5 Innovation Pipeline and R&D Investment
- 14.6 Energy Efficiency and Resource Management
- 14.7 Sustainability, Recycling and Circularity
- 14.8 Technology Roadmap, 2025-2035
- 14.9 Risks of Obsolescence and Technology Substitution
Chapter 15 Global Subsea Cable Repair Services Market Key Strategic Imperatives
- 15.1 Growth and Market Entry Priorities
- 15.2 High-Return Products and Segments
- 15.3 Pricing, Profitability and Cost Optimization
- 15.4 Technology Investment and Product Differentiation
- 15.5 Supply Chain Localization and Resilience
- 15.6 Distribution and Customer Acquisition
- 15.7 Partnership, Acquisition and Capacity Strategy
- 15.8 Regional Expansion Priorities
- 15.9 Short-, Medium- and Long-Term Actions
Chapter 16 Competition Outlook
- 16.1 Industry Competition Characteristics
- 16.2 Market Structure and Concentration
- 16.3 Market Share and Competitive Positioning, 2025
- 16.4 Company-Wise Revenue and Product Benchmarking
- 16.5 Production and Service Capacity Benchmarking
- 16.6 Technology, Pricing and Differentiation
- 16.7 Regional Footprint and Distribution Strength
- 16.8 Mergers, Acquisitions and Strategic Alliances
- 16.9 New Entrants and Competitive Threats
- 16.10 Porter's Five Forces and Industry Attractiveness
- 16.11 Competitive Outlook, 2025-2035
Chapter 17 Company Profiles
- 17.1 Company Coverage and Selection Criteria
- 17.2 Global Marine
- 17.2.1 Business Description
- 17.2.2 Company Ownership and Geographic Presence
- 17.2.3 Product and Service Portfolio
- 17.2.4 Manufacturing and Operating Footprint
- 17.2.5 Financial Performance and Investment
- 17.2.6 Market Share and Competitive Position
- 17.2.7 Technology and Innovation Capabilities
- 17.2.8 Strategic Alliances or Partnerships
- 17.2.9 Recent Developments
- 17.2.10 Growth Strategy and Outlook
- 17.3 Orange Marine
- 17.4 SubCom
- 17.5 Alcatel Submarine Networks
- 17.6 NTT WE Marine
- 17.7 E-Marine
- 17.8 Other Relevant Market Participants
Note: Every listed company is profiled on the structure shown under the first company. The company list is preliminary and may change based on research findings, market developments, data availability and client requirements.
Chapter 18 Disclaimer
- 18.1 Research and Forecast Disclaimer
- 18.2 Data Source and Estimation Limitations
Note: The depth of individual sections depends on data availability for this market. Volume, capacity, trade and other unit-based metrics are included where applicable.

