Market Overview
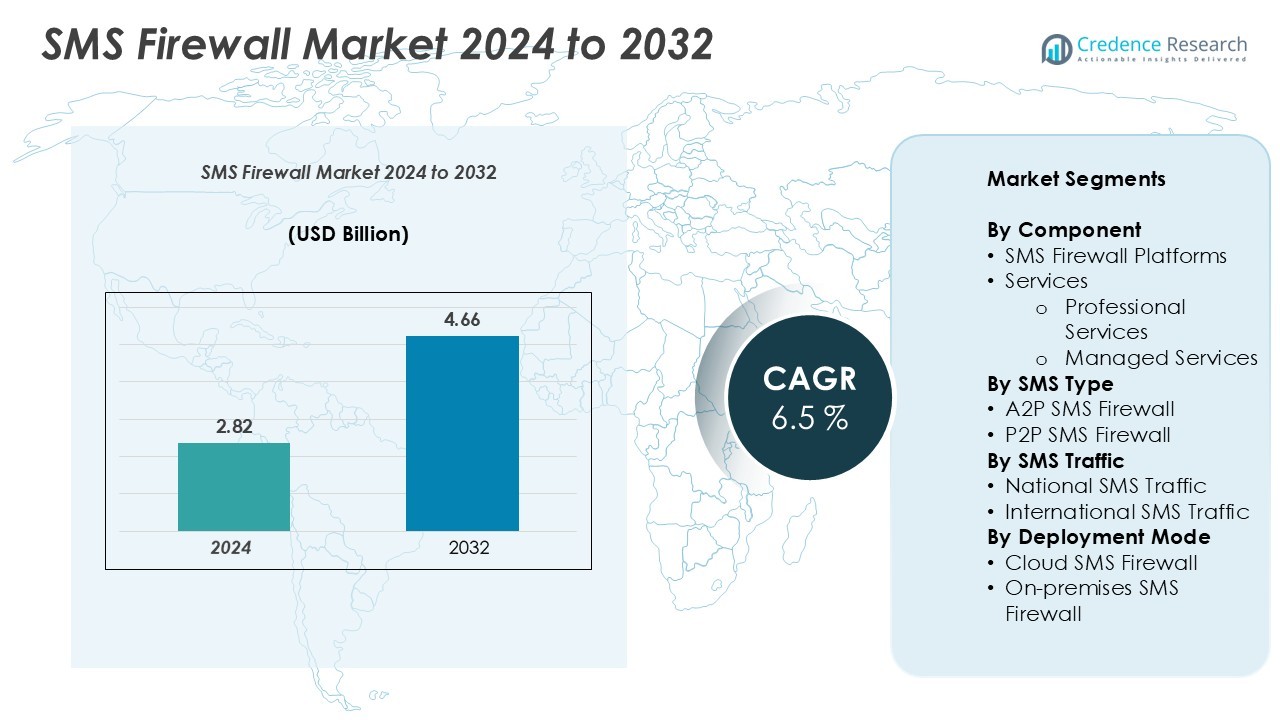
The SMS Firewall market size was valued at USD 2.82 billion in 2024 and is anticipated to reach USD 4.66 billion by 2032, at a CAGR of 6.5% during the forecast period.
| REPORT ATTRIBUTE |
DETAILS |
| Historical Period |
2020-2023 |
| Base Year |
2024 |
| Forecast Period |
2025-2032 |
| SMS Firewall Market Size 2024 |
USD 2.82 Billion |
| SMS Firewall Market, CAGR |
6.5% |
| SMS Firewall Market Size 2032 |
USD 4.66 Billion |
Leading players in the market include Mobileum, Infobip, Sinch, TATA Communications, Proofpoint, BICS, Comviva, Cellusys, AdaptiveMobile Security, and Monty Mobile. These companies focus on enhancing detection accuracy, real-time analytics, and automation to strengthen network security and messaging integrity. Their strategies emphasize scalable managed services, AI-driven threat intelligence, and policy enforcement solutions to counter fraud, spam, and signaling attacks. Regionally, Asia Pacific dominates with a 35.4% market share due to rapid telecom expansion and growing digital transactions. North America follows with 24.8% driven by enterprise security needs, and Europe holds 21.6% amid regulatory compliance efforts. The Middle East, Latin America, and Africa collectively represent emerging growth regions with rising network modernization investments.
Access crucial information at unmatched prices!
Request your sample report today & start making informed decisions powered by Credence Research Inc.!
Download Sample
Market Insights
- The SMS Firewall market was valued at USD 2.82 billion in 2024 and is projected to reach USD 4.66 billion by 2032, growing at a CAGR of 6.5%. Asia Pacific leads with 35.4% share, followed by North America at 24.8% and Europe at 21.6%.
- Growing A2P traffic from banking, e-commerce, and digital services drives firewall deployment. Operators seek reliable filtering to block spoofing, smishing, and grey-route leakage while improving delivery assurance.
- AI-driven, cloud-native architectures and managed service models are emerging trends. Vendors integrate threat intelligence and real-time analytics for adaptive protection and faster updates.
- Leading players such as Mobileum, Infobip, Sinch, and TATA Communications compete on analytics depth, automation, and scalability. Strategic partnerships with CPaaS providers enhance enterprise reach and compliance coverage.
- Regulatory complexity, SIM farms, and integration challenges restrain growth, though rising telecom digitization and fraud risks across Asia Pacific continue to sustain high investment momentum.
Market Segmentation Analysis:
By Component:
SMS Firewall Platforms lead adoption due to comprehensive threat coverage. Carriers prefer built-in rule engines and ML spam filters. Real-time analytics strengthens anomaly detection and fraud blocking. Compliance features support GDPR and telecom regulations. Services remain essential for deployment and tuning. Professional Services drive integration, audits, and custom policies. Managed Services expand fastest with 24/7 monitoring. Outsourcing reduces OPEX for mid-size operators. Vendors bundle platforms with lifecycle support. Long contracts improve stability and upgrades.
- For instance, Mobileum’s Active Intelligence Platform processes over 3 trillion signaling events monthly across 900 networks, integrating machine learning models for real-time anomaly detection and policy enforcement. The system enables latency of under 50 milliseconds in message inspection, helping operators block fraud attempts instantly.
By SMS Type:
A2P SMS Firewall holds leadership as enterprises scale messaging. Growth comes from OTP, 2FA, alerts, and marketing. Banks and fintechs need strict filtering and delivery assurance. Rule libraries target grey routes and spoofing. Template and content checks lift trust and throughput. P2P SMS Firewall remains vital for user privacy. It blocks spam waves and SIM-box traffic. Social and chat apps sustain P2P relevance. Policy updates keep networks clean.
- For instance, BICS offers its A2P Protect solution to filter high volumes of enterprise messages, utilizing advanced analytics and AI-based routing to identify and block fraudulent traffic. Its systems operate in near real-time, allowing telecom providers to respond quickly to threats like spoofing and improve overall trust and quality across international messaging routes. BICS is an established communications provider that markets fraud prevention tools to combat fraudulent messaging.
By SMS Traffic:
International SMS Traffic accounts for higher monetization and risk. Cross-border A2P volumes keep rising. Firewalls block header spoofing and route hijacking. Number portability checks and HLR dips improve accuracy. Geo-fencing policies deter bypass and fraud. National SMS Traffic stays sizable in mature markets. Domestic enterprises demand consistent deliverability and analytics. National filtering aligns with regulator mandates. Traffic insights support pricing and partner management. Continuous tuning sustains revenue integrity.
Key Growth Drivers
Explosion in A2P Authentication and Alerts
A2P volumes keep rising across banking, ecommerce, and ride-hailing. One-time passwords drive strict filtering needs. Enterprises demand assured delivery and brand protection. Operators deploy firewalls to block spoofing and smishing. Content and header checks improve trust scores. Policy templates accelerate onboarding for regulated sectors. Real-time scoring flags risky routes instantly. Analytics expose abnormal spikes and grey traffic. Carriers convert blocked traffic into billed routes. This protects revenue and user experience. Government e-service messages add further volumes. Seasonal campaigns also stress test controls. Firewalls scale capacity without losing accuracy.
- For instance, Tanla Platforms Limited processed over 800 billion interactions annually through its cloud communications platform.
Operator Revenue Assurance and Margin Defense
Unchecked bypass erodes messaging margins. Firewalls close grey routes quickly. Dynamic pricing rules improve wholesale yields. Number portability checks remove undeliverable attempts. HLR dips reduce waste on invalid numbers. Route optimization shifts traffic to verified paths. Dashboards reveal leakage by partner and geography. Carriers renegotiate deals using hard evidence. Blocking policies align with regulator mandates. Clean traffic improves enterprise satisfaction. Better deliverability lifts contract renewals. Monetization expands through premium compliance features. Operators defend ARPU while cutting dispute risk.
- For instance, Sinch is a leading cloud communications provider that uses global number intelligence and HLR lookups to prevent message delivery failures and optimize routing.
Cloud-Native, AI-Driven Protection at Scale
Modern firewalls run cloud-native architectures. Autoscaling meets festival and flash-sale peaks. AI models detect novel fraud patterns fast. Unsupervised learning surfaces unknown anomalies. Feedback loops harden models daily. Low-latency inference preserves message throughput. CI/CD pipelines accelerate rule updates. APIs integrate with CPaaS and CRM stacks. Multi-tenant controls separate data cleanly. Observability shortens incident resolution time. Total cost of ownership declines meaningfully. Vendors ship features without long maintenance windows. Operators gain speed and resilience together.
Key Trends & Opportunities
Rise of Managed Services and CPaaS Partnerships
Many operators prefer managed operations. 24/7 monitoring improves response times. Vendors bundle tuning and playbooks. CPaaS partners co-design enterprise policies. Joint go-to-market unlocks new verticals. SLA-based offerings reduce operational stress. Shared threat intelligence speeds remediation. Ticket volumes drop through automation. Professional services handle audits and training. Managed models help smaller carriers compete. Cost becomes predictable under subscriptions. Upsell paths include analytics and reporting portals. Partnerships compress time to value.
- For instance, Mobileum’s SMS Firewall applies machine-learning analytics across SS7 and SMPP to filter SMS messages in real-time. It integrates a URL Scanner for inspecting malicious links and incorporates threat intelligence feeds to identify potential threats. Telecom operators use a single console to manage rules and conduct audits. The company also offers managed services to fine-tune the firewall, which reduces the need for manual tickets and oversight.
Convergence with 5G, RCS, and Signaling Security
Messaging threats now cross layers. Firewalls integrate with signaling defenses. 5G slices require strict isolation. RCS adoption adds rich payload checks. Identity frameworks reduce spoofing risk. Cross-channel analytics reveal blended attacks. Policies coordinate across SMS, RCS, and OTT. Network functions run on containers. MEC locations cut inspection latency. Exposure APIs demand secure mediation. Vendor roadmaps emphasize unified consoles. Convergence simplifies operations and strengthens posture. Investment cases improve with shared platforms.
- For instance, Ericsson’s Security Manager platform provides a comprehensive cybersecurity solution for mobile networks, including 5G. This platform helps communication service providers and mission-critical operators manage telecom-specific threats, automate security tasks, and ensure compliance with a Zero Trust Architecture approach. Ericsson also protects against specific signaling vulnerabilities through products like its Signaling Controller, which is part of its dual-mode 5G Core offering.
Emerging Markets Digitization and Cross-Border Growth
New digital services expand fast. Fintech and micro-lending fuel alerts. Governments scale citizen notifications. Education and health programs use A2P heavily. International traffic grows with ecommerce. Cross-border risks increase fraud exposure. Firewalls tailor rules by corridor. Language and template libraries improve accuracy. Local compliance features win bids. Cloud delivery avoids large capex. Partners provide regional threat feeds. Carriers monetize verified sender programs. Growth opportunities remain strong across continents.
Key Challenges
Adaptive Fraud, SIM Farms, and Tool Evasion
Adversaries change tactics frequently. SIM farms mimic normal behavior. Content obfuscation evades simple rules. Header spoofing still appears in bursts. Link shorteners hide malicious targets. Encrypted paths reduce visibility. Attackers test routes continuously. Models risk drift without retraining. Carriers need rapid rule governance. False positives can hurt delivery. Investigation backlogs delay action. Skilled analysts remain scarce. Continuous improvement becomes a hard requirement.
Compliance, Privacy, and Integration Complexity
Privacy laws tighten data handling. Cross-border flows trigger jurisdiction issues. Consent records must be validated. Lawful intercept adds process overhead. Vendor lock-in worries procurement teams. Legacy SMSCs limit feature rollout. Multi-vendor integration raises costs. API security needs strict controls. Proof of compliance demands audits. Misconfigured policies can block legit traffic. Change management strains teams. Budgets face competing 5G priorities. Programs must show clear ROI quickly.
Regional Analysis
North America
North America ranks second with a 24.8% market share. Strict compliance frameworks shape procurement choices. BFSI, retail, and healthcare sustain heavy A2P volumes. Operators prioritize grey-route closure and revenue assurance. AI analytics speed anomaly detection and response. Cloud deployments absorb holiday and campaign surges. CPaaS alliances accelerate enterprise onboarding and governance. Unified consoles strengthen auditing and regulator reporting. Cross-border traffic needs rigid origin validation.
Europe
Europe holds a 21.6% market share in 2024. GDPR and e-privacy rules anchor investment cases. Public services and banks drive steady A2P flows. Multi-country routing adds portability complexity for operators. On-prem options address data residency mandates. RCS rollouts expand payload and link checks. Vendors ship market-specific language and compliance presets. Analytics streamline regulator reporting and disputes. Roaming agreements tighten interconnect policies.
Asia Pacific
Asia Pacific leads the SMS firewall market with a 35.4% share. Super apps and fintech drive relentless OTP demand. Ecommerce festivals create extreme, short-burst traffic peaks. Operators deploy cloud-native firewalls for elastic capacity. Managed services close skills and coverage gaps. Multilingual templates improve filtering across complex scripts. Cross-border corridors raise fraud risk and revenue. Rule updates target SIM farms and grey routes. Governments expand citizen alerts at national scale.
Africa
Africa contributes 4.5% of the global market. Mobile-first economies drive OTP and alert growth. Operators focus on closing grey routes quickly. Cloud delivery cuts upfront costs and timelines. Managed services provide scarce expert capacity. Language packs improve accuracy across diverse markets. Regulations strengthen consent and verified sender programs. Cross-border routes need strong geo-fencing. Public health and education messaging add steady demand.
Middle East
The Middle East accounts for 7.2% of global revenue. Government digital programs boost transactional messaging volumes. BFSI and travel demand strict spoofing defenses. Multi-tenant platforms fit regional operator groups. On-prem choices meet sovereignty expectations. HLR dips reduce undeliverable waste meaningfully. Geo-fencing protects sensitive national campaigns. CPaaS alliances extend enterprise reach. High-availability designs remain a critical requirement.
Latin America
Latin America represents 6.5% market share in 2024. Banks, delivery apps, and mobility expand A2P traffic. Operators invest to restore revenue integrity. Grey-route blocking lifts billable conversions and ARPU. Hybrid deployments balance capex with rapid scaling. Regulators tighten consent and sender verification. Local integrators accelerate rollout and training. Corridor risk scoring targets fraud hotspots. Dashboards support wholesale renegotiations.
Market Segmentations:
By Component
- SMS Firewall Platforms
- Services
- Professional Services
- Managed Services
By SMS Type
- A2P SMS Firewall
- P2P SMS Firewall
By SMS Traffic
- National SMS Traffic
- International SMS Traffic
By Deployment Mode
- Cloud SMS Firewall
- On-premises SMS Firewall
By Geography
- North America
- Europe
- Germany
- France
- U.K.
- Italy
- Spain
- Rest of Europe
- Asia Pacific
- China
- Japan
- India
- South Korea
- South-east Asia
- Rest of Asia Pacific
- Latin America
- Brazil
- Argentina
- Rest of Latin America
- Middle East & Africa
- GCC Countries
- South Africa
- Rest of the Middle East and Africa
Competitive Landscape
The competitive landscape features telecom specialists and security vendors intensifying innovation. Leading players include Infobip, Mobileum, Sinch, TATA Communications, Proofpoint, Monty Mobile, BICS, Comviva, Cellusys, and AdaptiveMobile Security. Vendors compete on detection accuracy, policy depth, and analytics usability. Product roadmaps emphasize AI models, real-time scoring, and automated rule governance. Platforms integrate with CPaaS, CRM, and signaling firewalls for unified defenses. Managed services expand with 24/7 monitoring and outcome-based SLAs. Data residency and sovereignty shape on-prem and hybrid choices. Partnerships with operators accelerate corridor coverage and threat intelligence sharing. Pricing leans toward subscriptions with tiered compliance features. RCS, 5G, and cross-border traffic drive roadmap convergence. Vendors differentiate through rapid deployment, low latency, and regulator-ready reporting.
Shape Your Report to Specific Countries or Regions & Enjoy 30% Off!
Key Player Analysis
Recent Developments
- In May 2025, Proofpoint agreed to acquire Hornetsecurity for more than USD 1 billion, strengthening AI-based Microsoft 365 security across European SMEs.
- In April 2025, XConnect purchased Sekura.id, adding real-time mobile identity verification to numbering intelligence services.
- In April 2024, Spark New Zealand selected Mobileum for multi-protocol signaling and SMS firewall protection.
Report Coverage
The research report offers an in-depth analysis based on Component, SMS Type, SMS Traffic, Deployment Mode and Geography. It details leading market players, providing an overview of their business, product offerings, investments, revenue streams, and key applications. Additionally, the report includes insights into the competitive environment, SWOT analysis, current market trends, as well as the primary drivers and constraints. Furthermore, it discusses various factors that have driven market expansion in recent years. The report also explores market dynamics, regulatory scenarios, and technological advancements that are shaping the industry. It assesses the impact of external factors and global economic changes on market growth. Lastly, it provides strategic recommendations for new entrants and established companies to navigate the complexities of the market.
Future Outlook
- AI-driven detection will become standard across operator deployments.
- Managed services will outpace in-house operations for 24/7 coverage.
- Cloud-native firewalls will dominate new deployments and expansions.
- RCS and 5G integration will unify messaging and signaling protection.
- Stricter regulations will push consent, auditing, and data residency features.
- Cross-border A2P growth will increase corridor-specific policies and pricing.
- SIM farm evasion will drive faster model retraining and rule automation.
- CPaaS partnerships will accelerate enterprise onboarding and policy templates.
- Hybrid architectures will balance on-prem control with cloud scalability.
- Revenue assurance tools will expand, converting blocked traffic into billable routes.



