
Institutional owners and renovation work carry design fees
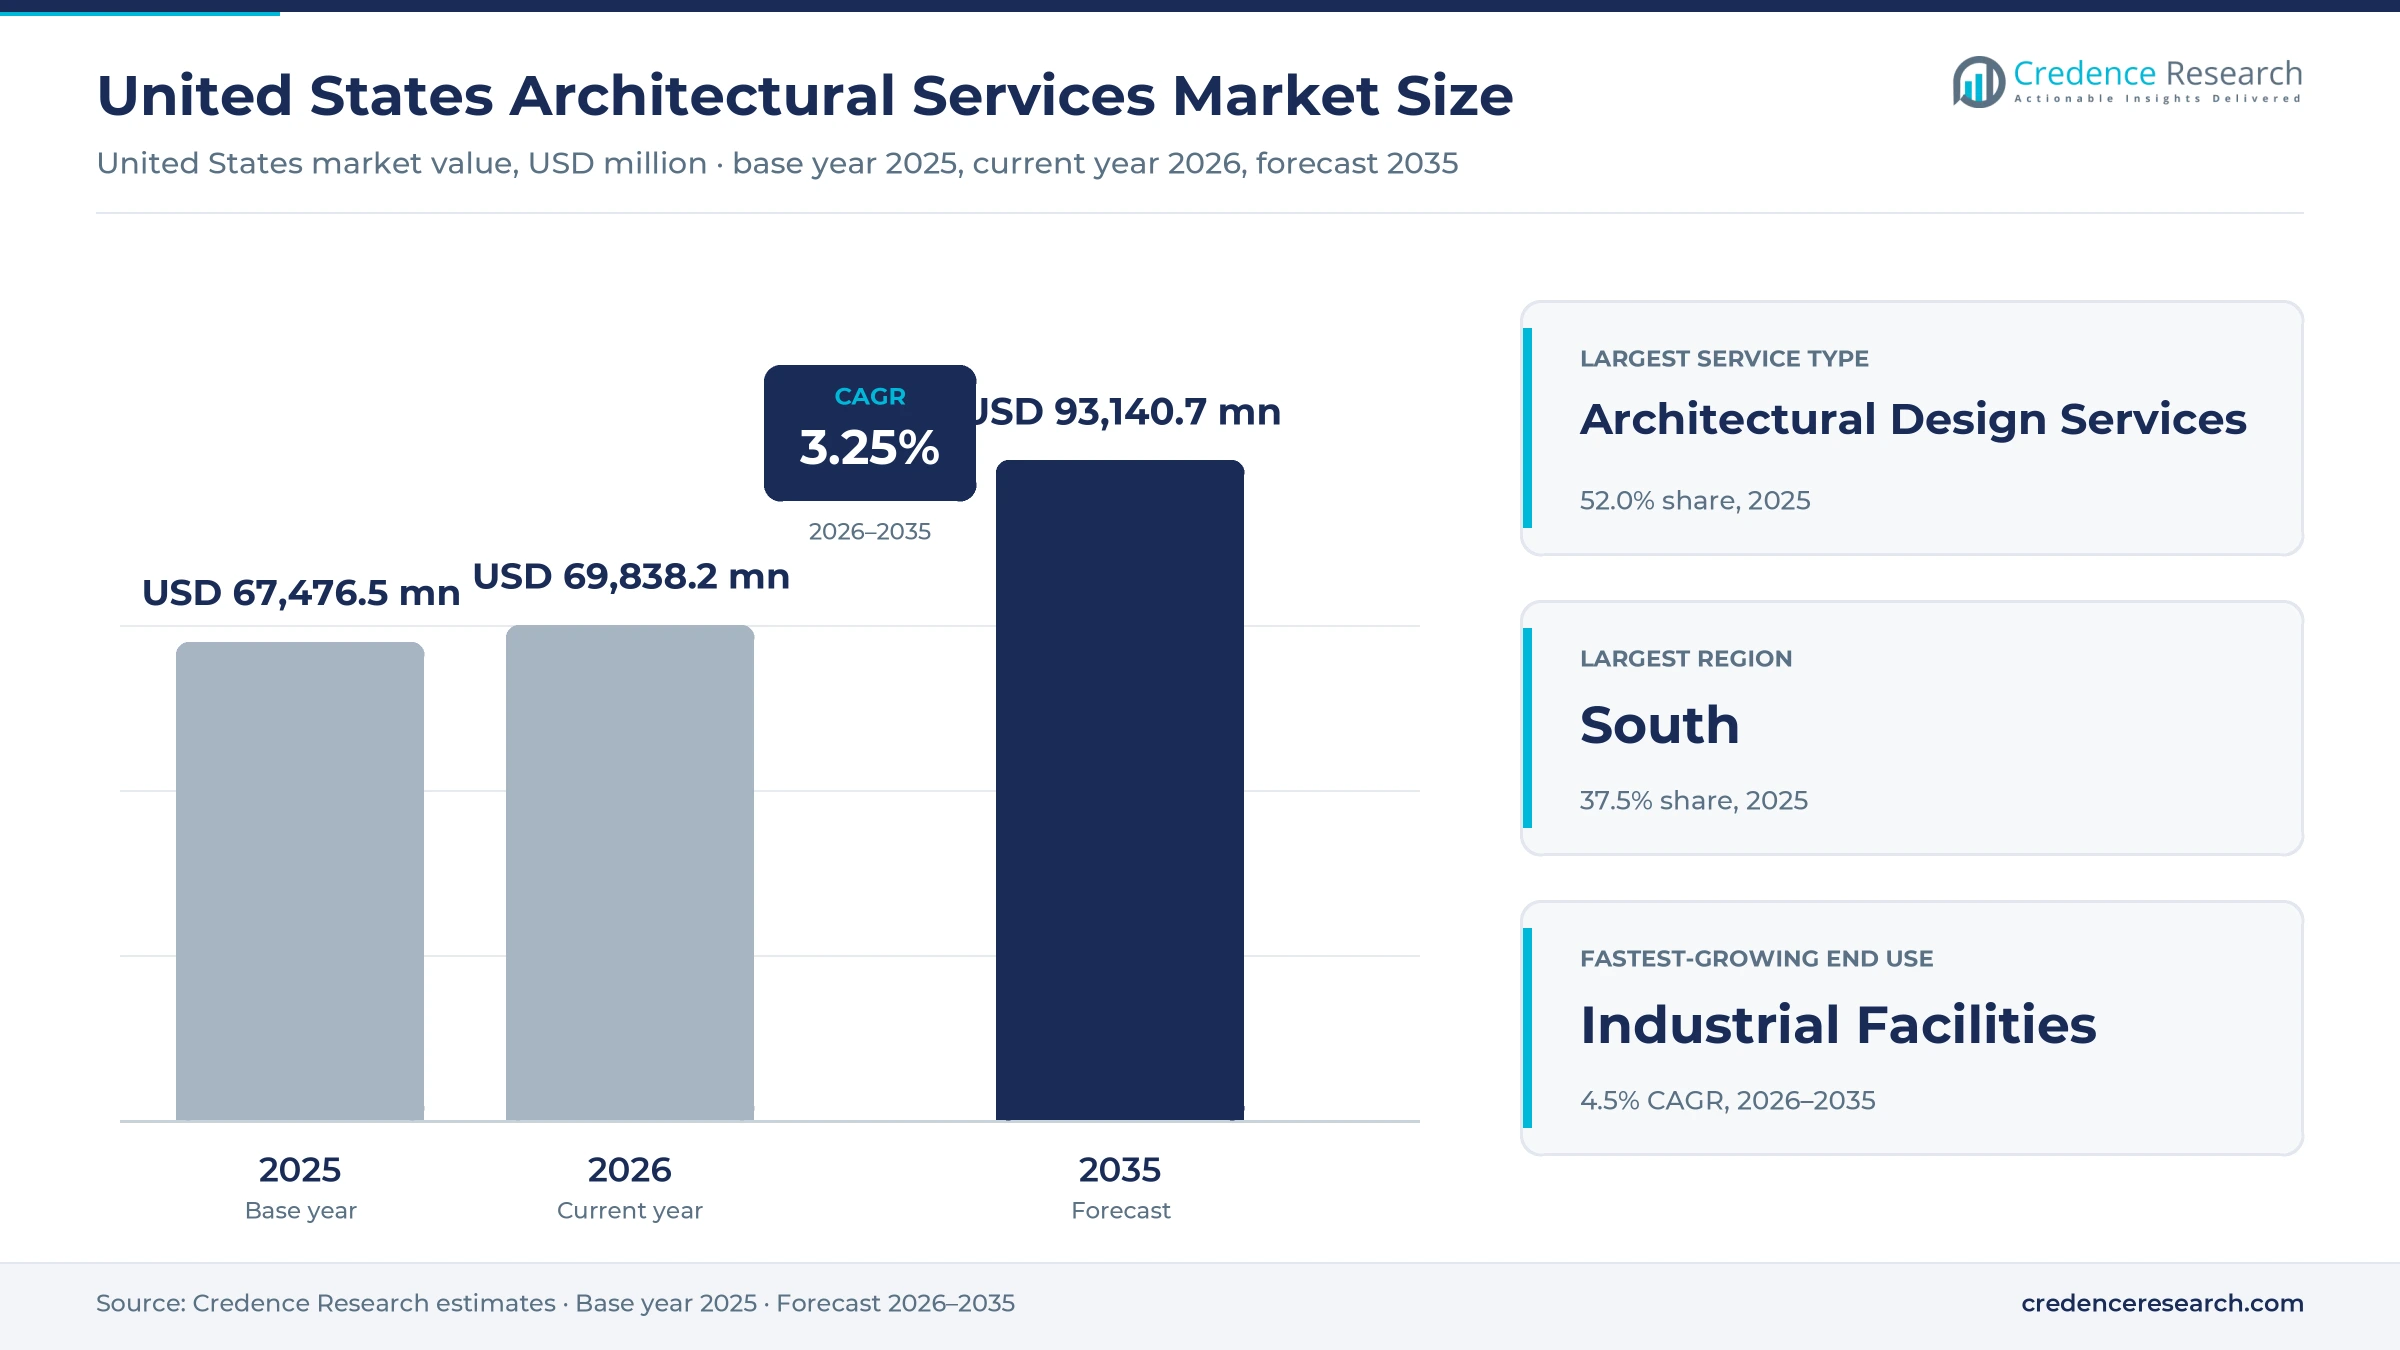
The United States architectural services market was valued at USD 67.48 billion in 2025 and is projected to increase from USD 69.84 billion in 2026 to USD 93.14 billion by 2035, registering a CAGR of 3.25% during 2026–2035. Design fees follow building investment with a lag, so the current pipeline of schools, hospitals, data centers and conversions sets demand for the next three years. The South held the largest regional share, 37.5% in 2025, because Texas and the Southeast keep adding students, patients and data center capacity. It is also the fastest-growing region at 3.5% a year. Work is shifting toward existing buildings, as owners renovate, convert and extend aging stock rather than build new offices. Large practices are also buying regional and specialist firms, which concentrates complex institutional and mission-critical commissions among integrated architecture and engineering groups. Fee pressure persists, because billings have contracted for most of the past three years.
Design, delivery and planning fees paid by U.S. building owners
The market covers professional fees that U.S. building owners pay to architecture practices for design, construction and project management, engineering performed inside design firms, interior design and urban planning advice. Values are measured as fee revenue billed in the United States, whether the practice is a sole practitioner, a national design firm or the buildings arm of an engineering group.
Construction costs, building products, software licenses and engineering work for roads, water and energy systems that involves no building design are excluded. In this report, industrial facilities include data centers, laboratories and production plants of all sizes. The value chain runs from owners and their program managers to lead architects, specialist consultants, engineers and the contractors that build the work.
United States Architectural Services Market Insights
- The market grows from USD 67.48 billion in 2025 to USD 93.14 billion by 2035 at a 3.25% CAGR, as institutional, data center and reuse programs offset a weak office pipeline.
- The South held 37.5% of 2025 value and grows fastest at 3.5% a year, helped by Texas school bonds and data center construction around Dallas.
- Architectural design services led with 52.0% of 2025 value, while embedded engineering services grow fastest at 4.0% a year.
- About 45% of 2023 billings at U.S. architecture firms came from renovation, retrofit, additions and preservation, according to the AIA Firm Survey.
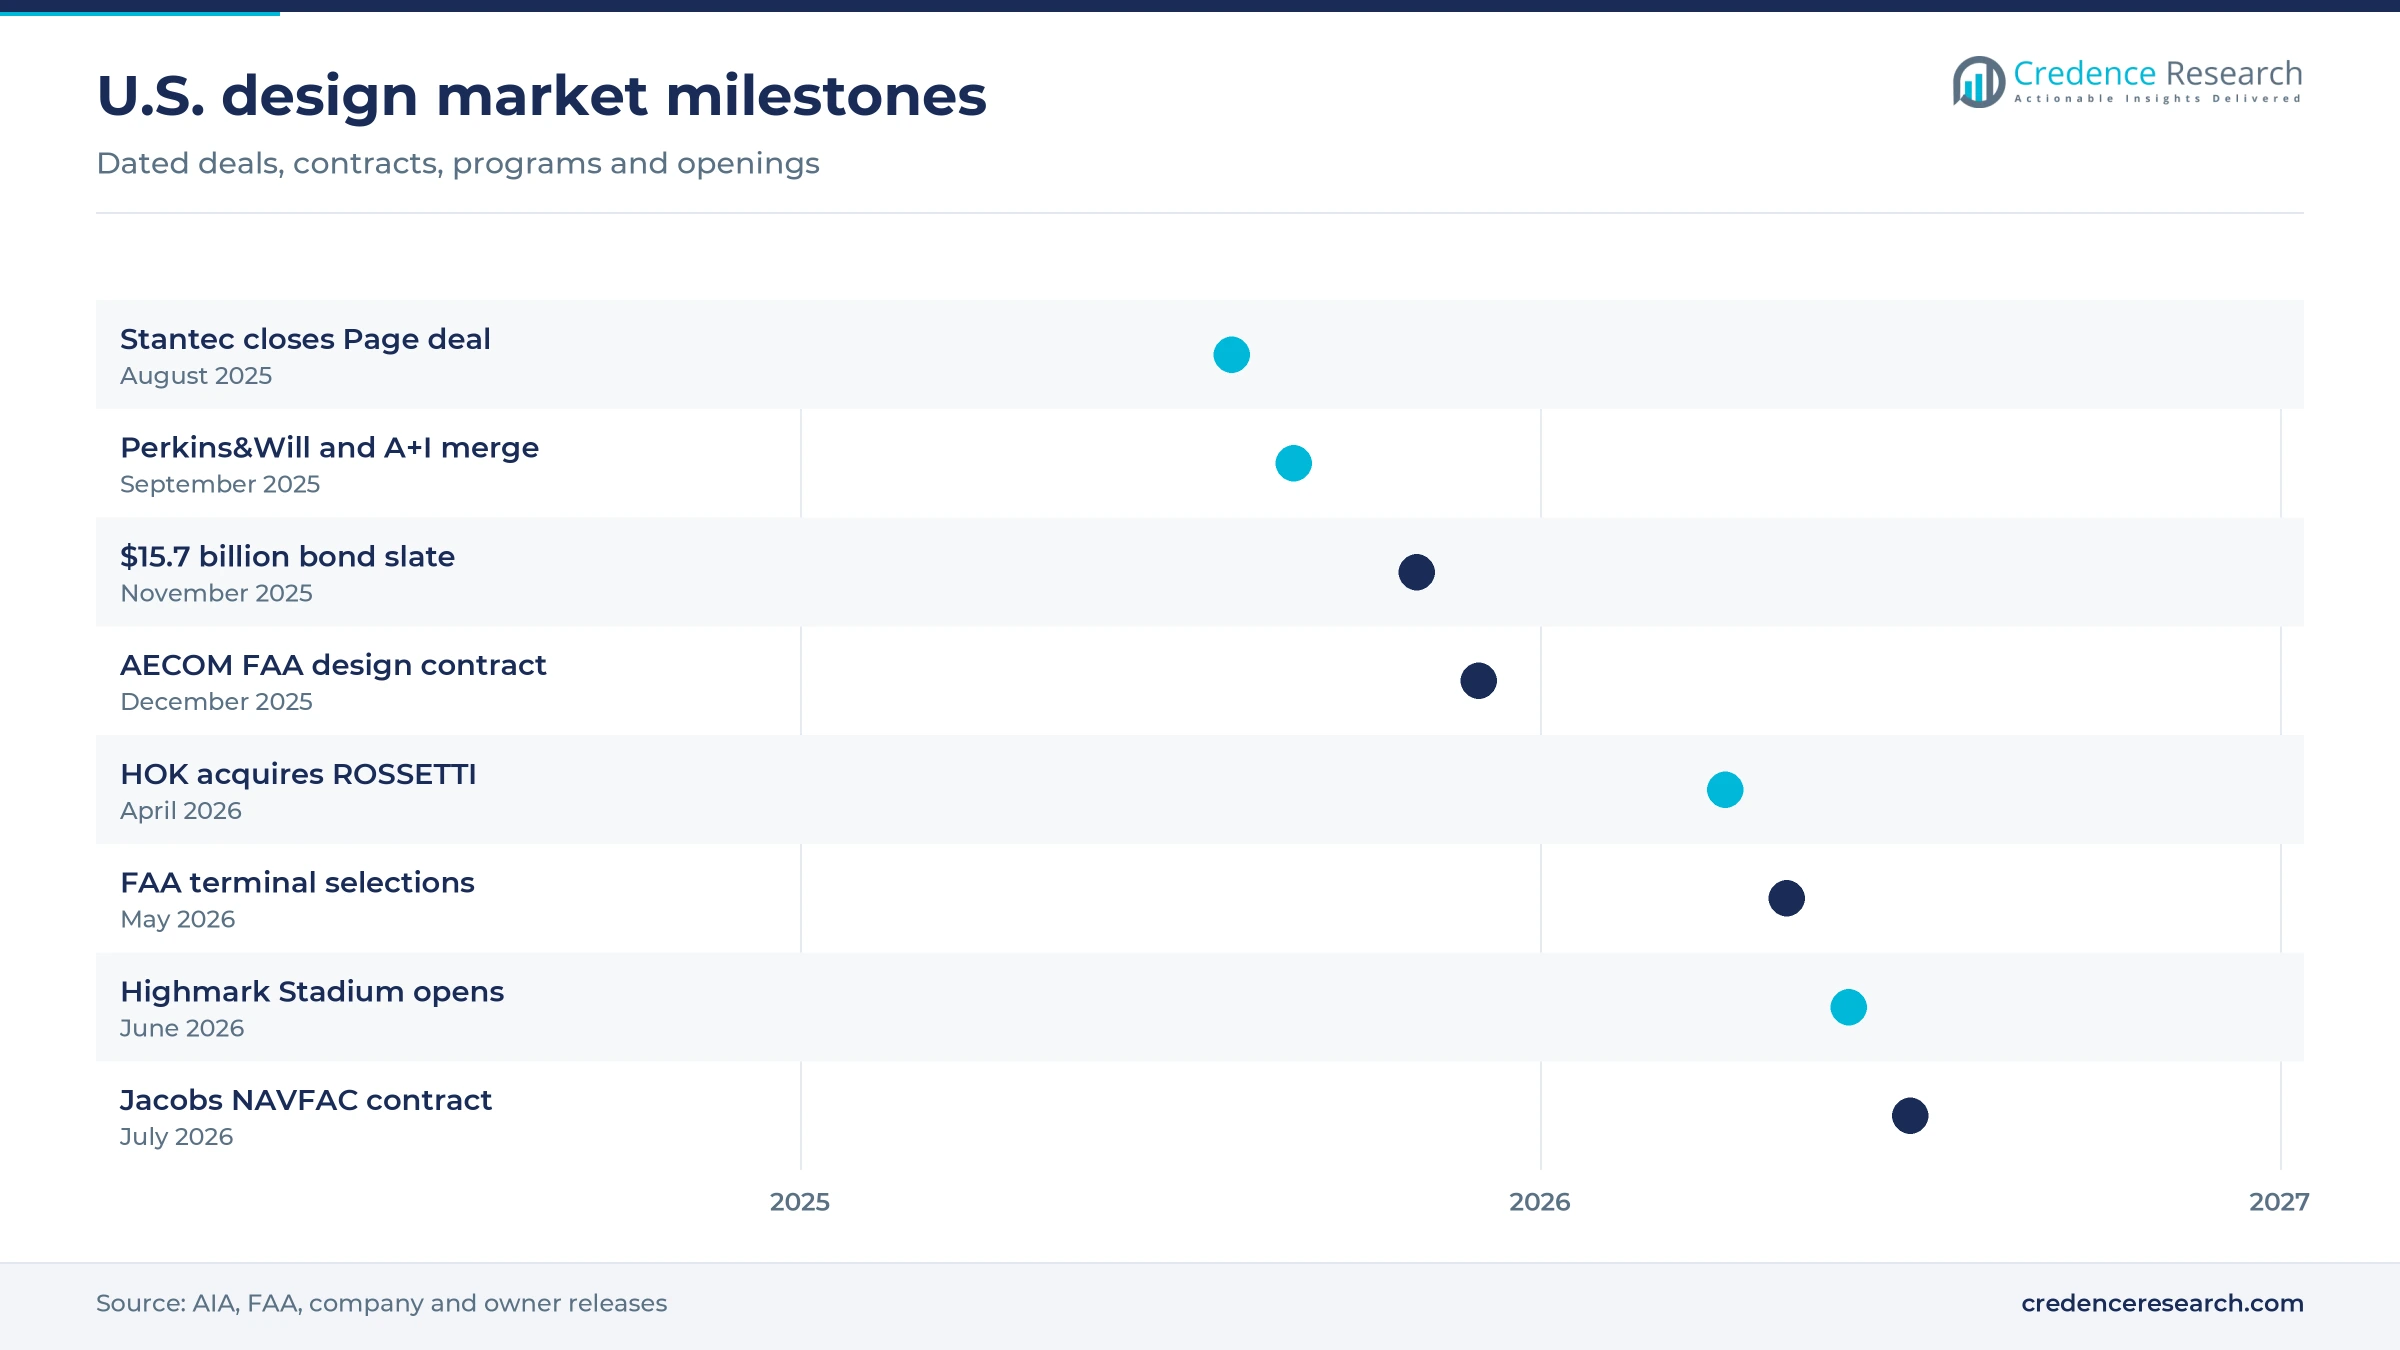
- Stantec closed its purchase of Page in August 2025, and HOK bought Detroit-based ROSSETTI in April 2026, extending consolidation among large practices.
Design leads while engineering and industrial work grow
Design fees lead as embedded engineering grows fastest
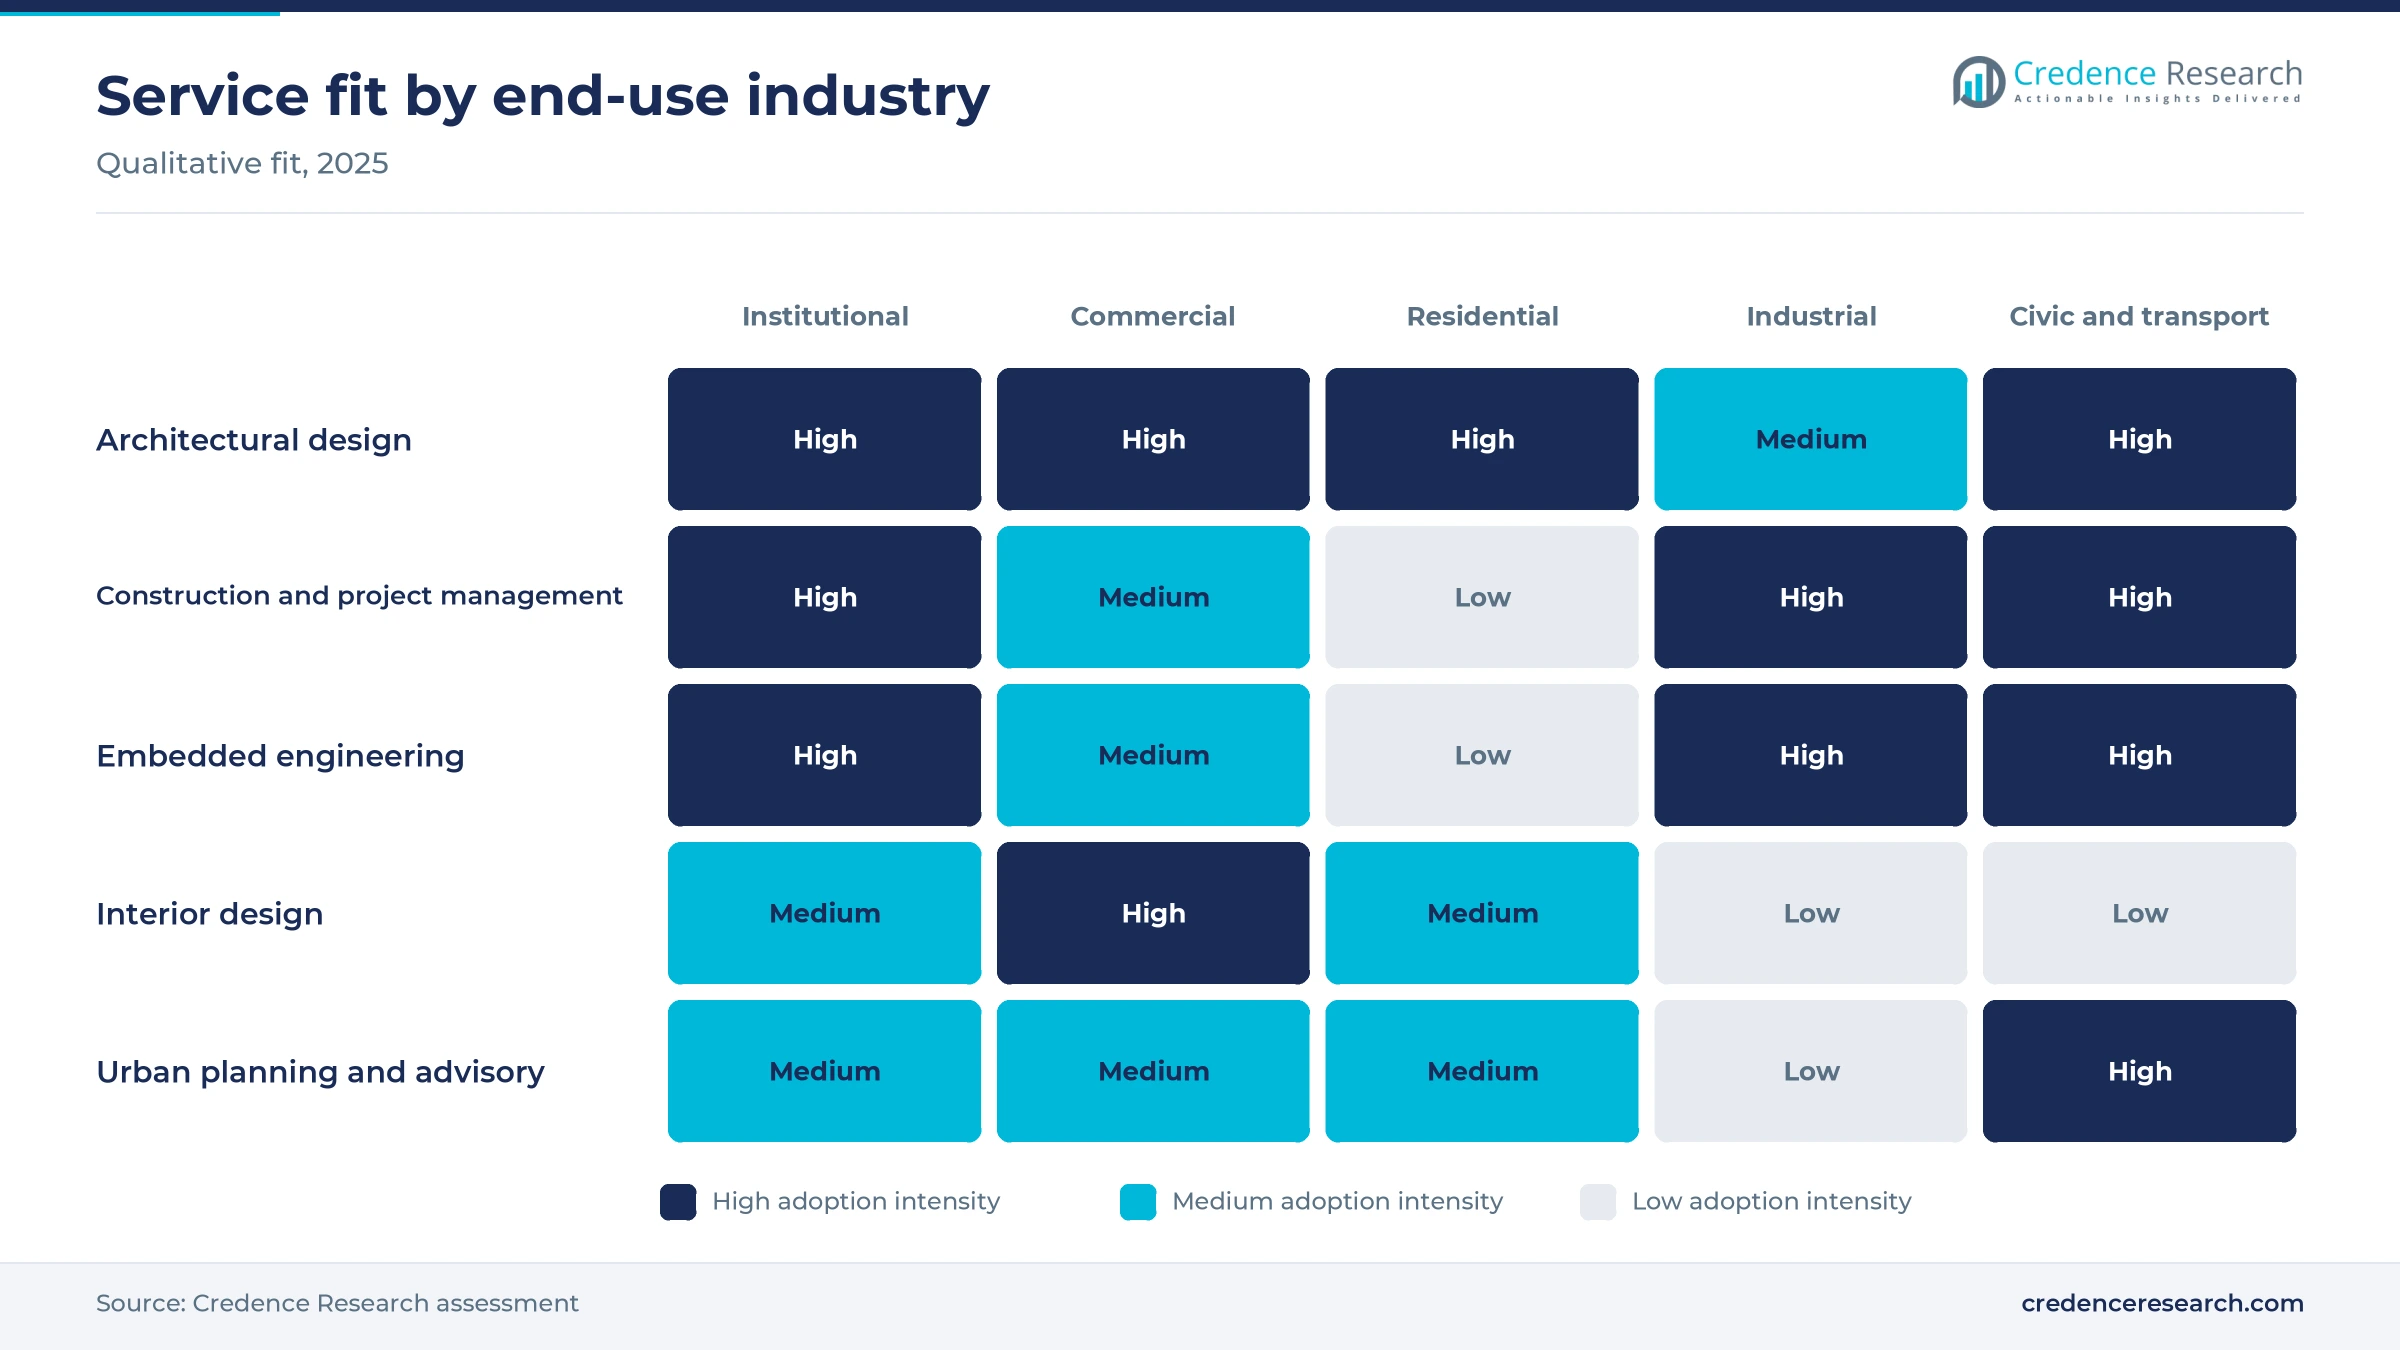
Based on service type, the market is categorized into architectural design services, construction and project management, embedded engineering services, interior design services and urban planning and advisory. Architectural design services led with 52.0% of 2025 value because design is the licensed core of every commission, and NCARB counted just over 123,000 licensed architects in 2025, up about 6%, Building Enclosure reported. Embedded engineering services grow fastest at 4.0% a year, as owners hire single teams for complex buildings, and Stantec said its August 2025 purchase of Page grew its Buildings practice by 35%.
Institutional work leads while industrial facilities grow fastest
Based on end-use industry, the market is categorized into institutional facilities, commercial properties, residential buildings, industrial facilities and civic and transport facilities. Institutional facilities led with 42.0% of 2025 value because schools, hospitals and government buildings produced more than half of 2023 billings at firms in the AIA Firm Survey, while manufacturing produced only 3%. Industrial facilities grow fastest at 4.5% a year, as the AIA consensus panel in July 2026 expected data center construction to rise 33% in 2026 even as manufacturing spending falls 11.6%. Data center design is specialized work that owners usually repeat with the same team.
Private owners lead as public owners grow fastest
Based on customer type, the market is categorized into private commercial owners, public owners, nonprofit institutional owners and individual residential clients. Private commercial owners led with 44.0% of 2025 value because private nonresidential construction ran at a seasonally adjusted annual rate of $773.0 billion in August 2026, against $535.5 billion of public nonresidential work, according to the Census Bureau construction spending release. Public owners grow fastest at 3.6% a year, as public nonresidential spending rose 2.7% from a year earlier while private nonresidential spending fell 1.0%. Public budgets are approved years ahead, which steadies design fees.
Fixed fees lead as portfolio contracts grow fastest
Based on revenue model, the market is categorized into fixed-fee project contracts, time-based service contracts and portfolio and retainer contracts. Fixed-fee project contracts led with 55.0% of 2025 value because owners set design fees against a construction budget, and the Federal Acquisition Regulation caps federal fees for designs, plans and specifications at 6 percent of estimated construction cost. Portfolio and retainer contracts grow fastest at 4.2% a year, as agencies bundle work into long programs, and AECOM won a 10-year Federal Aviation Administration contract with a ceiling above $270 million in December 2025.
| Segment Group | Leading Sub-segment | Share, 2025 | Fastest-growing Sub-segment | CAGR, 2026–2035 |
|---|---|---|---|---|
| By Service Type | Architectural Design Services | 52.0% | Embedded Engineering Services | 4.0% |
| By End-Use Industry | Institutional Facilities | 42.0% | Industrial Facilities | 4.5% |
| By Customer Type | Private Commercial Owners | 44.0% | Public Owners | 3.6% |
| By Revenue Model | Fixed-Fee Project Contracts | 55.0% | Portfolio and Retainer Contracts | 4.2% |
Hourly rates hold firm while fee caps limit public work
Most commissions are priced as a fixed fee or a percentage of construction cost, then managed internally against hourly rates by staff level. Rates have risen slowly, because AIA reported architect compensation growth of less than 3% a year from 2023 to 2025, down from about 5% in the post-pandemic boom. Margins are thinner, as PKF O'Connor Davies found profit fell to 14.0% of net fee income in 2024 from 15.8% in 2023. Firms with specialist sectors, such as health care and data centers, defend rates better because owners value prior experience over price.
| Role or fee basis | Typical price or fee | Basis |
|---|---|---|
| Principal hourly billing rate | USD 310 per hour | PKF O'Connor Davies A&E study, 2024 data |
| Senior associate or project manager | USD 230 per hour | PKF O'Connor Davies A&E study, 2024 data |
| Senior architect | USD 190 per hour | PKF O'Connor Davies A&E study, 2024 data |
| Architect | USD 160 per hour | PKF O'Connor Davies A&E study, 2024 data |
| Federal design fee ceiling | 6% of estimated construction cost | Federal Acquisition Regulation 15.404-4 |
Request a Free Sample
Fill in your details and we'll send you a free sample report.
- Sample data tables & charts
- Research methodology
Schools, data halls and reuse projects fill design pipelines
Institutional building investment steadies design demand
Public and nonprofit owners are the steadiest buyers of design, because their projects are funded through bonds and budgets that run for several years. Public educational construction held at a $113.1 billion annual rate in August 2026, up 1.3% from a year earlier, according to the Census Bureau. Voters faced at least $15.7 billion of state and local bond measures of $200 million or more in November 2025, including school renovations, Bloomberg reported. The AIA consensus panel expected health care construction to rise 4.6% in 2026 in its January forecast. Institutional facilities, which hold 42.0% of 2025 value, therefore anchor backlogs while private office work stays weak.
Specialized industrial development adds high-fee work
Data centers have become the main source of new industrial design work, and they reward firms with mission-critical experience. Data center construction ran at an annual rate of $45 billion in December 2025, up almost 30% from a year earlier, and is starting to eclipse spending on all other office buildings, Marketplace reported from Census Bureau data. The AIA consensus panel expects data center spending to rise another 25% in 2027. Corgan, ranked the top data center architecture firm by Building Design and Construction, now employs more than 1,400 people across 23 locations. Each hyperscale campus feeds a wider data center construction pipeline, so industrial facilities remain the fastest-growing end use in U.S. architectural services.
Existing-building renewal shifts fees to renovation
Owners are spending more on existing buildings, which keeps design firms busy even when new starts slow. About 45% of 2023 gross billings came from renovations, retrofits, additions and historic preservation, according to the AIA Firm Survey. The pipeline of office-to-apartment conversions reached 90,300 units at the start of 2026, up 28% from a year earlier, Bisnow reported from RentCafe data. The National Park Service certified 939 historic rehabilitation projects with about $9.6 billion of investment in fiscal 2025. Renovation work needs surveys, code analysis and phasing plans, so it carries more design hours per construction dollar than new building.
Venue and terminal programs widen civic commissions
Airport terminals and sports venues give large practices a set of complex civic commissions with long design phases. The Federal Aviation Administration allocated $5 billion to its Airport Terminal Program, $1 billion a year from 2022 to 2026, and issued its fiscal 2026 selections on May 18, 2026. The new Highmark Stadium in Orchard Park, New York, designed by Populous, opened on June 23, 2026, at a cost of just over $2.1 billion, the Buffalo Bills said. Transportation construction rose 3.1% from a year earlier in August 2026, according to the Census Bureau. These long programs keep civic and transport facilities growing faster than commercial properties through the forecast.
Consolidation and design-build reshape who hires architects
Shift of work toward large integrated practices
Billings are shifting toward large firms, which buy regional specialists to enter new sectors and cities. The share of national billings earned by large firms rose about 40% between 2015 and 2023, according to the AIA Firm Survey. Perkins&Will merged with Architecture Plus Information in September 2025, adding about 80 staff and nearly doubling its New York studio to 179 people. HOK acquired ROSSETTI, a sports venue specialist based in Detroit, in April 2026 to rebuild its venue practice. The Page purchase noted above follows the same logic of buying sector depth and local reach. Buyers gain one contract for design and engineering, while smaller firms face stronger rivals on large public bids.
Rise of design-build and contractor-led appointments
More owners appoint architects through contractors under design-build, which changes who negotiates the fee and how risk is shared. The Design-Build Institute of America expects design-build to exceed 47% of U.S. construction spending by 2028, worth more than $1.1 trillion over five years, in its latest market study. The same study expects the largest design-build investment in manufacturing, highways and education, with progressive design-build growing in health care and water, and design-build spending compounding at 2.9 percent a year from 2024 to 2028. Contractor appointments suit owners that want one guaranteed price early in the project. Architects in these teams often accept narrower scopes and tighter schedules, but they gain steadier access to large projects that rarely go to open design competitions.
Opportunity in large office-to-residential conversions
Large conversions are an opening for firms that combine structural, code and residential expertise, because each project is unique. Gensler is design architect, interior architect and architect of record for the former Pfizer headquarters on East 42nd Street, which will hold more than 1,600 apartments, including over 400 affordable units, by 2027. Washington, D.C., had 8,479 conversion units in the pipeline at the start of 2026, second only to New York City, Bisnow reported. Historic rehabilitations certified in fiscal 2025 also created 11,544 new homes through adaptive reuse, the National Park Service said. Residential buildings, which grow slowly overall, gain most of their new fee work from this conversion pipeline.
Opportunity in long federal design programs
Long federal programs are an opening for practices that can staff many small projects under one contract. Jacobs won a multiyear task order contract in July 2026 from Naval Facilities Engineering Systems Command Washington to plan and design buildings, upgrades and site systems at Navy and Marine Corps installations in the capital region. The FAA program noted above covers control towers, radar facilities and airport lighting across three service areas over 10 years. Public nonresidential construction, which ran at $535.5 billion a year in August 2026, sets the size of this federal and state pipeline. Portfolio and retainer contracts grow fastest by revenue model at 4.2% a year. Firms that win these vehicles gain several years of predictable task orders and lower marketing costs.
Weak billings, delays and a thin license pipeline weigh in
Billings have contracted for more than three years
Weak billings mean firms compete for fewer commissions and accept lower fees. The AIA/Deltek Architecture Billings Index fell to 43.8 in January 2026, and newly signed design contracts scored 42.7, below the 50 line that separates growth from decline. The index reached 48.3 in April 2026 and has not topped 50 since January 2023, Steel Market Update reported. Smaller firms with thin backlogs feel this first, while firms in health care and data centers hold up better.
Postponed projects and cautious lenders delay new work
Financing problems are pushing projects into later years, which delays the design fees attached to them. Nearly two-thirds of contractors had at least one project postponed, scaled back or canceled in six months, according to an AGC and Sage survey cited by ARCHITECT in January 2026. Contractor backlogs fell to 8.1 months, tying their lowest level since the pandemic. Manufacturing construction fell 19.2% in the year to August 2026, so plant design teams face idle capacity.
A narrow licensure pipeline limits capacity
Firms may struggle to staff a recovery, because new licenses are not keeping pace with retirements and job changes. The Bureau of Labor Statistics expects about 6,900 architect openings a year from 2025 to 2035. Just under 3,500 architects earned a license in 2025, Building Enclosure reported from NCARB data. Practices that cannot add licensed staff must turn down work or rely on overtime, which raises costs for owners and slows design schedules.
Structural surprises raise risk in conversion projects
Older buildings can hide structural problems that add cost, delay and liability for the design team. On July 7, 2026, two columns appeared to buckle at 235 East 42nd Street in Manhattan, the former Pfizer tower under conversion, and nearby buildings and streets were evacuated, Boston.com reported. City engineers then had to plan emergency reinforcement of the tower floor by floor. Insurers and owners are likely to demand deeper surveys before conversion design begins, which lengthens early phases.
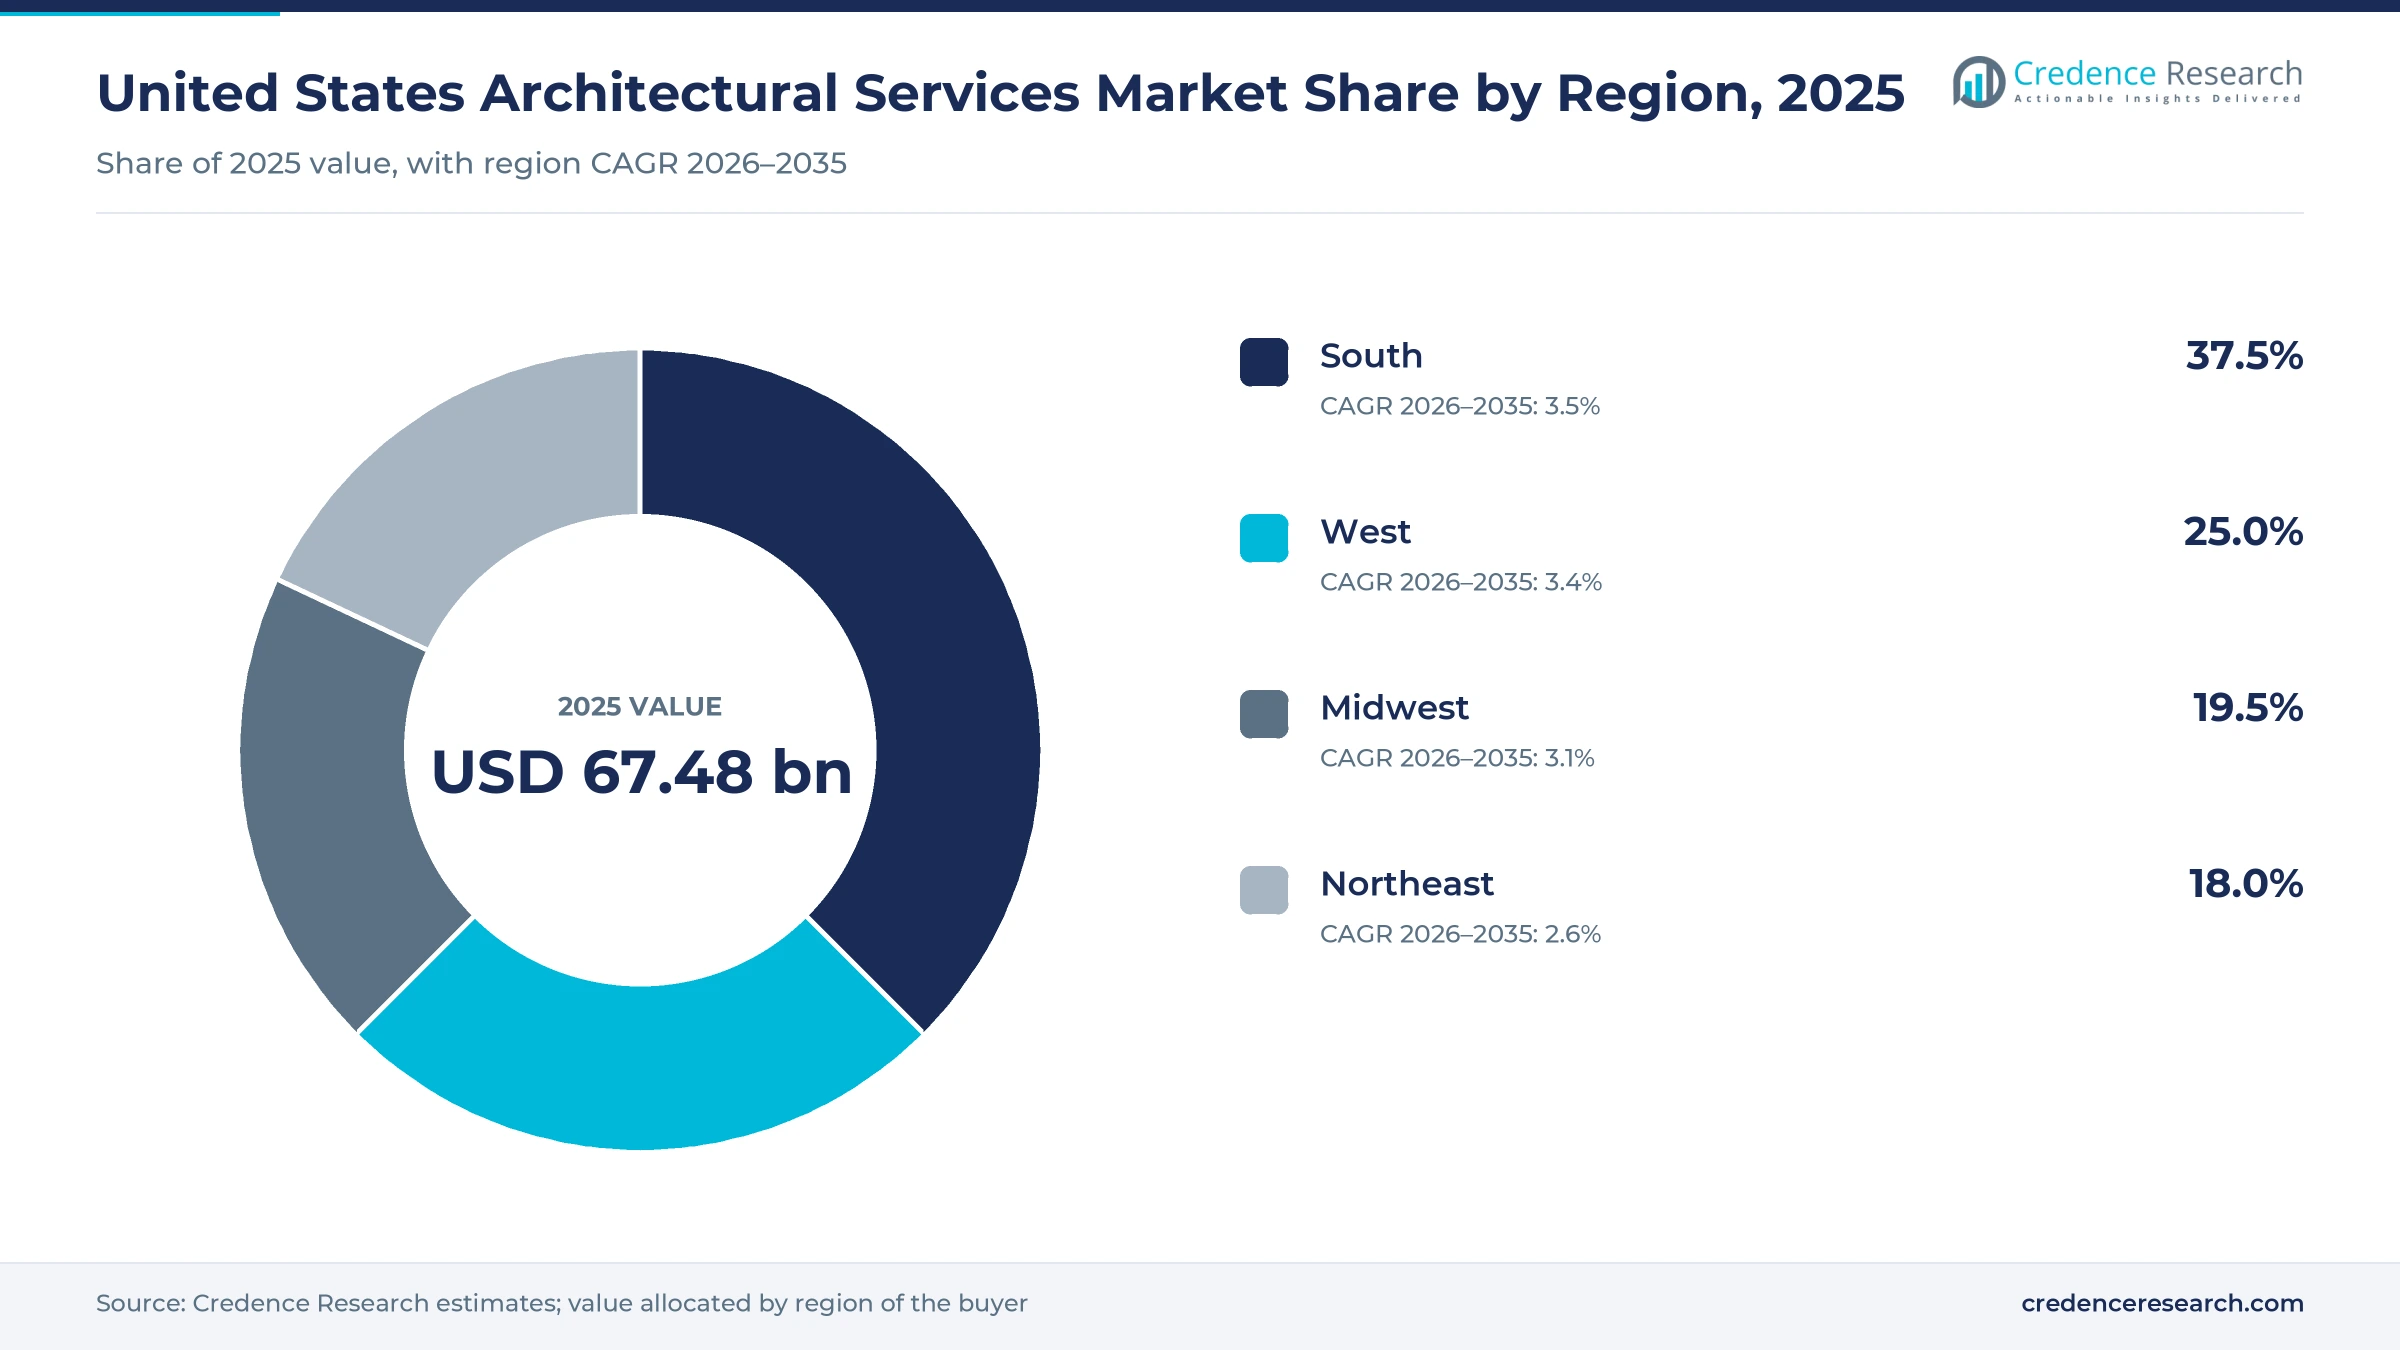
The South leads as Texas bonds and data halls add work
| Region | Value, 2025 (USD billion) | Share, 2025 | CAGR, 2026–2035 |
|---|---|---|---|
| South | 25.30 | 37.5% | 3.5% |
| West | 16.87 | 25.0% | 3.4% |
| Midwest | 13.16 | 19.5% | 3.1% |
| Northeast | 12.15 | 18.0% | 2.6% |
South leads on Texas bonds and data center campuses
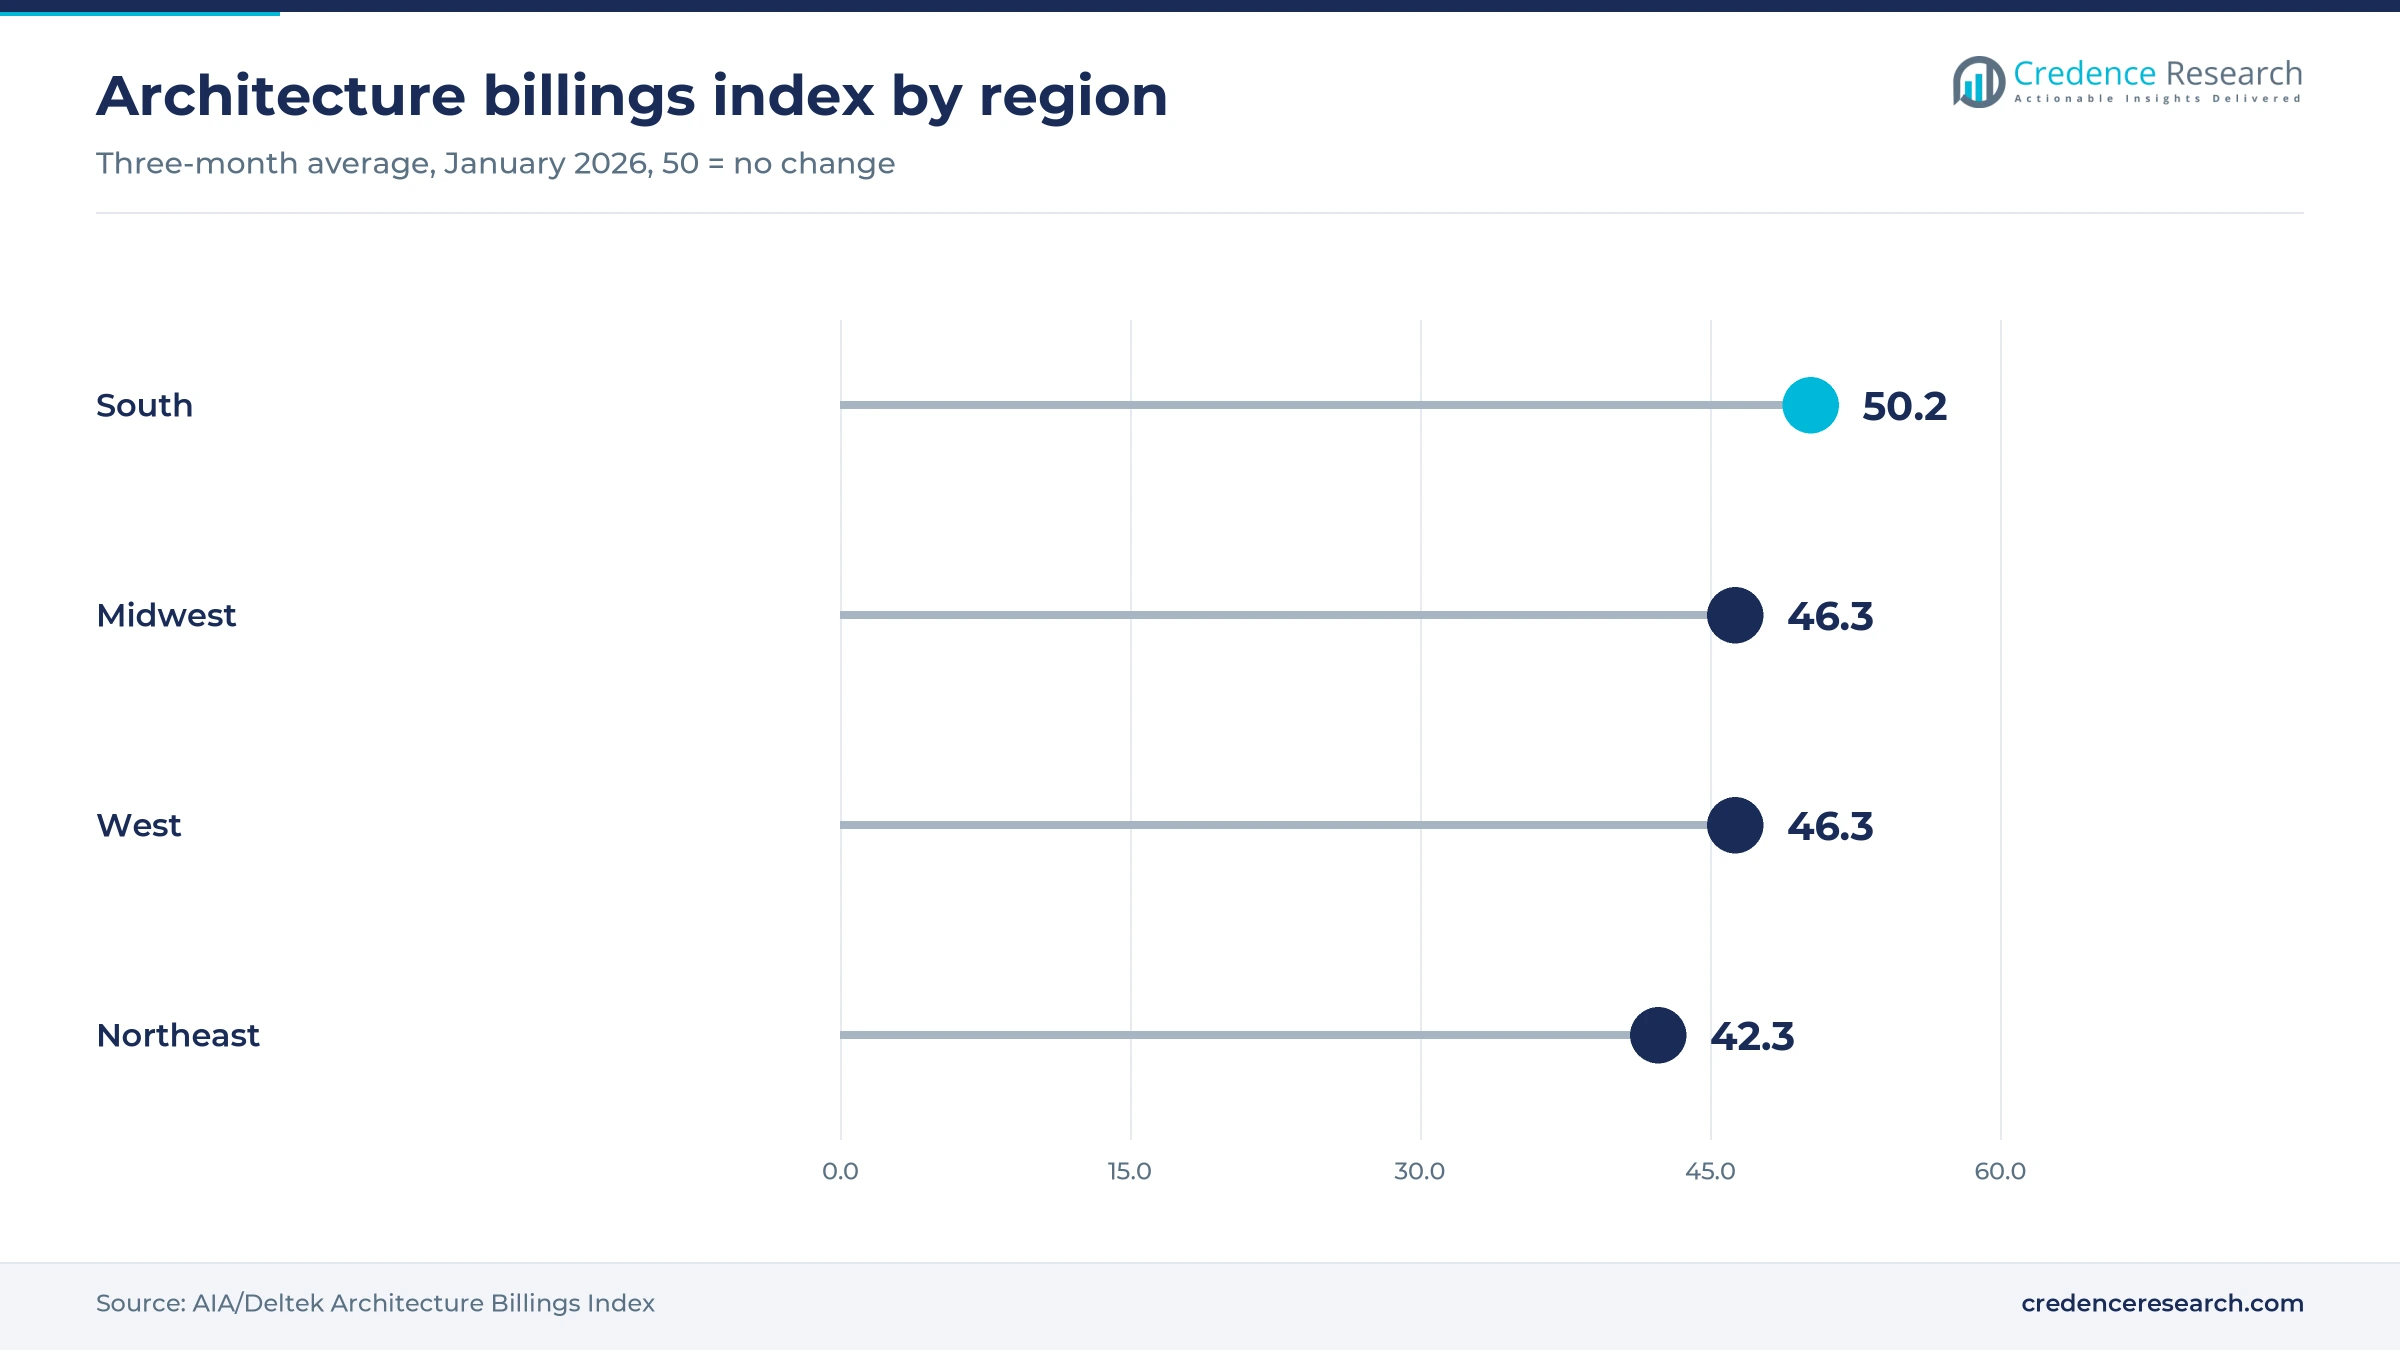
The South held 37.5% of 2025 value and grows at 3.5% a year, the largest base and the fastest pace. It was the only region where billings held steady in the three months to January 2026, with an index of 50.2, according to AIA. Texas municipalities and school districts put about $7 billion of bonds to voters in November 2025, including nearly $2 billion from Lamar Consolidated ISD for seven new elementary schools. Dallas is also home to Corgan, the top-ranked data center architect, so much of that specialist design work stays inside the region.
West gains as inquiries recover and terminals expand
The West held 25.0% of 2025 value and grows at 3.4% a year. Its three-month billings index reached 50.6 in March 2026, the highest of the four regions, Building Design and Construction reported from AIA data. Los Angeles had roughly 4,300 office-to-apartment conversion units in the pipeline at the start of 2026. Airport terminal grants and public school programs keep civic work flowing, while private office work in the coastal cities stays weak until financing eases.
Midwest recovers on venues, airports and reuse
The Midwest held 19.5% of 2025 value and grows at 3.1% a year, slightly below the national pace. Midwest firms saw billings rise for four straight months through December 2025, AIA chief economist Kermit Baker said. Chicago had roughly 4,300 conversion units in the pipeline, and an early task order under the FAA contract noted above went to Chicago Rockford International Airport. HOK now uses Detroit as its hub for sports work in the Upper Midwest.
Northeast relies on conversions and institutions
The Northeast's share of 2025 value was 18.0%, and the region grows at 2.6% a year, the slowest of the four. Its billings index was the weakest at 42.3 in January 2026, according to AIA. New York City led the national conversion pipeline with 16,358 units at the start of 2026, Bisnow reported. Hospitals, universities and transit agencies supply most other fees, which steadies the region while private office work stays weak.
Mergers, federal contracts and venue openings in 2025-26
| Development | Status and market relevance |
|---|---|
| In June 2026, Populous saw the new Highmark Stadium it designed for the Buffalo Bills open in Orchard Park, New York. | Completes one of the largest venue commissions of the decade |
| In July 2026, Jacobs won a multiyear architecture and engineering task order contract from NAVFAC Washington. | Covers Navy and Marine Corps installations in the capital region |
| In April 2026, HOK acquired ROSSETTI, a Detroit-based sports and entertainment design firm. | Rebuilds HOK's venue practice and adds a Midwest hub |
| In December 2025, AECOM won a 10-year FAA architecture and engineering contract with a ceiling above $270 million. | Adds control tower and radar facility design work |
| In August 2025, Stantec closed its acquisition of Page, a U.S. design, architecture and engineering firm. | Makes Stantec one of the largest U.S. architecture practices |
Digital delivery tools change how design hours are sold
- Building information modeling gives owners a shared model for clash detection, cost checks, scheduling and facility management after handover.
- Energy and daylight simulation lets teams test envelope and system choices early, which matters for code compliance and owner targets.
- Generative and AI-assisted design tools speed up massing studies, code checks and documentation, which can shift pricing from hours toward the value of the outcome.
- Reality capture and laser scanning record existing conditions quickly and accurately, which reduces structural and schedule risk in renovation and conversion projects.
Need a Custom Version of This Report?
Tailor the scope, geography, or segments to your exact requirements.
- Custom geography or segment scope
- Direct access to our analyst team
Scale firms win on sector depth and integrated teams
Competition in the United States turns on sector depth, integrated teams and the ability to staff large projects across states. Gensler leads in large conversions, including the former Pfizer headquarters discussed above, where structural and code work decide the fee. Corgan, HDR, Gensler, Stantec, AECOM and HKS were among the top firms in the Building Design and Construction ranking of data center architecture firms in October 2025, which shows how specialist experience decides mission-critical commissions. Stantec, Jacobs, AECOM and HDR combine design with engineering and program management, which suits federal and aviation contracts. HOK, Perkins&Will and HKS use acquisitions to add sectors and cities, while Populous concentrates on stadiums and arenas. Price matters most in small and medium commissions where many local studios can bid. In large public work, qualifications-based selection and prior project records usually decide the shortlist before fees are discussed.
Thousands of small studios and a few national groups
The supply side is split between many small studios and a few national groups with engineering capacity. More than 19,000 architecture firms operate in the United States, and about 75% employ fewer than 10 people, according to the AIA Firm Survey. National practices compete on sector depth, licensed staff in many states and in-house engineering, while small studios win local residential and renovation work. Entry barriers are low for small commissions but high for hospitals, data centers and airports, where owners demand prior projects and coordinated building information modeling files. Margins in U.S. architectural services therefore sit with sector specialists rather than generalist studios.
Companies profiled and their roles in this market
| Company | Type | Role in the market |
|---|---|---|
| Gensler | Design firm | Design architect and architect of record for the Pfizer headquarters conversion in Manhattan |
| Corgan | Architecture firm, Dallas | Top-ranked data center architect with more than 1,400 staff |
| Stantec | Design and engineering group | Owner of Page since August 2025, health, science and mission-critical work |
| HDR | Architecture and engineering firm | Among leading data center architecture firms in the BD+C ranking, October 2025 |
| Jacobs | Engineering and design group | Federal installation design for NAVFAC Washington from July 2026 |
| AECOM | Infrastructure and design group | FAA nationwide design contract for towers and radar facilities |
| HOK | Design firm | Sports and entertainment practice expanded through ROSSETTI in April 2026 |
| Perkins&Will | Design firm | Merged with Architecture Plus Information in New York in September 2025 |
| HKS | Architecture firm | Among leading data center architecture firms in the BD+C ranking, October 2025 |
| Populous | Venue design firm | Designer of the new Highmark Stadium opened in June 2026 |
A slow recovery that favors specialists and public work
Credence Research's view is that U.S. architectural services fees will recover slowly and unevenly, at a 3.25% CAGR to 2035. Institutional owners and data center developers keep backlogs alive, while private office and manufacturing work stays soft until financing eases. Firms with specialist sector teams, integrated engineering and federal contract vehicles are best placed, because they can move staff to the sectors still spending. Renovation and conversion work will stay close to half of billings, which rewards practices skilled in existing-building surveys and phasing. Architectural design services still hold 52.0% of 2025 value, so design hours remain the core of the business.
Census revenue, fee rates and spending anchor the model
The report uses 2025 as the base year and forecasts to 2035 in current U.S. dollars. Market values come from the Credence Research model, which starts from Census Bureau Service Annual Survey and Quarterly Services Survey revenue for architectural and related services and adds interior design, planning and management fees billed by design firms. The model is checked against construction spending by building type and published billing rates. Regional shares follow the Credence Research regional model, informed by AIA regional billings and construction activity. Segment splits are Credence Research estimates from AIA, Census and company sources. No primary interviews or surveys were used in building the architectural services estimates.
Data centers and public programs decide the upper case
Through 2035, U.S. architectural services spending is likely to grow in two phases, reaching USD 93.14 billion by 2035. The next two years stay slow, as delayed private projects wait for cheaper financing and design contracts remain below growth levels. From 2027, institutional programs, data centers and conversions should lift billings more broadly. Industrial facilities, the fastest-growing end use at 4.5% a year, gain most from mission-critical construction, while public owners add steady demand through bonds and federal programs. Consolidation is likely to continue as large practices buy specialists to secure sector experience and licensed staff.
Office recovery and data center pace set the range
The range of outcomes depends on how quickly delayed private projects return and whether data center construction keeps its current pace. A downside case reflects longer financing delays, a sharp slowdown in data center starts and tighter public budgets. The upside requires billings to move above 50 in 2027, conversion pipelines to turn into construction and steady school and hospital bond approvals.
| Scenario | CAGR, 2026–2035 | Value, 2035 | What has to hold |
|---|---|---|---|
| Downside | 2.0% | USD 83.83 billion | Financing delays persist, data center starts slow and public bond approvals weaken |
| Base | 3.25% | USD 93.14 billion | Institutional programs hold and private work recovers gradually from 2027 |
| Upside | 4.2% | USD 101.57 billion | Billings return to growth in 2027 and conversion pipelines move into construction |
Frequently Asked Questions
How big is the United States architectural services market?
Which region leads the U.S. market?
Which service type holds the largest share?
How important is renovation work for architecture firms?
Why do data centers matter for design demand?
What do architecture firms charge per hour?
What limits growth in the U.S. market?
Which companies lead the U.S. architectural services market?
Table of Content
Chapter 1 Market Segmentation
- 1.1 Segmentation Framework
- 1.1.1 Product and Service Classification
- 1.1.2 Application and End-Use Classification
- 1.1.3 Technology and Solution Classification
- 1.1.4 Customer and Distribution Channel Classification
- 1.1.5 Geographic Segmentation
- 1.1.6 Market Segment Definitions and Boundaries
- 1.2 By Service Type
- 1.2.1 Architectural Design Services
- 1.2.2 Construction and Project Management
- 1.2.3 Embedded Engineering Services
- 1.2.4 Interior Design Services
- 1.2.5 Urban Planning and Advisory
- 1.3 By End-Use Industry
- 1.3.1 Institutional Facilities
- 1.3.2 Commercial Properties
- 1.3.3 Residential Buildings
- 1.3.4 Industrial Facilities
- 1.3.5 Civic and Transport Facilities
- 1.4 By Customer Type
- 1.4.1 Private Commercial Owners
- 1.4.2 Public Owners
- 1.4.3 Nonprofit Institutional Owners
- 1.4.4 Individual Residential Clients
- 1.5 By Revenue Model
- 1.5.1 Fixed-Fee Project Contracts
- 1.5.2 Time-Based Service Contracts
- 1.5.3 Portfolio and Retainer Contracts
Chapter 2 Introduction
- 2.1 Report Objectives and Scope
- 2.2 Product Definition and Industry Terminology
- 2.3 Market Inclusions and Exclusions
- 2.4 Research Process
- 2.4.1 Primary Research and Expert Interviews
- 2.4.2 Secondary Research and Source Review
- 2.4.3 Top-Down and Bottom-Up Estimation
- 2.4.4 Data Triangulation and Verification
- 2.5 Market Size Measurement Basis
- 2.5.1 2025: USD 67.48 billion → 2035: USD 93.14 billion
- 2.6 Historical and Forecast Reference Periods
- 2.6.1 Historical Period: 2018-2025
- 2.6.2 Base Year: 2025
- 2.6.3 Forecast Period: 2025-2035
- 2.7 Research Assumptions and Limitations
Chapter 3 Executive Summary
- 3.1 Market Snapshot and Key Findings
- 3.2 Base-Year Market Size, 2025
- 3.3 Forecast Market Size, 2035
- 3.4 Revenue and Volume Growth Outlook
- 3.5 Key Demand and Supply Indicators
- 3.6 Leading Market Segments
- 3.7 Fastest-Growing Market Opportunities
- 3.8 Regional Performance Highlights
- 3.9 Technology and Industry Transformation
- 3.10 Competitive Landscape Summary
- 3.11 Analyst View and Strategic Implications
Chapter 4 United States Architectural Services Market Trends and Developments
- 4.1 Historical Industry Development, 2018-2025
- 4.2 Recent Market Trends and Developments
- 4.3 Demand and Customer Behavior Trends
- 4.4 Technology and Product Innovation
- 4.5 Artificial Intelligence, Automation and Digitalization
- 4.6 Local Manufacturing and Supply Chain Realignment
- 4.7 Industry Partnerships, Mergers and Acquisitions
- 4.8 Sustainability and Circular Economy Developments
- 4.9 Government and Private Sector Investment Trends
- 4.10 Emerging Business Models and Commercialization
- 4.11 Industry Developments and Announcements
Chapter 5 United States Architectural Services Market Supply and Demand Analysis
- 5.1 Demand Trend and Consumption Analysis, 2018-2025
- 5.2 Demand Forecast, 2025-2035
- 5.3 Supply Chain Structure and Procurement Trends
- 5.4 Supply-Demand Gap and Bottlenecks
- 5.5 Import Dependence and Sourcing Structure
- 5.6 Regional Supply and Demand Concentration
Chapter 6 United States Architectural Services Market Pricing Analysis
- 6.1 Pricing Structure and Measurement
- 6.2 Historical Pricing Trends, 2018-2025
- 6.3 Pricing Outlook, 2025-2035
- 6.4 Pricing by Product and Market Segment
- 6.5 Geographic Pricing Differences
- 6.6 Key Input, Energy, Labor and Logistics Costs
- 6.7 Contract Pricing and Purchasing Models
- 6.8 Pricing Sensitivity and Competitive Positioning
- 6.9 Price, Margin and Profitability Implications
Chapter 7 United States Architectural Services Market Dynamics
- 7.1 Market Growth Drivers
- 7.1.1 Demand-Side Drivers
- 7.1.2 Technology and Innovation Drivers
- 7.1.3 Infrastructure and Investment Drivers
- 7.1.4 Regulatory and Policy Drivers
- 7.2 Market Restraints
- 7.2.1 Cost and Affordability Constraints
- 7.2.2 Technology and Adoption Barriers
- 7.2.3 Supply Chain and Operational Constraints
- 7.3 Market Challenges
- 7.3.1 Competitive Pressure and Margin Erosion
- 7.3.2 Skills, Infrastructure and Implementation Gaps
- 7.4 Emerging Market Opportunities
- 7.5 Market Dynamics Impact and Time-Horizon Assessment
Chapter 8 United States Architectural Services Value Chain Analysis
- 8.1 Industry Value Chain Overview
- 8.2 Upstream Suppliers and Critical Inputs
- 8.3 Technology and Component Providers
- 8.4 Manufacturing or Service Delivery
- 8.5 Distribution, Channel Partners and Integrators
- 8.6 Downstream Applications and End Users
- 8.7 Value Addition and Profit Pools
- 8.8 Vertical Integration and Outsourcing
- 8.9 Supplier Concentration and Risk
- 8.10 Supply Chain Localization and Resilience
Chapter 9 United States Architectural Services Market Regulations and Policies
- 9.1 Relevant Laws, Standards and Compliance Frameworks
- 9.2 Product, Service, Safety and Quality Requirements
- 9.3 Government Policies, Incentives and Subsidies
- 9.4 Imports, Exports and Trade Barriers
- 9.5 Public Procurement and Local Content Requirements
- 9.6 Data Protection, AI and Cybersecurity Compliance
- 9.7 Upcoming Policy Changes and Market Implications
Chapter 10 United States Architectural Services Market Hotspots and Opportunities
- 10.1 Market Opportunity Mapping and Growth Hotspots
- 10.2 High-Growth Applications and Customer Groups
- 10.3 Underserved Markets and White-Space Opportunities
- 10.4 Emerging Technology and Product Opportunities
- 10.5 New Capacity and Investment Hotspots
- 10.6 Market Entry and Expansion Opportunities
- 10.7 Distribution and Partnership Opportunities
- 10.8 Near-Term and Long-Term Commercial Potential
- 10.9 Opportunity Attractiveness and Execution Risks
Chapter 11 United States Architectural Services Market Outlook, 2025-2035
- 11.1 Market Size and Analysis
- 11.1.1 Revenue (Market Measurement: 2025: USD 67.48 billion → 2035: USD 93.14 billion)
- 11.1.2 Historical Market Size, 2018-2025
- 11.1.3 Base-Year Market Size, 2025
- 11.2 Market Forecast, 2025-2035
- 11.2.1 Revenue Forecast to 2035
- 11.2.2 CAGR and Year-on-Year Growth
- 11.2.3 Incremental Revenue Opportunity
- 11.3 Forecast Assumptions and Scenario Analysis
- 11.3.1 Base-Case Forecast
- 11.3.2 Optimistic and Conservative Scenarios
- 11.3.3 Technology, Pricing and Policy Sensitivities
- 11.4 Market Attractiveness and Growth Outlook
Chapter 12 United States Architectural Services Market Segmentation and Outlook
- 12.1 Segmentation Summary and Market Shares, 2025
- 12.2 Largest and Fastest-Growing Segments
- 12.3 By Service Type - Market Size and Forecast, 2025-2035
- 12.3.1 Segment Definition and Scope
- 12.3.2 Historical Market Size, 2018-2025
- 12.3.3 Revenue Forecast, 2025-2035
- 12.3.4 Base-Year Market Share, 2025
- 12.3.5 Segment CAGR and Growth Drivers
- 12.3.6 Subsegment Market Size and Forecast
- 12.3.6.1 Architectural Design Services
- 12.3.6.2 Construction and Project Management
- 12.3.6.3 Embedded Engineering Services
- 12.3.6.4 Interior Design Services
- 12.3.6.5 Urban Planning and Advisory
- 12.3.7 Subsegment Pricing and Adoption Trends
- 12.3.8 Leading Suppliers and Competition
- 12.3.9 Regional Demand and Opportunities
- 12.4 By End-Use Industry - Market Size and Forecast, 2025-2035
- 12.4.1 Segment Definition and Scope
- 12.4.2 Historical Market Size, 2018-2025
- 12.4.3 Revenue Forecast, 2025-2035
- 12.4.4 Base-Year Market Share, 2025
- 12.4.5 Segment CAGR and Growth Drivers
- 12.4.6 Subsegment Market Size and Forecast
- 12.4.6.1 Institutional Facilities
- 12.4.6.2 Commercial Properties
- 12.4.6.3 Residential Buildings
- 12.4.6.4 Industrial Facilities
- 12.4.6.5 Civic and Transport Facilities
- 12.4.7 Subsegment Pricing and Adoption Trends
- 12.4.8 Leading Suppliers and Competition
- 12.4.9 Regional Demand and Opportunities
- 12.5 By Customer Type - Market Size and Forecast, 2025-2035
- 12.5.1 Segment Definition and Scope
- 12.5.2 Historical Market Size, 2018-2025
- 12.5.3 Revenue Forecast, 2025-2035
- 12.5.4 Base-Year Market Share, 2025
- 12.5.5 Segment CAGR and Growth Drivers
- 12.5.6 Subsegment Market Size and Forecast
- 12.5.6.1 Private Commercial Owners
- 12.5.6.2 Public Owners
- 12.5.6.3 Nonprofit Institutional Owners
- 12.5.6.4 Individual Residential Clients
- 12.5.7 Subsegment Pricing and Adoption Trends
- 12.5.8 Leading Suppliers and Competition
- 12.5.9 Regional Demand and Opportunities
- 12.6 By Revenue Model - Market Size and Forecast, 2025-2035
- 12.6.1 Segment Definition and Scope
- 12.6.2 Historical Market Size, 2018-2025
- 12.6.3 Revenue Forecast, 2025-2035
- 12.6.4 Base-Year Market Share, 2025
- 12.6.5 Segment CAGR and Growth Drivers
- 12.6.6 Subsegment Market Size and Forecast
- 12.6.6.1 Fixed-Fee Project Contracts
- 12.6.6.2 Time-Based Service Contracts
- 12.6.6.3 Portfolio and Retainer Contracts
- 12.6.7 Subsegment Pricing and Adoption Trends
- 12.6.8 Leading Suppliers and Competition
- 12.6.9 Regional Demand and Opportunities
- 12.7 Segment Growth Comparison
- 12.8 Segment Attractiveness and Priority Matrix
Chapter 13 United States Architectural Services End-Use and Application Market Outlook
- 13.1 End-Use Industry and Customer Demand Structure
- 13.2 Leading Applications and Customer Groups
- 13.3 End-Use Market Size, Share and Forecast
- 13.4 Major End-Use Industry Deep Dives
- 13.4.1 Customer Requirements and Use Cases
- 13.4.2 Demand and Replacement Cycles
- 13.4.3 Technical and Regulatory Considerations
- 13.4.4 Purchasing and Procurement Models
- 13.4.5 Leading Vendors and Distribution Channels
- 13.4.6 Forecast and Commercial Opportunities
- 13.5 Emerging Applications and Cross-Segment Demand
- 13.6 End-Use Industry Investment Priorities
Chapter 14 United States Architectural Services Geographic Market Outlook, 2025-2035
- 14.1 Domestic Market Distribution and Demand Clusters
- 14.2 State- or Province-Wise Market Size and Forecast, 2025-2035
- 14.3 City and Metropolitan Market Outlook
- 14.4 Industrial, Manufacturing and Commercial Clusters
- 14.5 Geographic Concentration of Key End Users
- 14.6 Local Pricing and Purchasing Differences
- 14.7 Domestic Production Facilities and Capacity Map
- 14.8 Local Infrastructure and Project Pipeline
- 14.9 State-Level Policy and Incentive Differences
- 14.10 Subnational Investment Hotspots and Opportunities
- 14.11 Distribution and Logistics Networks
- 14.12 Domestic Competitive Footprint
Chapter 15 United States Architectural Services Technology, Innovation and Sustainability Outlook
- 15.1 Technology Landscape and Maturity
- 15.2 Product, Process and Service Innovation
- 15.3 AI, Automation and Digital Tools in the Industry
- 15.4 Technology Adoption and Performance Benchmarking
- 15.5 Innovation Pipeline and R&D Investment
- 15.6 Energy Efficiency and Resource Management
- 15.7 Sustainability, Recycling and Circularity
- 15.8 Technology Roadmap, 2025-2035
- 15.9 Risks of Obsolescence and Technology Substitution
Chapter 16 United States Architectural Services Market Key Strategic Imperatives
- 16.1 Growth and Market Entry Priorities
- 16.2 High-Return Products and Segments
- 16.3 Pricing, Profitability and Cost Optimization
- 16.4 Technology Investment and Product Differentiation
- 16.5 Supply Chain Localization and Resilience
- 16.6 Distribution and Customer Acquisition
- 16.7 Partnership, Acquisition and Capacity Strategy
- 16.8 Regional Expansion Priorities
- 16.9 Short-, Medium- and Long-Term Actions
Chapter 17 Competition Outlook
- 17.1 Industry Competition Characteristics
- 17.2 Market Structure and Concentration
- 17.3 Market Share and Competitive Positioning, 2025
- 17.4 Company-Wise Revenue and Product Benchmarking
- 17.5 Production and Service Capacity Benchmarking
- 17.6 Technology, Pricing and Differentiation
- 17.7 Regional Footprint and Distribution Strength
- 17.8 Mergers, Acquisitions and Strategic Alliances
- 17.9 New Entrants and Competitive Threats
- 17.10 Porter's Five Forces and Industry Attractiveness
- 17.11 Competitive Outlook, 2025-2035
Chapter 18 Company Profiles
- 18.1 Company Coverage and Selection Criteria
- 18.2 Gensler
- 18.2.1 Business Description
- 18.2.2 Company Ownership and Geographic Presence
- 18.2.3 Product and Service Portfolio
- 18.2.4 Manufacturing and Operating Footprint
- 18.2.5 Financial Performance and Investment
- 18.2.6 Market Share and Competitive Position
- 18.2.7 Technology and Innovation Capabilities
- 18.2.8 Strategic Alliances or Partnerships
- 18.2.9 Recent Developments
- 18.2.10 Growth Strategy and Outlook
- 18.3 Perkins&Will
- 18.4 HKS
- 18.5 Corgan
- 18.6 Stantec
- 18.7 HDR
- 18.8 Jacobs
- 18.9 HOK
- 18.10 AECOM
- 18.11 Populous
- 18.12 Other Relevant Market Participants
Note: Every listed company is profiled on the structure shown under the first company. The company list is preliminary and may change based on research findings, market developments, data availability and client requirements.
Chapter 19 Disclaimer
- 19.1 Research and Forecast Disclaimer
- 19.2 Data Source and Estimation Limitations
Note: The depth of individual sections depends on data availability for this market. Volume, capacity, trade and other unit-based metrics are included where applicable.

