
Mall, office and hotel pipelines set Philippine build demand
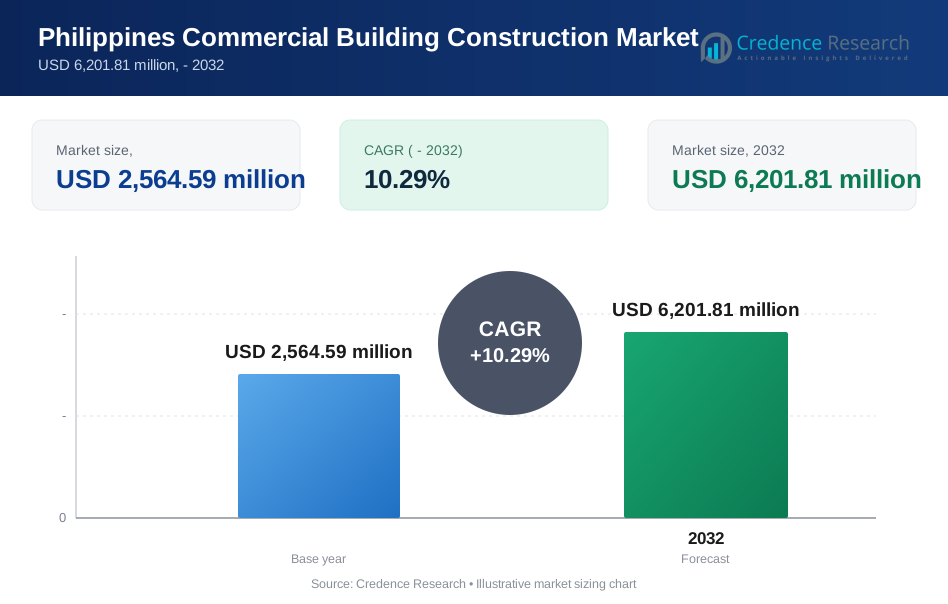
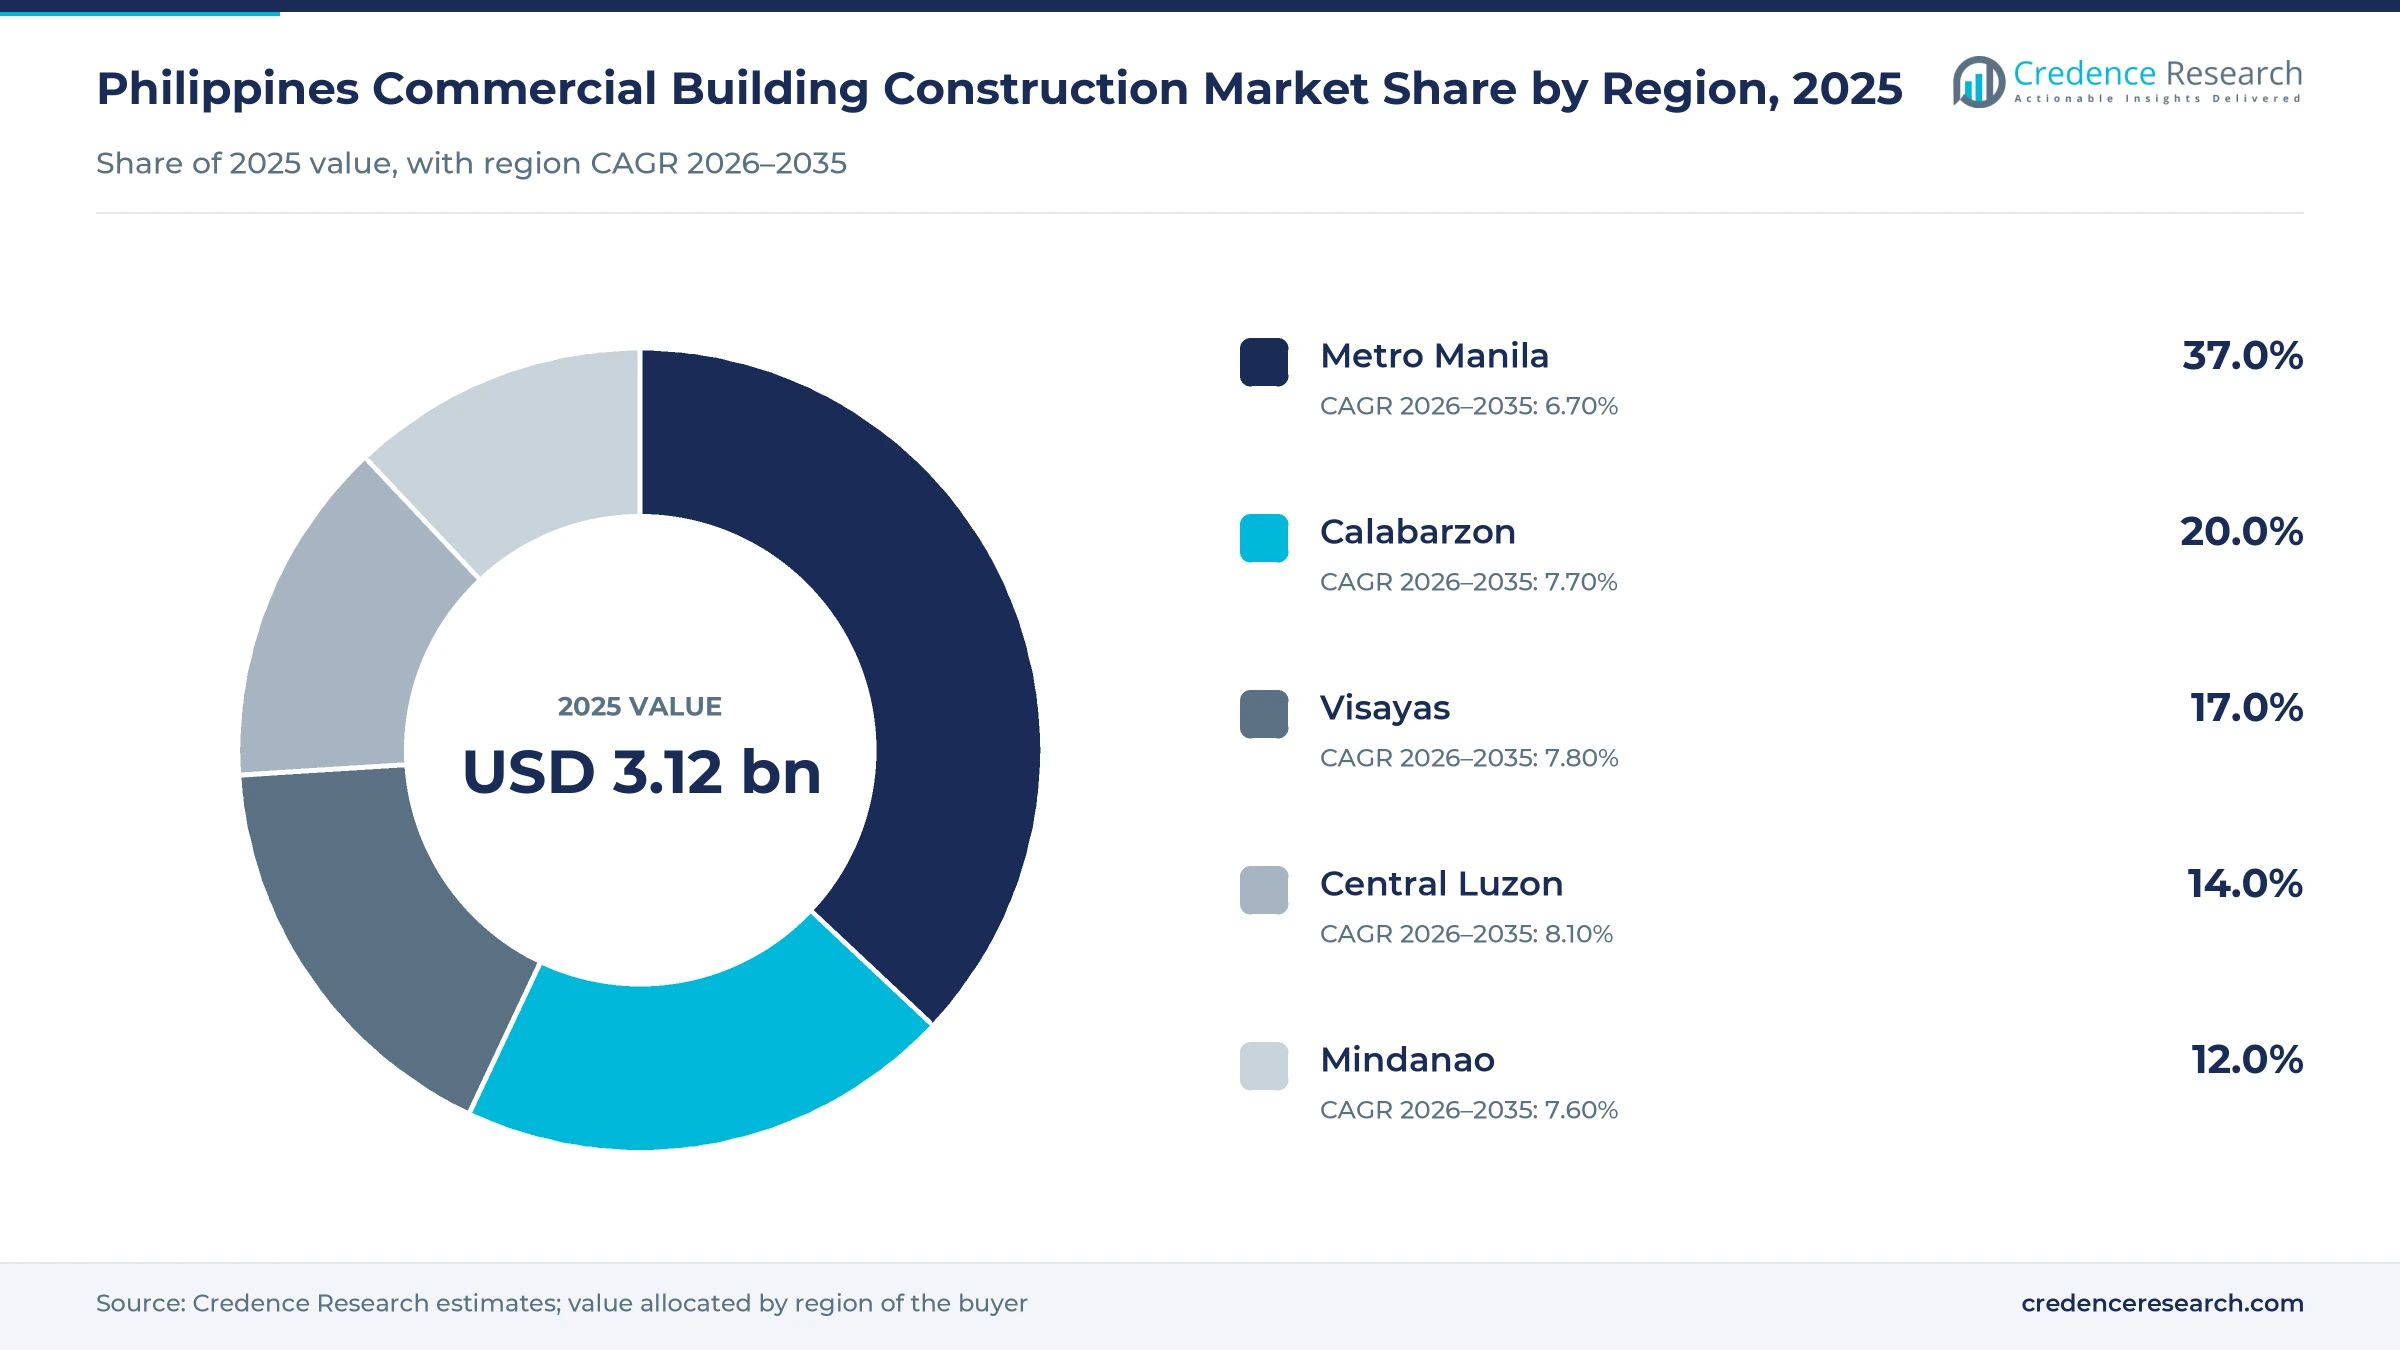
The Philippines commercial building construction market was valued at USD 3.12 billion in 2025 and is projected to increase from USD 3.35 billion in 2026 to USD 6.37 billion by 2035, registering a CAGR of 7.40% during 2026–2035. Demand comes from mall operators, office landlords, hotel owners, schools and hospitals that commission new buildings and refits across the country. Metro Manila held the largest regional share, 37.0% in 2025, because the capital still hosts the densest office districts and the largest mall estates. Central Luzon is the fastest-growing region at 8.10% a year, as Clark, Pampanga and Bulacan townships draw new offices, malls and hotels. The main commercial change is a shift of developer budgets toward provincial townships and the redevelopment of older malls, while public building work slowed sharply in late 2025 after a flood control spending scandal delayed approvals and payments. Private permit data show non-residential value rising again in early 2026.
What does commercial building construction in the Philippines cover?
The report counts the value of construction work put in place for offices, shopping malls, retail strips, hotels, schools, hospitals and other non-residential buildings, including the materials, labor and contractor margins billed to the owner. Owners usually buy this work through general contracts, design and build packages or separate fit-out contracts awarded after the shell is complete.
Residential towers, houses, factories, warehouses, roads, bridges and flood control works are excluded, as is the purchase of land. The value chain runs from cement, steel, glass and precast suppliers through general contractors and specialist trades to developers, tenants and public agencies that occupy or operate the finished buildings.
Philippines Commercial Building Construction Market Insights
- The market reached USD 3.12 billion in 2025 and should reach USD 6.37 billion by 2035, growing at a 7.40% CAGR during 2026–2035 as provincial pipelines expand.
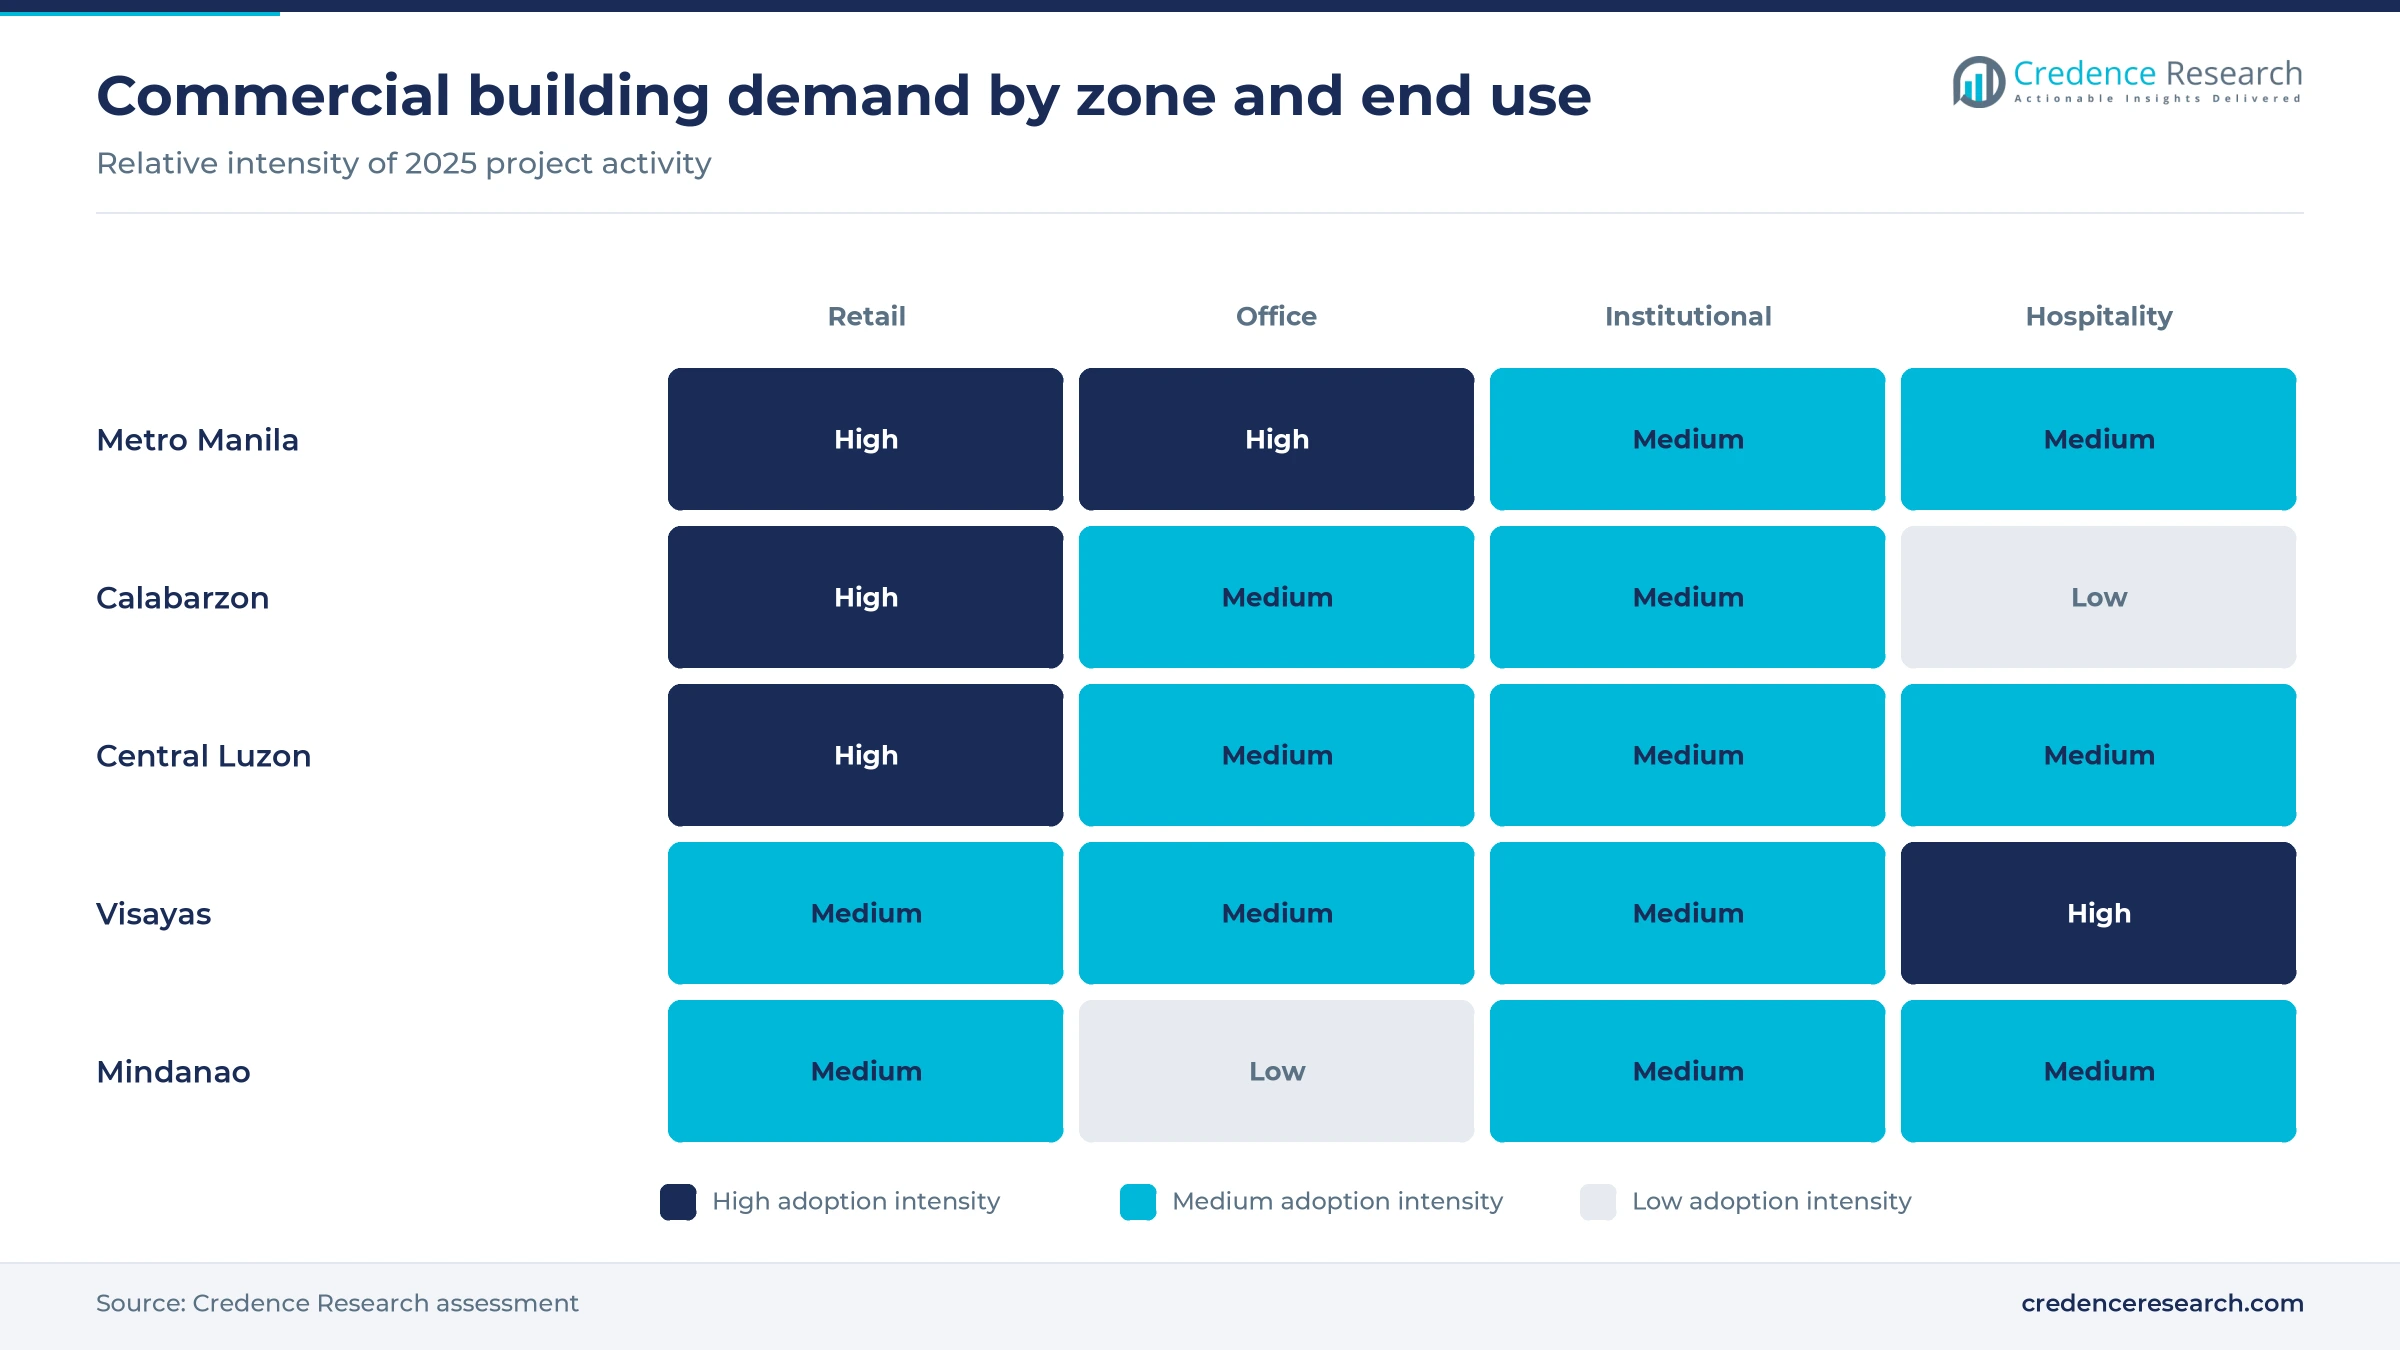
- Metro Manila held 37.0% of national value in 2025, ahead of Calabarzon at 20.0%, because the capital holds the main office districts and mall estates.
- Cement led materials with 22.0% of 2025 value, while retail construction led end uses with 31.0% because mall operators run the largest annual building budgets.
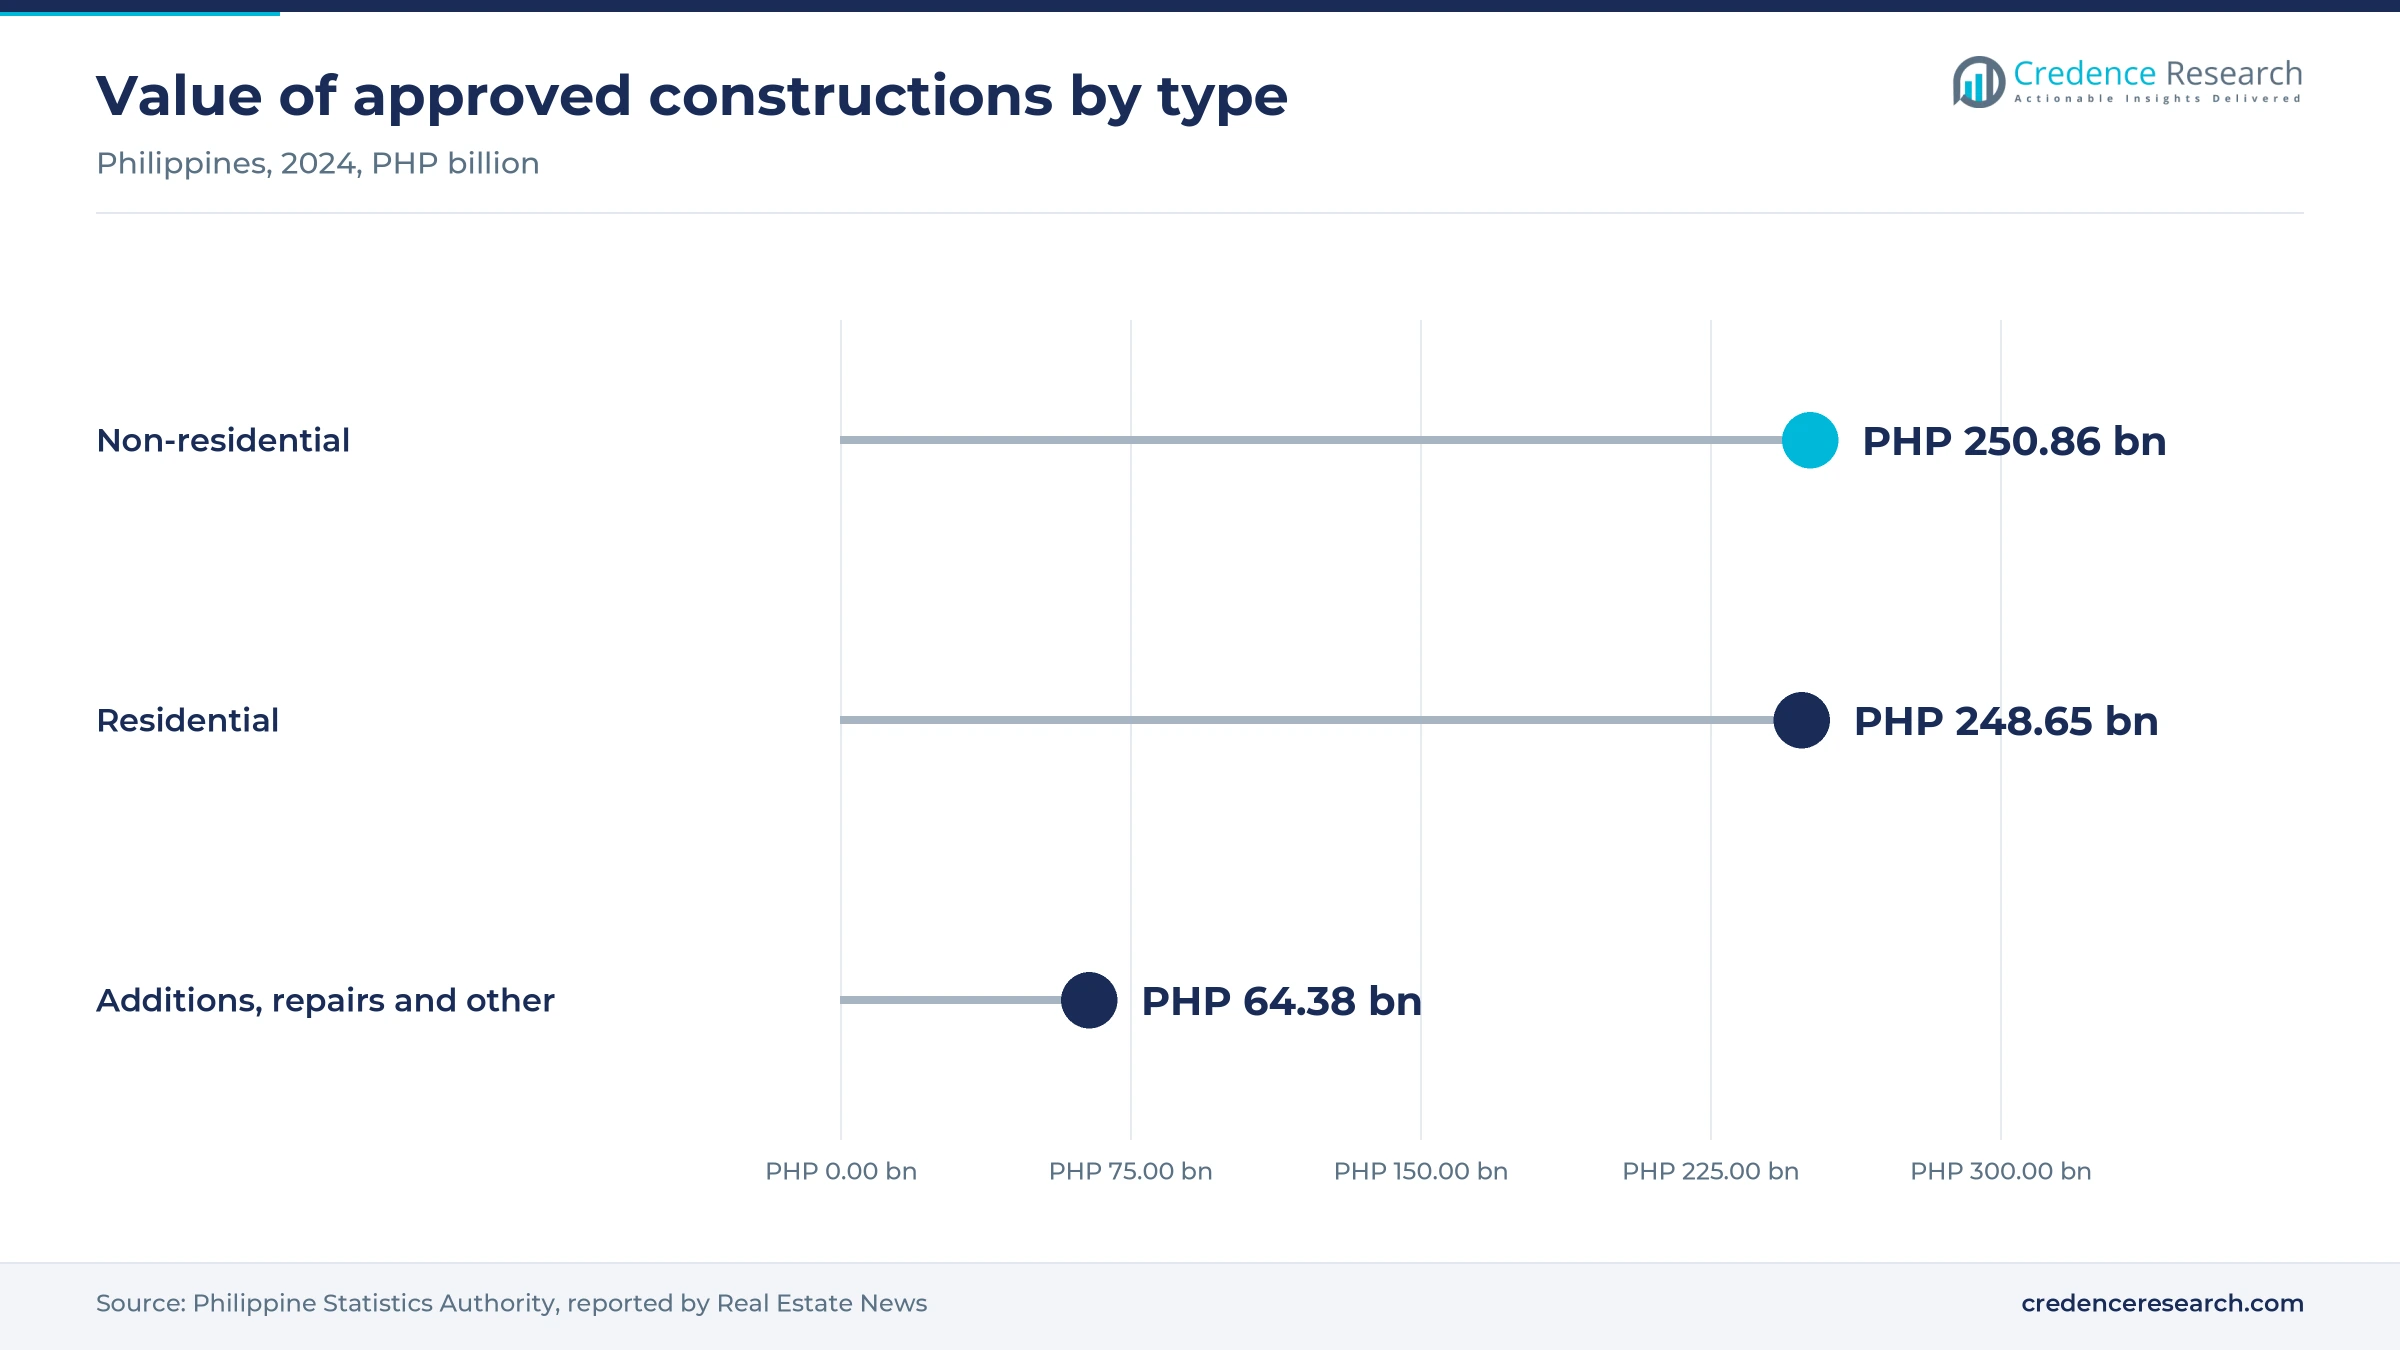
- The PSA counted 39,238 non-residential constructions in 2024, up 9.7%, and commercial buildings made up 68.9% of that count, showing how much private permits rely on shops and offices.
- Listed developers keep spending, as SM Prime set a PHP 100 billion capex budget for 2026 and Robinsons Land lined up 25 mall projects for 2025 to 2030.
Cement and retail projects carry the largest share of value
Why does cement take the largest share of material spending?
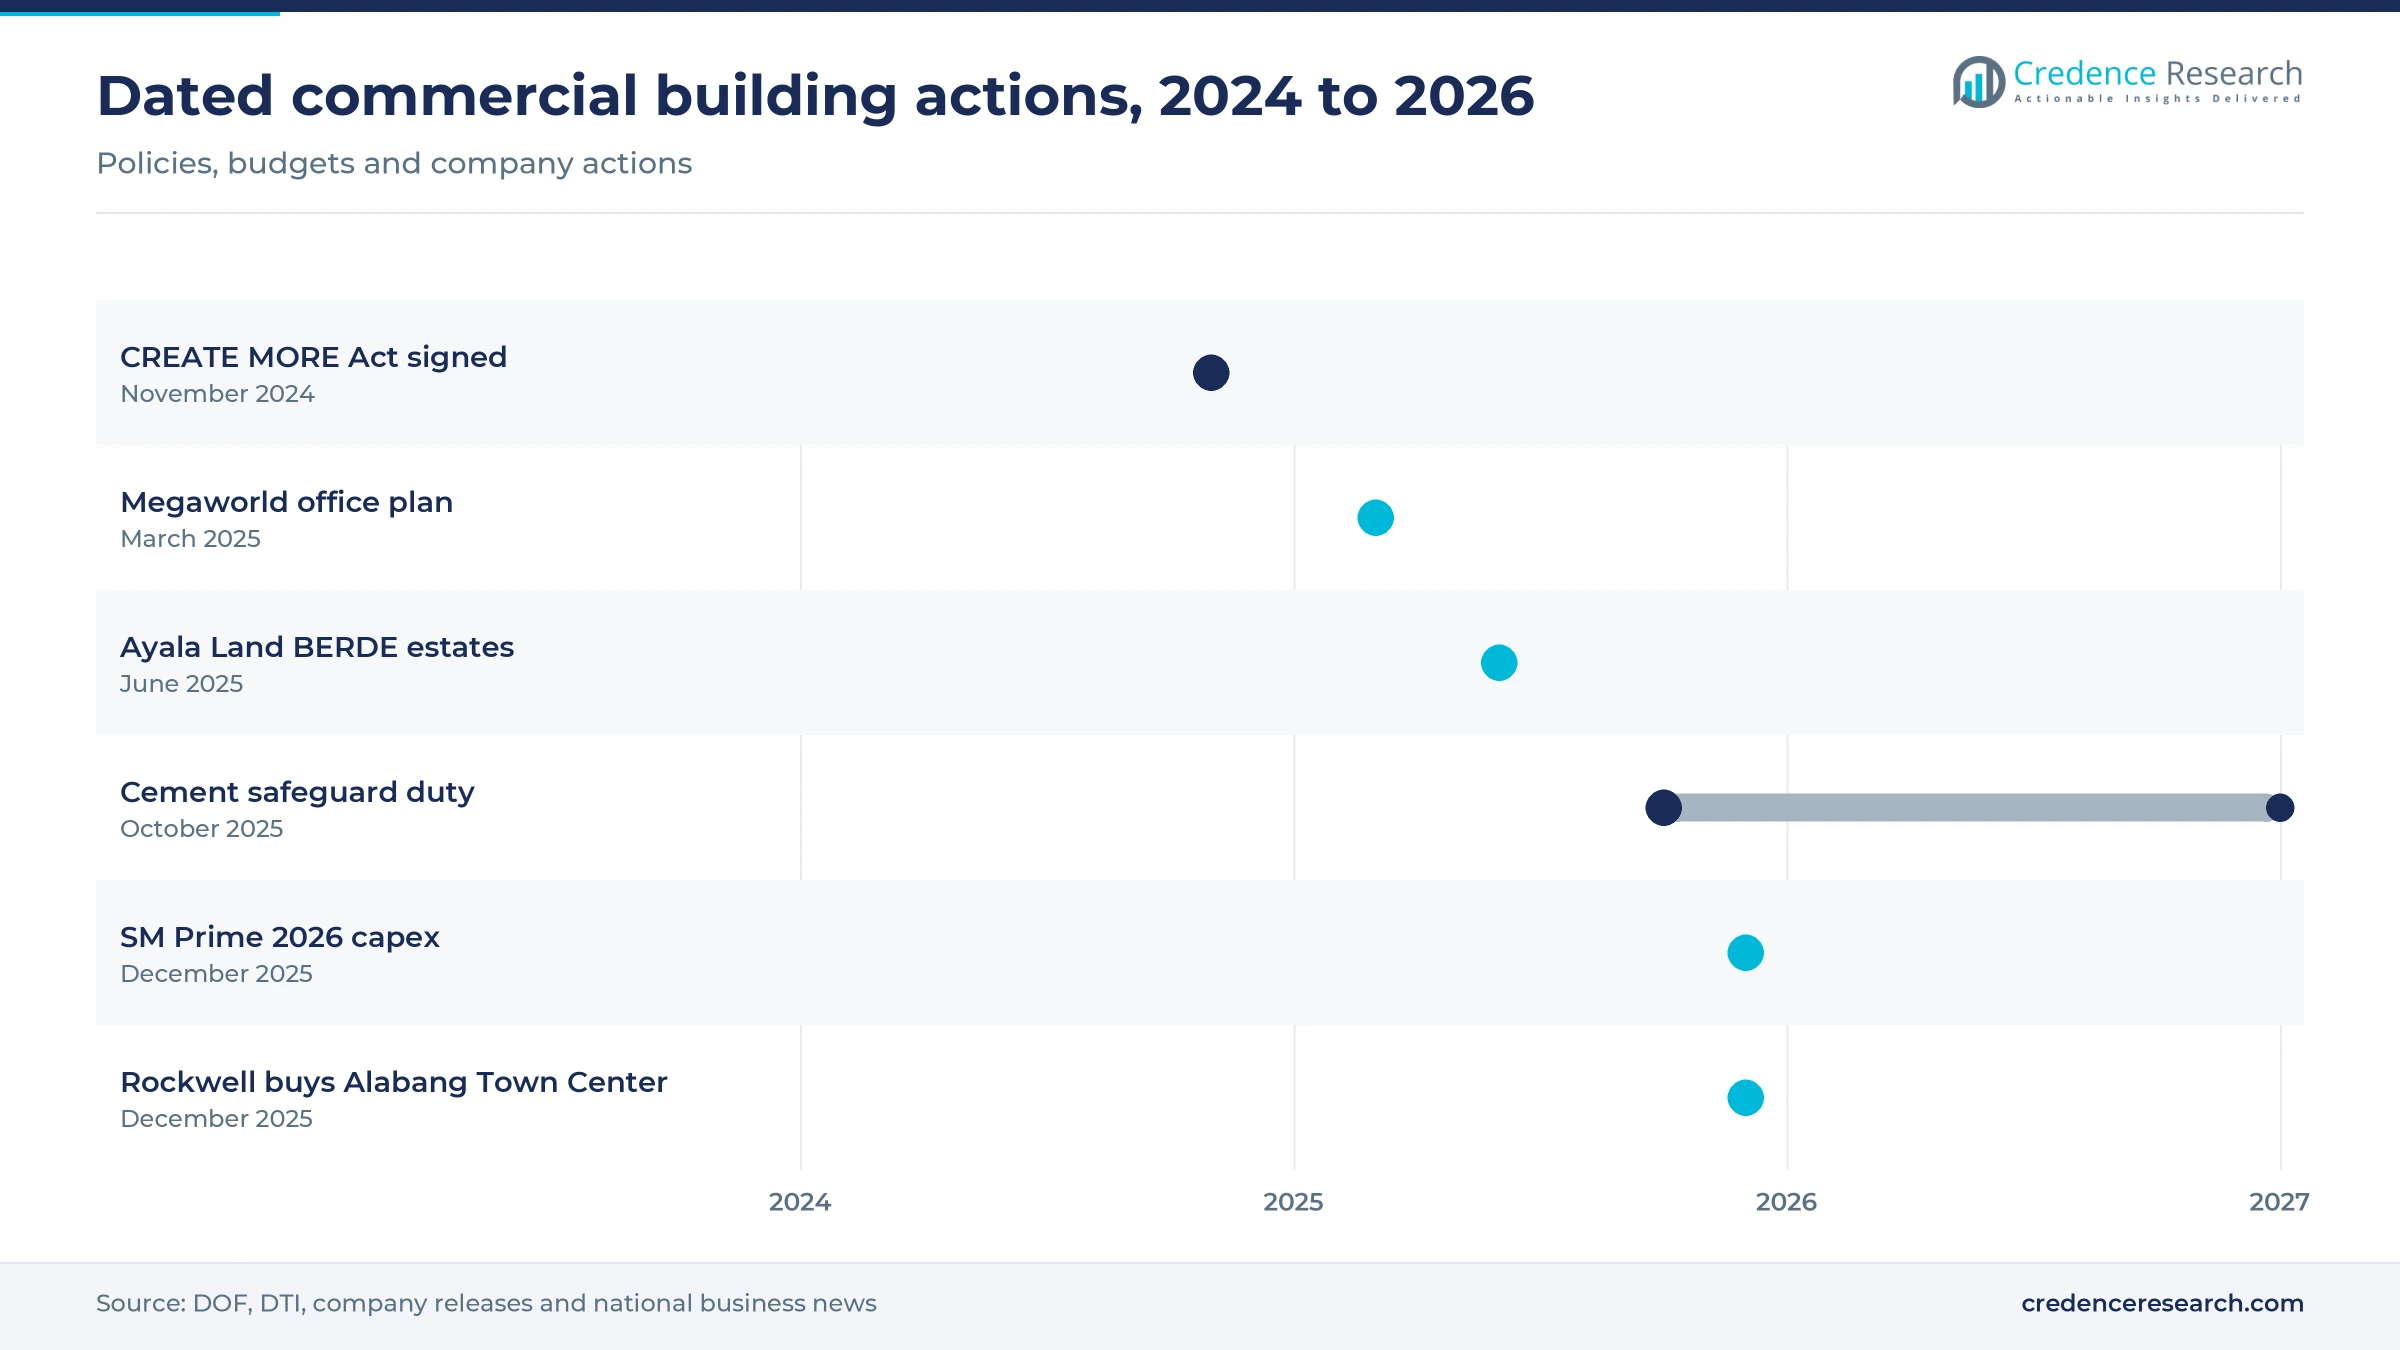
Based on material, the market is categorized into cement, metal, aggregates, precast concrete, glass, ceramic facing and floor tiles, wood and others. Cement led with 22.0% of 2025 value because cast-in-place frames remain the standard for malls and towers, and the Department of Trade and Industry imposed a safeguard duty of PHP 349 per metric ton on imported cement on Oct. 14, 2025, according to the Manila Bulletin. Precast Concrete grows fastest at 8.95% a year, as Megawide runs a Taytay plant able to produce more than 35,000 cubic meters a year and plans another plant, Philstar reported in January 2026.
Why do retail projects lead commercial building budgets?
Based on end use, the market is categorized into retail construction, office building construction, institutional construction, hospitality construction and others. Retail Construction led with 31.0% of 2025 value because mall operators build continuously, and SM Prime planned 205,400 square meters of new mall floor area within its PHP 100 billion 2026 budget, the Manila Bulletin reported on Dec. 1, 2025. Hospitality Construction grows fastest at 8.65% a year, as the country drew about 6.48 million foreign visitors in 2025 and Robinsons Land plans six new hotels between 2025 and 2028.
Why is renovation and fit-out work gaining share?
Based on construction type, the market is categorized into new construction and renovation and fit-out. New Construction led with 72.0% of 2025 value because owners still add space, and Ayala Land brought about 77,000 square meters of new leasing space online in 2025 with more than 250,000 square meters expected in 2026, according to the Manila Bulletin. Renovation & Fit-Out grows fastest at 8.18% a year, as SM Prime plans to redevelop 124,488 square meters of existing mall space and Ayala Land completed reinvention works at TriNoma and Ayala Center Cebu in 2025.
| Segment Group | Leading Sub-segment | Share, 2025 | Fastest-growing Sub-segment | CAGR, 2026–2035 |
|---|---|---|---|---|
| By Material | Cement | 22.0% | Precast Concrete | 8.95% |
| By End Use | Retail Construction | 31.0% | Hospitality Construction | 8.65% |
| By Construction Type | New Construction | 72.0% | Renovation & Fit-Out | 8.18% |
Request a Free Sample
Fill in your details and we'll send you a free sample report.
- Sample data tables & charts
- Research methodology
Listed developers, ecozones and tourism lift project starts
Mall and mixed-use pipelines of listed developers
Listed developers carry the largest share of private commercial work, and their capital budgets set the pace of starts. SM Prime set a PHP 100 billion capex budget for 2026, including about PHP 21 billion for mall expansion, the Manila Bulletin reported on Dec. 1, 2025. Robinsons Land, which runs 55 malls and 26 hotels, lined up 25 mall projects for 2025 to 2030 within a plan of up to PHP 125 billion, according to Context in May 2025. Ayala Land spent PHP 92.9 billion in 2025, of which 29% went to completing and expanding its leasing portfolio. As a result, retail construction holds 31.0% of 2025 value, and these budgets keep contractors busy even when public work slows.
IT-BPM growth and new ecozones keep office demand alive
Outsourcing firms and export locators remain the anchor tenants of new office floors outside the old Manila business districts. Philippine IT-BPM export revenue passed USD 40 billion in 2025 and the workforce reached 1.9 million, Philstar reported on Jan. 29, 2026. The Philippine Economic Zone Authority approved PHP 260.89 billion of investments in 314 projects in 2025 and saw 10 new ecozones proclaimed, including Aseana City, Bacolod, Santa Rosa and Calamba, according to TFA. Megaworld plans to spend PHP 30 billion over five years to reach 2 million square meters of office space by 2030. In turn, office building construction holds a large share even while Metro Manila vacancy stays high.
Tourism recovery and new tax rules support hotel building
Hotel construction is the fastest-growing end use because visitor spending and tax incentives both improved in 2025. The country recorded about 6.48 million international arrivals and PHP 694 billion in visitor spending in 2025, SunStar reported on Jan. 22, 2026. The CREATE MORE Act, signed on Nov. 11, 2024, added a 50% deduction for tourism reinvestment and trade fair expenses until 2034, according to the Department of Finance. Robinsons Land plans six new hotels from 2025 to 2028, starting with Nustar Hotel in Cebu. As a result, hospitality construction grows at 8.65% a year, and gateway cities outside Manila are likely to take a larger share of hotel starts.
Public budgets for hospitals, schools and civic buildings
Public agencies are a large buyer of institutional buildings, and the national budget keeps this demand in the pipeline. The 2026 infrastructure program totals PHP 1.558 trillion, or 5.1% of GDP, with PHP 881.3 billion for the Department of Public Works and Highways. The Regional Specialty Centers Act, Republic Act 11959 signed in August 2023, requires specialty centers in Department of Health hospitals in every region, Rappler reported. The Department of Education still faced a classroom shortage of about 165,000 in May 2025, GMA News reported. Because of these programs, institutional construction remains a steady source of contracts for hospitals, schools and civic halls even when private office demand softens.
Green ratings, regional townships and redevelopment work
Shift toward green certified commercial buildings
Green ratings are moving from flagship towers to whole estates, and tenants now ask for certified space in new leases. Ayala Land sought BERDE district certification for seven estates, starting with Nuvali in Laguna, the Manila Bulletin reported on June 20, 2025. Filinvest Land opened One Filinvest in Ortigas Center with about 38,986 square meters of office space and a LEED Gold rating, Philstar reported in April 2026. Department of Energy Circular DC2020-12-0026 covers buildings with loads of 112.5 kVA or more or at least 10,000 square meters of floor area and requires them to source at least 1% of their energy from renewables, according to the Inquirer. This shift adds glazing, controls and solar packages to commercial project budgets.
Rise of regional townships outside Metro Manila
Developers are moving a larger part of their commercial pipelines to provincial townships, where land is cheaper and local demand is growing. Megaworld opened three office towers in early 2025 in Iloilo, Bacolod and Pampanga, Philstar reported on March 25, 2025. SM Prime planned five new malls for 2025, all outside Metro Manila, including La Union, Laoag and Zamboanga, according to Context. Calabarzon accounted for 21.5% and Central Luzon for 19.9% of approved building permits in March 2026, according to BusinessWorld. As a result, Central Luzon is the fastest-growing of the five zones in this report, ahead of the Visayas and Calabarzon.
Opportunity in mall redevelopment and interior fit-out
Older malls and offices offer a large opening for renovation and fit-out contractors, because owners now upgrade assets rather than only add new space. SM Prime plans to redevelop 124,488 square meters of existing mall space, the Manila Bulletin reported in December 2025. Rockwell Land agreed to take majority control of the 17.5-hectare Alabang Town Center for PHP 21.6 billion and is planning its redevelopment, TFA reported on Dec. 22, 2025. Ayala Land completed reinvention works at TriNoma, Ayala Center Cebu and five hotels in 2025. In turn, renovation and fit-out grows at 8.18% a year, ahead of new construction, and favors specialist interior contractors.
Opportunity in precast systems and offsite production
Precast and offsite production give contractors a way to cut site labor and shorten schedules on repetitive commercial floors. Megawide runs a Taytay precast plant able to make more than 35,000 cubic meters a year and plans a new plant in Cavite costing about PHP 1.5 billion to PHP 2 billion, Philstar reported in January 2026. Its order book target for 2026 reached up to PHP 80 billion, according to the same report. Cement prices also stayed flat, as the NCR wholesale index for cement fell 1.3% year on year in August 2025, BusinessWorld reported. As a result, precast concrete grows at 8.95% a year, the fastest material category.
Public works delays, vacancy and storm risk limit starts
Public works delays after the flood control scandal
Public building work slowed sharply in late 2025, and this risk weighs on schools, hospitals and civic projects. Construction output fell 7.1% in the fourth quarter of 2025, while government spending on construction dropped 41.9%, InsiderPH reported on Jan. 29, 2026. The fall followed a flood control spending scandal that delayed approvals and payments from mid-2025. As a result, contractors that rely on public contracts face slower billing, and owners are shifting work toward private malls, offices and hotels.
High office vacancy in older Metro Manila districts
Office vacancy in older bay-area districts stays high, and this holds back new speculative office towers in the capital. Vacancy in the Manila Bay Area was close to 34% after offshore gaming operators left, Real Estate Asia reported in April 2026. New Metro Manila office supply fell 55% to about 199,000 square meters in 2025, the same report said. As a result, landlords are delaying new towers and putting money into refits, which shifts work from shell builders to fit-out firms.
Volatile construction cost per square meter
Average construction costs move widely from month to month, which makes budgeting hard for owners and contractors alike. Non-residential permits averaged PHP 11,044.09 per square meter in December 2025, according to the Daily Tribune, compared with PHP 10,555.60 for non-residential buildings in the PSA 2022 construction statistics. In February 2026 the average for all permits jumped 35.1% to PHP 14,882.98 per square meter, and non-residential buildings averaged over PHP 24,000, the Daily Tribune reported. These swings reflect changes in project mix and finishes, so owners now ask for fixed-price packages and longer price validity.
Typhoons and floods interrupt site work
Storms and floods regularly stop site work, and the 2025 season hit permits and schedules hard. The value of approved building permits fell 22.6% to PHP 40.20 billion in November 2025, which the Manila Bulletin linked to typhoons. Total permit value in December 2025 also fell 13.4% to PHP 33.62 billion, according to PSA data. As a result, contractors build weather delays into schedules, and owners in storm-exposed provinces spend more on drainage, roofing and structural resilience.
Metro Manila leads as Central Luzon adds projects fastest
| Region | Value, 2025 (USD billion) | Share, 2025 | CAGR, 2026–2035 |
|---|---|---|---|
| Metro Manila | 1.15 | 37.0% | 6.70% |
| Calabarzon | 0.62 | 20.0% | 7.70% |
| Visayas | 0.53 | 17.0% | 7.80% |
| Central Luzon | 0.44 | 14.0% | 8.10% |
| Mindanao | 0.37 | 12.0% | 7.60% |
Metro Manila holds the main office and mall estates
Metro Manila held 37.0% of 2025 value and grows at 6.70% a year, the slowest of the five zones. The capital still hosts the largest mall and office estates, but new office supply fell to about 199,000 square meters in 2025, Real Estate Asia reported. Redevelopment now drives much of the work, as Rockwell Land agreed to buy majority control of Alabang Town Center for PHP 21.6 billion in December 2025. Filinvest Land opened One Filinvest in Ortigas Center in April 2026 with a LEED Gold rating.
Visayas grows on Cebu, Iloilo and Bacolod projects
The Visayas held 17.0% of 2025 value and grows at 7.80% a year. Central Visayas recorded 19,585 constructions in 2024, or 10.9% of the national count, according to PSA data reported by Real Estate News. Megaworld opened office towers in Iloilo Business Park and The Upper East Bacolod in early 2025, while Robinsons Land named Nustar Hotel in Cebu as the first of six planned hotels. New ecozones in Bacolod, Balamban and Tagbilaran, proclaimed in 2025, add further demand for offices and support buildings.
Calabarzon gains from ecozones and estate offices
Calabarzon held 20.0% of 2025 value and grows at 7.70% a year. The region recorded 41,471 constructions in 2024, or 23.0% of the national total, the largest count of any region, according to PSA data. New ecozones in Santa Rosa, Biñan, Calamba and Malvar were proclaimed in 2025, according to TFA. Ayala Land also completed a regional office techno hub at Nuvali in Laguna in 2025, which shows how estate offices are spreading south of the capital.
Central Luzon is the fastest-growing zone
Central Luzon held 14.0% of 2025 value and grows fastest at 8.10% a year. The region accounted for 3,196 approved permits in March 2026, or 19.9% of the national total, BusinessWorld reported. Megaworld opened Pasudeco Tower in its Capital Town Pampanga township in early 2025, one of three regional office towers it completed that quarter. Good expressway links to Metro Manila and the Clark airport make the region the main overflow market for capital-based tenants.
Mindanao builds on Davao and Zamboanga demand
Mindanao held 12.0% of 2025 value and grows at 7.60% a year. Davao City approved 705 non-residential constructions in 2025, including 580 commercial buildings, with non-residential value of PHP 5.47 billion, according to the City Government of Davao. SM Prime included Zamboanga among its 2025 new mall locations, Context reported. Lower land costs and a growing service economy support new malls and hotels, although project sizes remain smaller than in Luzon.
Capex plans, acquisitions and cement duties of 2025
| Development | Status and market relevance |
|---|---|
| In October 2025, the Department of Trade and Industry imposed a three-year safeguard duty of PHP 349 per metric ton on imported cement. | In force; supports local cement makers and sets a floor under imported cement costs |
| In December 2025, SM Prime set a PHP 100 billion capex budget for 2026, including 205,400 square meters of new mall floor area. | Planned; the largest single private commercial building budget for 2026 |
| In December 2025, Rockwell Land agreed to acquire majority control of Alabang Town Center for PHP 21.6 billion. | Payments due through December 2027; redevelopment planning under way |
| In March 2025, Megaworld announced a PHP 30 billion five-year plan to reach 2 million square meters of office space by 2030. | Under way; towers opened in Iloilo, Bacolod and Pampanga in 2025 |
| In June 2025, Ayala Land began seeking BERDE district certification for seven estates, starting with Nuvali in Laguna. | Under way; raises green design requirements for new commercial buildings |
Precast, energy codes and green ratings shape design
- Precast concrete systems cut site labor and shorten schedules, and Megawide already runs a Taytay plant with more than 35,000 cubic meters of yearly capacity.
- Energy-conserving design rules apply to buildings of at least 10,000 square meters under DOE Circular DC2020-12-0026, which pushes efficient cooling, lighting and rooftop solar.
- Green rating systems such as BERDE and LEED now shape facade, glazing and water design, and architectural flat glass with low-emissivity coatings is common in rated towers.
- Tile and finish packages make up a growing part of fit-out budgets, and ceramic tiles remained one of the few NCR material groups with rising wholesale prices in August 2025, when the overall index fell 0.5%.
Need a Custom Version of This Report?
Tailor the scope, geography, or segments to your exact requirements.
- Custom geography or segment scope
- Direct access to our analyst team
Township developers and their contractors set the pace
Competition centers on a small group of listed township developers that commission most large malls, offices and hotels, and on the general contractors and precast suppliers that build for them. SM Prime, Ayala Land, Megaworld and Robinsons Land plan multi-year pipelines and award packages across many cities at once, which gives them strong buying power over contractors and material suppliers. Filinvest Land and Rockwell Land compete through focused estates, green-rated offices and the redevelopment of established retail centers such as Alabang Town Center. Contractors such as Megawide compete on speed and cost through precast systems, while specialist trades win interior fit-out, facade and mechanical packages. Developers increasingly pick contractors that can deliver BERDE or LEED documentation, and demand for data center projects is drawing the same contractors into mission-critical work.
Companies profiled and their roles in this market
| Company | Type | Role in the market |
|---|---|---|
| SM Prime Holdings Inc. | Mall and mixed-use developer | Set a PHP 100 billion capex budget for 2026 with 205,400 sq m of new mall floor area and 124,488 sq m of redevelopment |
| Ayala Land, Inc. | Estate developer | Spent PHP 92.9 billion in 2025 and expects more than 250,000 sq m of leasable space in 2026; seeks BERDE district ratings for seven estates |
| Megaworld Corporation | Township and office developer | Plans PHP 30 billion over five years to reach 2 million sq m of office space by 2030 |
| Robinsons Land Corporation | Mall, office and hotel developer | Lined up 25 mall projects and six hotels within a plan of up to PHP 125 billion to 2030 |
| Filinvest Land, Inc. | Office and mall developer | Opened the LEED Gold One Filinvest office and retail complex in Ortigas Center in 2026 |
| Rockwell Land Corporation | Mixed-use developer | Agreed to acquire majority control of Alabang Town Center for PHP 21.6 billion in December 2025 |
| Megawide Construction Corporation | General contractor and precast producer | Runs a Taytay precast plant of more than 35,000 cubic meters a year and plans a Cavite plant |
Regional townships will decide where value moves
Credence Research's view is that the next decade of Philippine commercial building work will be decided less by Metro Manila towers and more by provincial townships, hotels and the refit of older malls. Listed developers have already committed large multi-year budgets, so private demand looks secure even after the 2025 public works slowdown. The main swing factor is public spending on hospitals and schools, which depends on how fast approvals recover after the flood control scandal. Contractors that offer precast systems, green documentation and fit-out capacity across several regions are best placed to win share.
How Credence Research sized the market
The report uses 2025 as the base year and 2026 to 2035 as the forecast period. The 2025 value comes from the Credence Research market model, which was cross-checked against PSA approved building permit values, commercial shares of non-residential construction and developer capital budgets. Splits by material, end use, construction type and region are Credence Research estimates. Sources include PSA construction statistics, World Bank releases, Department of Finance and Department of Energy issuances, company disclosures and national business news. No interviews or surveys were used for this edition of the report.
Hotels, fit-out and regional offices lead to 2035
The market is expected to grow from USD 3.35 billion in 2026 to USD 6.37 billion by 2035, at a 7.40% CAGR during 2026–2035. The World Bank expects Philippine growth of 5.3% in 2026 and 5.4% in 2027, with public investment regaining momentum after the 2025 slowdown. Hotels and renovation work should grow fastest, while cement keeps the largest share of material spending. Central Luzon, the Visayas and Calabarzon should take a rising share of national value as townships mature, and Metro Manila work should tilt further toward redevelopment.
Frequently Asked Questions
How big is the Philippines commercial building construction market?
What is the construction cost per square meter for commercial buildings in the Philippines in 2025?
How are construction material prices moving in the Philippines?
Which region leads commercial building construction in the Philippines?
Which end use is growing fastest?
How does the Build Better More program affect commercial building work?
How large is renovation and fit-out work in the market?
Who are the key companies in Philippine commercial building construction?
Table of Content
Chapter 1 Market Segmentation
- 1.1 Segmentation Framework
- 1.1.1 Product and Service Classification
- 1.1.2 Application and End-Use Classification
- 1.1.3 Technology and Solution Classification
- 1.1.4 Customer and Distribution Channel Classification
- 1.1.5 Geographic Segmentation
- 1.1.6 Market Segment Definitions and Boundaries
- 1.2 By Material
- 1.2.1 Cement
- 1.2.2 Metal
- 1.2.3 Aggregates
- 1.2.4 Precast Concrete
- 1.2.5 Glass
- 1.2.6 Ceramic Facing & Floor Tiles
- 1.2.7 Wood
- 1.2.8 Others
- 1.3 By End Use
- 1.3.1 Retail Construction
- 1.3.2 Office Building Construction
- 1.3.3 Institutional Construction
- 1.3.4 Hospitality Construction
- 1.3.5 Others
- 1.4 By Construction Type
- 1.4.1 New Construction
- 1.4.2 Renovation & Fit-Out
Chapter 2 Introduction
- 2.1 Report Objectives and Scope
- 2.2 Product Definition and Industry Terminology
- 2.3 Market Inclusions and Exclusions
- 2.4 Research Process
- 2.4.1 Primary Research and Expert Interviews
- 2.4.2 Secondary Research and Source Review
- 2.4.3 Top-Down and Bottom-Up Estimation
- 2.4.4 Data Triangulation and Verification
- 2.5 Market Size Measurement Basis
- 2.5.1 2025: USD 3.12 billion → 2035: USD 6.37 billion
- 2.6 Historical and Forecast Reference Periods
- 2.6.1 Historical Period: 2018-2025
- 2.6.2 Base Year: 2025
- 2.6.3 Forecast Period: 2025-2035
- 2.7 Research Assumptions and Limitations
Chapter 3 Executive Summary
- 3.1 Market Snapshot and Key Findings
- 3.2 Base-Year Market Size, 2025
- 3.3 Forecast Market Size, 2035
- 3.4 Revenue and Volume Growth Outlook
- 3.5 Key Demand and Supply Indicators
- 3.6 Leading Market Segments
- 3.7 Fastest-Growing Market Opportunities
- 3.8 Regional Performance Highlights
- 3.9 Technology and Industry Transformation
- 3.10 Competitive Landscape Summary
- 3.11 Analyst View and Strategic Implications
Chapter 4 Philippines Commercial Building Construction Market Trends and Developments
- 4.1 Historical Industry Development, 2018-2025
- 4.2 Recent Market Trends and Developments
- 4.3 Demand and Customer Behavior Trends
- 4.4 Technology and Product Innovation
- 4.5 Artificial Intelligence, Automation and Digitalization
- 4.6 Local Manufacturing and Supply Chain Realignment
- 4.7 Industry Partnerships, Mergers and Acquisitions
- 4.8 Sustainability and Circular Economy Developments
- 4.9 Government and Private Sector Investment Trends
- 4.10 Emerging Business Models and Commercialization
- 4.11 Industry Developments and Announcements
Chapter 5 Philippines Commercial Building Construction Market Production, Supply and Demand Analysis
- 5.1 Demand Trend and Consumption Analysis, 2018-2025
- 5.2 Demand Forecast, 2025-2035
- 5.3 Production and Output Trend, 2018-2025
- 5.4 Production and Output Forecast, 2025-2035
- 5.5 Installed Capacity and Capacity Utilization
- 5.6 Company-Wise Production Plants and Statistics
- 5.6.1 Installed Production Capacity
- 5.6.2 Actual Production
- 5.6.3 Planned Capacity and Expansion Targets
- 5.7 Supply Chain Structure and Procurement Trends
- 5.8 Supply-Demand Gap and Bottlenecks
- 5.9 Import Dependence and Sourcing Structure
- 5.10 Contract Manufacturing and Outsourcing
- 5.11 Regional Supply and Demand Concentration
Chapter 6 Philippines Commercial Building Construction Market Pricing Analysis
- 6.1 Pricing Structure and Measurement
- 6.2 Historical Pricing Trends, 2018-2025
- 6.3 Pricing Outlook, 2025-2035
- 6.4 Average Selling Price and Unit Economics
- 6.5 Pricing by Product and Market Segment
- 6.6 Geographic Pricing Differences
- 6.7 Key Input, Energy, Labor and Logistics Costs
- 6.8 Contract Pricing and Purchasing Models
- 6.9 Pricing Sensitivity and Competitive Positioning
- 6.10 Price, Margin and Profitability Implications
Chapter 7 Philippines Commercial Building Construction Market Dynamics
- 7.1 Market Growth Drivers
- 7.1.1 Demand-Side Drivers
- 7.1.2 Technology and Innovation Drivers
- 7.1.3 Infrastructure and Investment Drivers
- 7.1.4 Regulatory and Policy Drivers
- 7.2 Market Restraints
- 7.2.1 Cost and Affordability Constraints
- 7.2.2 Technology and Adoption Barriers
- 7.2.3 Supply Chain and Operational Constraints
- 7.3 Market Challenges
- 7.3.1 Competitive Pressure and Margin Erosion
- 7.3.2 Skills, Infrastructure and Implementation Gaps
- 7.4 Emerging Market Opportunities
- 7.5 Market Dynamics Impact and Time-Horizon Assessment
Chapter 8 Philippines Commercial Building Construction Value Chain Analysis
- 8.1 Industry Value Chain Overview
- 8.2 Upstream Suppliers and Critical Inputs
- 8.3 Technology and Component Providers
- 8.4 Manufacturing or Service Delivery
- 8.5 Distribution, Channel Partners and Integrators
- 8.6 Downstream Applications and End Users
- 8.7 Value Addition and Profit Pools
- 8.8 Vertical Integration and Outsourcing
- 8.9 Supplier Concentration and Risk
- 8.10 Supply Chain Localization and Resilience
Chapter 9 Philippines Commercial Building Construction Market Regulations and Policies
- 9.1 Relevant Laws, Standards and Compliance Frameworks
- 9.2 Product, Service, Safety and Quality Requirements
- 9.3 Government Policies, Incentives and Subsidies
- 9.4 Imports, Exports and Trade Barriers
- 9.5 Public Procurement and Local Content Requirements
- 9.6 Environmental and Sustainability Compliance
- 9.7 Upcoming Policy Changes and Market Implications
Chapter 10 Philippines Commercial Building Construction Market Hotspots and Opportunities
- 10.1 Market Opportunity Mapping and Growth Hotspots
- 10.2 High-Growth Applications and Customer Groups
- 10.3 Underserved Markets and White-Space Opportunities
- 10.4 Emerging Technology and Product Opportunities
- 10.5 New Capacity and Investment Hotspots
- 10.6 Market Entry and Expansion Opportunities
- 10.7 Distribution and Partnership Opportunities
- 10.8 Near-Term and Long-Term Commercial Potential
- 10.9 Opportunity Attractiveness and Execution Risks
Chapter 11 Philippines Commercial Building Construction Market Outlook, 2025-2035
- 11.1 Market Size and Analysis
- 11.1.1 Revenue (Market Measurement: 2025: USD 3.12 billion → 2035: USD 6.37 billion)
- 11.1.2 Market Volume and Quantity Sold
- 11.1.3 Historical Market Size, 2018-2025
- 11.1.4 Base-Year Market Size, 2025
- 11.2 Market Forecast, 2025-2035
- 11.2.1 Revenue Forecast to 2035
- 11.2.2 Volume Forecast to 2035
- 11.2.3 CAGR and Year-on-Year Growth
- 11.2.4 Incremental Revenue Opportunity
- 11.3 Forecast Assumptions and Scenario Analysis
- 11.3.1 Base-Case Forecast
- 11.3.2 Optimistic and Conservative Scenarios
- 11.3.3 Technology, Pricing and Policy Sensitivities
- 11.4 Market Attractiveness and Growth Outlook
Chapter 12 Philippines Commercial Building Construction Market Segmentation and Outlook
- 12.1 Segmentation Summary and Market Shares, 2025
- 12.2 Largest and Fastest-Growing Segments
- 12.3 By Material - Market Size and Forecast, 2025-2035
- 12.3.1 Segment Definition and Scope
- 12.3.2 Historical Market Size, 2018-2025
- 12.3.3 Revenue Forecast, 2025-2035
- 12.3.4 Volume Forecast, 2025-2035
- 12.3.5 Base-Year Market Share, 2025
- 12.3.6 Segment CAGR and Growth Drivers
- 12.3.7 Subsegment Market Size and Forecast
- 12.3.7.1 Cement
- 12.3.7.2 Metal
- 12.3.7.3 Aggregates
- 12.3.7.4 Precast Concrete
- 12.3.7.5 Glass
- 12.3.7.6 Ceramic Facing & Floor Tiles
- 12.3.7.7 Wood
- 12.3.7.8 Others
- 12.3.8 Subsegment Pricing and Adoption Trends
- 12.3.9 Leading Suppliers and Competition
- 12.3.10 Regional Demand and Opportunities
- 12.4 By End Use - Market Size and Forecast, 2025-2035
- 12.4.1 Segment Definition and Scope
- 12.4.2 Historical Market Size, 2018-2025
- 12.4.3 Revenue Forecast, 2025-2035
- 12.4.4 Volume Forecast, 2025-2035
- 12.4.5 Base-Year Market Share, 2025
- 12.4.6 Segment CAGR and Growth Drivers
- 12.4.7 Subsegment Market Size and Forecast
- 12.4.7.1 Retail Construction
- 12.4.7.2 Office Building Construction
- 12.4.7.3 Institutional Construction
- 12.4.7.4 Hospitality Construction
- 12.4.7.5 Others
- 12.4.8 Subsegment Pricing and Adoption Trends
- 12.4.9 Leading Suppliers and Competition
- 12.4.10 Regional Demand and Opportunities
- 12.5 By Construction Type - Market Size and Forecast, 2025-2035
- 12.5.1 Segment Definition and Scope
- 12.5.2 Historical Market Size, 2018-2025
- 12.5.3 Revenue Forecast, 2025-2035
- 12.5.4 Volume Forecast, 2025-2035
- 12.5.5 Base-Year Market Share, 2025
- 12.5.6 Segment CAGR and Growth Drivers
- 12.5.7 Subsegment Market Size and Forecast
- 12.5.7.1 New Construction
- 12.5.7.2 Renovation & Fit-Out
- 12.5.8 Subsegment Pricing and Adoption Trends
- 12.5.9 Leading Suppliers and Competition
- 12.5.10 Regional Demand and Opportunities
- 12.6 Segment Growth Comparison
- 12.7 Segment Attractiveness and Priority Matrix
Chapter 13 Philippines Commercial Building Construction End-Use and Application Market Outlook
- 13.1 End-Use Industry and Customer Demand Structure
- 13.2 Leading Applications and Customer Groups
- 13.3 End-Use Market Size, Share and Forecast
- 13.4 Major End-Use Industry Deep Dives
- 13.4.1 Customer Requirements and Use Cases
- 13.4.2 Demand and Replacement Cycles
- 13.4.3 Technical and Regulatory Considerations
- 13.4.4 Purchasing and Procurement Models
- 13.4.5 Leading Vendors and Distribution Channels
- 13.4.6 Forecast and Commercial Opportunities
- 13.5 Emerging Applications and Cross-Segment Demand
- 13.6 End-Use Industry Investment Priorities
Chapter 14 Philippines Commercial Building Construction Geographic Market Outlook, 2025-2035
- 14.1 Domestic Market Distribution and Demand Clusters
- 14.2 State- or Province-Wise Market Size and Forecast, 2025-2035
- 14.3 City and Metropolitan Market Outlook
- 14.4 Industrial, Manufacturing and Commercial Clusters
- 14.5 Geographic Concentration of Key End Users
- 14.6 Local Pricing and Purchasing Differences
- 14.7 Domestic Production Facilities and Capacity Map
- 14.8 Local Infrastructure and Project Pipeline
- 14.9 State-Level Policy and Incentive Differences
- 14.10 Subnational Investment Hotspots and Opportunities
- 14.11 Distribution and Logistics Networks
- 14.12 Domestic Competitive Footprint
Chapter 15 Philippines Commercial Building Construction Technology, Innovation and Sustainability Outlook
- 15.1 Technology Landscape and Maturity
- 15.2 Product, Process and Service Innovation
- 15.3 AI, Automation and Digital Tools in the Industry
- 15.4 Technology Adoption and Performance Benchmarking
- 15.5 Innovation Pipeline and R&D Investment
- 15.6 Patent and Intellectual Property Trends
- 15.7 Energy Efficiency and Resource Management
- 15.8 Sustainability, Recycling and Circularity
- 15.9 Technology Roadmap, 2025-2035
- 15.10 Risks of Obsolescence and Technology Substitution
Chapter 16 Philippines Commercial Building Construction Market Key Strategic Imperatives
- 16.1 Growth and Market Entry Priorities
- 16.2 High-Return Products and Segments
- 16.3 Pricing, Profitability and Cost Optimization
- 16.4 Technology Investment and Product Differentiation
- 16.5 Supply Chain Localization and Resilience
- 16.6 Distribution and Customer Acquisition
- 16.7 Partnership, Acquisition and Capacity Strategy
- 16.8 Regional Expansion Priorities
- 16.9 Short-, Medium- and Long-Term Actions
Chapter 17 Competition Outlook
- 17.1 Industry Competition Characteristics
- 17.2 Market Structure and Concentration
- 17.3 Market Share and Competitive Positioning, 2025
- 17.4 Company-Wise Revenue and Product Benchmarking
- 17.5 Production and Service Capacity Benchmarking
- 17.6 Technology, Pricing and Differentiation
- 17.7 Regional Footprint and Distribution Strength
- 17.8 Mergers, Acquisitions and Strategic Alliances
- 17.9 New Entrants and Competitive Threats
- 17.10 Porter's Five Forces and Industry Attractiveness
- 17.11 Competitive Outlook, 2025-2035
Chapter 18 Company Profiles
- 18.1 Company Coverage and Selection Criteria
- 18.2 SM Prime Holdings Inc.
- 18.2.1 Business Description
- 18.2.2 Company Ownership and Geographic Presence
- 18.2.3 Product and Service Portfolio
- 18.2.4 Manufacturing and Operating Footprint
- 18.2.5 Production Capacity and Expansion Plans
- 18.2.6 Financial Performance and Investment
- 18.2.7 Market Share and Competitive Position
- 18.2.8 Technology and Innovation Capabilities
- 18.2.9 Strategic Alliances or Partnerships
- 18.2.10 Recent Developments
- 18.2.11 Growth Strategy and Outlook
- 18.3 Ayala Land, Inc.
- 18.4 Megaworld Corporation
- 18.5 Robinsons Land Corporation
- 18.6 Filinvest Land, Inc.
- 18.7 Rockwell Land Corporation
- 18.8 Megawide Construction Corporation
- 18.9 Other Relevant Market Participants
Note: Every listed company is profiled on the structure shown under the first company. The company list is preliminary and may change based on research findings, market developments, data availability and client requirements.
Chapter 19 Disclaimer
- 19.1 Research and Forecast Disclaimer
- 19.2 Data Source and Estimation Limitations
Note: The depth of individual sections depends on data availability for this market. Volume, capacity, trade and other unit-based metrics are included where applicable.

