
Old garbage mounds become sorted fuel, fill and free land
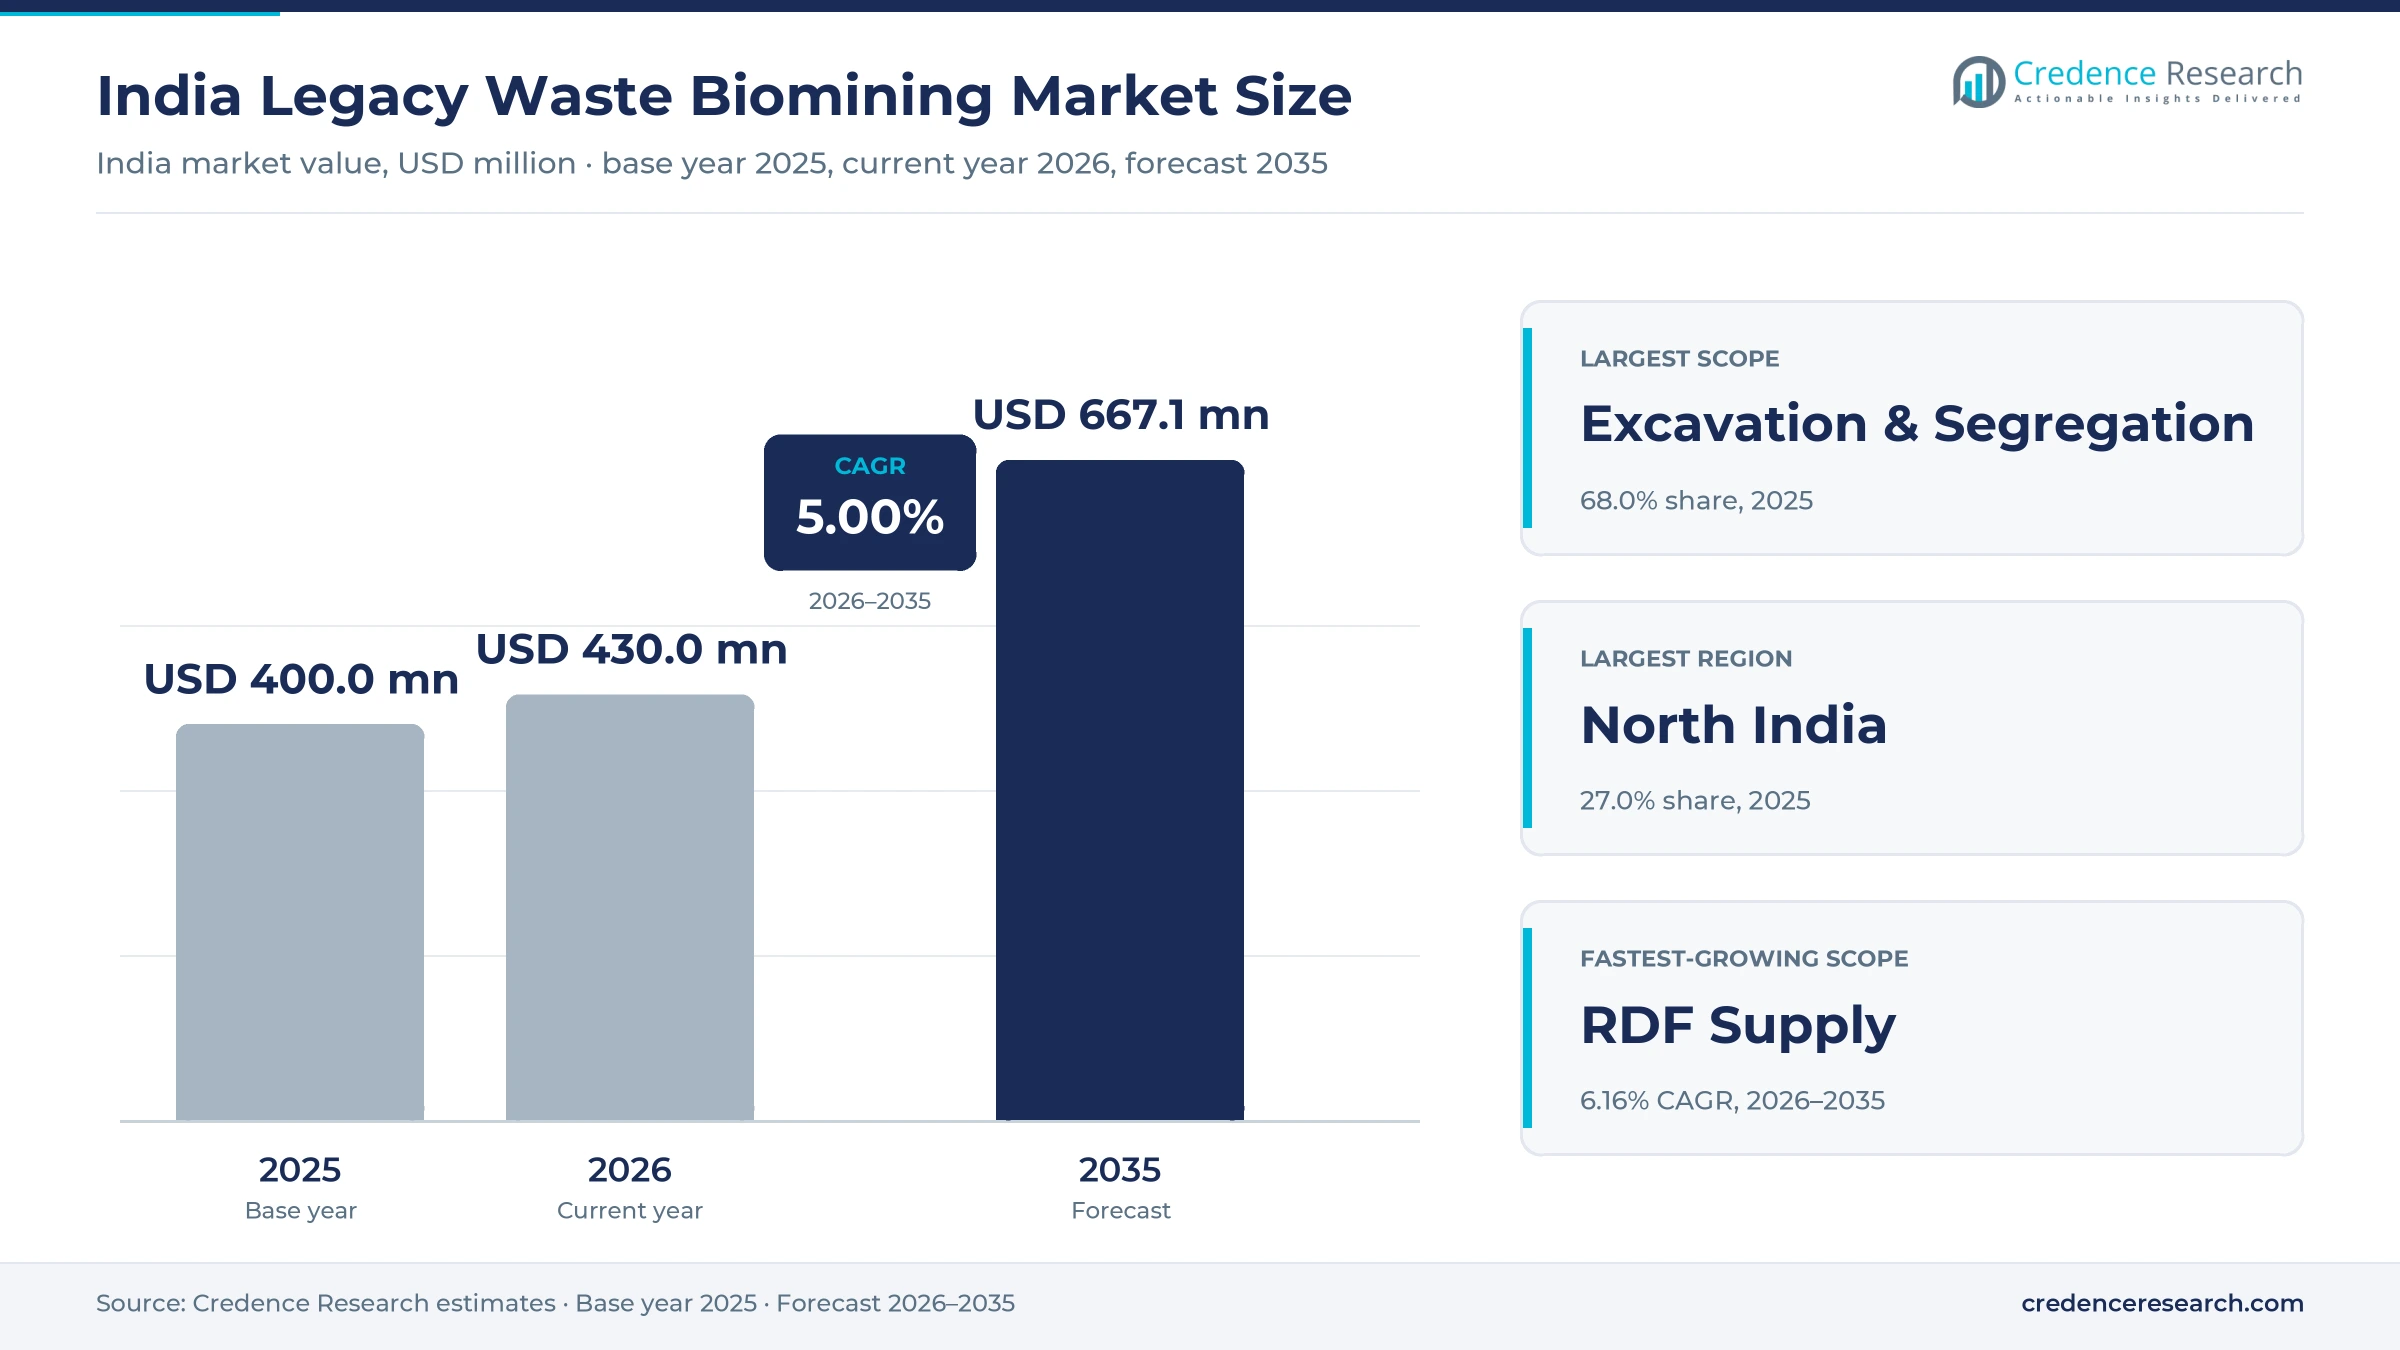
The India legacy waste biomining market was valued at USD 409.5 million in 2025 and is projected to increase from USD 430.0 million in 2026 to USD 667.1 million by 2035, registering a CAGR of 5.00% during 2026–2035. Demand comes from municipal corporations that pay contractors to excavate decades-old garbage mounds, screen it into soil-like material, recyclables and combustible fuel, and hand back cleared land. North India held the largest regional share, 27.0% in 2025, because Delhi's Okhla, Bhalswa and Ghazipur sites have been worked at the same time since 2022. Northeast India is the fastest-growing region at 5.90% a year, from a small base, as Guwahati and hill cities start their first large clearances. The main policy change is the Solid Waste Management Rules, 2026, in force from April 1, 2026, which require time-bound biomining of old dumpsites and a higher share of recovered fuel in cement kilns.
Which biomining work and revenue are counted here?
The market counts what urban local bodies and development authorities in India pay for clearing legacy dumpsites. It covers excavation, drying, trommel screening and segregation of old waste, the haulage and supply of the combustible fraction as refuse-derived fuel, and the leveling, capping and handover of reclaimed land, whether paid per metric ton or under a lump-sum EPC award.
The scope excludes daily collection and processing of fresh municipal waste, sanitary landfill construction, waste-to-energy plant revenue and the sale of screening machines. Value is counted once at the contract level, so a city fee for one metric ton cleared is included, while later resale of recyclables by traders is not.
India Legacy Waste Biomining Market Insights
- The market grows from USD 409.5 million in 2025 to USD 667.1 million by 2035 at a 5.00% CAGR, as 214 high-impact sites still hold about 80% of remaining legacy waste.
- North India held 27.0% of 2025 value, as Okhla, Bhalswa and Ghazipur had cleared about 216 lakh metric tons by August 2026.
- Excavation and segregation led the scope split with 68.0% in 2025, as cities pay mainly for each metric ton dug and screened.
- The Solid Waste Management Rules, 2026 took effect on April 1, 2026, requiring time-bound biomining with quarterly progress reports.
- Mumbai awarded the Rs 2,540 crore Deonar project in July 2025 to clear 185 lakh metric tons at Rs 1,373.35 a metric ton.
Excavation, per-ton contracts and Maharashtra lead value
Why does excavation and segregation earn most value?
Based on scope, the market is categorized into excavation & segregation, RDF supply and land reclamation. Excavation & Segregation led with 68.0% of 2025 value because contracts pay mainly for digging and screening each metric ton, and the Greater Chennai Corporation fixed Rs 963.23 a metric ton for the 66.52 lakh metric tons at Kodungaiyur in February 2024. RDF Supply grows fastest at 6.16% a year as the Solid Waste Management Rules, 2026 raise the required use of refuse-derived fuel in cement kilns from 5% to 15% over six years. Land reclamation earns from leveling and handover, as at the 698.34 acres Gujarat had reclaimed by October 2024.
How do per-ton and EPC contracts compare?
Based on contract, the market is categorized into per-ton and EPC. Per-Ton contracts led with 72.0% of 2025 value because most cities pay on measured volume, and Pune budgeted Rs 154 crore for its Fursungi depot at Rs 550 a metric ton, The Bridge Chronicle reported in October 2025. That basis matches the central assistance of Rs 550 a metric ton under Swachh Bharat Mission-Urban 2.0. EPC contracts grow fastest at 5.89% a year as large sites move to single multi-year awards, such as the Rs 2,540 crore Deonar project in Mumbai, which must clear 185 lakh metric tons within three years.
Why do Maharashtra and the other states stand out?
Based on state, the market is categorized into Maharashtra, Delhi, Uttar Pradesh, Gujarat and others. Others, which covers Tamil Nadu, Karnataka, Kerala, West Bengal, Assam and smaller states, led with 47.0% of 2025 value because it pools large sites such as Kodungaiyur and Kolkata's Dhapa, where the city planned to process 40 lakh metric tons over three years, according to Millennium Post. Maharashtra grows fastest at 5.83% a year as Deonar work began after the 2025 monsoon and Pune approved five tenders for 28 lakh metric tons at Fursungi in October 2025. Gujarat grows slowest because it had cleared 210 of its 221 lakh metric tons by October 2024.
| Segment Group | Leading Sub-segment | Share, 2025 | Fastest-growing Sub-segment | CAGR, 2026–2035 |
|---|---|---|---|---|
| By Scope | Excavation & Segregation | 68.0% | RDF Supply | 6.16% |
| By Contract | Per-Ton | 72.0% | EPC | 5.89% |
| By State | Others | 47.0% | Maharashtra | 5.83% |
Request a Free Sample
Fill in your details and we'll send you a free sample report.
- Sample data tables & charts
- Research methodology
Big civic awards and zero-dumpsite targets drive work
Municipal landfill remediation contracts drive demand
Municipal landfill remediation contracts are the core of demand, because city bodies pay operators for every metric ton excavated, screened and cleared. The Brihanmumbai Municipal Corporation awarded the Deonar project worth Rs 2,540 crore to Navayuga Engineering in July 2025 for 185 lakh metric tons at Rs 1,373.35 a metric ton, Free Press Journal reported, with work spread over three years. Greater Chennai Corporation announced six Kodungaiyur packages worth Rs 640.83 crore in February 2024, DT Next reported. In Delhi, bids were invited in July 2026 for a third phase covering 10.95 million metric tons, Construction World reported. In the Credence Research model this adds about 2.1 percentage points to annual growth to 2035.
Land scarcity and dumpsite targets speed site clearances
Land locked under dumpsites and national deadlines push cities to clear sites faster, since reclaimed acres can host new processing plants or green cover. A Press Information Bureau backgrounder from January 2026 counted about 2,479 dumpsites holding about 25 crore metric tons over nearly 15,000 acres, with 183 lakh metric tons remediated in 2025 alone. The Dumpsite Remediation Accelerator Programme, launched in November 2025, targets 214 high-impact sites that hold about 80% of the remaining waste, backed by approved projects worth Rs 6,700 crore. Delhi had reclaimed about 100 acres at Okhla, Bhalswa and Ghazipur by August 2026, according to figures cited by Business Today. In the Credence Research model this adds about 1.3 percentage points to annual growth to 2035.
Mechanized screening and recyclable recovery lift returns
Mechanized screening raises daily throughput and lets operators sell recovered fractions, which improves the return on each contract. At Ghazipur, biomining ran at about 7,000 metric tons a day in late June 2026, and Delhi's urban development minister ordered it raised to 12,000 metric tons a day by July 31, 2026, The Daily Pioneer reported. Antony Waste Handling Cell's Rs 77 crore CIDCO contract near Taloja, won in March 2024, routes 8.6 lakh metric tons through a material recovery facility that sorts fuel, compost, inert material and soil. Chennai's Perungudi site recovered about 3,000 metric tons of glass while processing nearly 26 lakh metric tons, The Logical Indian reported in January 2026. In the Credence Research model this adds about 0.85 percentage points to annual growth to 2035.
New waste rules widen outlets for RDF and inert fill
New rules give recovered fractions more outlets, which lowers the cost of disposing of what biomining separates. The Solid Waste Management Rules, 2026, in force from April 1, 2026, require time-bound biomining with quarterly progress reports and raise fuel substitution in cement kilns and waste-to-energy plants from 5% to 15% over six years, Drishti IAS noted in January 2026. The Ministry of Road Transport and Highways told highway builders in September 2024 to use processed waste and inert material before extracted soil in embankments, Business Today reported. On March 22, 2026, more than 400 metric tons of Adampur legacy waste went into NH-146 near Bhopal, according to Free Press Journal. As a result, RDF supply becomes the fastest-growing scope in the Credence Research model.
Integrated awards, RDF chains and reclaimed land rise
Shift from small per-ton jobs to large integrated awards
Large cities are shifting from small per-ton work orders to multi-year awards that cover an entire mound and its handover. Mumbai's Deonar award of July 2025 covers 185 lakh metric tons in one Rs 2,540 crore contract over three years, while Chennai bundled Kodungaiyur into six packages worth Rs 640.83 crore, with Zigma Global Environ Solutions taking three of them. Delhi invited bids in July 2026 for a third phase of 10.95 million metric tons across its three sites, Construction World reported. Pune, by contrast, approved five tenders in October 2025 with every contractor bound to the lowest quoted rate. As a result, EPC awards grow at 5.89% a year in the Credence Research model.
Rise of RDF supply chains to cement plants and mills
Operators are building regular supply chains for the combustible fraction, which turns a disposal cost into a traded fuel. Lucknow sent 2,56,670 metric tons of waste-derived fuel in 7,060 trips to 31 cement plants and paper mills between Nov. 26, 2024 and May 31, 2026, some up to 500 kilometers away, Parwaz Radio reported. Rajkot sent fuel from its Nakrawadi site to a waste-to-energy plant in Jamnagar, NBM&CW reported in June 2025. In Kochi, Bhumi Green Energy defended its Rs 1,690 a metric ton rate in September 2023 by citing the cost of trucking fuel to northern states, Punekar News reported. This links biomining to the market for cement kiln alternative fuel.
Reclaimed land offers openings for parks and new plants
Reclaimed land is an opening for cities and contractors, because cleared acres can be leveled for parks, processing plants or forest cover. Gujarat had reclaimed 698.34 of 930.68 acres across 140 dumpsites by October 2024, including 46 of 90 acres at Pirana, DeshGujarat reported. Chennai may hand nearly 96 reclaimed acres at Perungudi to the forest department, The Logical Indian reported in January 2026. Raichur reclaimed nearly 22 acres at Yakalaspura and opened a Miyawaki forest on June 5, 2026, according to a Shankar IAS Parliament summary of a government release. In the Credence Research model, land reclamation grows faster than the overall market as handover work joins excavation contracts.
Untouched eastern, hill and northeastern sites open tenders
Sites that started late offer the next wave of tenders, because many hold large mounds and face tribunal deadlines. Guwahati announced Rs 172.5 crore for Zigma Global Environ Solutions to biomine 15 lakh to 17 lakh metric tons at Paschim Boragaon within 36 months, Prag News reported in January 2023. Srinagar must clear over 11 lakh metric tons at Achan by March 2028 at about 30,000 metric tons a month, ETV Bharat reported in October 2025. The FICCI-NEEV Fund study counted 3,000 to 4,000 dumpsites nationwide, against 2,479 listed by the central government, Entrepreneur India reported in February 2025. As a result, Northeast India grows faster than any other zone in the Credence Research model.
Fresh dumping, weak RDF demand and thin rates test bidders
Fresh dumping keeps refilling sites under remediation
Fresh garbage keeps arriving at sites that contractors are trying to clear, which stretches timelines and payment schedules. About 5,858 metric tons of fresh waste reached Delhi's three landfills each day in October 2026, ThePrint reported, as the Bhalswa deadline was extended a sixth time to February 2027. Ghazipur still held 63.43 lakh metric tons of unprocessed waste against a December 2027 deadline, ThePrint reported. Operators therefore need fresh-waste processing plants running alongside each biomining contract.
Low-grade fuel from old mounds finds few buyers
The combustible fraction from old mounds is wet and contaminated, so cement plants accept it reluctantly. Down To Earth reported in May 2023 that this fraction carries moisture above 30% and high chlorine, and that cement plants bear transport costs only up to 100 kilometers. Only 54 co-processing units operated in 13 states in 2023, the same publisher found. As a result, fuel piles up at remote sites and cities pay to haul it.
Wide rate gaps squeeze contractor margins
Rates per metric ton vary threefold across cities, which makes bidding risky for contractors with fixed equipment costs. Pune budgeted its Fursungi work at Rs 550 a metric ton and expected bids below Rs 700 in October 2025, while Kochi accepted Rs 1,690 in September 2023 and Mumbai Rs 1,373.35 in 2025. Central assistance is fixed at Rs 550 a metric ton. Low-rate contracts leave little room for drying, haulage and fuel transport costs.
Survey gaps and slippage delay contract payments
Volumes are often larger than surveys show and contractors miss targets, which delays payments and rebidding. At Ghazipur, the first-phase contractor processed 13.90 lakh of 30 lakh metric tons between November 2022 and November 2024, The Daily Pioneer reported, and an April 2026 drone survey found 67.81 lakh metric tons still on site. A contractor change at Bhalswa caused about a two-month delay in 2026. Clear survey, measurement and penalty clauses in each contract reduce this risk.
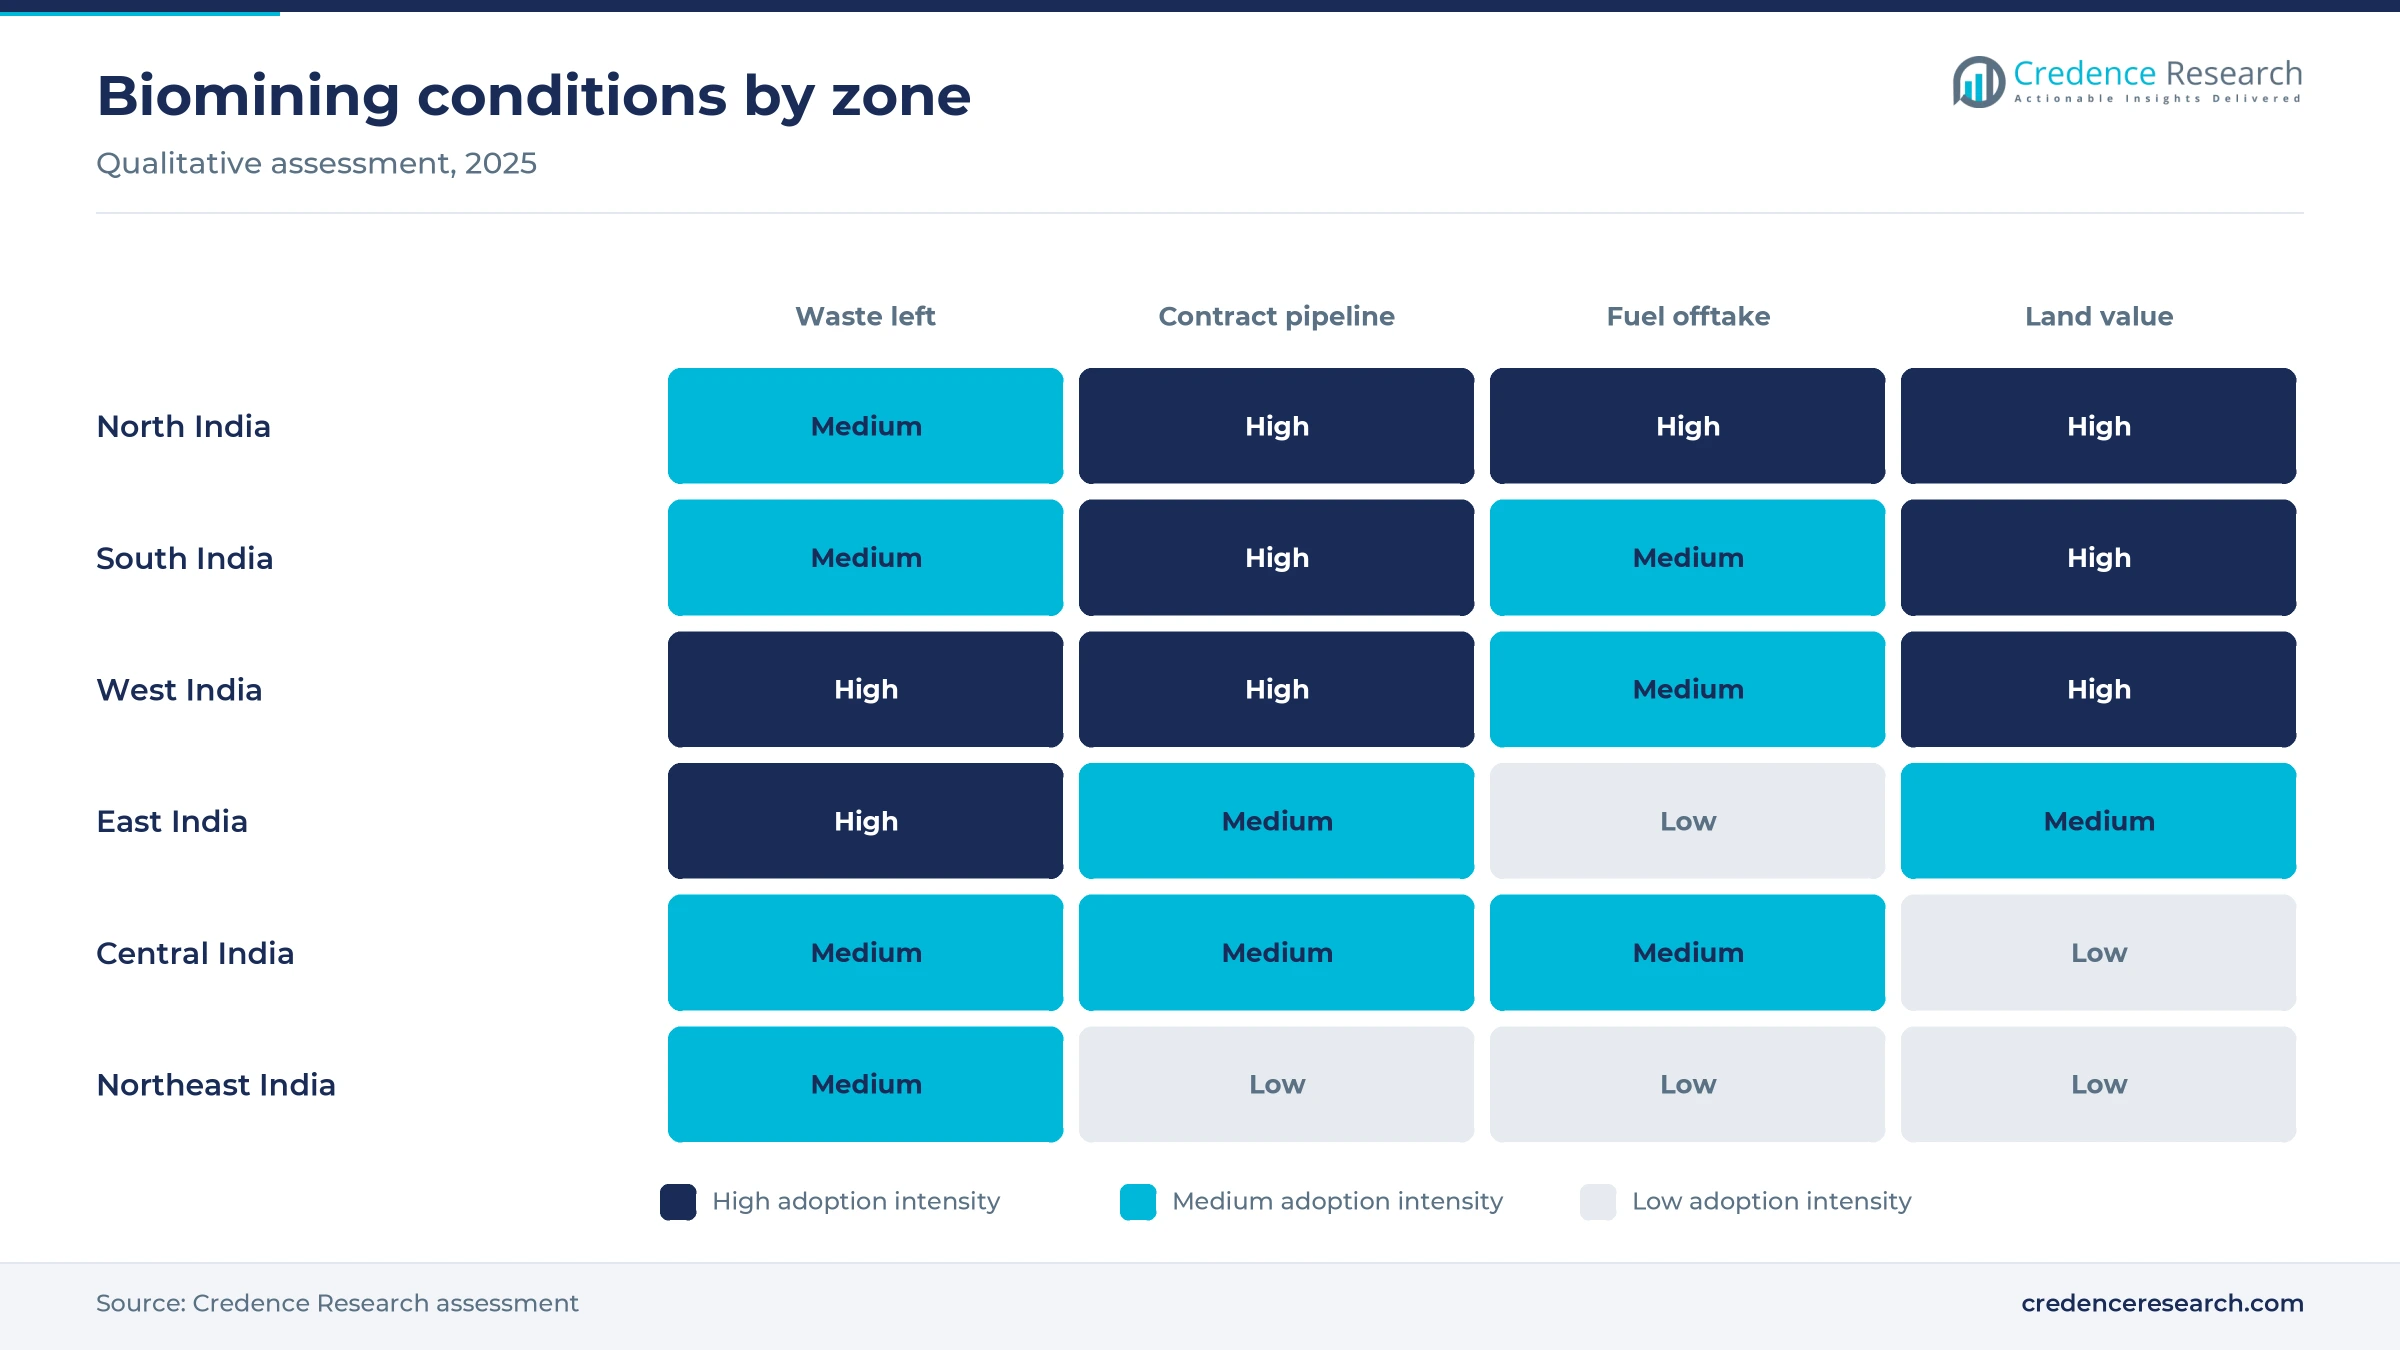
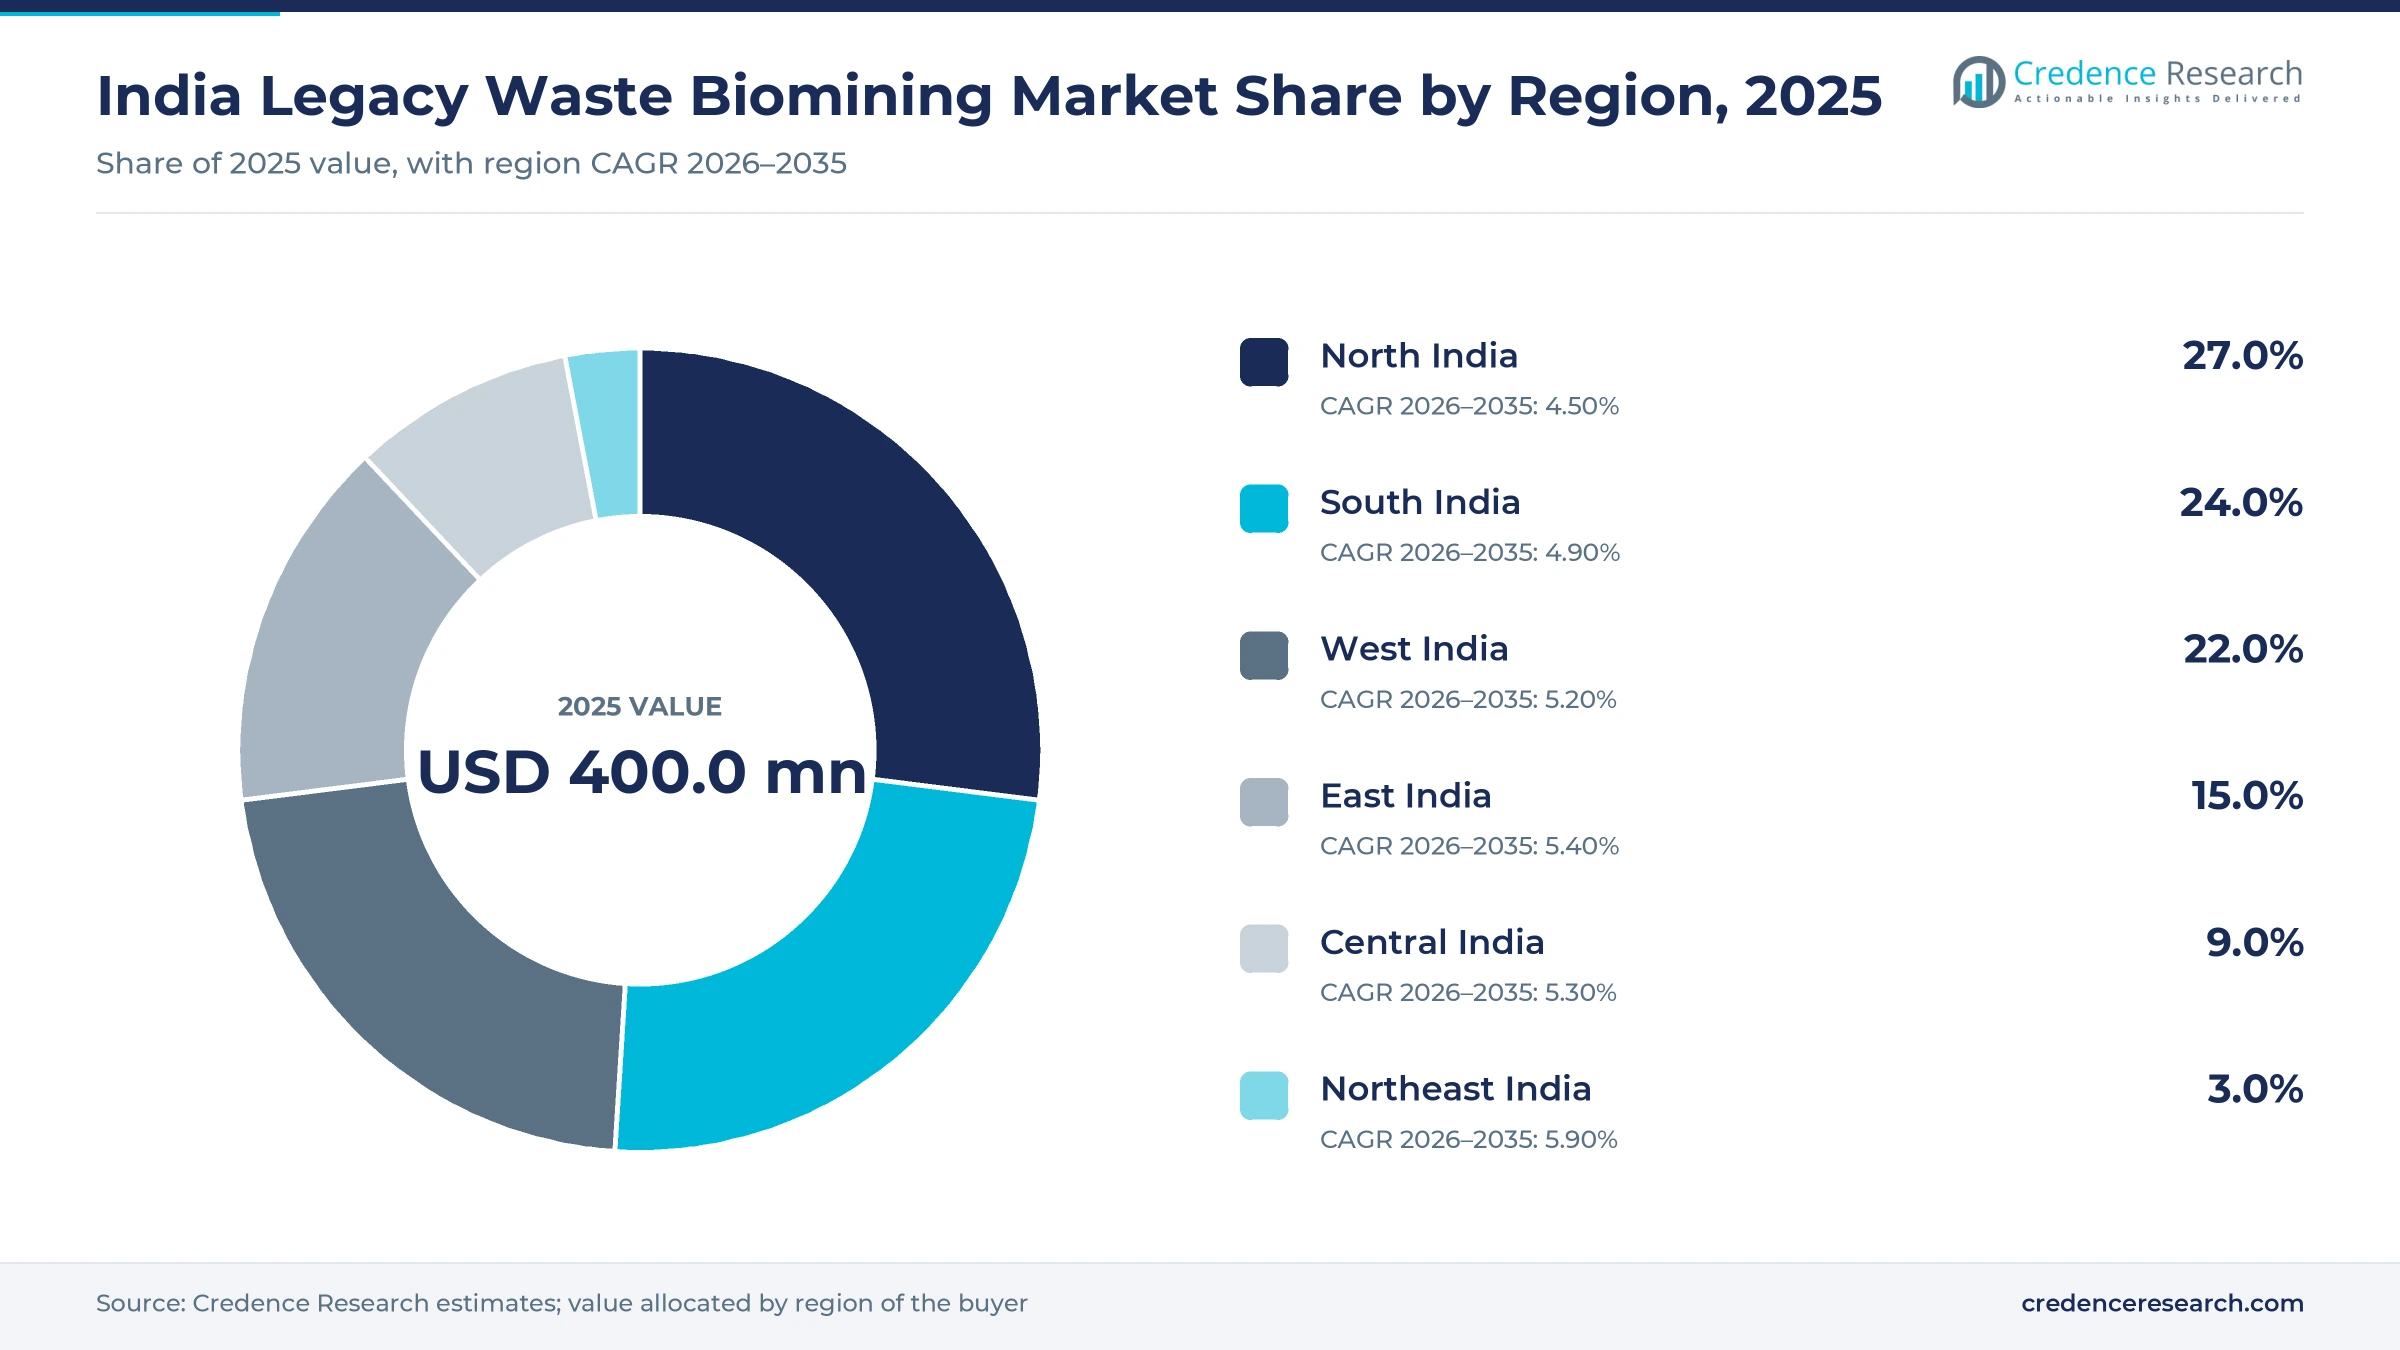
North India leads on Delhi's three landfill clearances
| Region | Value, 2025 (USD million) | Share, 2025 | CAGR, 2026–2035 |
|---|---|---|---|
| North India | 110.6 | 27.0% | 4.50% |
| South India | 98.3 | 24.0% | 4.90% |
| West India | 90.1 | 22.0% | 5.20% |
| East India | 61.4 | 15.0% | 5.40% |
| Central India | 36.9 | 9.0% | 5.30% |
| Northeast India | 12.3 | 3.0% | 5.90% |
North India leads on Delhi's three landfill clearances
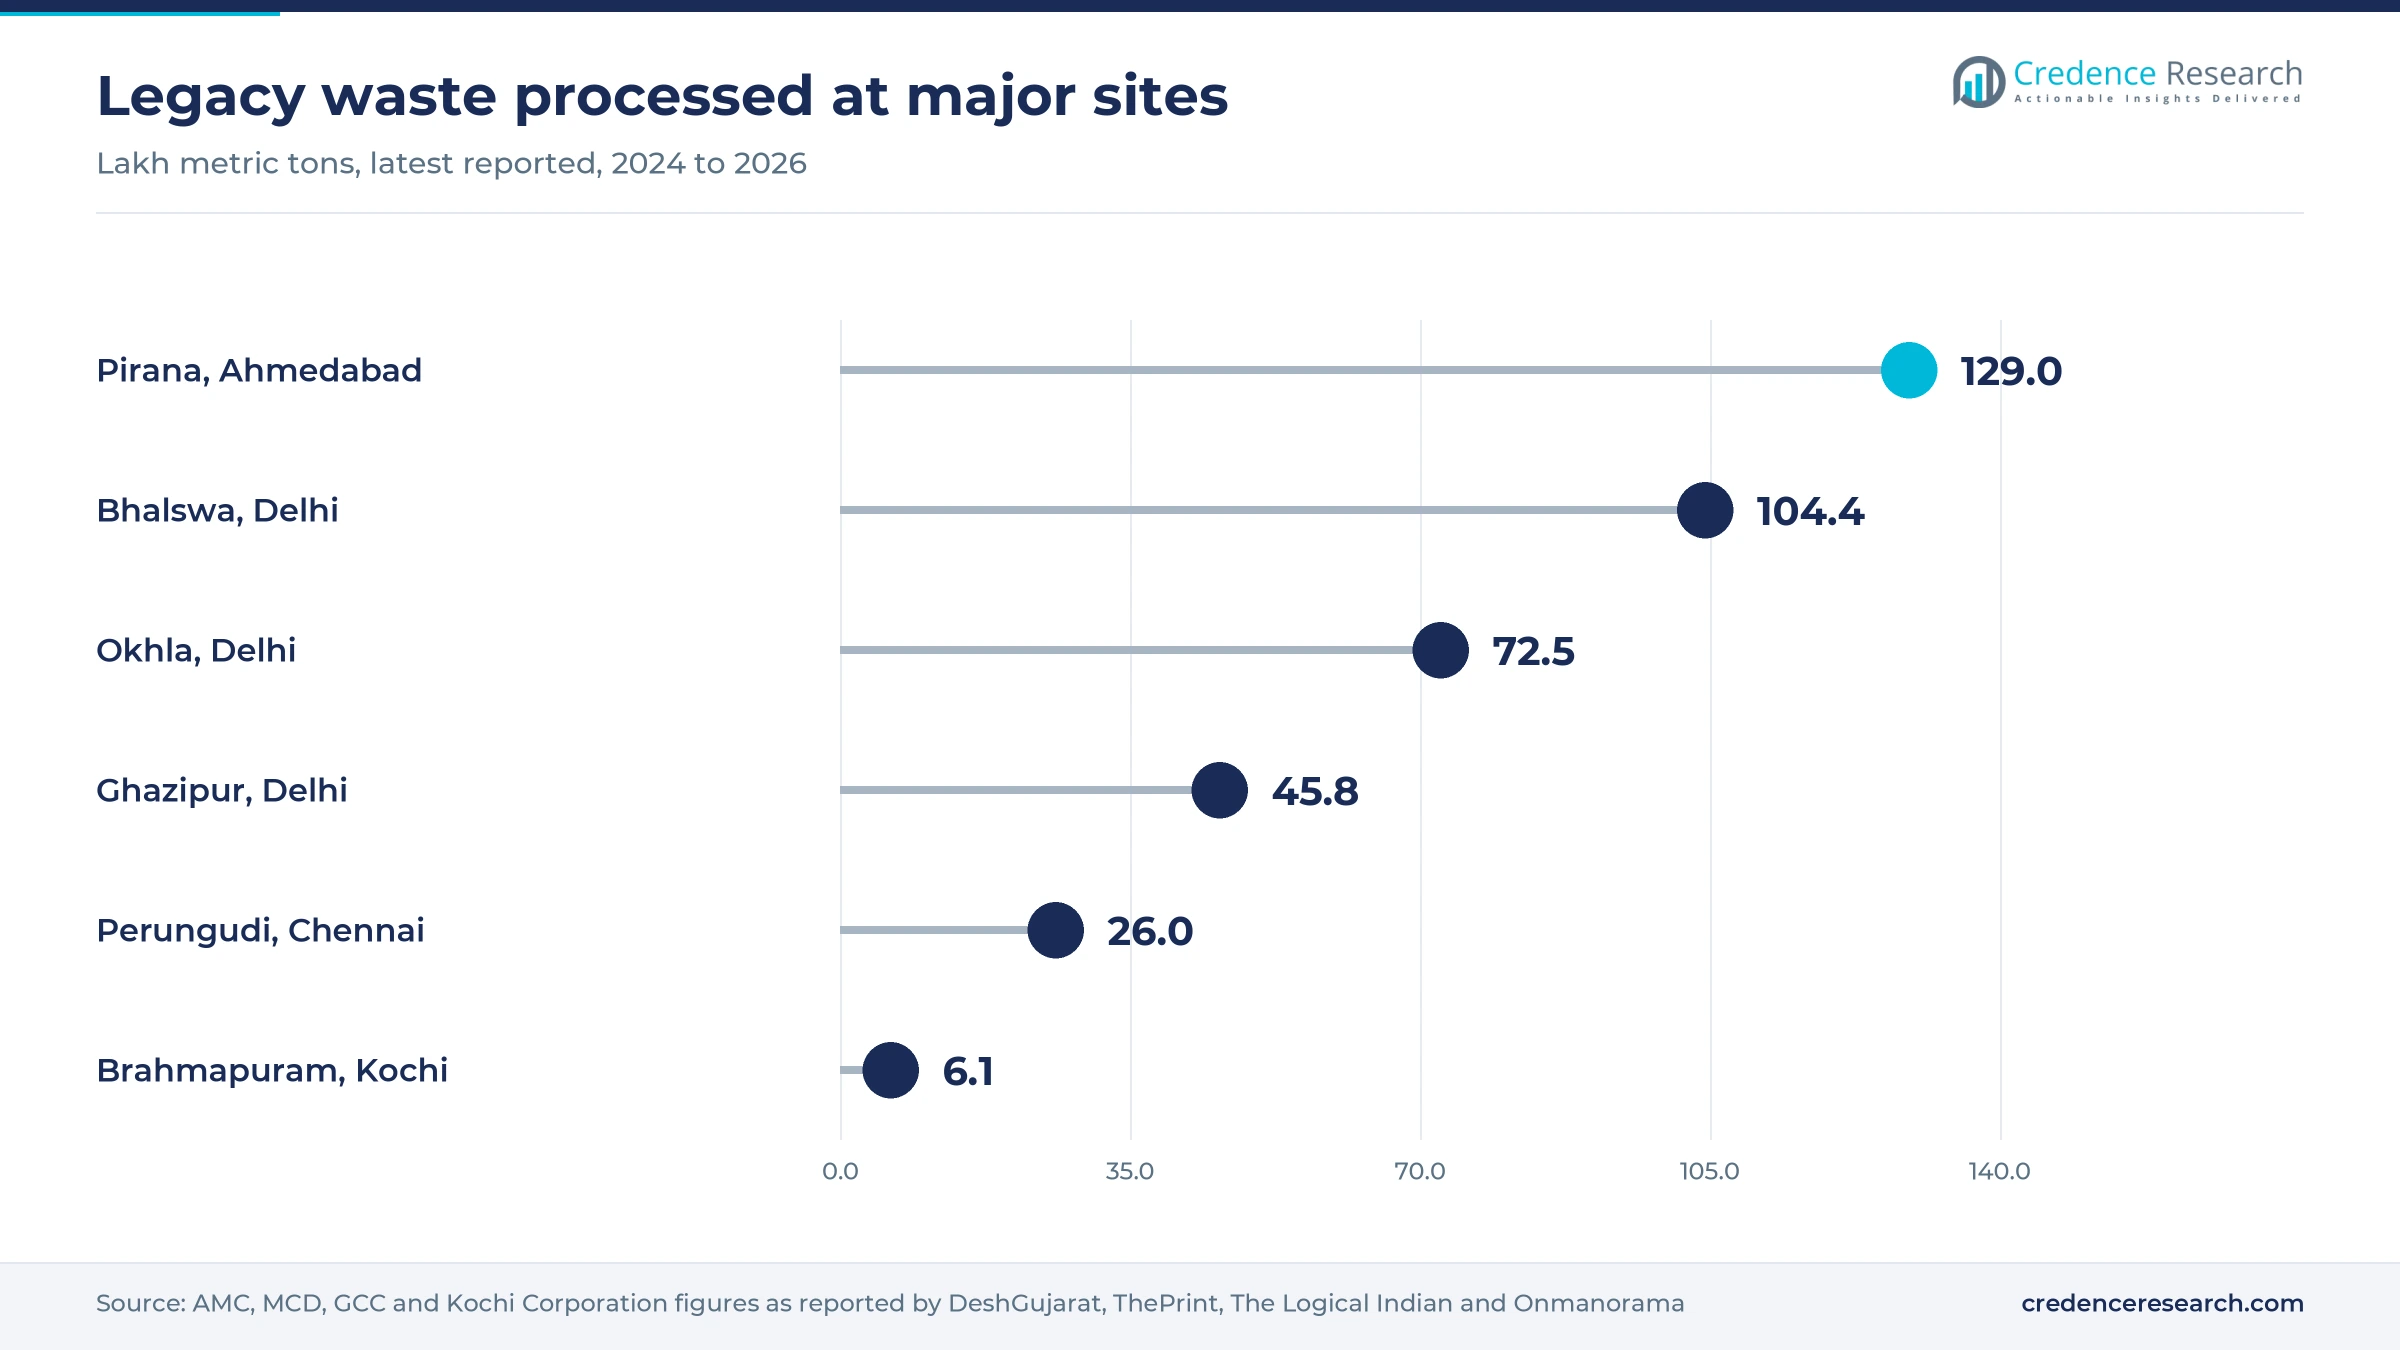
North India held a 27.0% share of 2025 value and grows at 4.50% a year, the largest base in the country. Okhla, Bhalswa and Ghazipur had cleared about 216 lakh metric tons by August 2026, yet Ghazipur still held 63.43 lakh metric tons in October 2026 against a December 2027 deadline. In Uttar Pradesh, Gorakhpur biomines about 400 metric tons a day on a 40-acre site, and Lucknow supplies recovered fuel to 31 industrial users. Growth in the zone slows after 2027 as Delhi's three sites close.
South India grows on Chennai and Kochi sites
South India held a 24.0% share of 2025 value and grows at 4.90% a year. Chennai's Kodungaiyur packages cover 66.52 lakh metric tons, while Perungudi had processed nearly 26 lakh metric tons by January 2026. Kochi had removed about 608,325 of 843,000 metric tons at Brahmapuram by February 2025, Onmanorama reported, where Bharat Petroleum was then setting up one of the state's compressed biogas plants. Karnataka lagged with under 10% remediation in August 2023, which leaves work for its cities.
West India grows on Deonar and Pune tenders
West India held a 22.0% share of 2025 value and grows at 5.20% a year. Mumbai's Deonar project covers 185 lakh metric tons over three years from late 2025, one of the largest single awards in the country. Pune approved tenders for 28 lakh metric tons at Fursungi in October 2025, and CIDCO's 8.6 lakh metric ton site near Taloja runs for 730 days. Gujarat, by contrast, had cleared 210 of 221 lakh metric tons by October 2024, so its remaining work is small.
East India grows as Kolkata works through Dhapa
East India held a 15.0% share of 2025 value and grows at 5.40% a year, faster than the national rate. Kolkata planned to process 40 lakh metric tons of legacy waste at Dhapa over three years at an estimated Rs 260 crore, Millennium Post reported in July 2021, on a site spread over 45 hectares. West Bengal and Odisha were among the lagging states on the national dashboard in August 2023, Down To Earth reported. Work in the zone is therefore still at an early stage.
Central India gains from highway reuse of inert fill
Central India held a 9.0% share of 2025 value and grows at 5.30% a year. On March 22, 2026, more than 400 metric tons of legacy waste from Bhopal's Adampur site were layered into NH-146 between Bhopal and Sagar, which gives contractors an outlet for inert material. Chhattisgarh's seven co-processing units support its strong remediation record, Down To Earth noted in 2023. Highway and cement outlets near sites keep handling costs lower than in hill states.
Northeast India starts with Guwahati's Boragaon mound
Northeast India held a 3.0% share of 2025 value and grows at 5.90% a year, the fastest rate of any zone. Guwahati's Paschim Boragaon project covers 15 lakh to 17 lakh metric tons with a 36-month deadline, and Zigma Global Environ Solutions holds the contract. Assam, Meghalaya, Manipur, Nagaland and Sikkim were in the lagging group in 2023, and hilly terrain raises the cost of moving recovered material. Growth therefore stays small in absolute terms from this low starting base.
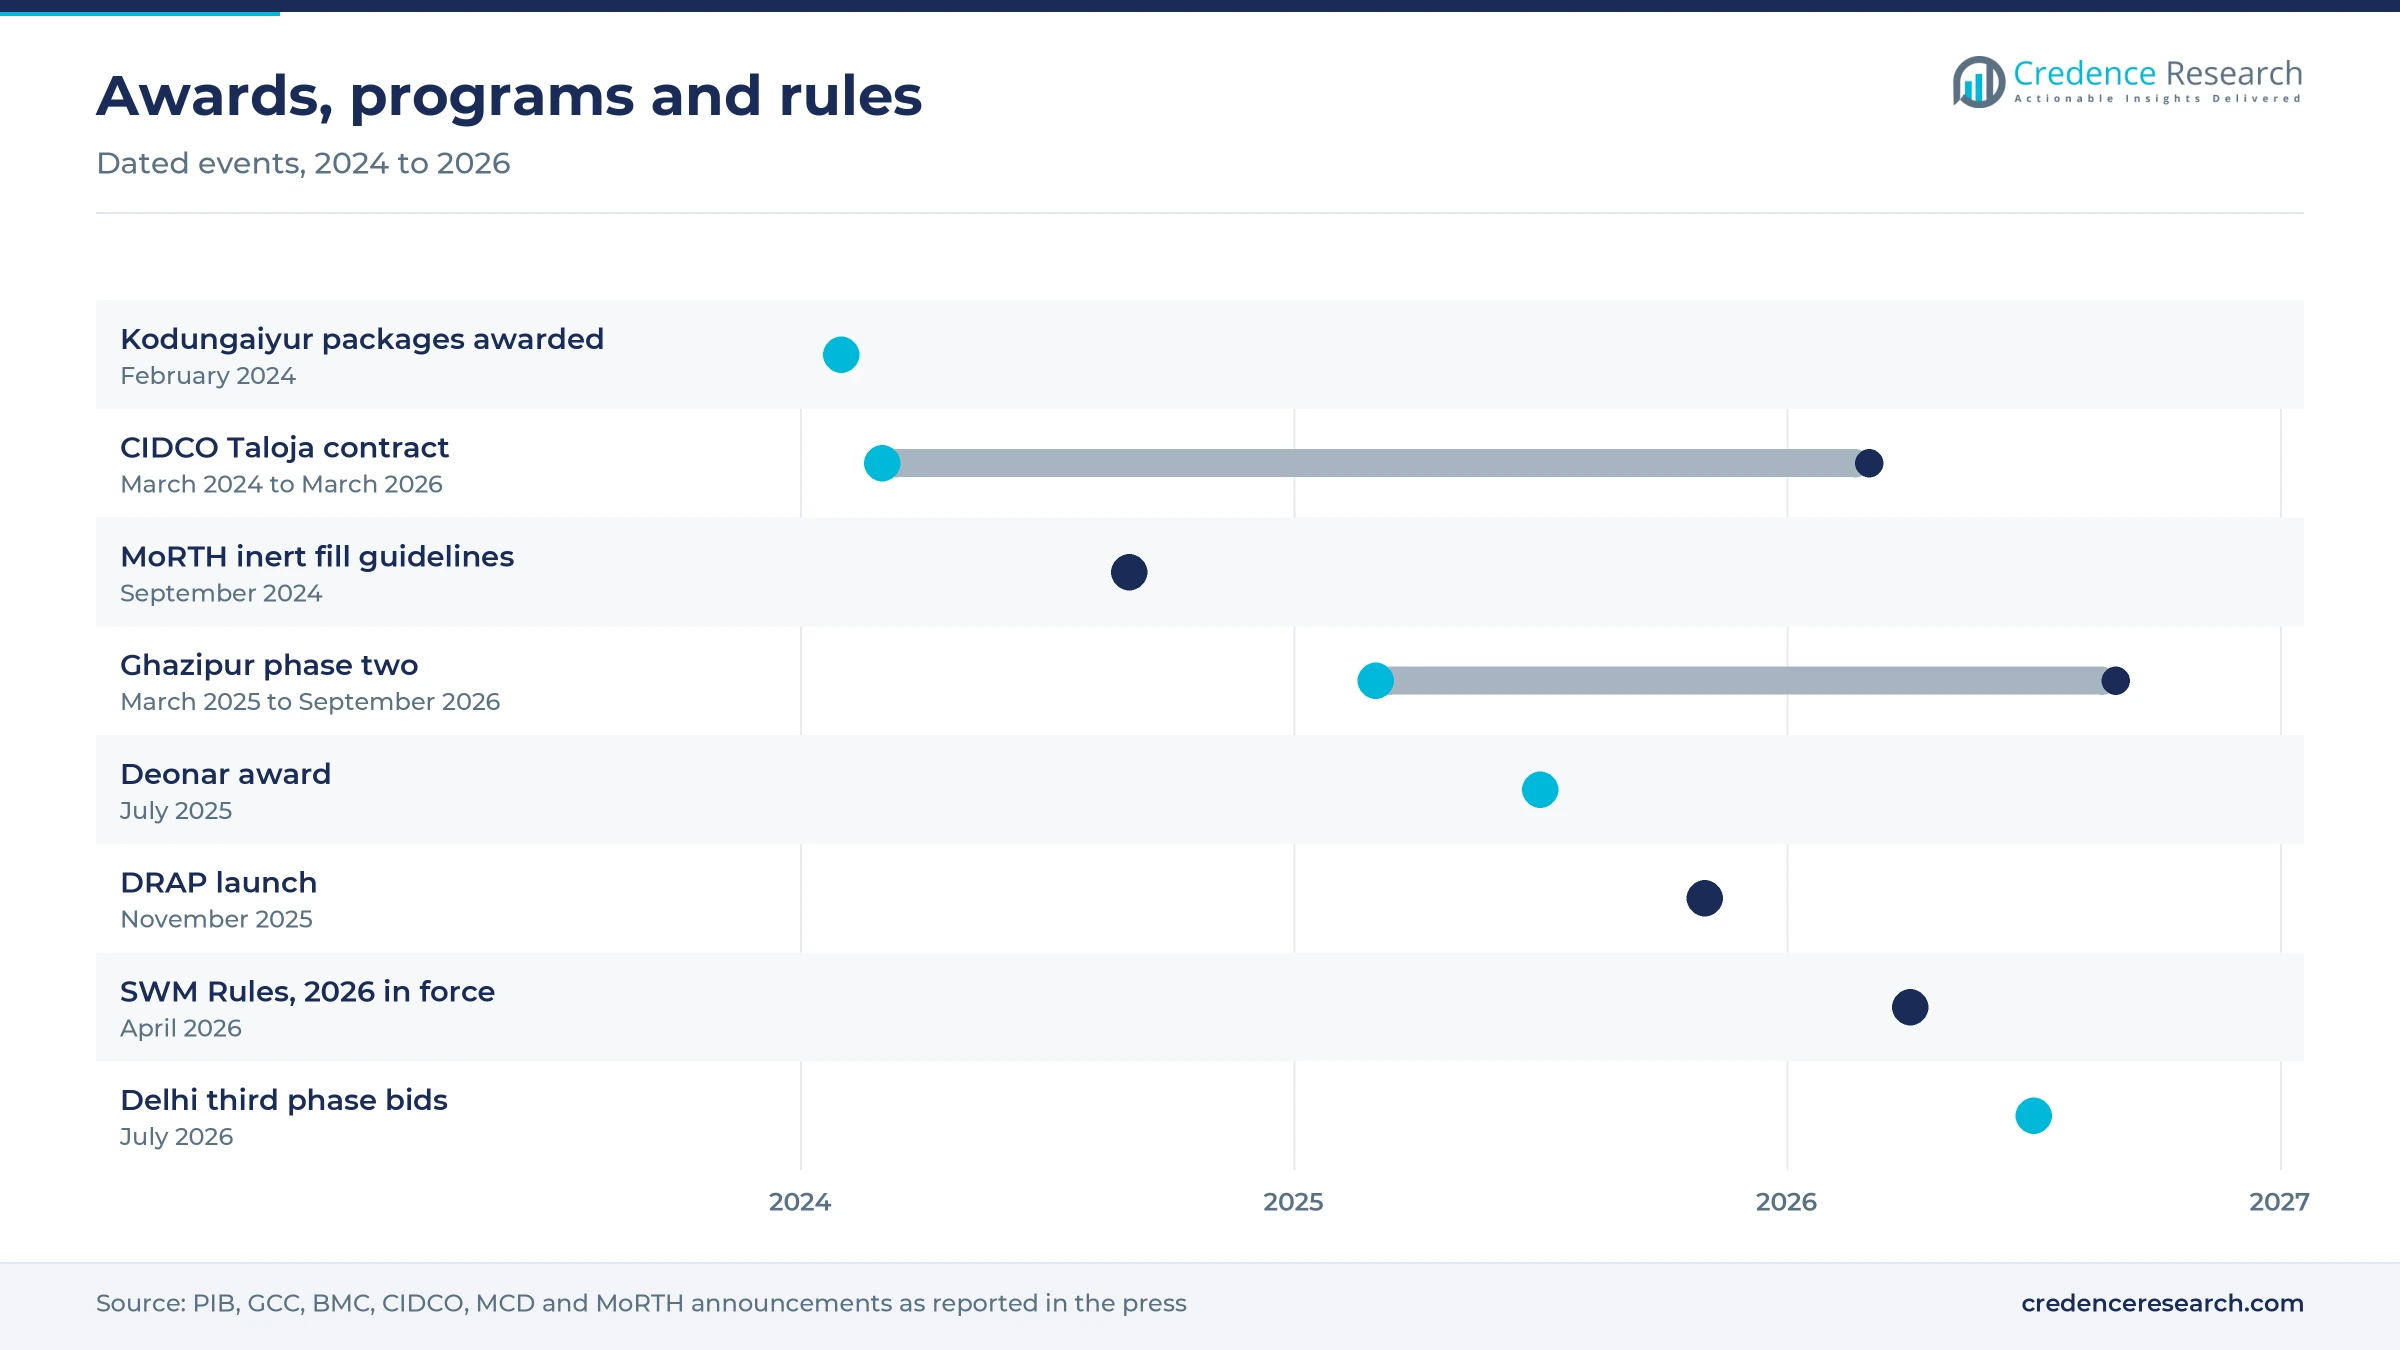
Deonar, DRAP and new rules mark 2024 to 2026
| Development | Status and market relevance |
|---|---|
| In February 2024, Greater Chennai Corporation awarded six Kodungaiyur biomining packages worth Rs 640.83 crore to Zigma, Ramky Infrastructure and Ascent e-Digit. | Awarded; Rs 963.23 a metric ton, two-year completion |
| In March 2024, Antony Waste Handling Cell won a Rs 77 crore CIDCO contract to biomine 8.6 lakh metric tons near Taloja. | Awarded; 730 days with material recovery facility sorting |
| In July 2025, the Brihanmumbai Municipal Corporation awarded the Rs 2,540 crore Deonar project to Navayuga Engineering Company. | Under way since late 2025; 185 lakh metric tons over three years |
| In November 2025, the Ministry of Housing and Urban Affairs launched the Dumpsite Remediation Accelerator Programme for 214 sites. | Live; projects worth Rs 6,700 crore approved |
| In April 2026, the Solid Waste Management Rules, 2026 took effect, requiring time-bound biomining of old dumpsites. | In force; quarterly progress reporting and higher fuel substitution |
Trommels, drones and sorting lines raise site output
- Trommel screens separate dried legacy waste into soil-like fines, combustibles and coarse inert, and Ghazipur's lines ran at about 7,000 metric tons a day in 2026.
- Drone volume surveys measure what is left on a mound, as the April 2026 survey at Ghazipur did when it found 67.81 lakh metric tons.
- Material recovery lines sort fuel, compost, inert material and soil in one flow, as at the CIDCO site near Taloja.
- Gas and fire monitoring tracks landfill gas and hot spots during excavation, a need shown by the March 2023 fire at Brahmapuram.
Need a Custom Version of This Report?
Tailor the scope, geography, or segments to your exact requirements.
- Custom geography or segment scope
- Direct access to our analyst team
Specialist contractors compete on rate and throughput
Competition in Indian legacy waste biomining centers on municipal tenders where the lowest rate per metric ton usually wins. Zigma Global Environ Solutions, based in Erode, holds three Kodungaiyur packages and the Paschim Boragaon contract in Guwahati, while Ramky Infrastructure and Ascent e-Digit Solutions share the other Kodungaiyur work. Navayuga Engineering Company won Mumbai's Deonar project, the largest single award so far. Antony Waste Handling Cell works through its subsidiary Antony Lara Enviro Solutions at the CIDCO site near Taloja, and Bhumi Green Energy holds the Brahmapuram contract in Kochi. Winners combine enough trommels to meet daily targets, trucks and buyer contracts for the fuel fraction, and outlets such as highway embankments for inert fill.
Companies profiled and their roles in this market
| Company | Type | Role in the market |
|---|---|---|
| Zigma Global Environ Solutions | Biomining contractor | Three Kodungaiyur packages; Paschim Boragaon in Guwahati |
| Navayuga Engineering Company | EPC contractor | Deonar project for 185 lakh metric tons in Mumbai |
| Antony Waste Handling Cell | Waste services operator | CIDCO biomining and resource recovery near Taloja |
| Ramky Infrastructure | EPC contractor | Two Kodungaiyur packages in Chennai |
| Bhumi Green Energy | Biomining contractor | Brahmapuram dumping yard in Kochi |
| Ascent e-Digit Solutions | Biomining contractor | One Kodungaiyur package in Chennai |
Operators with fuel and fill outlets will win share
Credence Research's view is that contractors with assured outlets for fuel and inert fill will take share as the legacy waste biomining market grows from USD 409.5 million in 2025. Rates per metric ton now range from Rs 550 in Pune to Rs 1,690 in Kochi, and the spread is mostly explained by how far recovered fuel must travel. The 2026 rules and the 2024 highway guidelines widen those outlets for contractors. RDF supply grows fastest at 6.16% a year, so fuel logistics will become a larger part of contract value by 2035.
How the per-ton remediation model was built
The report uses 2025 as the base year and forecasts to 2035. Market values come from the Credence Research model, built bottom-up from reported remediation volumes, contract rates per metric ton, and estimates for fuel supply and land reclamation work. Regional, scope, contract and state splits are Credence Research estimates. Inputs include Press Information Bureau releases, national rules, municipal awards and tenders reported in the press, World Bank urban population data and company announcements. The report did not conduct interviews or surveys, and it relies only on published sources.
Large city sites and new rules carry work to 2035
Through 2035 the market grows at a 5.00% CAGR to reach USD 667.1 million, as large city mounds such as Deonar and Ghazipur are cleared and later sites in the east and northeast go to tender. World Bank data put India's urban population at about 522 million in 2025, or 35.7% of the total, which keeps pressure on city land. North India loses share as Delhi's sites close, while West, East and Northeast India gain. Fuel supply and land handover will make up a larger part of each contract.
Frequently Asked Questions
How big is the India legacy waste biomining market?
Which region leads the market?
Which scope holds the largest share?
Which scope grows fastest?
How much legacy waste does India hold?
Which companies are active in the market?
What are the main challenges for contractors?
What is the largest biomining contract in India?
Table of Content
Chapter 1 Market Segmentation
- 1.1 Segmentation Framework
- 1.1.1 Product and Service Classification
- 1.1.2 Application and End-Use Classification
- 1.1.3 Technology and Solution Classification
- 1.1.4 Customer and Distribution Channel Classification
- 1.1.5 Geographic Segmentation
- 1.1.6 Market Segment Definitions and Boundaries
- 1.2 By Scope
- 1.2.1 Excavation & Segregation
- 1.2.2 RDF Supply
- 1.2.3 Land Reclamation
- 1.3 By Contract
- 1.3.1 Per-Ton
- 1.3.2 EPC
- 1.4 By State
- 1.4.1 Maharashtra
- 1.4.2 Delhi
- 1.4.3 Uttar Pradesh
- 1.4.4 Gujarat
- 1.4.5 Others
Chapter 2 Introduction
- 2.1 Report Objectives and Scope
- 2.2 Product Definition and Industry Terminology
- 2.3 Market Inclusions and Exclusions
- 2.4 Research Process
- 2.4.1 Primary Research and Expert Interviews
- 2.4.2 Secondary Research and Source Review
- 2.4.3 Top-Down and Bottom-Up Estimation
- 2.4.4 Data Triangulation and Verification
- 2.5 Market Size Measurement Basis
- 2.5.1 2025: USD 409.5 million → 2035: USD 667.1 million
- 2.6 Historical and Forecast Reference Periods
- 2.6.1 Historical Period: 2018-2025
- 2.6.2 Base Year: 2025
- 2.6.3 Forecast Period: 2025-2035
- 2.7 Research Assumptions and Limitations
Chapter 3 Executive Summary
- 3.1 Market Snapshot and Key Findings
- 3.2 Base-Year Market Size, 2025
- 3.3 Forecast Market Size, 2035
- 3.4 Revenue and Volume Growth Outlook
- 3.5 Key Demand and Supply Indicators
- 3.6 Leading Market Segments
- 3.7 Fastest-Growing Market Opportunities
- 3.8 Regional Performance Highlights
- 3.9 Technology and Industry Transformation
- 3.10 Competitive Landscape Summary
- 3.11 Analyst View and Strategic Implications
Chapter 4 India Legacy Waste Biomining Market Trends and Developments
- 4.1 Historical Industry Development, 2018-2025
- 4.2 Recent Market Trends and Developments
- 4.3 Demand and Customer Behavior Trends
- 4.4 Technology and Product Innovation
- 4.5 Artificial Intelligence, Automation and Digitalization
- 4.6 Local Manufacturing and Supply Chain Realignment
- 4.7 Industry Partnerships, Mergers and Acquisitions
- 4.8 Sustainability and Circular Economy Developments
- 4.9 Government and Private Sector Investment Trends
- 4.10 Emerging Business Models and Commercialization
- 4.11 Industry Developments and Announcements
Chapter 5 India Legacy Waste Biomining Market Production, Supply and Demand Analysis
- 5.1 Demand Trend and Consumption Analysis, 2018-2025
- 5.2 Demand Forecast, 2025-2035
- 5.3 Production and Output Trend, 2018-2025
- 5.4 Production and Output Forecast, 2025-2035
- 5.5 Installed Capacity and Capacity Utilization
- 5.6 Company-Wise Production Plants and Statistics
- 5.6.1 Installed Production Capacity
- 5.6.2 Actual Production
- 5.6.3 Planned Capacity and Expansion Targets
- 5.7 Supply Chain Structure and Procurement Trends
- 5.8 Supply-Demand Gap and Bottlenecks
- 5.9 Import Dependence and Sourcing Structure
- 5.10 Contract Manufacturing and Outsourcing
- 5.11 Regional Supply and Demand Concentration
Chapter 6 India Legacy Waste Biomining Market Pricing Analysis
- 6.1 Pricing Structure and Measurement
- 6.2 Historical Pricing Trends, 2018-2025
- 6.3 Pricing Outlook, 2025-2035
- 6.4 Average Selling Price and Unit Economics
- 6.5 Pricing by Product and Market Segment
- 6.6 Geographic Pricing Differences
- 6.7 Key Input, Energy, Labor and Logistics Costs
- 6.8 Contract Pricing and Purchasing Models
- 6.9 Pricing Sensitivity and Competitive Positioning
- 6.10 Price, Margin and Profitability Implications
Chapter 7 India Legacy Waste Biomining Market Dynamics
- 7.1 Market Growth Drivers
- 7.1.1 Demand-Side Drivers
- 7.1.2 Technology and Innovation Drivers
- 7.1.3 Infrastructure and Investment Drivers
- 7.1.4 Regulatory and Policy Drivers
- 7.2 Market Restraints
- 7.2.1 Cost and Affordability Constraints
- 7.2.2 Technology and Adoption Barriers
- 7.2.3 Supply Chain and Operational Constraints
- 7.3 Market Challenges
- 7.3.1 Competitive Pressure and Margin Erosion
- 7.3.2 Skills, Infrastructure and Implementation Gaps
- 7.4 Emerging Market Opportunities
- 7.5 Market Dynamics Impact and Time-Horizon Assessment
Chapter 8 India Legacy Waste Biomining Value Chain Analysis
- 8.1 Industry Value Chain Overview
- 8.2 Upstream Suppliers and Critical Inputs
- 8.3 Technology and Component Providers
- 8.4 Manufacturing or Service Delivery
- 8.5 Distribution, Channel Partners and Integrators
- 8.6 Downstream Applications and End Users
- 8.7 Value Addition and Profit Pools
- 8.8 Vertical Integration and Outsourcing
- 8.9 Supplier Concentration and Risk
- 8.10 Supply Chain Localization and Resilience
Chapter 9 India Legacy Waste Biomining Market Regulations and Policies
- 9.1 Relevant Laws, Standards and Compliance Frameworks
- 9.2 Product, Service, Safety and Quality Requirements
- 9.3 Government Policies, Incentives and Subsidies
- 9.4 Imports, Exports and Trade Barriers
- 9.5 Public Procurement and Local Content Requirements
- 9.6 Environmental and Sustainability Compliance
- 9.7 Upcoming Policy Changes and Market Implications
Chapter 10 India Legacy Waste Biomining Market Hotspots and Opportunities
- 10.1 Market Opportunity Mapping and Growth Hotspots
- 10.2 High-Growth Applications and Customer Groups
- 10.3 Underserved Markets and White-Space Opportunities
- 10.4 Emerging Technology and Product Opportunities
- 10.5 New Capacity and Investment Hotspots
- 10.6 Market Entry and Expansion Opportunities
- 10.7 Distribution and Partnership Opportunities
- 10.8 Near-Term and Long-Term Commercial Potential
- 10.9 Opportunity Attractiveness and Execution Risks
Chapter 11 India Legacy Waste Biomining Market Outlook, 2025-2035
- 11.1 Market Size and Analysis
- 11.1.1 Revenue (Market Measurement: 2025: USD 409.5 million → 2035: USD 667.1 million)
- 11.1.2 Market Volume and Quantity Sold
- 11.1.3 Historical Market Size, 2018-2025
- 11.1.4 Base-Year Market Size, 2025
- 11.2 Market Forecast, 2025-2035
- 11.2.1 Revenue Forecast to 2035
- 11.2.2 Volume Forecast to 2035
- 11.2.3 CAGR and Year-on-Year Growth
- 11.2.4 Incremental Revenue Opportunity
- 11.3 Forecast Assumptions and Scenario Analysis
- 11.3.1 Base-Case Forecast
- 11.3.2 Optimistic and Conservative Scenarios
- 11.3.3 Technology, Pricing and Policy Sensitivities
- 11.4 Market Attractiveness and Growth Outlook
Chapter 12 India Legacy Waste Biomining Market Segmentation and Outlook
- 12.1 Segmentation Summary and Market Shares, 2025
- 12.2 Largest and Fastest-Growing Segments
- 12.3 By Scope - Market Size and Forecast, 2025-2035
- 12.3.1 Segment Definition and Scope
- 12.3.2 Historical Market Size, 2018-2025
- 12.3.3 Revenue Forecast, 2025-2035
- 12.3.4 Volume Forecast, 2025-2035
- 12.3.5 Base-Year Market Share, 2025
- 12.3.6 Segment CAGR and Growth Drivers
- 12.3.7 Subsegment Market Size and Forecast
- 12.3.7.1 Excavation & Segregation
- 12.3.7.2 RDF Supply
- 12.3.7.3 Land Reclamation
- 12.3.8 Subsegment Pricing and Adoption Trends
- 12.3.9 Leading Suppliers and Competition
- 12.3.10 Regional Demand and Opportunities
- 12.4 By Contract - Market Size and Forecast, 2025-2035
- 12.4.1 Segment Definition and Scope
- 12.4.2 Historical Market Size, 2018-2025
- 12.4.3 Revenue Forecast, 2025-2035
- 12.4.4 Volume Forecast, 2025-2035
- 12.4.5 Base-Year Market Share, 2025
- 12.4.6 Segment CAGR and Growth Drivers
- 12.4.7 Subsegment Market Size and Forecast
- 12.4.7.1 Per-Ton
- 12.4.7.2 EPC
- 12.4.8 Subsegment Pricing and Adoption Trends
- 12.4.9 Leading Suppliers and Competition
- 12.4.10 Regional Demand and Opportunities
- 12.5 By State - Market Size and Forecast, 2025-2035
- 12.5.1 Segment Definition and Scope
- 12.5.2 Historical Market Size, 2018-2025
- 12.5.3 Revenue Forecast, 2025-2035
- 12.5.4 Volume Forecast, 2025-2035
- 12.5.5 Base-Year Market Share, 2025
- 12.5.6 Segment CAGR and Growth Drivers
- 12.5.7 Subsegment Market Size and Forecast
- 12.5.7.1 Maharashtra
- 12.5.7.2 Delhi
- 12.5.7.3 Uttar Pradesh
- 12.5.7.4 Gujarat
- 12.5.7.5 Others
- 12.5.8 Subsegment Pricing and Adoption Trends
- 12.5.9 Leading Suppliers and Competition
- 12.5.10 Regional Demand and Opportunities
- 12.6 Segment Growth Comparison
- 12.7 Segment Attractiveness and Priority Matrix
Chapter 13 India Legacy Waste Biomining Geographic Market Outlook, 2025-2035
- 13.1 Domestic Market Distribution and Demand Clusters
- 13.2 State- or Province-Wise Market Size and Forecast, 2025-2035
- 13.3 City and Metropolitan Market Outlook
- 13.4 Industrial, Manufacturing and Commercial Clusters
- 13.5 Geographic Concentration of Key End Users
- 13.6 Local Pricing and Purchasing Differences
- 13.7 Domestic Production Facilities and Capacity Map
- 13.8 Local Infrastructure and Project Pipeline
- 13.9 State-Level Policy and Incentive Differences
- 13.10 Subnational Investment Hotspots and Opportunities
- 13.11 Distribution and Logistics Networks
- 13.12 Domestic Competitive Footprint
Chapter 14 India Legacy Waste Biomining Technology, Innovation and Sustainability Outlook
- 14.1 Technology Landscape and Maturity
- 14.2 Product, Process and Service Innovation
- 14.3 AI, Automation and Digital Tools in the Industry
- 14.4 Technology Adoption and Performance Benchmarking
- 14.5 Innovation Pipeline and R&D Investment
- 14.6 Patent and Intellectual Property Trends
- 14.7 Energy Efficiency and Resource Management
- 14.8 Sustainability, Recycling and Circularity
- 14.9 Technology Roadmap, 2025-2035
- 14.10 Risks of Obsolescence and Technology Substitution
Chapter 15 India Legacy Waste Biomining Market Key Strategic Imperatives
- 15.1 Growth and Market Entry Priorities
- 15.2 High-Return Products and Segments
- 15.3 Pricing, Profitability and Cost Optimization
- 15.4 Technology Investment and Product Differentiation
- 15.5 Supply Chain Localization and Resilience
- 15.6 Distribution and Customer Acquisition
- 15.7 Partnership, Acquisition and Capacity Strategy
- 15.8 Regional Expansion Priorities
- 15.9 Short-, Medium- and Long-Term Actions
Chapter 16 Competition Outlook
- 16.1 Industry Competition Characteristics
- 16.2 Market Structure and Concentration
- 16.3 Market Share and Competitive Positioning, 2025
- 16.4 Company-Wise Revenue and Product Benchmarking
- 16.5 Production and Service Capacity Benchmarking
- 16.6 Technology, Pricing and Differentiation
- 16.7 Regional Footprint and Distribution Strength
- 16.8 Mergers, Acquisitions and Strategic Alliances
- 16.9 New Entrants and Competitive Threats
- 16.10 Porter's Five Forces and Industry Attractiveness
- 16.11 Competitive Outlook, 2025-2035
Chapter 17 Company Profiles
- 17.1 Company Coverage and Selection Criteria
- 17.2 Zigma Global Environ Solutions
- 17.2.1 Business Description
- 17.2.2 Company Ownership and Geographic Presence
- 17.2.3 Product and Service Portfolio
- 17.2.4 Manufacturing and Operating Footprint
- 17.2.5 Production Capacity and Expansion Plans
- 17.2.6 Financial Performance and Investment
- 17.2.7 Market Share and Competitive Position
- 17.2.8 Technology and Innovation Capabilities
- 17.2.9 Strategic Alliances or Partnerships
- 17.2.10 Recent Developments
- 17.2.11 Growth Strategy and Outlook
- 17.3 Antony Waste Handling Cell
- 17.4 Navayuga Engineering Company
- 17.5 Ramky Infrastructure
- 17.6 Bhumi Green Energy
- 17.7 Ascent e-Digit Solutions
- 17.8 Other Relevant Market Participants
Note: Every listed company is profiled on the structure shown under the first company. The company list is preliminary and may change based on research findings, market developments, data availability and client requirements.
Chapter 18 Disclaimer
- 18.1 Research and Forecast Disclaimer
- 18.2 Data Source and Estimation Limitations
Note: The depth of individual sections depends on data availability for this market. Volume, capacity, trade and other unit-based metrics are included where applicable.

