Resilience buyers and defense programs set the pace
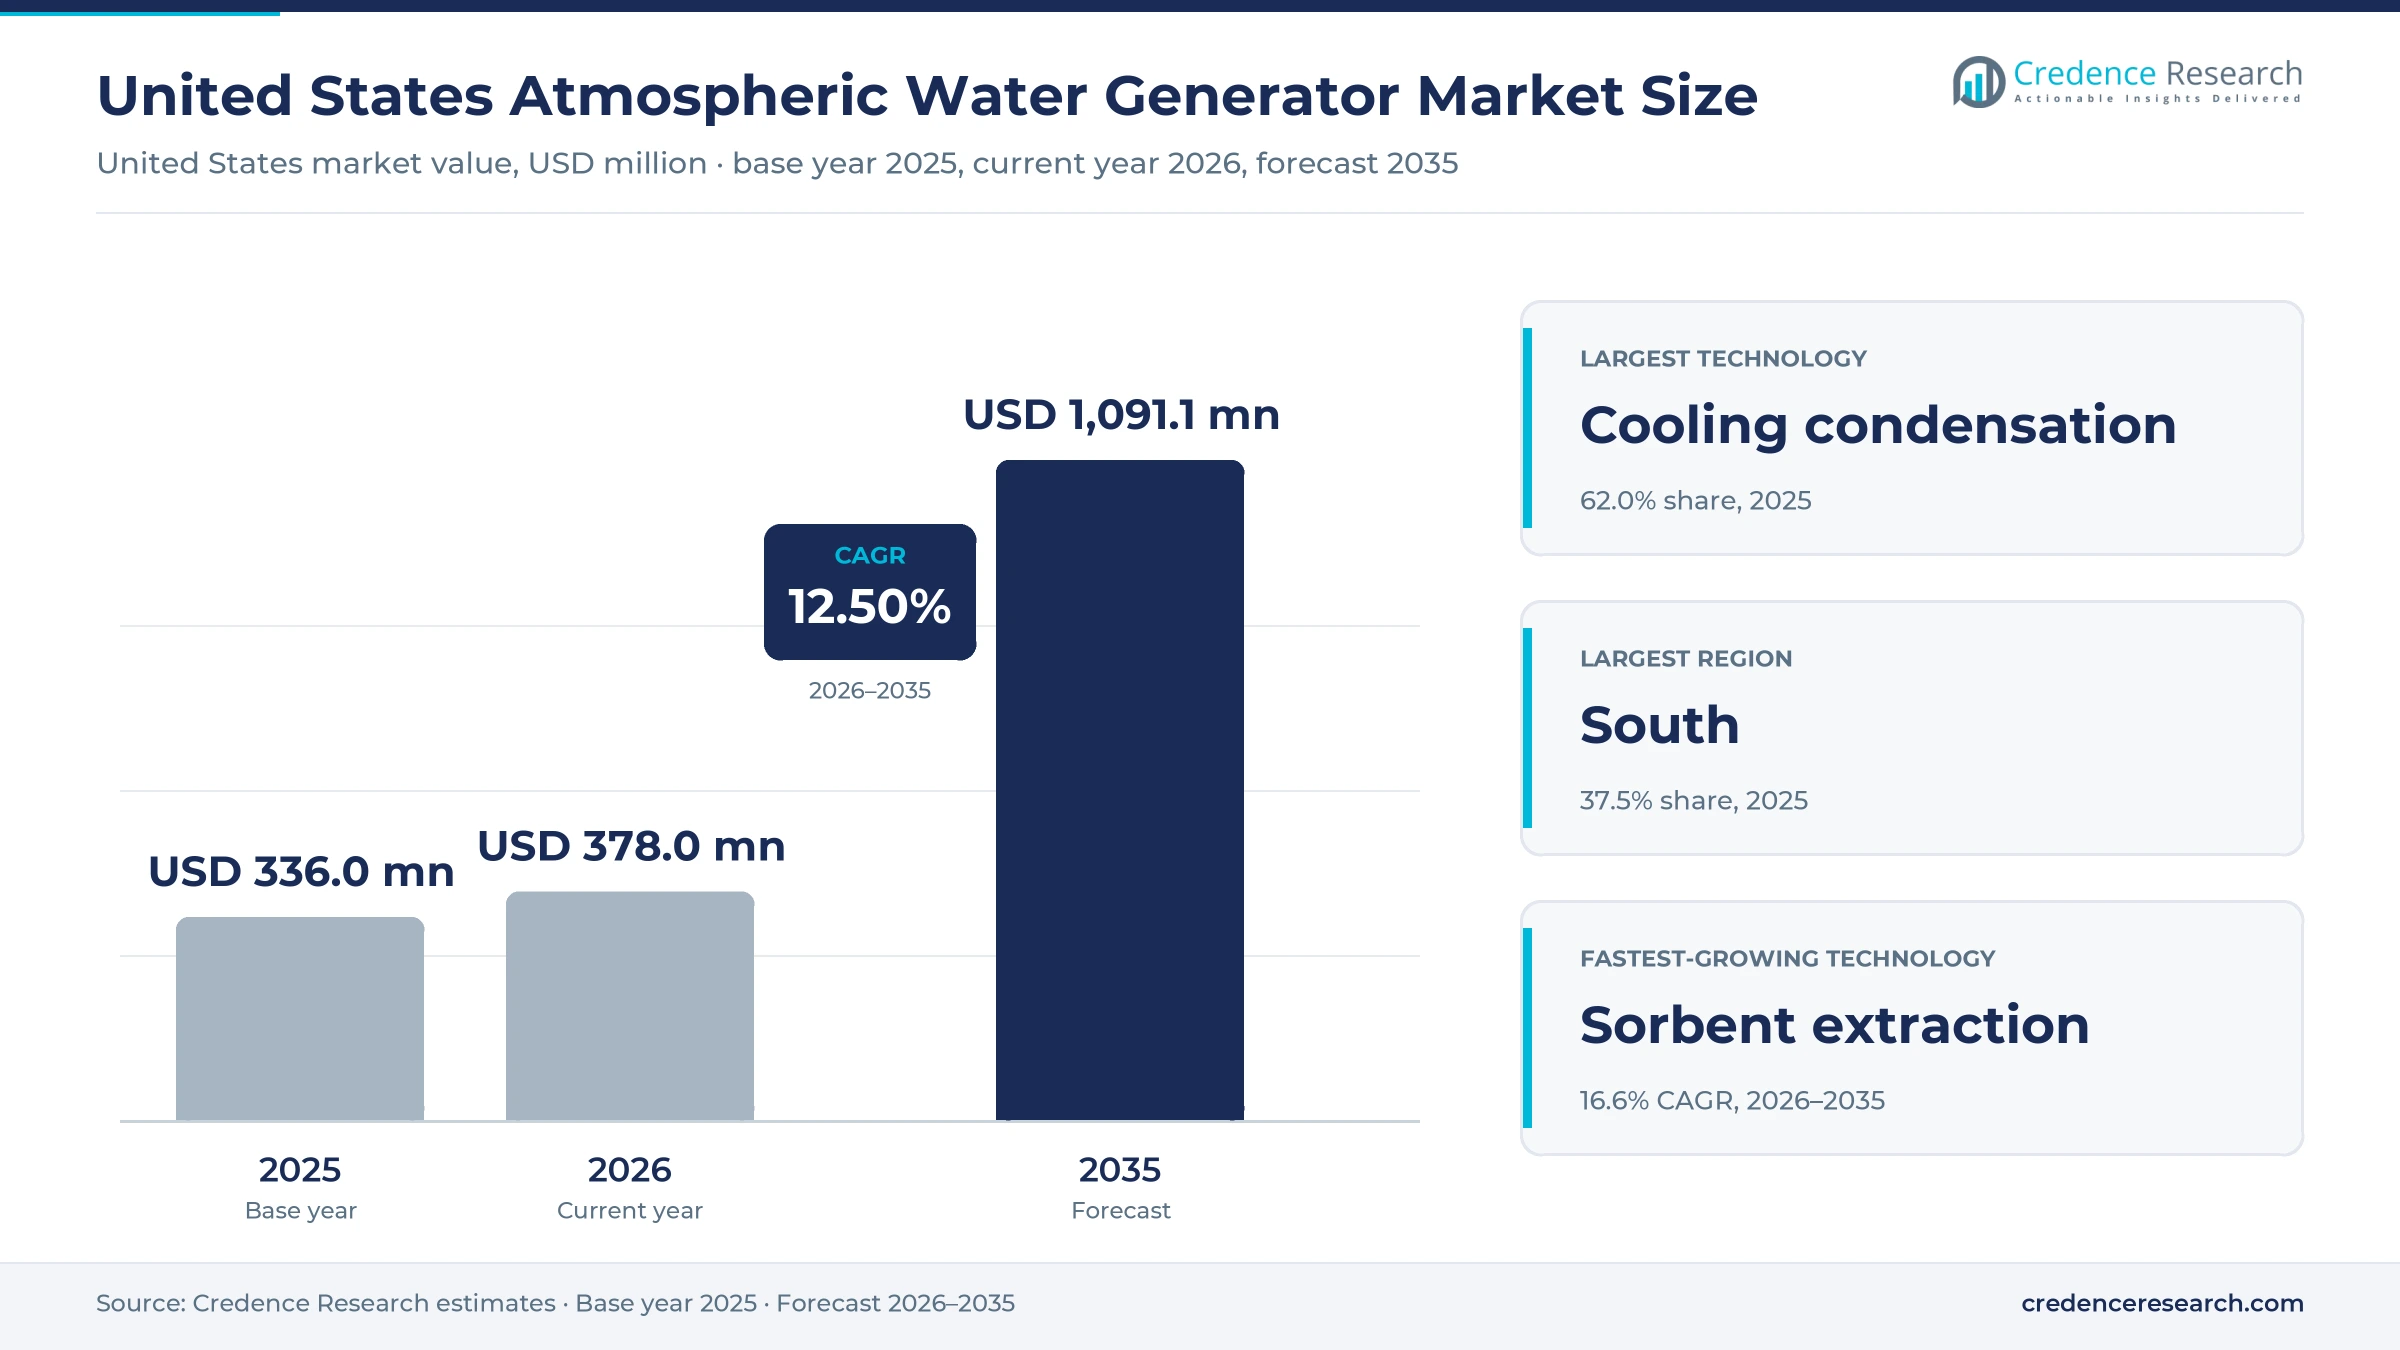
The United States atmospheric water generator market was valued at USD 336.0 million in 2025 and is projected to increase from USD 378.0 million in 2026 to USD 1.09 billion by 2035, registering a CAGR of 12.50% during 2026–2035. Demand for atmospheric water generators comes from hospitals, offices, homes, military units and remote communities that want potable supply which does not depend on a utility main or a delivery truck. The South held the largest regional share, 37.5% in 2025, because it combines the largest and fastest-growing population with repeated hurricane disruption of piped supply. The West is the fastest-growing region at 13.1% a year, as tribal, island and drought-exposed communities adopt off-grid systems. On the supply side, sorbent machines that run on low-grade waste heat are moving from Army and industrial demonstrations toward commercial launch, which widens the market beyond compressor-based condensation units and toward data centers.
Which systems and services the U.S. figures include
The market covers machines that extract potable water from ambient humidity and are sold, installed or serviced in the United States, from countertop home units to trailer-mounted and containerized systems. Values include hardware, installation and recurring filter, mineralization and maintenance services billed to the owner of the system.
Dehumidifiers that discard their condensate, bottled and delivered water, desalination plants and stand-alone point-of-use filters are excluded, although they shape the price that buyers compare against. The value chain runs from component makers of compressors, sorbents and heat exchangers to system builders, dealers, installers and service crews.
United States Atmospheric Water Generator Market Insights
- The market grows from USD 336.0 million in 2025 to USD 1.09 billion by 2035 at a 12.50% CAGR, as resilience, defense and industrial buyers replace delivered water with onsite supply.
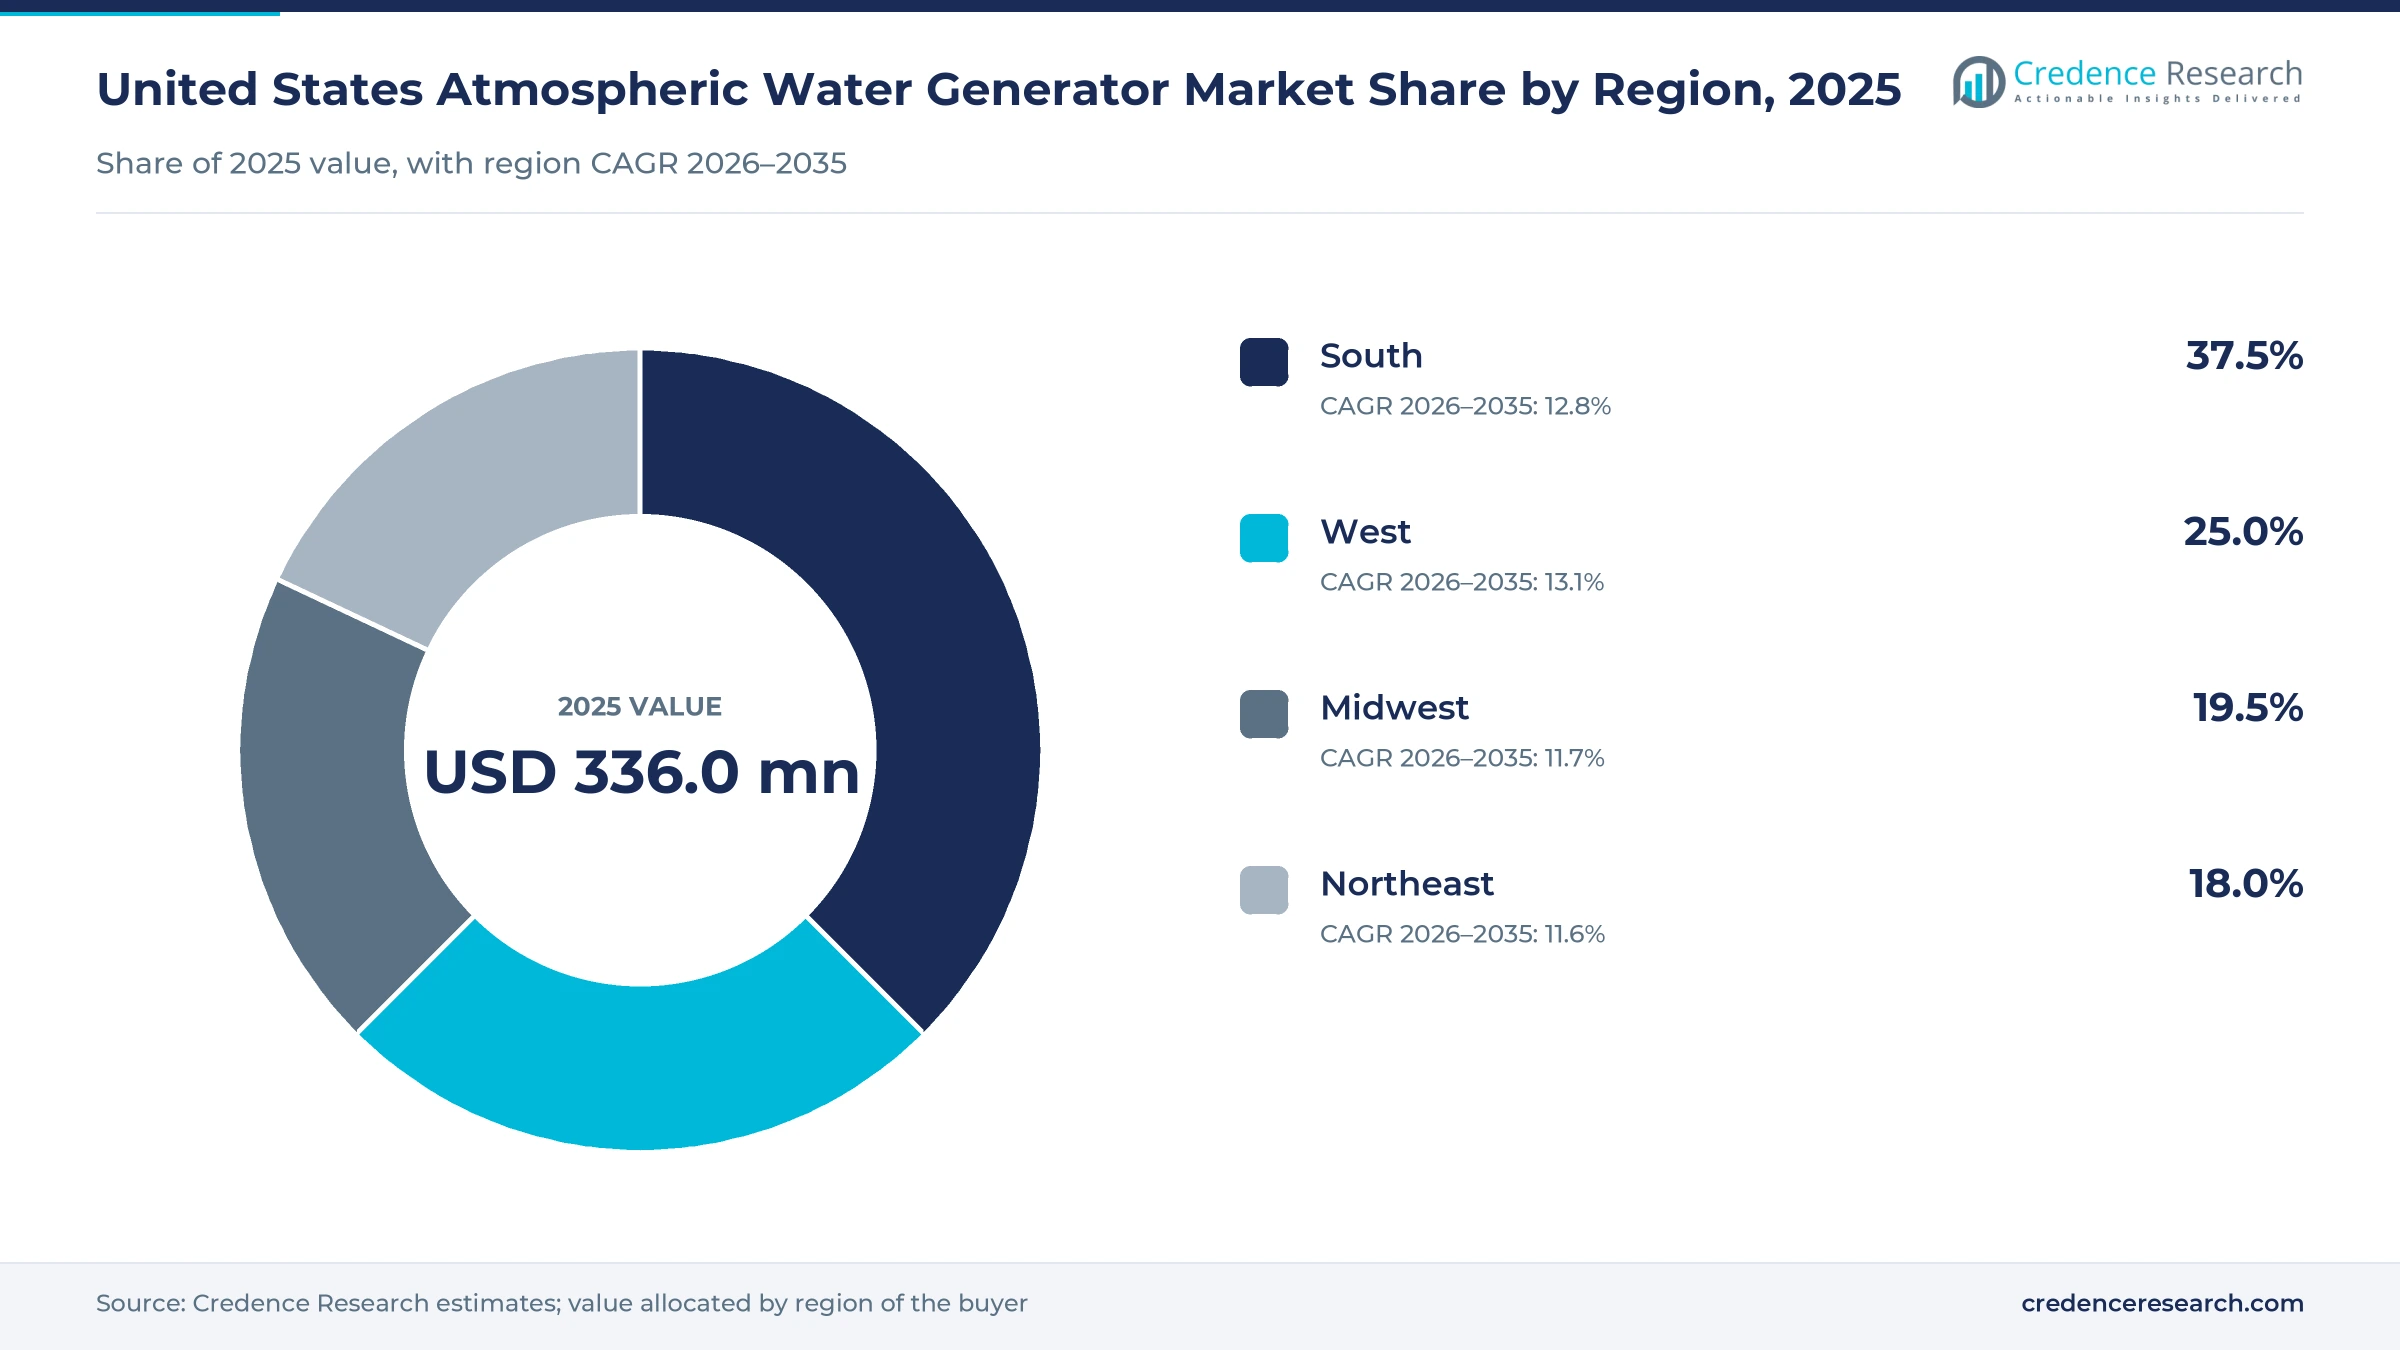
- The South held 37.5% of 2025 value, supported by the largest regional population and frequent hurricane damage to municipal treatment and distribution systems.
- Cooling condensation led technology with 62.0% of 2025 value, while sorbent extraction grows fastest at 16.6% a year on waste-heat designs.
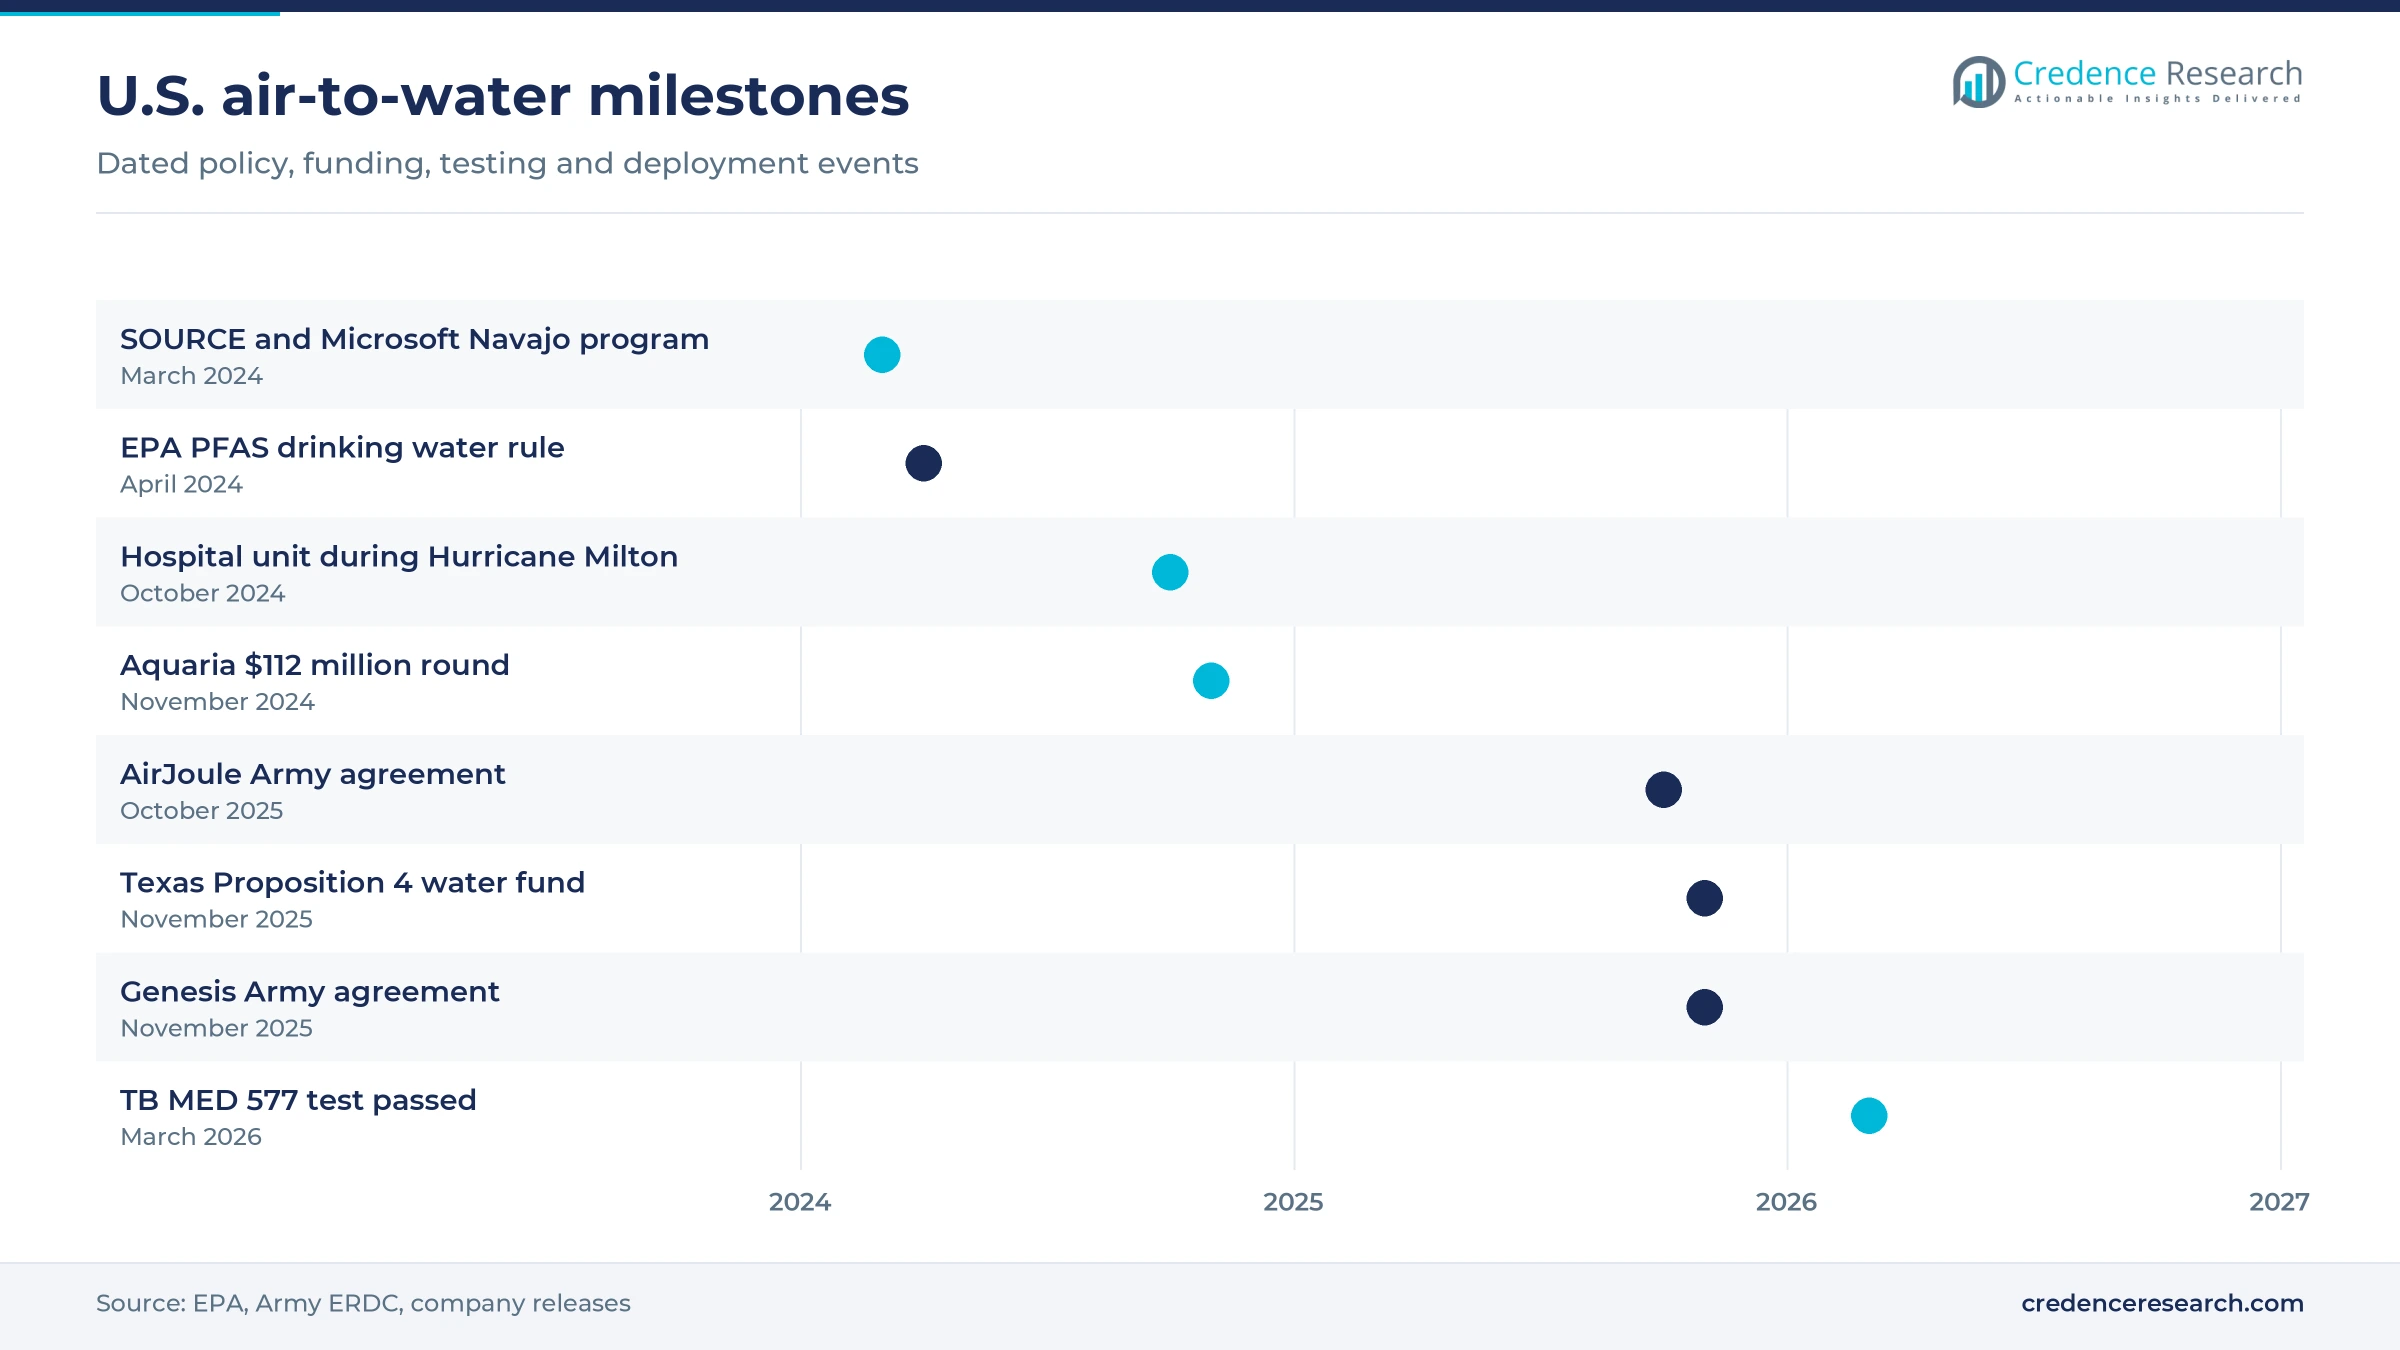
- Genesis Systems said in March 2026 that its WaterCube military units passed Army TB MED 577 water safety testing, a step toward wider defense procurement.
- Aquaria raised $112 million in November 2024, led by a $100 million offtake agreement, showing that project finance is entering residential and community supply.
Condensation units lead as sorbent designs scale
Why compressor-based condensation still leads technology
Based on technology, the market is categorized into cooling condensation, sorbent extraction, hybrid extraction and passive solar harvesting. Cooling condensation led with 62.0% of 2025 value because it is the mature, dealer-supported design behind most installed units, such as Watergen USA's 7-gallon GENNY and 237-gallon GEN-350, which Watergen deployed with the American Red Cross and FEMA after the 2017 and 2018 hurricanes. Sorbent extraction grows fastest at 16.6% a year, as AirJoule says its A1000 model produces water at under 200 watt-hours per liter, using the same moisture-capture chemistry found in desiccant dehumidifiers. Lower energy per liter is what opens dry climates and waste-heat sites.
Mid-size systems for sites and buildings take the largest share
Based on capacity, the market is categorized into three daily output bands, from small home units to large engineered systems. The 100–5,000 L/day band led with 46.0% of 2025 value because this band covers the hospital, school, office and field units that carry the highest prices, including Aquaria systems that produce up to 264 gallons a day per unit, according to ImpactAlpha. The Above 5,000 L/day band grows fastest at 14.6% a year, as Lawrence Berkeley National Laboratory expects hyperscale data centers alone to consume between 60 and 124 billion liters of water in 2028. Large thermally integrated systems are the only format that can supply volumes at that scale.
Commercial buyers lead while industrial sites grow fastest
Based on application, the market is categorized into residential potable supply, commercial potable supply, industrial onsite supply and public resilience supply. Commercial potable supply led with 34.0% of 2025 value because hospitals, offices and hotels can price the cost of losing water, and a WaterCube 1000 kept Johns Hopkins All Children's Hospital in Florida supplied during Hurricane Milton in October 2024. Industrial onsite supply grows fastest at 14.4% a year, as AirJoule ran an industrial water-generation demonstration in Hubbard, Texas, from September to December 2025. Industrial buyers value distilled-grade output for process use more than drinking water.
Enterprise contracts lead and public tenders gain ground
Based on sales channel, the market is categorized into direct enterprise sales, specialist dealer sales, direct consumer e-commerce and public procurement tenders. Direct enterprise sales led with 36.0% of 2025 value because large systems need site surveys, power design and service terms that makers negotiate themselves, as Aquaria did when it signed an offtake agreement with Upwell Water to finance customer projects. Public procurement tenders grow fastest at 14.1% a year, as state and federal buyers now fund units directly, including a $7.5 million Arizona state grant that Local First Arizona and SOURCE Global used to equip 800 rural and tribal homes.
| Segment Group | Leading Sub-segment | Share, 2025 | Fastest-growing Sub-segment | CAGR, 2026–2035 |
|---|---|---|---|---|
| By Technology | Cooling condensation | 62.0% | Sorbent extraction | 16.6% |
| By Capacity | 100–5,000 L/day | 46.0% | Above 5,000 L/day | 14.6% |
| By Application | Commercial potable supply | 34.0% | Industrial onsite supply | 14.4% |
| By Sales Channel | Direct enterprise sales | 36.0% | Public procurement tenders | 14.1% |
Hardware prices are high but delivered water sets the bar
Pricing works on an installed-cost basis, with the buyer paying for hardware and installation upfront and then for filters, mineralization cartridges and power over the life of the unit. The comparison that closes a sale is delivered water, not tap water, which is why makers target buyers who already pay for bottled supply or who face outages. Energy per gallon is the main operating cost for condensation units, so electricity tariffs move the payback period more than hardware discounts. Lenders now spread system costs over 10 to 20 years, which turns a capital purchase into a monthly payment that households and small businesses can weigh against a delivery bill.
| Offer or cost item | Typical price or fee | Basis |
|---|---|---|
| Modular home and community units | USD 3,500 to 30,000 per unit | Aquaria, via ImpactAlpha, November 2024 |
| WaterCube 100, 100-plus gallons a day | USD 19,995 introductory price | Genesis Systems, via TechHive, 2024 |
| Financed residential systems | 7.99% APR over 10 to 20 years, USD 7,500 to 100,000 | Aquaria help center, 2025 |
| Electricity for condensation output | About USD 0.17 per gallon | Credence Research estimate from about 1 kWh per gallon and EIA 2025 residential price of 17.30 cents per kWh |
| Bottled water benchmark | About USD 3.09 per gallon at retail | Credence Research estimate from IBWA 2024 sales of $50.6 billion on 16.4 billion gallons |
Request a Free Sample
Fill in your details and we'll send you a free sample report.
- Sample data tables & charts
- Research methodology
Outages, defense trials and data centers lift orders
Water outages push buyers to replace delivered supply
Outages and aging pipes are turning onsite generation into a resilience purchase rather than a novelty. After Hurricane Helene, Asheville residents went 53 days without drinkable tap water, The Spokesman-Review reported in November 2024, and businesses that depend on water stayed closed for weeks. The U.S. Environmental Protection Agency puts the 20-year drinking water infrastructure need at about $625 billion, with roughly 9.2 million lead service lines still in place. Americans also drank about 47.3 gallons of bottled water per person in 2024, according to the International Bottled Water Association, which shows how much spending already goes to supply outside the tap. That spending is the budget makers target, because it is already paid outside the utility bill.
Defense trials are converting into procurement awards
Defense demand is moving from research grants to qualified products that units can order. The Army Engineer Research and Development Center signed a multi-year cooperative research agreement with Genesis Systems in November 2025, after the Air Force awarded the company a $2 million Tactical Funding Increase to speed WaterCube deployment. The Army also contracted Genesis for a self-contained mobile generator delivering 650 gallons per day in 2025. In March 2026, Genesis said its military WaterCube units passed Army TB MED 577 water safety testing at Aberdeen Proving Ground. AirJoule signed a three-year agreement with the same Army center in October 2025 to pair sorbent units with tactical generator waste heat. Passing field water standards removes the main barrier between prototypes and program buys.
Data center heat and water limits open a new buyer
Data centers are emerging as a buyer because they hold both the waste heat that sorbent systems need and a growing water problem. Lawrence Berkeley National Laboratory estimates that U.S. data centers used 176 TWh of electricity in 2023, about 4.4% of national consumption, and directly consumed about 66 billion liters of water. AirJoule disclosed in August 2025 that it had signed a memorandum of understanding with a hyperscale data center developer to make distilled water from air using low-grade heat from operations. The company was also selected for a Net Zero Innovation Hub program for data centers in September 2025 and expects a data center deployment in 2026. Operators that already buy data center cooling equipment can treat the system as heat recovery with a water credit.
Contaminant rules raise the value of independent supply
Stricter drinking water rules are adding a quality motive to the resilience case. The EPA final rule on PFAS sets an enforceable limit of 4.0 parts per trillion for PFOA and PFOS, effective June 25, 2024, with utilities given until April 26, 2029, to comply. Until utilities finish capital upgrades, households and offices in affected systems look for supply they control, and many first buy home treatment systems. SOURCE Global and Microsoft noted in March 2024 that more than 2 million Americans lack clean water at home. Generated water starts free of the contaminants in local pipes, which gives makers a message that filtration alone cannot match for homes without any safe source.
Waste-heat sorbents and financing reshape the offer
Shift from compressors to waste-heat sorbent platforms
The technology frontier is shifting from compressor condensation toward sorbent platforms that use low-grade heat instead of refrigeration. GE Vernova led AirJoule's $15 million private placement in April 2025, after a March 2024 investment tied to a 50/50 joint venture aimed at making water from waste heat. AirJoule then expanded its Newark, Delaware, plant to 45,000 square feet, opened on July 30, 2025, and delivered a system to Arizona State University in December 2025 for independent testing in arid conditions. The company expects a commercial launch of its Core system in late 2026, pending certifications. For buyers, this shift means future procurement will weigh available heat at the site as much as relative humidity.
Rise of offtake and pay-over-time financing
Financing is moving the market from one-off equipment sales toward contracted supply. Aquaria raised $112 million in November 2024, led by an offtake agreement with Upwell Water, according to ImpactAlpha. The company said it would use the capital to cover upfront costs for qualifying projects through pay-over-time agreements on units that cost $3,500 to $30,000, and it plans a solar-powered Hydrogrid to supply 1,000 homes in Hawaii. Bundled offers are reaching single homes too, as KSAT reported in May 2025 that a Boerne, Texas, owner bought a Hydropack with installation included in the price. Infrastructure investors bring lower cost capital and longer terms than equipment dealers can offer. As a result, suppliers that can show measured output over several years will win the largest community and island contracts.
Opportunity in tribal and rural homes without piped supply
Tribal and rural homes without piped water are the clearest opening for off-grid systems. SOURCE Global and Microsoft said in March 2024 that about 30% of Navajo Nation residents, roughly 70,000 people, lack safe drinking water, and that households buying bottled water can spend up to $2,000 a year once fuel and travel are counted. The two companies funded systems for Navajo families in that program, and more than 500 Navajo homes already had hydropanels, according to Local First Arizona. Watergen also piloted a GEN-M unit in the Hard Rock community in 2021. Programs that pay for hardware and service together can scale because the alternative is a long, recurring delivery bill.
Opportunity in hospital and island resilience fleets
Hospitals, island utilities and emergency agencies are an opening for larger fleets that sit idle until a disaster. Genesis Systems began an island-wide WaterCube rollout in Maui in March 2026, projected to produce more than 262,800 gallons in its first year for about 27,375 people. Genesis also said that its unit at Johns Hopkins All Children's Hospital helped avoid an estimated $10 million in business interruption during Hurricane Milton, according to Business Wire in November 2025. Watergen already offers a truck-mounted unit that produces up to 237 gallons a day from its own diesel generator. Buyers who can quantify the cost of a shutdown are likely to fund standby capacity first, often alongside mobile treatment units.
Energy per gallon and humidity still cap adoption
Energy use per gallon weighs on operating cost
Condensation units consume a lot of power, which limits their appeal wherever delivered water is cheap. Genesis lists the mid-size WaterCube at about 1 kWh per gallon on a 12 kW supply, according to TechHive. The EIA expects average commercial electricity prices to rise from 13.41 cents per kWh in 2025 to 14.00 cents in 2026. Commercial buyers with high tariffs therefore face longer paybacks, which pushes makers toward solar pairing and waste-heat designs.
Output falls in the dry places that need it most
Output depends on humidity and temperature, so the driest buyers often get the smallest yield. EcoloBlue home and office units produce up to 8 gallons a day depending on humidity, and SOURCE Global says each hydropanel makes about 180 standard bottles a month, with actual output varying by local humidity and sunlight. Desert homes and inland bases may need more units than planned. Suppliers answer with sorbent chemistries and site-specific yield estimates before contracts are signed.
Water-free data center cooling narrows one opportunity
Some operators are designing water out of cooling, which reduces the need for supplemental supply at new sites. Microsoft unveiled a closed-loop design with zero evaporated water in December 2024 for new projects in Phoenix and Mount Pleasant, Wisconsin, according to GeekWire, after its data centers used about 33 million gallons each in the prior fiscal year. Makers targeting data centers must therefore sell distilled process water and heat recovery, not cooling make-up water alone.
Filter upkeep and service reach add hidden cost
Recurring maintenance raises the true cost of ownership, especially for homes far from service crews. SOURCE Global recommends yearly replacement of air filters, the carbon block and the mineralization cartridge, and an Aquaria owner in Boerne, Texas, told KSAT in May 2025 that he changes filters a couple of times a year. Missed service visits quickly degrade both water quality and output. Suppliers that bundle service contracts protect both performance and their recurring revenue.
The South holds the largest share of installed demand
| Region | Value, 2025 (USD million) | Share, 2025 | CAGR, 2026–2035 |
|---|---|---|---|
| South | 126.0 | 37.5% | 12.8% |
| West | 84.0 | 25.0% | 13.1% |
| Midwest | 65.5 | 19.5% | 11.7% |
| Northeast | 60.5 | 18.0% | 11.6% |
South leads on population growth and hurricane exposure
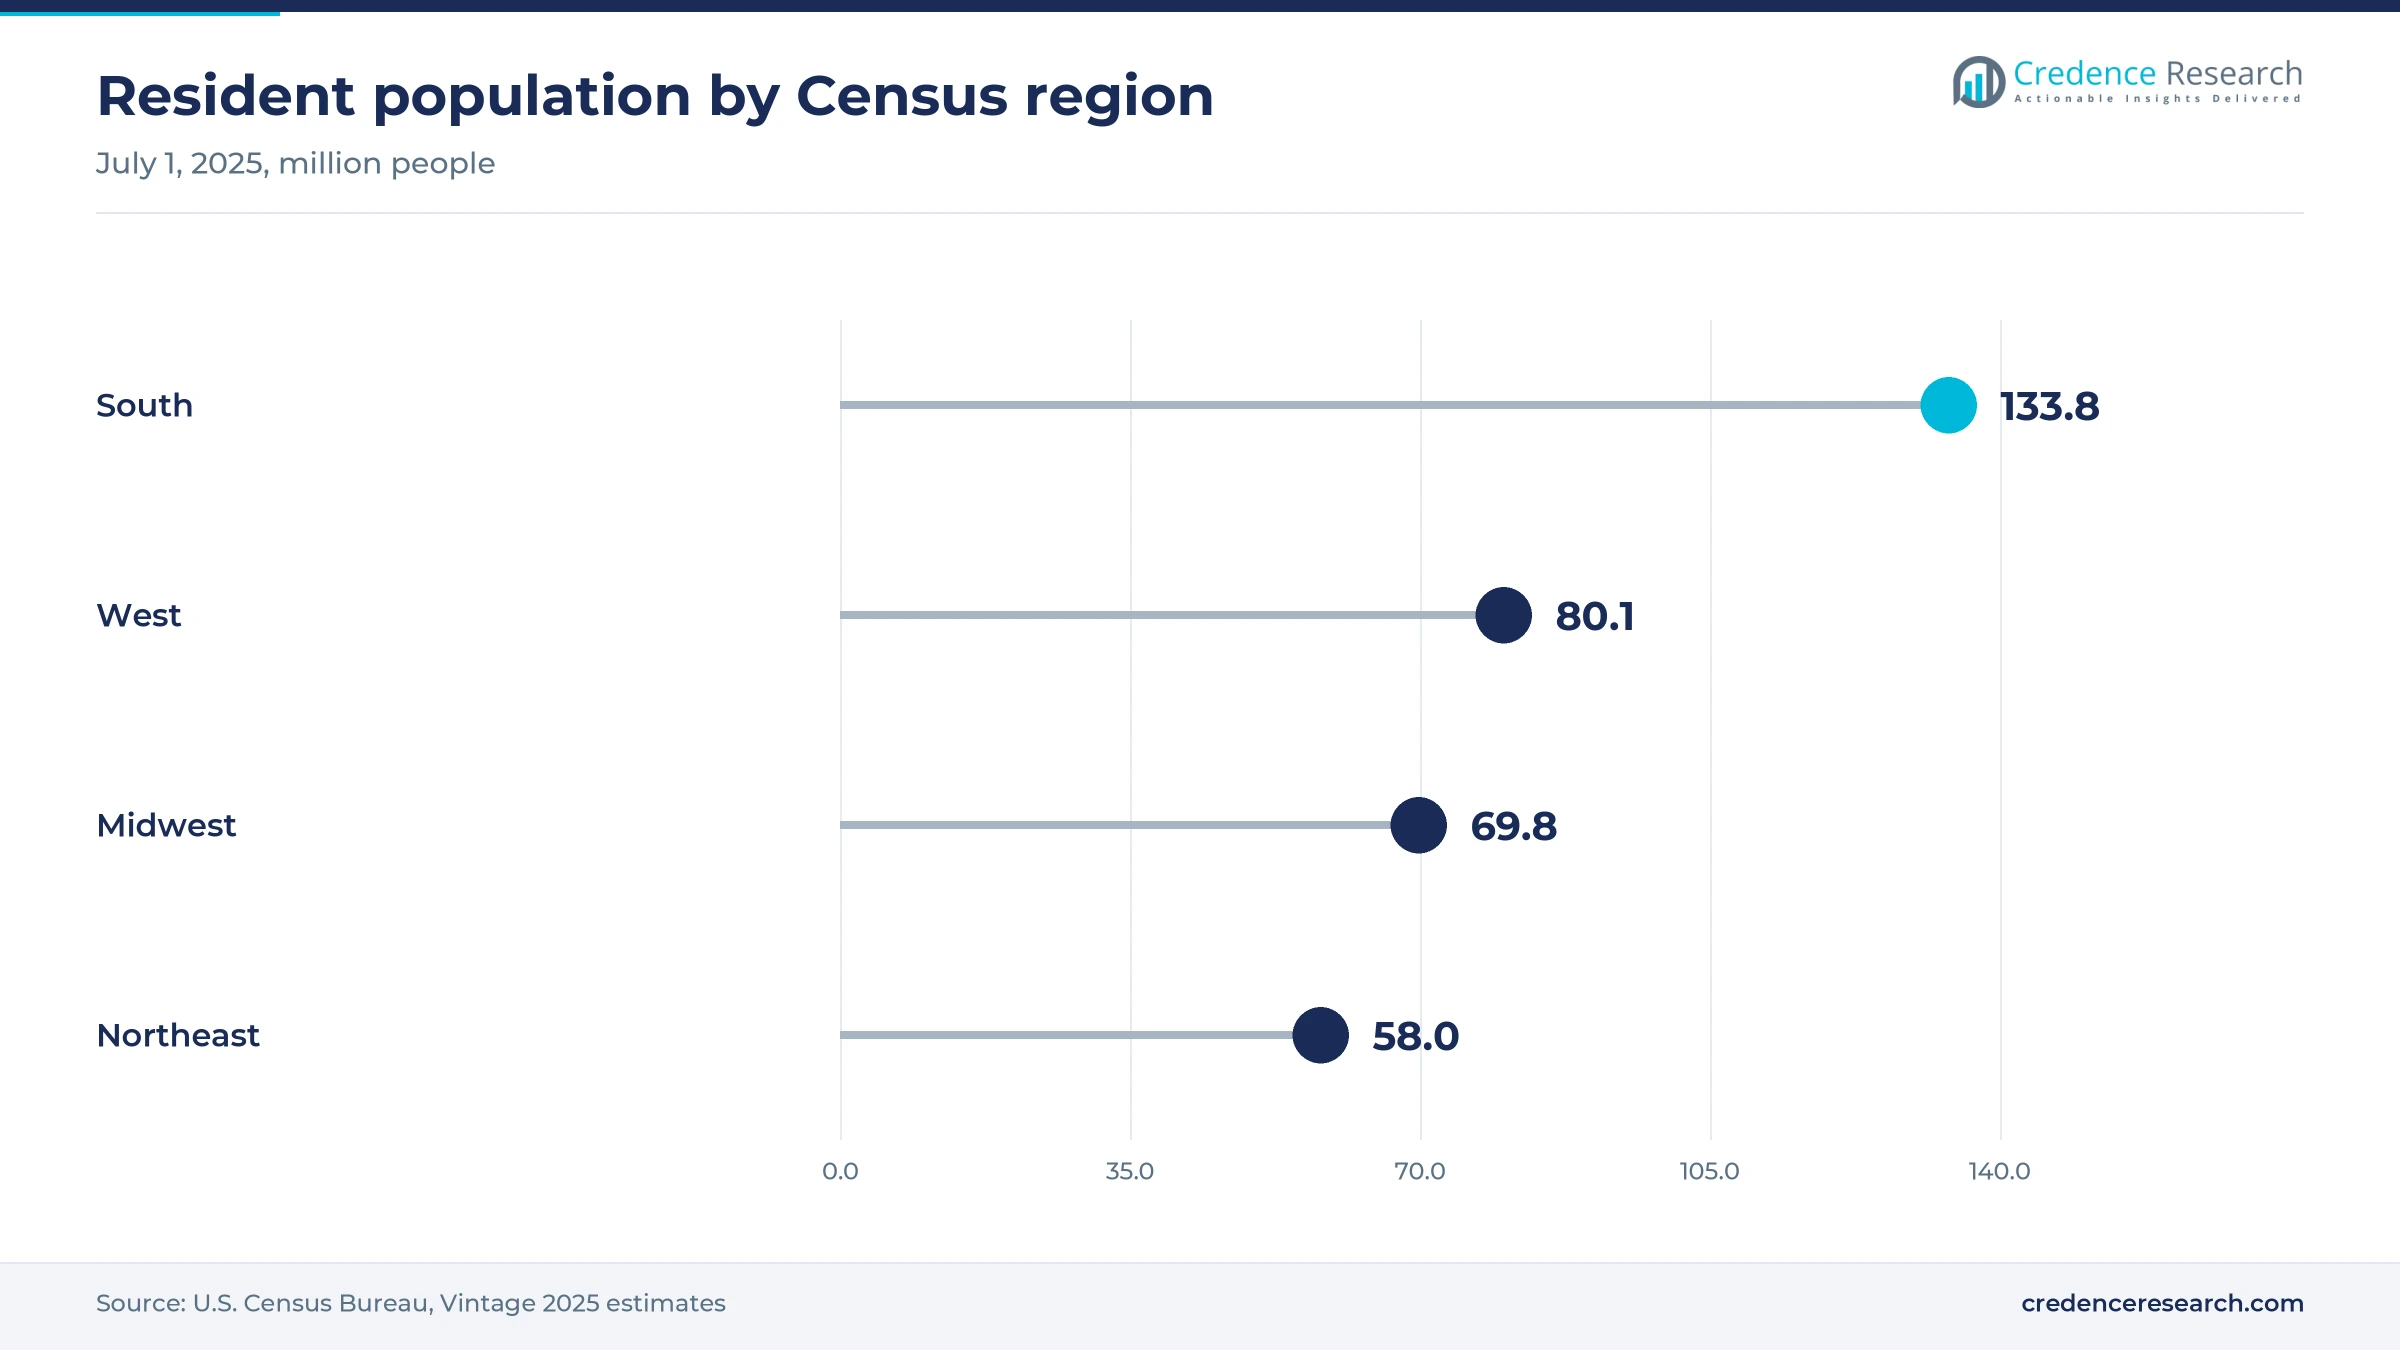
The South held 37.5% of 2025 value and grows at 12.8% a year, the largest regional base by a wide margin. The Census Bureau reports that the South gained 6.0% in population between 2020 and 2025, about twice the national rate, which adds new homes, hospitals and offices each year. Texas voters approved Proposition 4 in November 2025, dedicating up to $1 billion a year from 2027 to a $20 billion water fund, according to the Texas Tribune. Hurricane-related outages in Florida and North Carolina keep standby systems on hospital and municipal budgets.
West grows fastest on tribal, island and drought programs
The West held 25.0% of 2025 value and is the fastest-growing region at 13.1% a year. Funded programs drive demand, including the Navajo Nation installations, the island-wide Maui rollout and a 2021 SOURCE Global pledge of systems for 1,000 low-income homes in Tulare, Fresno, Monterey and Kern counties in California, reported by The Sun-Gazette. Arid inland locations favor sorbent and solar panels over compressor units. Suppliers that can document yield in low humidity will capture most of these public and philanthropic budgets.
Midwest demand ties to lead lines and data center growth
The Midwest held 19.5% of 2025 value and grows at 11.7% a year. The EPA projects 1,043,294 lead service lines in Illinois and 745,061 in Ohio, among the highest state counts, which keeps homes and schools interested in independent drinking supply while replacement proceeds. Microsoft's planned water-free design at Mount Pleasant shows that new regional data centers will choose cooling carefully. Commercial offices and schools are the most likely early buyers here.
Northeast stays a commercial and office market
The Northeast held 18.0% of 2025 value and grows at 11.6% a year, the slowest pace among the four regions. The Census Bureau counts 58.0 million residents in 2025 and growth of only 0.7% since 2020, so new construction adds little demand. Purchases come mainly from offices, campuses and hospitality buyers replacing bottled supply, and from buildings served by utilities facing the PFAS deadline. Dealers compete on service coverage rather than on new-build volume.
Army testing and waste-heat pilots marked 2025-2026
| Development | Status and market relevance |
|---|---|
| In March 2026, Genesis Systems said its WC-100M and WC-10M WaterCube units passed Army TB MED 577 water safety testing. | Clears a field water standard that defense buyers require before ordering |
| In November 2025, the Army Engineer Research and Development Center signed a multi-year research agreement with Genesis Systems. | Extends mobile air-to-water development for military and humanitarian use |
| In October 2025, AirJoule Technologies signed a three-year research agreement with the Army Engineer Research and Development Center. | Pairs sorbent water production with tactical generator waste heat |
| In November 2024, Aquaria raised $112 million, led by an offtake agreement with Upwell Water. | Funds pay-over-time projects for homes and communities |
Four extraction routes compete on energy and climate
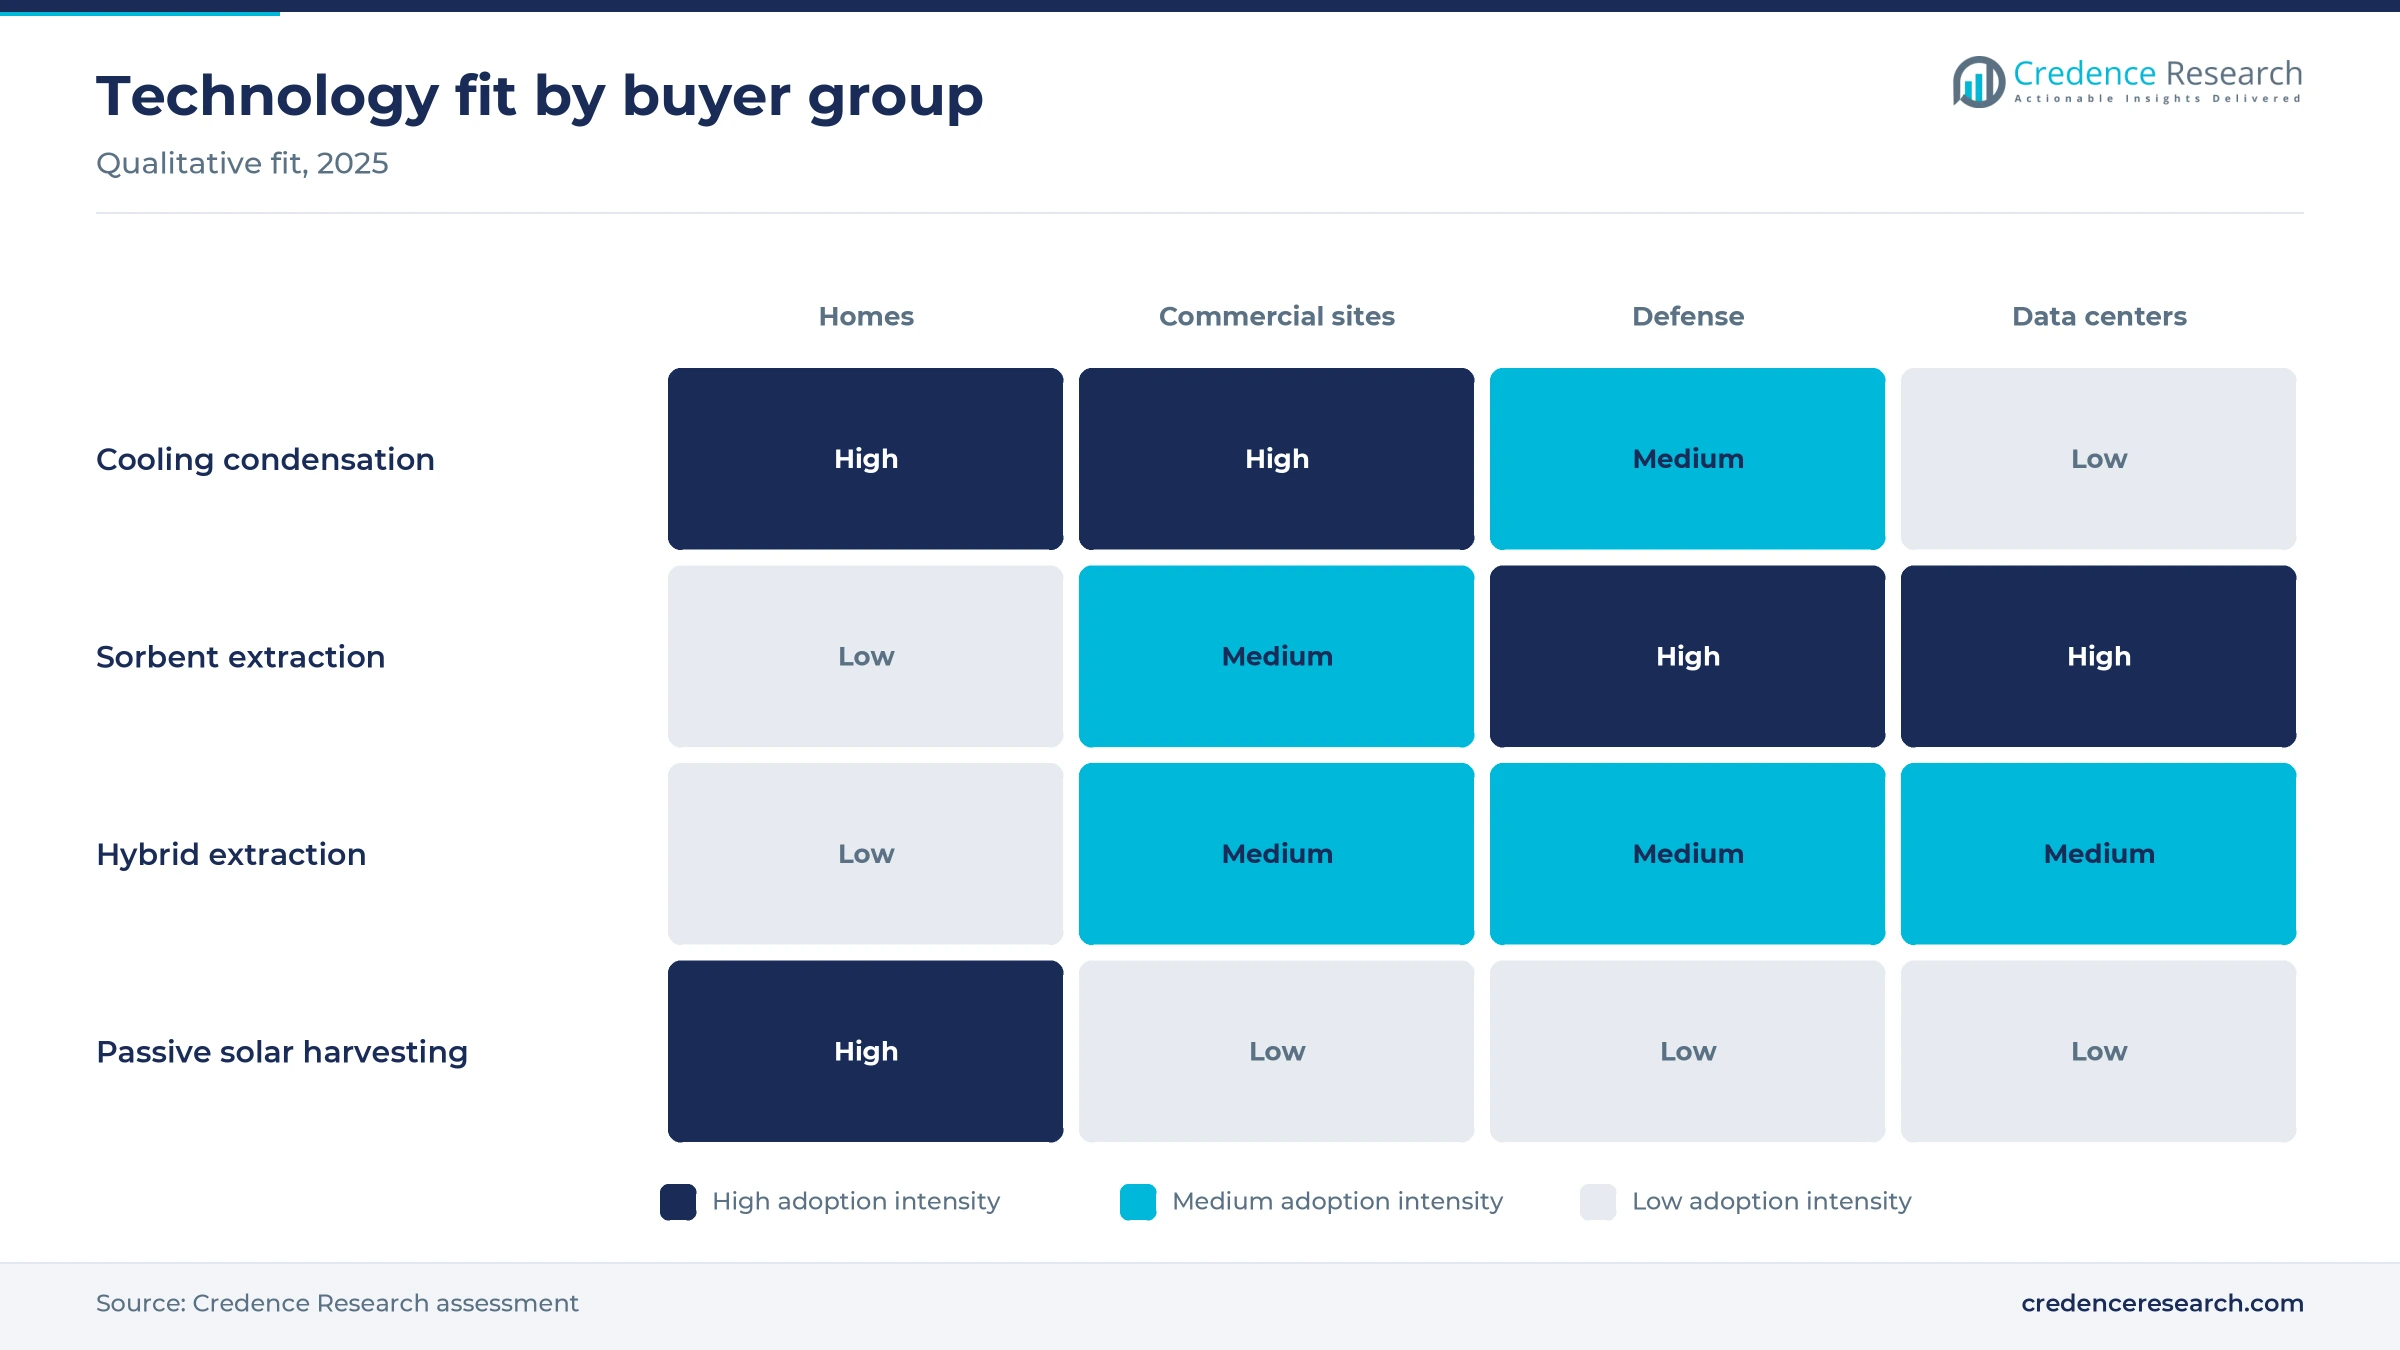
- Cooling condensation chills air below its dew point with a compressor, works best in warm humid air and remains the default for homes, offices and trucks.
- Sorbent extraction captures vapor on a desiccant and releases it with heat or vacuum, which lets it work in drier air and use waste heat.
- Hybrid extraction combines a sorbent stage with refrigeration to stretch the operating range of a single unit across seasons.
- Passive solar harvesting uses solar-powered fans and absorbent panels, which suits off-grid homes but delivers small daily volumes.
Need a Custom Version of This Report?
Tailor the scope, geography, or segments to your exact requirements.
- Custom geography or segment scope
- Direct access to our analyst team
Venture-backed specialists compete on proof, not price
Atmospheric water generator companies compete on demonstrated output, water quality certification and financing rather than on list price alone. Genesis Systems leads on defense qualification and hospital deployments, while AirJoule is building its position on sorbent efficiency and industrial partners such as GE Vernova. Aquaria competes for homes and communities with pay-over-time project finance, and SOURCE Global targets off-grid and tribal homes through funded programs with partners such as Microsoft. Watergen relies on its U.S. distribution network and disaster response record, while EcoloBlue and Drinkable Air Technologies sell compressor-based units to homes, offices and hospitality buyers. Field yield data has become the main sales tool, because output varies widely with climate and buyers now ask for measured yield at comparable sites. Suppliers that pair hardware with service contracts are better placed to hold accounts once units are installed.
A fragmented field of specialists with few certified products
The U.S. atmospheric water generator supply side is fragmented, with a handful of venture-backed system makers, importers of foreign platforms and many small dealers and installers rather than one dominant manufacturer. Watergen sells through its U.S. arm and distributors, EcoloBlue and Drinkable Air sell compressor units for homes and offices, and Genesis, AirJoule and Aquaria sell direct to institutions. Entry barriers come from water quality testing, field yield data and access to project finance rather than from manufacturing scale. Margins sit mostly in large engineered systems and in recurring filter and service contracts, while small home units compete on price online.
Companies profiled and their roles in this market
| Company | Type | Role in the market |
|---|---|---|
| Genesis Systems | System maker, Tampa, Florida | WaterCube units for defense, hospitals and the Maui program |
| AirJoule Technologies | Sorbent system maker, Newark, Delaware | Waste-heat platform with Army and data center pilots |
| Aquaria | System maker and financier, San Francisco | Hydropack units sold with pay-over-time project finance |
| SOURCE Global | Solar panel maker, Scottsdale, Arizona | Hydropanels for tribal, rural and low-income homes |
| Watergen | Platform maker with U.S. arm in Charlotte, North Carolina | GENNY and GEN-series units for homes, sites and disaster relief |
| EcoloBlue | Compressor unit maker, California | Home, office and industrial units, including Flint donations |
| Drinkable Air Technologies | Compressor unit maker, U.S. | Units for hospitality and eco-label partner programs |
Resilience value, not price per gallon, sells systems
Credence Research's view is that U.S. atmospheric water generators are sold on avoided loss rather than cost per gallon. A hospital that cannot operate without water, a forward base that depends on convoys and a family hauling bottles across a reservation all compare the system against disruption, not against a tap bill. That is why defense qualification, hurricane deployments and funded tribal programs matter more to near-term growth than consumer pricing. The main risk sits with sorbent launches, because most of the upside to 2035 assumes waste-heat systems reach commercial volume and prove their output in dry climates.
Unit prices, program awards and outages anchor the model
The report uses 2025 as the base year and forecasts to 2035 in current U.S. dollars. Market values come from the Credence Research model, which combines unit price points from company releases and trade press, installed base indicators from public programs, and a top-down check against the wider global market. Regional shares follow the Credence Research regional model, informed by Census Bureau population data, storm exposure and funded program activity. Segment splits are Credence Research estimates from product capacities, buyer types and channels described in company, regulator and government sources. No primary interviews or surveys were used in building these estimates.
Commercial sorbent launches decide the upper range
Through 2035, atmospheric water generator demand is likely to grow in two steps, reaching USD 1.09 billion by 2035. Until about 2028, resilience orders from hospitals, island utilities and tribal programs, plus a gradual move from Army testing to procurement, carry most of the gains. After that, the size of the market depends on whether sorbent systems that run on waste heat are adopted at data centers and industrial plants, where single installations are far larger than home units. Compressor units will remain the volume base for homes and offices, but their share is likely to shrink as dry-climate and heat-integrated systems scale.
Certification and sorbent launches set the range to 2035
The range of outcomes depends on whether sorbent systems reach commercial volume on schedule and whether defense testing turns into recurring program orders. A downside case reflects delayed certifications, cheaper delivered water and data centers that design water out of cooling. The upside requires funded community programs to spread beyond the Southwest and Hawaii, and hyperscale operators to adopt heat recovery at several campuses.
| Scenario | CAGR, 2026–2035 | Value, 2035 | What has to hold |
|---|---|---|---|
| Downside | 10.5% | USD 928.4 million | Sorbent launches slip past 2027 and defense buys stay at prototype scale |
| Base | 12.50% | USD 1.09 billion | Steady resilience orders, gradual defense procurement and first data center installations |
| Upside | 14.5% | USD 1.28 billion | Certified sorbent systems scale in data centers and community programs spread nationwide |
Frequently Asked Questions
How big is the United States atmospheric water generator market?
Which region leads the U.S. market?
Which technology holds the largest share?
Why are defense buyers important for this market?
How do data centers fit into demand?
What does an atmospheric water generator cost?
What limits adoption in the United States?
Which companies are active in the U.S. market?
Table of Content
Chapter 1 Market Segmentation
- 1.1 Segmentation Framework
- 1.1.1 Product and Service Classification
- 1.1.2 Application and End-Use Classification
- 1.1.3 Technology and Solution Classification
- 1.1.4 Customer and Distribution Channel Classification
- 1.1.5 Geographic Segmentation
- 1.1.6 Market Segment Definitions and Boundaries
- 1.2 By Technology
- 1.2.1 Cooling condensation
- 1.2.2 Sorbent extraction
- 1.2.3 Hybrid extraction
- 1.2.4 Passive solar harvesting
- 1.3 By Capacity
- 1.3.1 Below 100 L/day
- 1.3.2 100–5,000 L/day
- 1.3.3 Above 5,000 L/day
- 1.4 By Application
- 1.4.1 Residential potable supply
- 1.4.2 Commercial potable supply
- 1.4.3 Industrial onsite supply
- 1.4.4 Public resilience supply
- 1.5 By Sales Channel
- 1.5.1 Direct enterprise sales
- 1.5.2 Specialist dealer sales
- 1.5.3 Direct consumer e-commerce
- 1.5.4 Public procurement tenders
Chapter 2 Introduction
- 2.1 Report Objectives and Scope
- 2.2 Product Definition and Industry Terminology
- 2.3 Market Inclusions and Exclusions
- 2.4 Research Process
- 2.4.1 Primary Research and Expert Interviews
- 2.4.2 Secondary Research and Source Review
- 2.4.3 Top-Down and Bottom-Up Estimation
- 2.4.4 Data Triangulation and Verification
- 2.5 Market Size Measurement Basis
- 2.5.1 2025: USD 336.0 million → 2035: USD 1.09 billion
- 2.6 Historical and Forecast Reference Periods
- 2.6.1 Historical Period: 2018-2025
- 2.6.2 Base Year: 2025
- 2.6.3 Forecast Period: 2025-2035
- 2.7 Research Assumptions and Limitations
Chapter 3 Executive Summary
- 3.1 Market Snapshot and Key Findings
- 3.2 Base-Year Market Size, 2025
- 3.3 Forecast Market Size, 2035
- 3.4 Revenue and Volume Growth Outlook
- 3.5 Key Demand and Supply Indicators
- 3.6 Leading Market Segments
- 3.7 Fastest-Growing Market Opportunities
- 3.8 Regional Performance Highlights
- 3.9 Technology and Industry Transformation
- 3.10 Competitive Landscape Summary
- 3.11 Analyst View and Strategic Implications
Chapter 4 United States Atmospheric Water Generator Market Trends and Developments
- 4.1 Historical Industry Development, 2018-2025
- 4.2 Recent Market Trends and Developments
- 4.3 Demand and Customer Behavior Trends
- 4.4 Technology and Product Innovation
- 4.5 Artificial Intelligence, Automation and Digitalization
- 4.6 Local Manufacturing and Supply Chain Realignment
- 4.7 Industry Partnerships, Mergers and Acquisitions
- 4.8 Sustainability and Circular Economy Developments
- 4.9 Government and Private Sector Investment Trends
- 4.10 Emerging Business Models and Commercialization
- 4.11 Industry Developments and Announcements
Chapter 5 United States Atmospheric Water Generator Market Production, Supply and Demand Analysis
- 5.1 Demand Trend and Consumption Analysis, 2018-2025
- 5.2 Demand Forecast, 2025-2035
- 5.3 Production and Output Trend, 2018-2025
- 5.4 Production and Output Forecast, 2025-2035
- 5.5 Installed Capacity and Capacity Utilization
- 5.6 Company-Wise Production Plants and Statistics
- 5.6.1 Installed Production Capacity
- 5.6.2 Actual Production
- 5.6.3 Planned Capacity and Expansion Targets
- 5.7 Supply Chain Structure and Procurement Trends
- 5.8 Supply-Demand Gap and Bottlenecks
- 5.9 Import Dependence and Sourcing Structure
- 5.10 Contract Manufacturing and Outsourcing
- 5.11 Regional Supply and Demand Concentration
Chapter 6 United States Atmospheric Water Generator Market Pricing Analysis
- 6.1 Pricing Structure and Measurement
- 6.2 Historical Pricing Trends, 2018-2025
- 6.3 Pricing Outlook, 2025-2035
- 6.4 Average Selling Price and Unit Economics
- 6.5 Pricing by Product and Market Segment
- 6.6 Geographic Pricing Differences
- 6.7 Key Input, Energy, Labor and Logistics Costs
- 6.8 Contract Pricing and Purchasing Models
- 6.9 Pricing Sensitivity and Competitive Positioning
- 6.10 Price, Margin and Profitability Implications
Chapter 7 United States Atmospheric Water Generator Market Dynamics
- 7.1 Market Growth Drivers
- 7.1.1 Demand-Side Drivers
- 7.1.2 Technology and Innovation Drivers
- 7.1.3 Infrastructure and Investment Drivers
- 7.1.4 Regulatory and Policy Drivers
- 7.2 Market Restraints
- 7.2.1 Cost and Affordability Constraints
- 7.2.2 Technology and Adoption Barriers
- 7.2.3 Supply Chain and Operational Constraints
- 7.3 Market Challenges
- 7.3.1 Competitive Pressure and Margin Erosion
- 7.3.2 Skills, Infrastructure and Implementation Gaps
- 7.4 Emerging Market Opportunities
- 7.5 Market Dynamics Impact and Time-Horizon Assessment
Chapter 8 United States Atmospheric Water Generator Value Chain Analysis
- 8.1 Industry Value Chain Overview
- 8.2 Upstream Suppliers and Critical Inputs
- 8.3 Technology and Component Providers
- 8.4 Manufacturing or Service Delivery
- 8.5 Distribution, Channel Partners and Integrators
- 8.6 Downstream Applications and End Users
- 8.7 Value Addition and Profit Pools
- 8.8 Vertical Integration and Outsourcing
- 8.9 Supplier Concentration and Risk
- 8.10 Supply Chain Localization and Resilience
Chapter 9 United States Atmospheric Water Generator Market Regulations and Policies
- 9.1 Relevant Laws, Standards and Compliance Frameworks
- 9.2 Product, Service, Safety and Quality Requirements
- 9.3 Government Policies, Incentives and Subsidies
- 9.4 Imports, Exports and Trade Barriers
- 9.5 Public Procurement and Local Content Requirements
- 9.6 Environmental and Sustainability Compliance
- 9.7 Upcoming Policy Changes and Market Implications
Chapter 10 United States Atmospheric Water Generator Market Hotspots and Opportunities
- 10.1 Market Opportunity Mapping and Growth Hotspots
- 10.2 High-Growth Applications and Customer Groups
- 10.3 Underserved Markets and White-Space Opportunities
- 10.4 Emerging Technology and Product Opportunities
- 10.5 New Capacity and Investment Hotspots
- 10.6 Market Entry and Expansion Opportunities
- 10.7 Distribution and Partnership Opportunities
- 10.8 Near-Term and Long-Term Commercial Potential
- 10.9 Opportunity Attractiveness and Execution Risks
Chapter 11 United States Atmospheric Water Generator Market Outlook, 2025-2035
- 11.1 Market Size and Analysis
- 11.1.1 Revenue (Market Measurement: 2025: USD 336.0 million → 2035: USD 1.09 billion)
- 11.1.2 Market Volume and Quantity Sold
- 11.1.3 Historical Market Size, 2018-2025
- 11.1.4 Base-Year Market Size, 2025
- 11.2 Market Forecast, 2025-2035
- 11.2.1 Revenue Forecast to 2035
- 11.2.2 Volume Forecast to 2035
- 11.2.3 CAGR and Year-on-Year Growth
- 11.2.4 Incremental Revenue Opportunity
- 11.3 Forecast Assumptions and Scenario Analysis
- 11.3.1 Base-Case Forecast
- 11.3.2 Optimistic and Conservative Scenarios
- 11.3.3 Technology, Pricing and Policy Sensitivities
- 11.4 Market Attractiveness and Growth Outlook
Chapter 12 United States Atmospheric Water Generator Market Segmentation and Outlook
- 12.1 Segmentation Summary and Market Shares, 2025
- 12.2 Largest and Fastest-Growing Segments
- 12.3 By Technology - Market Size and Forecast, 2025-2035
- 12.3.1 Segment Definition and Scope
- 12.3.2 Historical Market Size, 2018-2025
- 12.3.3 Revenue Forecast, 2025-2035
- 12.3.4 Volume Forecast, 2025-2035
- 12.3.5 Base-Year Market Share, 2025
- 12.3.6 Segment CAGR and Growth Drivers
- 12.3.7 Subsegment Market Size and Forecast
- 12.3.7.1 Cooling condensation
- 12.3.7.2 Sorbent extraction
- 12.3.7.3 Hybrid extraction
- 12.3.7.4 Passive solar harvesting
- 12.3.8 Subsegment Pricing and Adoption Trends
- 12.3.9 Leading Suppliers and Competition
- 12.3.10 Regional Demand and Opportunities
- 12.4 By Capacity - Market Size and Forecast, 2025-2035
- 12.4.1 Segment Definition and Scope
- 12.4.2 Historical Market Size, 2018-2025
- 12.4.3 Revenue Forecast, 2025-2035
- 12.4.4 Volume Forecast, 2025-2035
- 12.4.5 Base-Year Market Share, 2025
- 12.4.6 Segment CAGR and Growth Drivers
- 12.4.7 Subsegment Market Size and Forecast
- 12.4.7.1 Below 100 L/day
- 12.4.7.2 100–5,000 L/day
- 12.4.7.3 Above 5,000 L/day
- 12.4.8 Subsegment Pricing and Adoption Trends
- 12.4.9 Leading Suppliers and Competition
- 12.4.10 Regional Demand and Opportunities
- 12.5 By Application - Market Size and Forecast, 2025-2035
- 12.5.1 Segment Definition and Scope
- 12.5.2 Historical Market Size, 2018-2025
- 12.5.3 Revenue Forecast, 2025-2035
- 12.5.4 Volume Forecast, 2025-2035
- 12.5.5 Base-Year Market Share, 2025
- 12.5.6 Segment CAGR and Growth Drivers
- 12.5.7 Subsegment Market Size and Forecast
- 12.5.7.1 Residential potable supply
- 12.5.7.2 Commercial potable supply
- 12.5.7.3 Industrial onsite supply
- 12.5.7.4 Public resilience supply
- 12.5.8 Subsegment Pricing and Adoption Trends
- 12.5.9 Leading Suppliers and Competition
- 12.5.10 Regional Demand and Opportunities
- 12.6 By Sales Channel - Market Size and Forecast, 2025-2035
- 12.6.1 Segment Definition and Scope
- 12.6.2 Historical Market Size, 2018-2025
- 12.6.3 Revenue Forecast, 2025-2035
- 12.6.4 Volume Forecast, 2025-2035
- 12.6.5 Base-Year Market Share, 2025
- 12.6.6 Segment CAGR and Growth Drivers
- 12.6.7 Subsegment Market Size and Forecast
- 12.6.7.1 Direct enterprise sales
- 12.6.7.2 Specialist dealer sales
- 12.6.7.3 Direct consumer e-commerce
- 12.6.7.4 Public procurement tenders
- 12.6.8 Subsegment Pricing and Adoption Trends
- 12.6.9 Leading Suppliers and Competition
- 12.6.10 Regional Demand and Opportunities
- 12.7 Segment Growth Comparison
- 12.8 Segment Attractiveness and Priority Matrix
Chapter 13 United States Atmospheric Water Generator End-Use and Application Market Outlook
- 13.1 End-Use Industry and Customer Demand Structure
- 13.2 Leading Applications and Customer Groups
- 13.3 End-Use Market Size, Share and Forecast
- 13.4 Major End-Use Industry Deep Dives
- 13.4.1 Customer Requirements and Use Cases
- 13.4.2 Demand and Replacement Cycles
- 13.4.3 Technical and Regulatory Considerations
- 13.4.4 Purchasing and Procurement Models
- 13.4.5 Leading Vendors and Distribution Channels
- 13.4.6 Forecast and Commercial Opportunities
- 13.5 Emerging Applications and Cross-Segment Demand
- 13.6 End-Use Industry Investment Priorities
Chapter 14 United States Atmospheric Water Generator Geographic Market Outlook, 2025-2035
- 14.1 Domestic Market Distribution and Demand Clusters
- 14.2 State- or Province-Wise Market Size and Forecast, 2025-2035
- 14.3 City and Metropolitan Market Outlook
- 14.4 Industrial, Manufacturing and Commercial Clusters
- 14.5 Geographic Concentration of Key End Users
- 14.6 Local Pricing and Purchasing Differences
- 14.7 Domestic Production Facilities and Capacity Map
- 14.8 Local Infrastructure and Project Pipeline
- 14.9 State-Level Policy and Incentive Differences
- 14.10 Subnational Investment Hotspots and Opportunities
- 14.11 Distribution and Logistics Networks
- 14.12 Domestic Competitive Footprint
Chapter 15 United States Atmospheric Water Generator Technology, Innovation and Sustainability Outlook
- 15.1 Technology Landscape and Maturity
- 15.2 Product, Process and Service Innovation
- 15.3 AI, Automation and Digital Tools in the Industry
- 15.4 Technology Adoption and Performance Benchmarking
- 15.5 Innovation Pipeline and R&D Investment
- 15.6 Patent and Intellectual Property Trends
- 15.7 Energy Efficiency and Resource Management
- 15.8 Sustainability, Recycling and Circularity
- 15.9 Technology Roadmap, 2025-2035
- 15.10 Risks of Obsolescence and Technology Substitution
Chapter 16 United States Atmospheric Water Generator Market Key Strategic Imperatives
- 16.1 Growth and Market Entry Priorities
- 16.2 High-Return Products and Segments
- 16.3 Pricing, Profitability and Cost Optimization
- 16.4 Technology Investment and Product Differentiation
- 16.5 Supply Chain Localization and Resilience
- 16.6 Distribution and Customer Acquisition
- 16.7 Partnership, Acquisition and Capacity Strategy
- 16.8 Regional Expansion Priorities
- 16.9 Short-, Medium- and Long-Term Actions
Chapter 17 Competition Outlook
- 17.1 Industry Competition Characteristics
- 17.2 Market Structure and Concentration
- 17.3 Market Share and Competitive Positioning, 2025
- 17.4 Company-Wise Revenue and Product Benchmarking
- 17.5 Production and Service Capacity Benchmarking
- 17.6 Technology, Pricing and Differentiation
- 17.7 Regional Footprint and Distribution Strength
- 17.8 Mergers, Acquisitions and Strategic Alliances
- 17.9 New Entrants and Competitive Threats
- 17.10 Porter's Five Forces and Industry Attractiveness
- 17.11 Competitive Outlook, 2025-2035
Chapter 18 Company Profiles
- 18.1 Company Coverage and Selection Criteria
- 18.2 EcoloBlue
- 18.2.1 Business Description
- 18.2.2 Company Ownership and Geographic Presence
- 18.2.3 Product and Service Portfolio
- 18.2.4 Manufacturing and Operating Footprint
- 18.2.5 Production Capacity and Expansion Plans
- 18.2.6 Financial Performance and Investment
- 18.2.7 Market Share and Competitive Position
- 18.2.8 Technology and Innovation Capabilities
- 18.2.9 Strategic Alliances or Partnerships
- 18.2.10 Recent Developments
- 18.2.11 Growth Strategy and Outlook
- 18.3 Watergen
- 18.4 Genesis Systems
- 18.5 Drinkable Air Technologies
- 18.6 Aquaria
- 18.7 AirJoule Technologies
- 18.8 SOURCE Global
- 18.9 Other Relevant Market Participants
Note: Every listed company is profiled on the structure shown under the first company. The company list is preliminary and may change based on research findings, market developments, data availability and client requirements.
Chapter 19 Disclaimer
- 19.1 Research and Forecast Disclaimer
- 19.2 Data Source and Estimation Limitations
Note: The depth of individual sections depends on data availability for this market. Volume, capacity, trade and other unit-based metrics are included where applicable.