Large loads and regional plans lift high-voltage spending
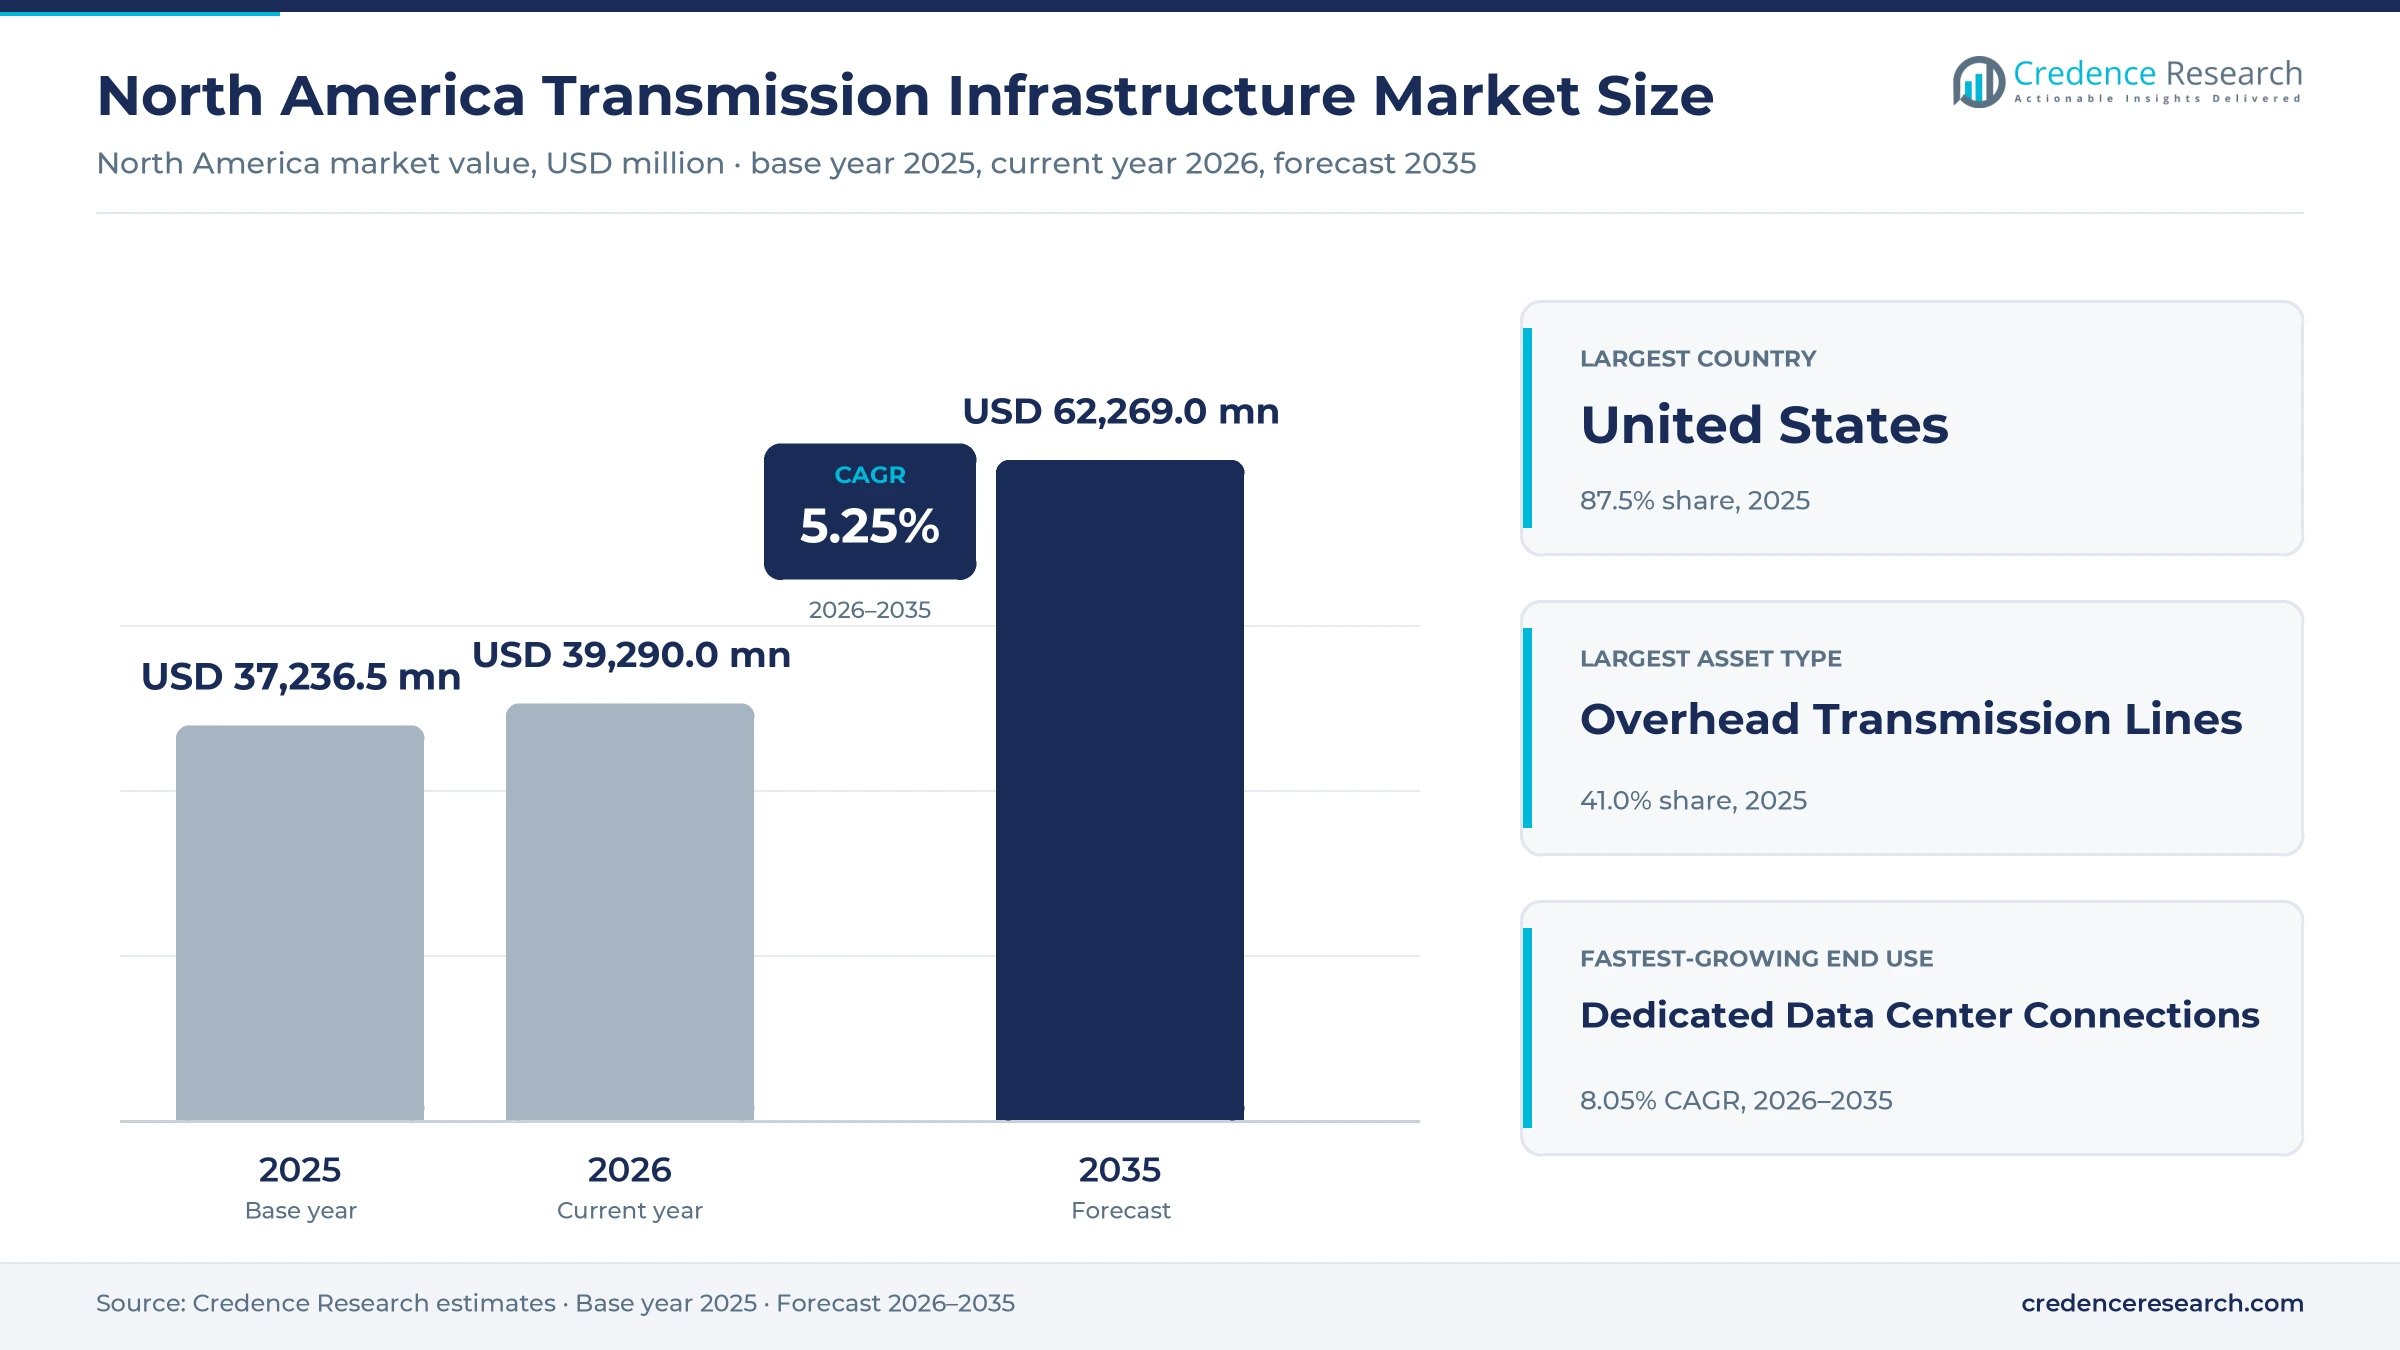
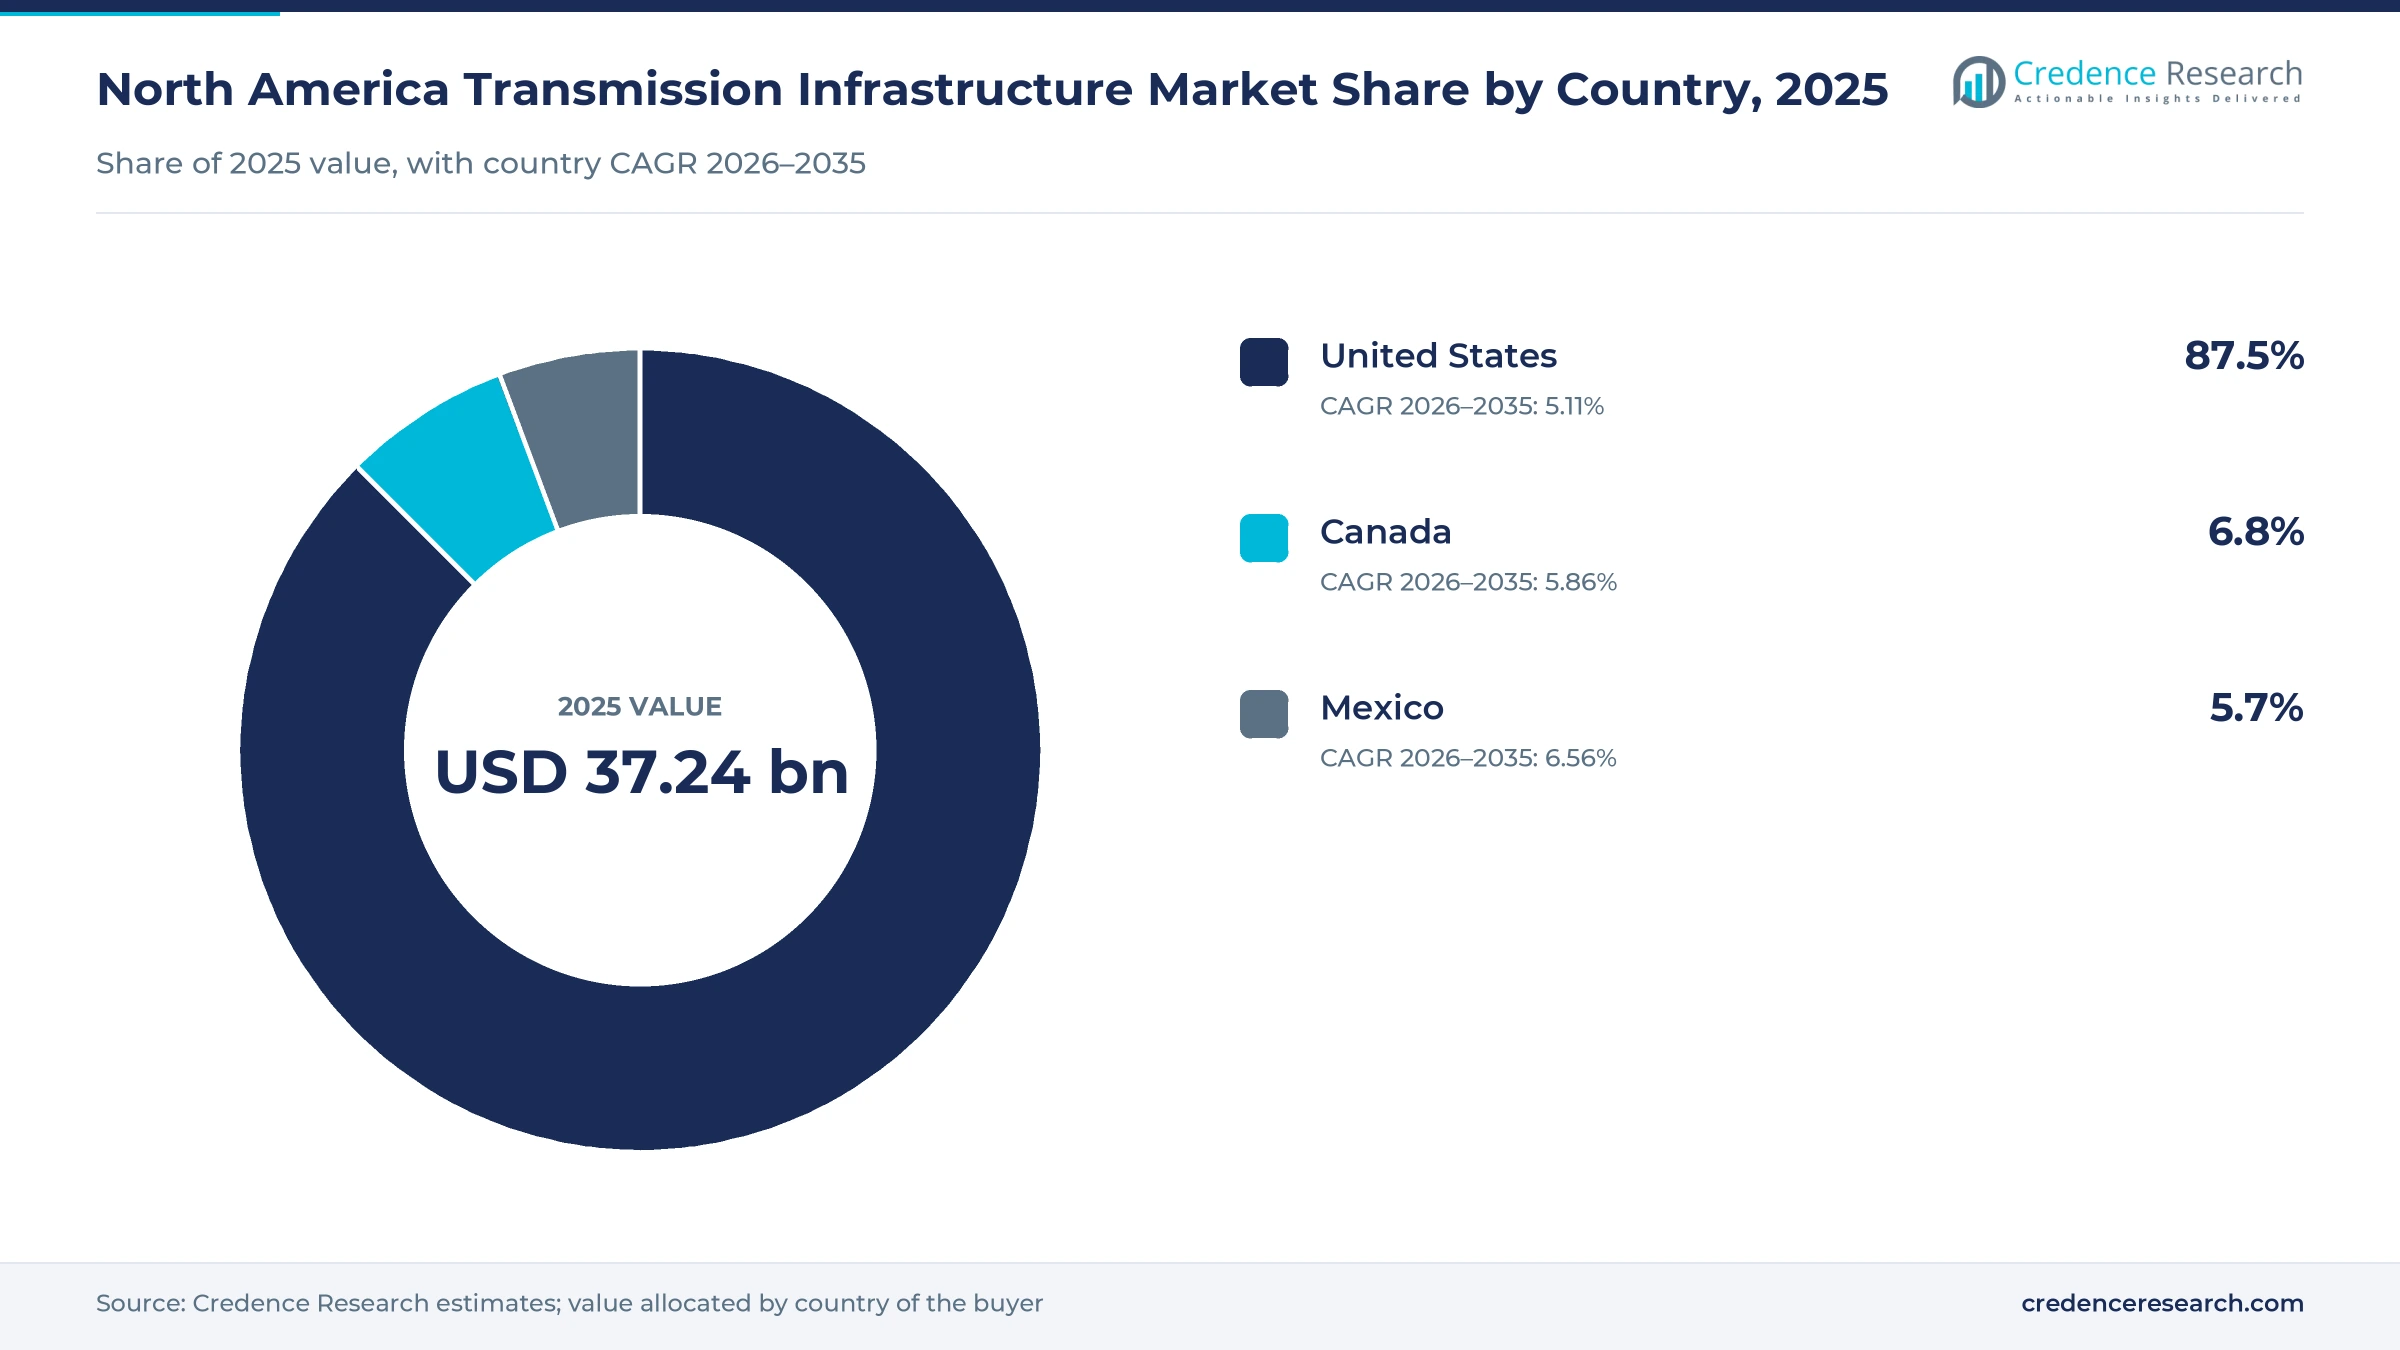
The North America transmission infrastructure market was valued at USD 37.24 billion in 2025 and is projected to increase from USD 39.29 billion in 2026 to USD 62.27 billion by 2035, registering a CAGR of 5.25% during 2026–2035. Demand comes from utilities and grid operators that must connect very large data center and industrial loads, replace aging lines and substations, and move new wind, solar and gas output to cities. United States held the largest country share, 87.5% in 2025, because regional grid operators there approved the largest multiyear project portfolios on the continent. Mexico is the fastest-growing country at 6.56% a year, helped by the federal utility's six-year plan for new lines and substations. On the regulatory side, the federal long-term planning rule of May 2024 now requires transmission providers to plan 20 years ahead, which favors larger 500 kV and 765 kV projects over piecemeal upgrades.
What does North America transmission infrastructure cover?
This report counts spending on high-voltage transmission assets in the United States, Canada and Mexico, including overhead lines, underground and submarine cable systems, AC substations, HVDC converter stations and the digital systems that monitor and rate them. Buyers are investor-owned, public and cooperative utilities, independent developers and large customers that pay for dedicated connections, and they purchase through equipment supply, turnkey EPC, construction-only and service contracts.
The scope excludes low-voltage distribution networks, meters, generation plant equipment inside the fence and the cost of electricity itself. The value chain runs from steel, conductor, cable and transformer makers through engineering firms and line contractors to the utilities and developers that own and operate the assets, and values reflect the contract price paid by the asset owner.
North America Transmission Infrastructure Market Insights
- The market grows from USD 37.24 billion in 2025 to USD 62.27 billion by 2035, a 5.25% CAGR, as grid operators approve multiyear 345 kV, 500 kV and 765 kV portfolios.
- United States led with 87.5% of 2025 value, while Mexico grows fastest at 6.56% a year under a USD 8.177 billion federal transmission plan.
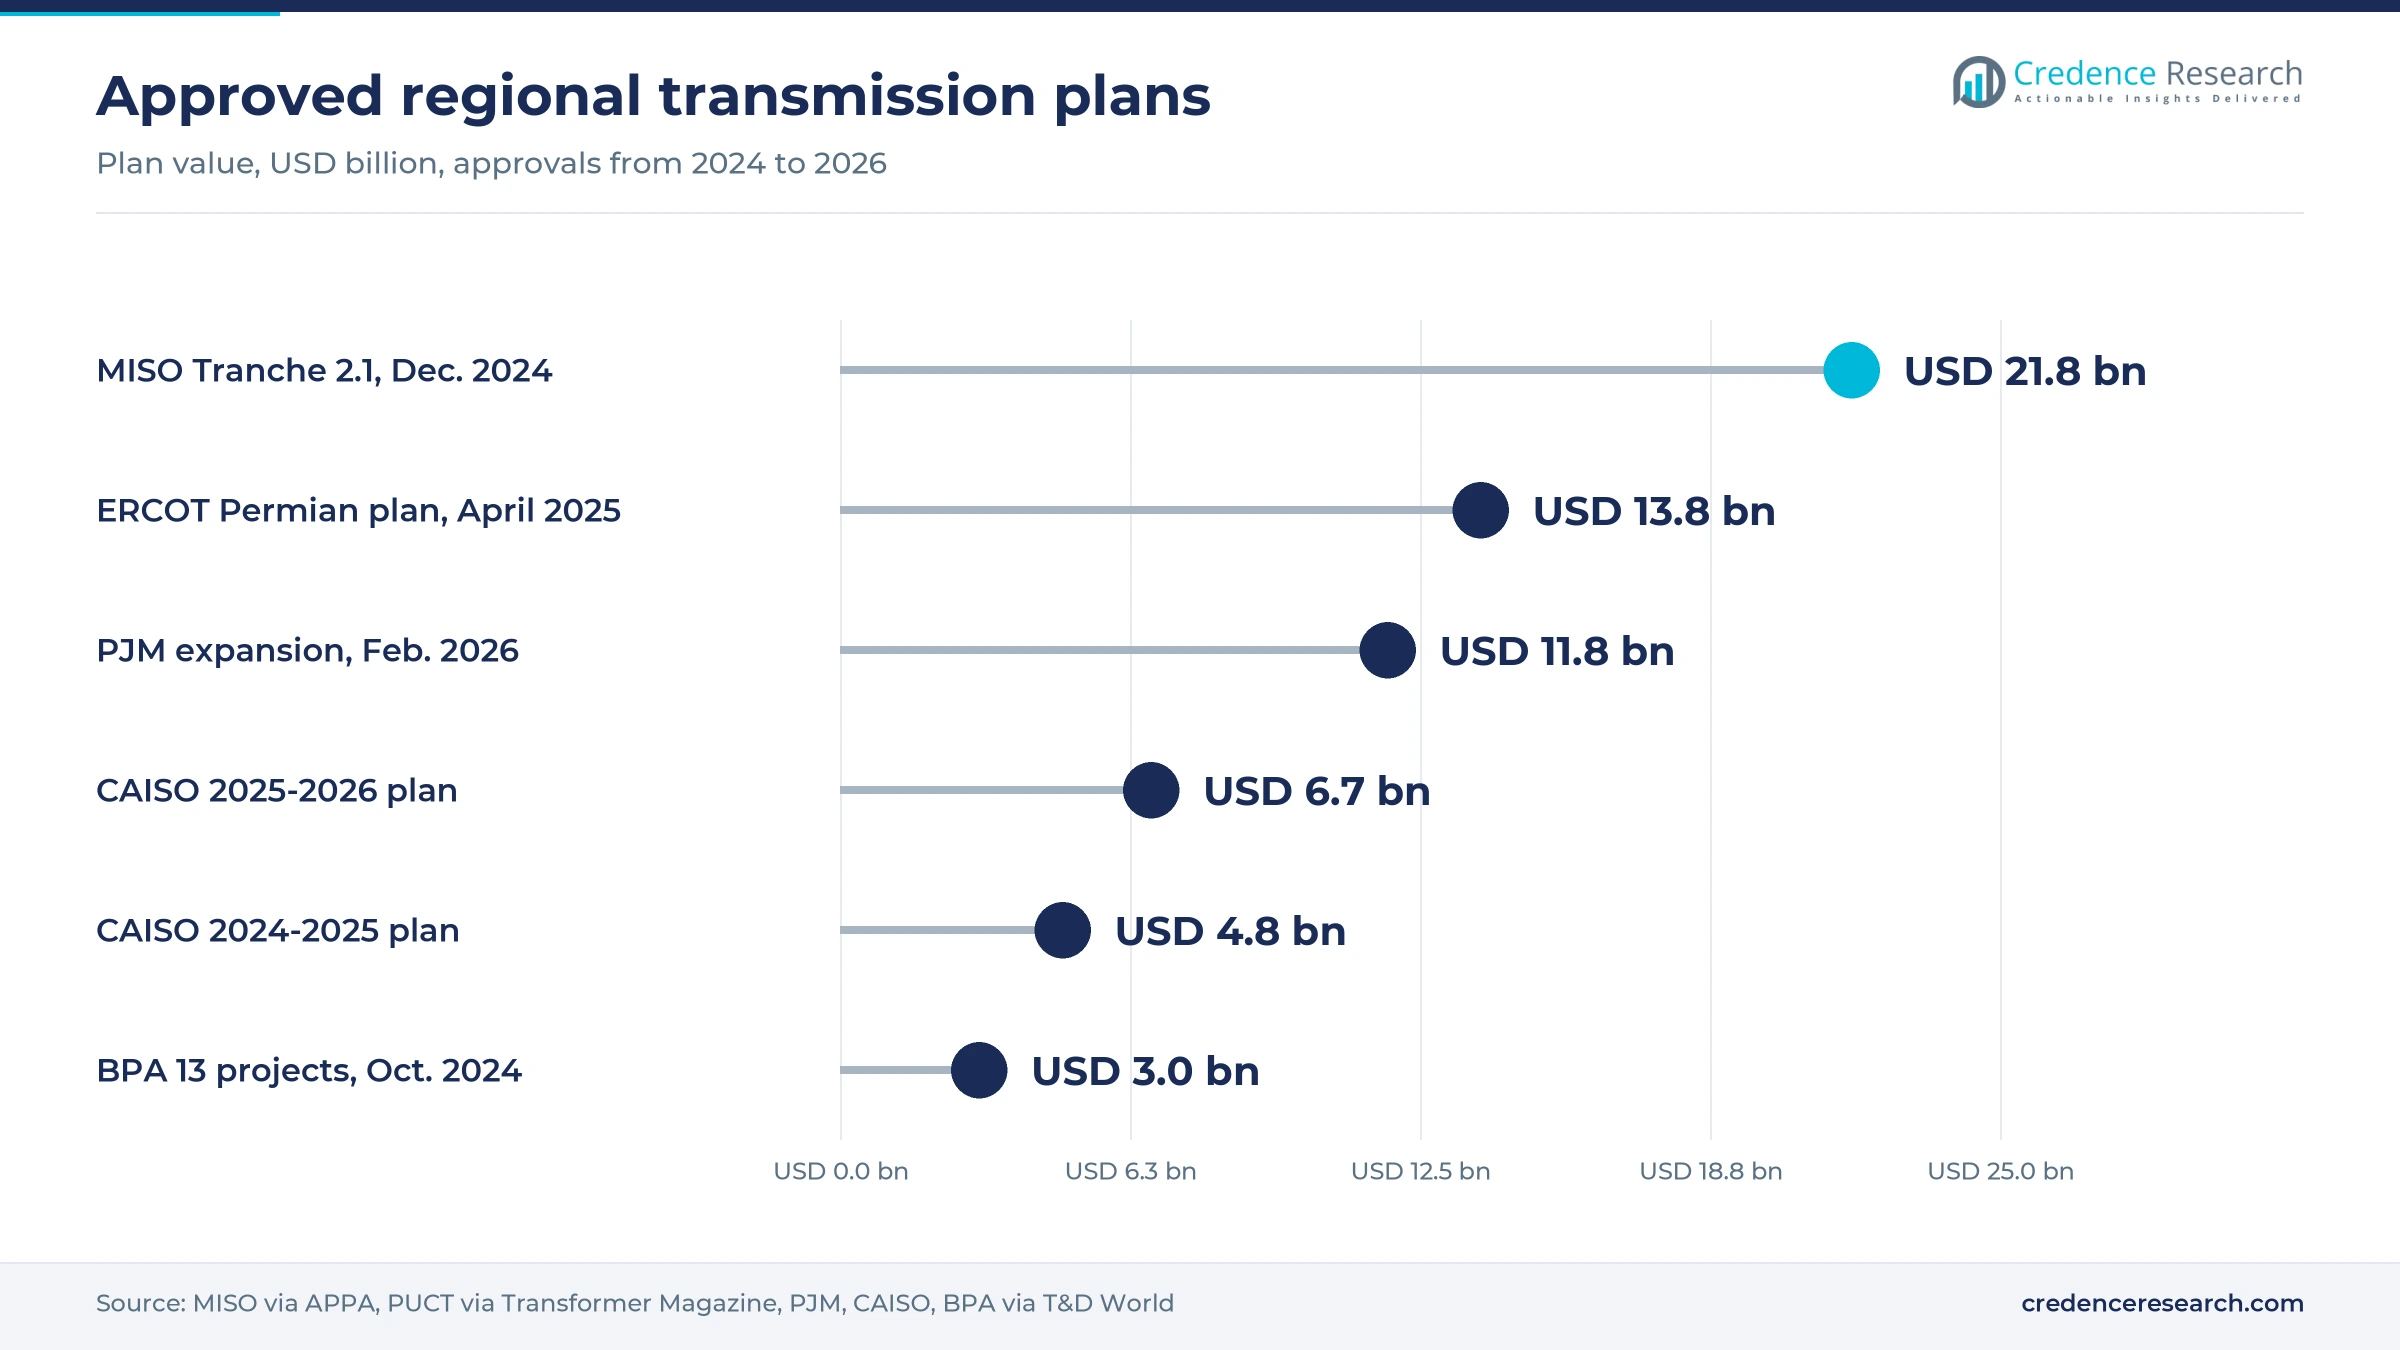
- Shared Utility Network held 62.0% of 2025 value because regional portfolios such as the USD 21.8 billion MISO Tranche 2.1 serve all customers.
- ERCOT reported about 233 GW of large-load interconnection requests under review in January 2026, with data centers making up more than 70% of the total.
- Hitachi Energy, Siemens Energy and Hyosung Heavy Industries have all announced U.S. transformer plant expansions since 2024 to shorten multiyear delivery queues.
Greenfield lines and utility-owned assets hold most value
Why does greenfield expansion lead project spending?
Based on project type, the market is categorized into greenfield expansion, asset replacement, capacity uprating and outsourced lifecycle support. Greenfield Expansion led with 44.0% of 2025 value because regional operators now approve long new corridors rather than single upgrades. The MISO Tranche 2.1 portfolio approved on Dec. 12, 2024, alone covers 3,631 miles and USD 21.8 billion, according to the American Public Power Association. Capacity Uprating grows fastest at 6.16% a year, as FERC Order 881 required hourly ambient-adjusted line ratings by July 12, 2025, which Burns & McDonnell notes can lift ratings by up to 10% in some regions.
How do overhead lines keep the largest asset share?
Based on asset type, the market is categorized into overhead transmission lines, underground and submarine cable systems, AC transmission substations and HVDC converter stations. Overhead Transmission Lines led with 41.0% of 2025 value because long rural corridors remain far cheaper to build above ground than in cable. The Texas plan for the Permian Basin, valued at USD 13.8 billion according to Transformer Magazine, relies on the state's first 765 kV overhead lines. HVDC Converter Stations grow fastest at 7.15% a year, as the SunZia line in New Mexico and Arizona uses two converter stations for 3,000 MW, according to its 2026 WECC progress report.
Which end-use sectors drive new transmission value?
Based on end-use sector, the market is categorized into shared utility network, generation interconnection, dedicated data center connections and dedicated manufacturing connections. Shared Utility Network led with 62.0% of 2025 value because most approved projects are planned for all customers and recovered through regional tariffs. The PJM board approved about USD 11.8 billion of such network expansion on Feb. 12, 2026, selected from 134 proposals submitted by 19 entities. Dedicated Data Center Connections grow fastest at 8.05% a year, as Dominion Energy reported about 40 GW of data center capacity in contracting stages in December 2024, up from 21 GW in July.
Why do investor-owned utilities own most new assets?
Based on ownership model, the market is categorized into investor-owned utility assets, public utility assets, cooperative utility assets and independent transmission assets. Investor-Owned Utility Assets led with 64.0% of 2025 value because these companies own most of the bulk grid in the United States. According to the U.S. Energy Information Administration in November 2024, transmission spending by major utilities reached USD 27.7 billion in 2023. Independent Transmission Assets grow fastest at 6.71% a year, as merchant links such as the 1,250 MW Champlain Hudson Power Express, developed by Transmission Developers, began commercial operation in June 2026.
| Segment Group | Leading Sub-segment | Share, 2025 | Fastest-growing Sub-segment | CAGR, 2026–2035 |
|---|---|---|---|---|
| By Project Type | Greenfield Expansion | 44.0% | Capacity Uprating | 6.16% |
| By Asset Type | Overhead Transmission Lines | 41.0% | HVDC Converter Stations | 7.15% |
| By End-Use Sector | Shared Utility Network | 62.0% | Dedicated Data Center Connections | 8.05% |
| By Ownership Model | Investor-Owned Utility Assets | 64.0% | Independent Transmission Assets | 6.71% |
Request a Free Sample
Fill in your details and we'll send you a free sample report.
- Sample data tables & charts
- Research methodology
Data center loads and long-range plans drive grid capital
Large-load connection requirements strain regional grids
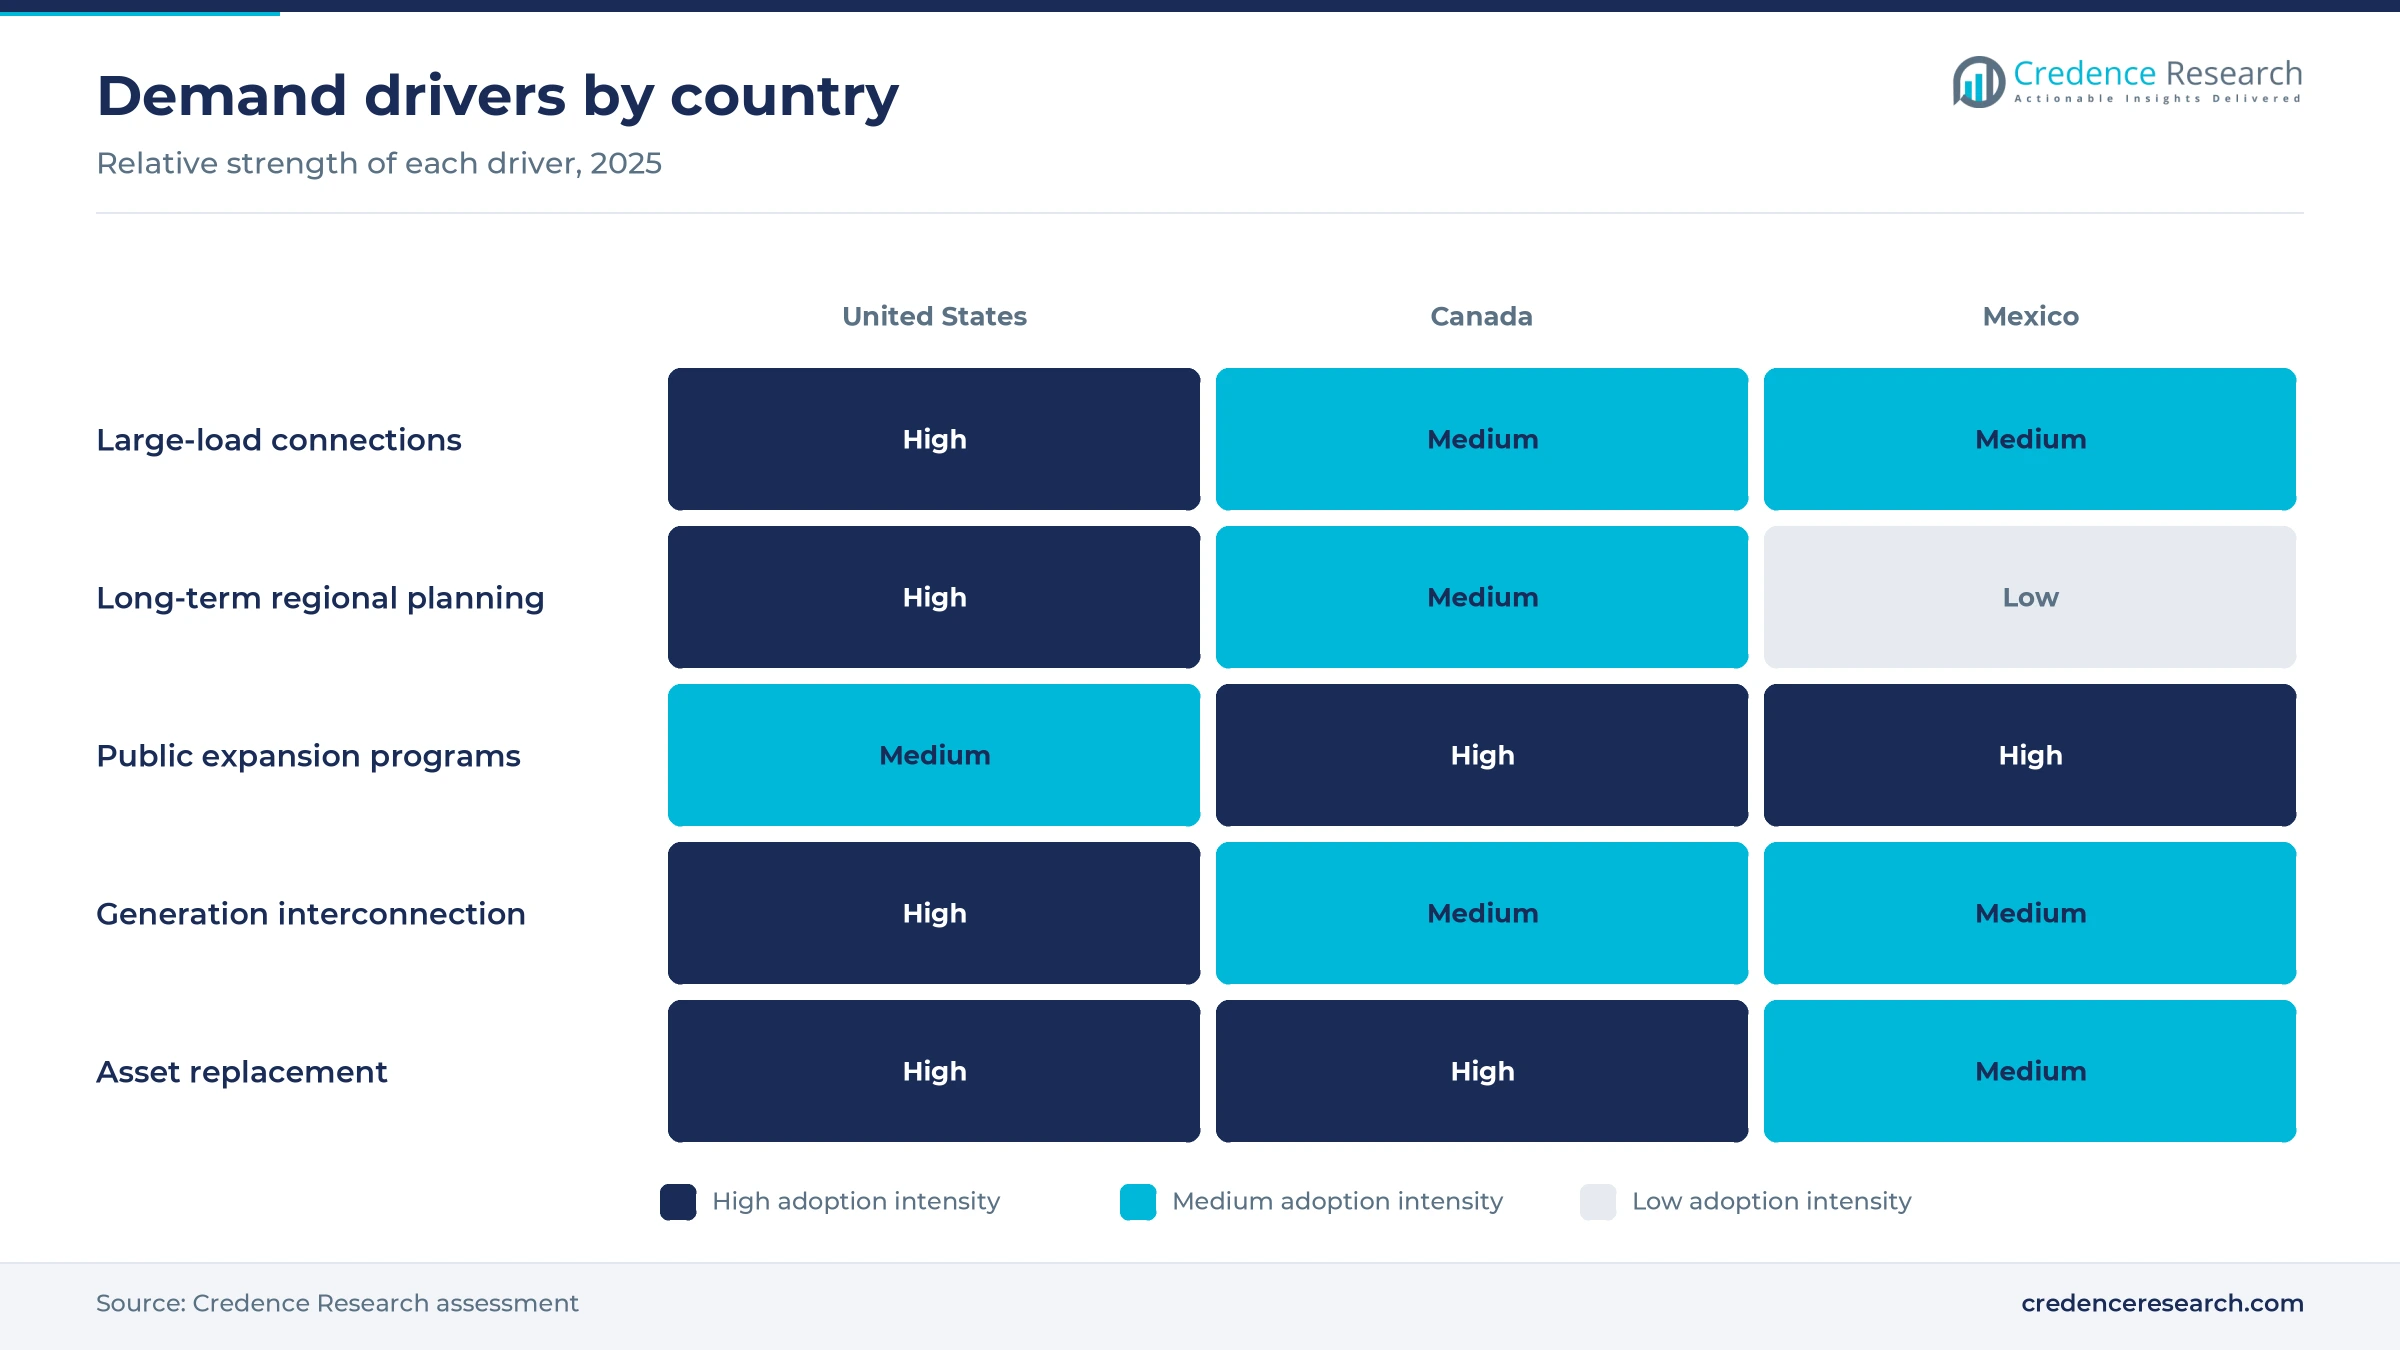
Large-load connection requirements are the first driver, because data centers, chip plants and electrified oil fields need new high-voltage supply quickly. According to Utility Dive in January 2026, ERCOT had about 233 GW of large-load interconnection requests under review, nearly 300% above the 2024 year-end total. Data centers made up more than 70% of that queue, and Texas Senate Bill 6, signed on June 21, 2025, now makes loads above 75 MW share connection costs. In Virginia, Dominion Energy said in December 2024 that two new 500 kV lines could support 6 GW more load in Loudoun County, much of it for data center power management and cooling. As a result, Dedicated Data Center Connections grow at 8.05% a year, the fastest end-use sector in the market.
Long-term network planning turns studies into portfolios
Long-term network planning is the second driver, as regulators now ask grid operators to approve large portfolios instead of one-off fixes. FERC Order 1920, issued on May 13, 2024, requires at least three long-term scenarios covering 20 years, with the first planning cycles due to start by June 2026. The MISO board approved a USD 21.8 billion portfolio with a 765 kV backbone on Dec. 12, 2024, as part of 488 projects. The California ISO approved a USD 6.7 billion plan with 38 projects in May 2026, after a USD 4.8 billion plan with 31 projects in May 2025. This steady approval cycle gives line contractors and equipment makers a visible pipeline of work for several years.
National and provincial expansion programs add new corridors
National and provincial expansion programs are the third driver, because public utilities in Canada and Mexico are funding grid growth through multiyear state plans. In Mexico, CFE will invest USD 8.177 billion between 2025 and 2030 in 275 new transmission lines and 524 substation works. Uno TV reported in August 2025 that the plan adds more than 6,000 km of circuit to a network of about 11,000 km of lines and 2,300 substations. In Canada, Hydro-Québec's Action Plan 2035 includes 5,000 km of new lines, while Ontario directed Hydro One in December 2024 to build a 260 km line in the northeast. These programs make Mexico the fastest-growing country in the regional market.
Generation interconnection backlogs require new capacity
Generation interconnection backlogs are the fourth driver, since new power plants cannot sell output until the grid can carry it. The Lawrence Berkeley National Laboratory found about 1,400 GW of generation and roughly 890 GW of storage active in U.S. queues at the end of 2024. Solar made up 956 GW of that generation, wind 271 GW and natural gas 136 GW, so most projects need long lines from remote sites. The Edison Electric Institute said in October 2025 that its members had 91 GW of generation under construction and 488 GW planned or proposed over five years. In turn, grid owners are squeezing more power from existing corridors while new lines move through permitting.
765 kV backbones and merchant HVDC links reshape grids
Shift to 765 kV backbones in regional plans
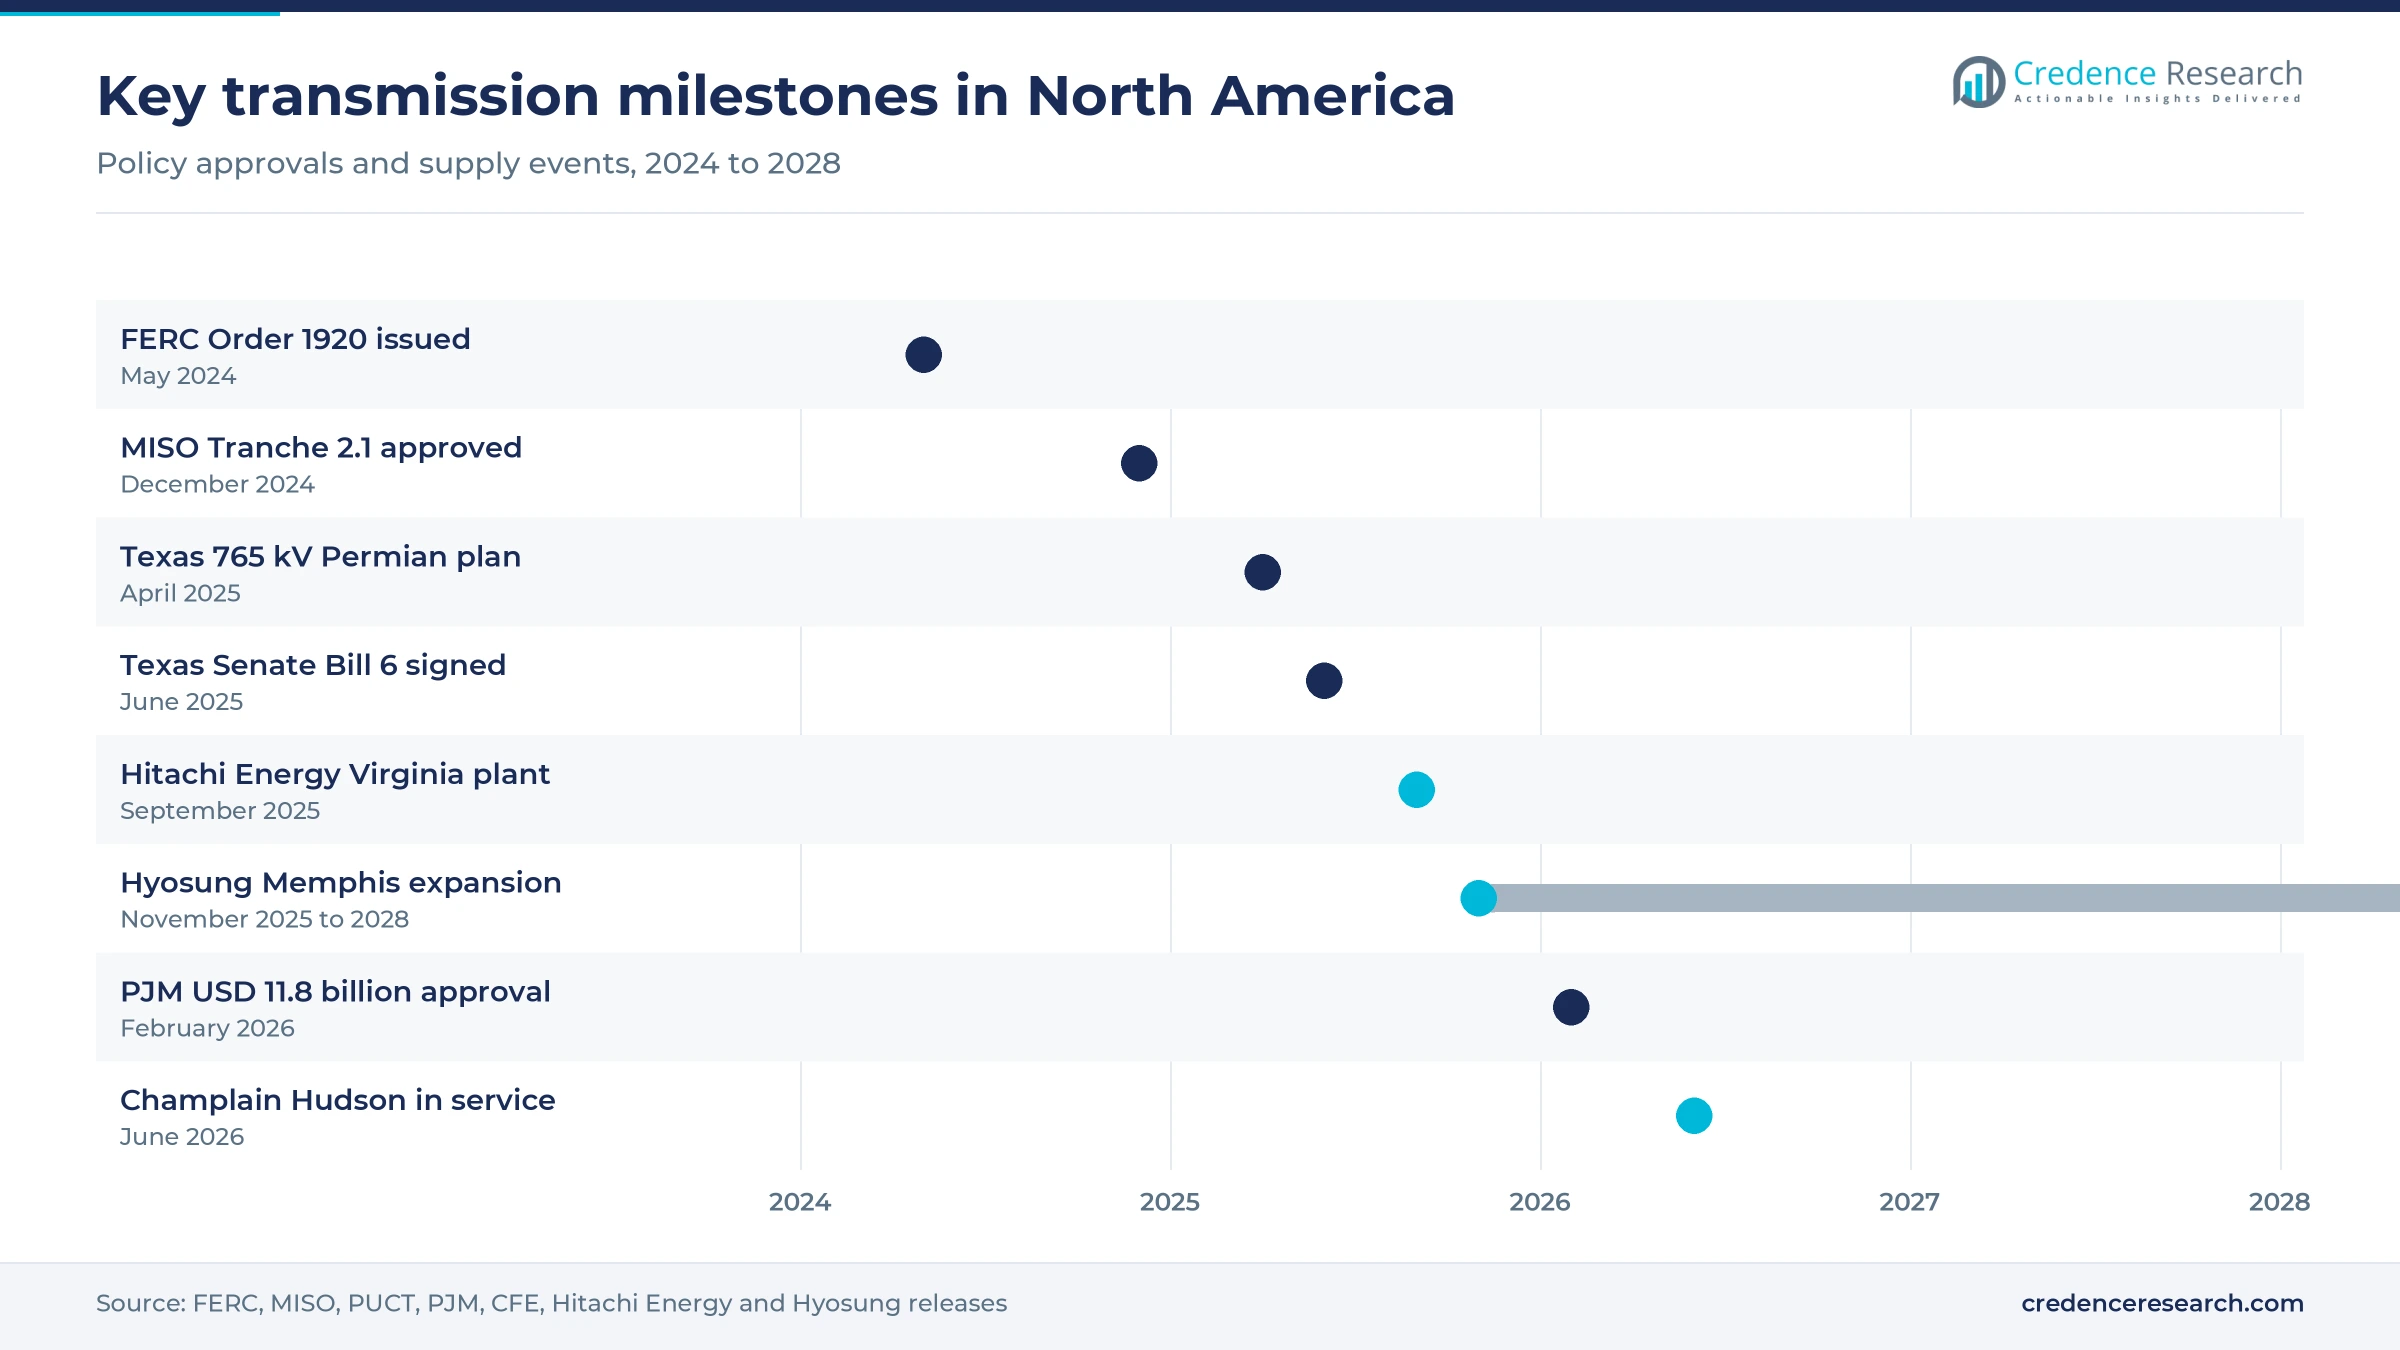
A shift to 765 kV backbones is the clearest design trend, because one extra-high-voltage line carries several times the power of a 345 kV circuit. MISO's Tranche 2.1 portfolio of December 2024 is built around a 765 kV backbone within its 3,631 miles, according to the American Public Power Association. Texas regulators chose 765 kV for the Permian Basin plan in April 2025, even though T&D World reported the option may cost about 22% more than a 345 kV design. The PJM board then included 765 kV lines in its Feb. 12, 2026, approval. Hyosung Heavy Industries said in November 2025 that its Memphis plant is the only U.S. site that designs and makes 765 kV transformers.
Rise of merchant HVDC links for long-distance supply
The rise of merchant HVDC links is the second trend, as private developers build point-to-point lines that sell capacity to distant buyers. The SunZia ±525 kV line runs about 550 miles from New Mexico to Arizona and was expected to reach full transfer capability in March 2026, according to WECC filings. In New York, Hitachi Energy reported that the 1,250 MW Champlain Hudson Power Express began commercial operation on June 16, 2026, able to meet nearly 20% of New York City's electricity needs. However, the Department of Energy canceled a USD 4.9 billion loan guarantee for the 800-mile Grain Belt Express on July 23, 2025. This mix explains why HVDC Converter Stations grow at 7.15% a year.
Domestic transformer capacity opens supply contracts
Domestic transformer capacity is a clear opportunity, because North American buyers want shorter queues for the largest grid equipment. Virginia Governor Glenn Youngkin announced on Sept. 4, 2025, that Hitachi Energy will invest USD 457 million in South Boston, creating 825 jobs at what will be the largest U.S. large power transformer site. Siemens Energy is building a USD 149.8 million plant in Charlotte, North Carolina, that will make 24 large power transformers a year, rising to 57, according to Manufacturing Dive. Hyosung Heavy Industries plans a USD 157 million expansion in Memphis by 2028. This new capacity supports transformer supply for AC Transmission Substations and for Overhead Transmission Lines, which alone hold 41.0% of asset value.
Grid-enhancing technologies create uprating demand
Grid-enhancing technologies are a second opportunity, since utilities can raise line capacity faster than they can permit new corridors. FERC Order 881 required transmission providers to use hourly ambient-adjusted ratings with a 10-day look-ahead by July 12, 2025, according to Burns & McDonnell. The PJM approval of February 2026 also included advanced conductors and the first underground HVDC line in its footprint, according to PJM Inside Lines. GE Vernova said on Jan. 29, 2025, that it would invest nearly USD 20 million in switchgear and instrument transformer lines in Charleroi, Pennsylvania and Clearwater, Florida. As a result, Capacity Uprating grows at 6.16% a year.
Equipment queues, slow permits and cost fights delay lines
Multiyear equipment queues delay energization
Equipment queues are the first challenge, because large transformers and breakers are ordered years before a line is energized. Utility Dive reported in February 2025 that Wood Mackenzie put lead times for large transformers at 80 to 120 weeks, while Hitachi Energy cited three to six years for transmission-scale units. Developers and utilities therefore reserve factory slots early, which ties up capital and raises cancellation risk if plans change.
Slow line construction lags the needed pace
Slow construction is the second challenge, since approvals do not translate quickly into finished miles. Grid Strategies reported in July 2025 that only 322 miles of new 345 kV and higher lines were completed in 2024, against roughly 5,000 miles a year it estimates are needed. Permitting across several states, landowner disputes and crew shortages stretch schedules, so contractors with large line crews win most work.
Federal financing support has become less certain
Federal financing uncertainty is the third challenge for independent developers that rely on public credit support. The Department of Energy terminated its USD 4.9 billion conditional loan guarantee for the Grain Belt Express on July 23, 2025, after saying its conditions were unlikely to be met. Merchant developers must now lean more on private lenders and offtake contracts, which can raise financing costs and push back construction start dates.
Cost allocation disputes raise affordability concerns
Cost allocation is the fourth challenge, because customers in one area often pay for lines that mainly serve another. T&D World reported in April 2025 that the 765 kV Permian design may cost about 22% more than the 345 kV alternative, and Texas Senate Bill 6 of June 2025 now shifts part of connection costs to loads above 75 MW. Such disputes can lengthen approvals, although clearer large-load tariffs give developers firmer revenue.
The United States leads while Mexico grows fastest
| Country | Value, 2025 (USD billion) | Share, 2025 | CAGR, 2026–2035 |
|---|---|---|---|
| United States | 32.58 | 87.5% | 5.11% |
| Canada | 2.53 | 6.8% | 5.86% |
| Mexico | 2.12 | 5.7% | 6.56% |
United States leads on regional operator portfolios
The United States held 87.5% of 2025 value and grows at 5.11% a year, the largest share by far. Its regional operators approved the biggest portfolios in North America, including the MISO Tranche 2.1 portfolio in December 2024 and about USD 11.8 billion at PJM in February 2026. Texas adds the USD 13.8 billion Permian Basin plan, while the California ISO approved USD 6.7 billion in May 2026, so demand comes from every major interconnection.
Canada grows on provincial utility programs
Canada held 6.8% of 2025 value and grows at 5.86% a year as provincial utilities expand export and mining corridors. Hydro-Québec plans 5,000 km of new lines under Action Plan 2035, and the 1,250 MW Champlain Hudson link now carries its hydropower to New York. In Ontario, Hydro One was directed in December 2024 to build a 260 km northeast line built to 500 kV, while the federal 15% clean electricity credit covers transmission equipment from 2024 to 2034.
Mexico is the fastest-growing country
Mexico held 5.7% of 2025 value and grows at 6.56% a year, the fastest rate among the three countries. The Federal Electricity Commission plans to invest USD 8.177 billion in transmission between 2025 and 2030, covering 275 new lines and 524 substation works. This program adds more than 6,000 km of circuit to a grid of about 11,000 km, according to Uno TV, so new demand starts from a small base and grows quickly.
Portfolio approvals and factory expansions mark 2024–2026
| Development | Status and market relevance |
|---|---|
| In December 2024, the MISO board approved the USD 21.8 billion Tranche 2.1 portfolio, covering 3,631 miles with a 765 kV backbone. | Approved; projects move into state permitting and construction |
| In September 2025, Hitachi Energy announced a USD 457 million large power transformer expansion in South Boston, Virginia, with 825 jobs. | Under construction; part of a USD 1 billion U.S. investment |
| In November 2025, Hyosung Heavy Industries said it would invest USD 157 million to more than double output at its Memphis transformer plant. | Planned completion in 2028; supports 765 kV supply |
| In February 2026, the PJM board approved about USD 11.8 billion of new lines, including 765 kV circuits and an underground HVDC link. | Approved; developers selected from 134 proposals |
| In June 2026, Hitachi Energy, Hydro-Québec and Transmission Developers started commercial operation of the 1,250 MW Champlain Hudson Power Express. | In service; able to meet nearly 20% of New York City needs |
HVDC converters and dynamic ratings change grid design
- Voltage source converter HVDC systems such as the HVDC Light design at the ±400 kV Champlain Hudson link fit compact urban converter stations and long buried cable routes.
- 765 kV AC lines carry far more power per corridor than 345 kV circuits, which is why MISO, Texas and PJM chose them for new backbones.
- Ambient-adjusted ratings replace fixed seasonal limits with hourly ratings based on local weather forecasts, as FERC Order 881 required from July 2025.
- Advanced conductors let utilities rebuild existing corridors with higher-capacity wire, and PJM included them in its February 2026 project selection.
Need a Custom Version of This Report?
Tailor the scope, geography, or segments to your exact requirements.
- Custom geography or segment scope
- Direct access to our analyst team
Contractors and equipment makers compete on delivery slots
Competition in North American transmission is split between line contractors, engineering firms and equipment makers, and the scarcest resource is delivery capacity rather than customers. Quanta Services competes on turnkey line construction and was chosen to build the SunZia HVDC line of about 550 miles, while Hitachi Energy supplied its converter stations and the HVDC Light system for the Champlain Hudson link. Equipment makers are adding plants to win multiyear framework orders, with Hitachi Energy in Virginia, Siemens Energy in North Carolina and Hyosung Heavy Industries in Tennessee all expanding transformer output. GE Vernova is investing in switchgear and instrument transformer lines in Pennsylvania and Florida. Prysmian strengthened its North American position in high-voltage power cables and wire by completing the Encore Wire acquisition on July 2, 2024. Burns & McDonnell competes on engineering and rating software tied to FERC Order 881 compliance. Buyers increasingly reserve factory slots and crews years ahead, which favors suppliers with domestic capacity.
Companies profiled and their roles in this market
| Company | Type | Role in the market |
|---|---|---|
| Quanta Services | Line contractor | Turnkey contractor for the SunZia ±525 kV HVDC line of about 550 miles |
| Hitachi Energy | Equipment maker | HVDC converters for SunZia and Champlain Hudson; USD 457 million Virginia transformer expansion |
| Siemens Energy | Equipment maker | Large power transformer plant in Charlotte, North Carolina |
| Hyosung Heavy Industries | Equipment maker | Only U.S. maker of 765 kV transformers, expanding its Memphis plant |
| GE Vernova | Equipment maker | Switchgear and instrument transformer lines in Pennsylvania and Florida |
| Prysmian | Cable maker | Completed the Encore Wire acquisition in July 2024 to widen North American supply |
| Burns & McDonnell | Engineering firm | Engineering and ambient-adjusted rating software for FERC Order 881 |
Delivery capacity, not demand, will set the growth pace
Credence Research's view is that the market will be limited more by delivery capacity than by demand through the forecast period. Grid operators have already approved tens of billions of dollars in new lines, and large-load requests in Texas alone reached about 233 GW. The constraint is the pace of permits, crews and transformer slots, as shown by the 322 miles of extra-high-voltage line completed in 2024. In North American transmission infrastructure, suppliers with domestic factories and contractors with large line crews are best placed, while buyers that reserve capacity early will energize projects first. Uprating existing corridors offers the quickest relief while new backbones are built.
How Credence Research built this regional estimate
The report uses 2025 as the base year and forecasts values to 2035 through the Credence Research market model. Market values come from that model, and country, segment and growth splits are Credence Research estimates built from public data. Sources include U.S. Energy Information Administration statistics, regional grid operator plans from MISO, PJM, ERCOT and the California ISO, Mexican government releases, Canadian utility plans, laboratory studies and company announcements. No interviews or surveys were used, and every dated event in the report was checked against a published source.
Extra-high-voltage builds keep spending rising to 2035
Through 2035 the market grows from USD 39.29 billion in 2026 to USD 62.27 billion, as portfolios approved in 2024, 2025 and 2026 move from permitting into construction. Extra-high-voltage 765 kV lines, merchant HVDC links and dedicated connections for data centers will take a rising share of spending. Mexico and Canada add value through public utility programs, while the United States keeps the largest share. The main risks are equipment shortages, slow permits and cost allocation disputes, which could shift spending toward uprating existing lines rather than new corridors.
Frequently Asked Questions
How big is the North America transmission infrastructure market?
Which country leads the North America transmission infrastructure market?
Which country grows fastest in this market?
Why do data centers matter for transmission spending?
Which asset type holds the largest share?
What slows new transmission projects in North America?
How does FERC Order 1920 affect the market?
Who are the main companies in this market?
Table of Content
Chapter 1 Market Segmentation
- 1.1 Segmentation Framework
- 1.1.1 Product and Service Classification
- 1.1.2 Application and End-Use Classification
- 1.1.3 Technology and Solution Classification
- 1.1.4 Customer and Distribution Channel Classification
- 1.1.5 Geographic Segmentation
- 1.1.6 Market Segment Definitions and Boundaries
- 1.2 By Project Type
- 1.2.1 Greenfield Expansion
- 1.2.2 Asset Replacement
- 1.2.3 Capacity Uprating
- 1.2.4 Outsourced Lifecycle Support
- 1.3 By Asset Type
- 1.3.1 Overhead Transmission Lines
- 1.3.2 Underground and Submarine Cable Systems
- 1.3.3 AC Transmission Substations
- 1.3.4 HVDC Converter Stations
- 1.4 By End-Use Sector
- 1.4.1 Shared Utility Network
- 1.4.2 Generation Interconnection
- 1.4.3 Dedicated Data Center Connections
- 1.4.4 Dedicated Manufacturing Connections
- 1.5 By Ownership Model
- 1.5.1 Investor-Owned Utility Assets
- 1.5.2 Public Utility Assets
- 1.5.3 Cooperative Utility Assets
- 1.5.4 Independent Transmission Assets
- 1.6 By Country
- 1.6.1 United States
- 1.6.2 Canada
- 1.6.3 Mexico
Chapter 2 Introduction
- 2.1 Report Objectives and Scope
- 2.2 Product Definition and Industry Terminology
- 2.3 Market Inclusions and Exclusions
- 2.4 Research Process
- 2.4.1 Primary Research and Expert Interviews
- 2.4.2 Secondary Research and Source Review
- 2.4.3 Top-Down and Bottom-Up Estimation
- 2.4.4 Data Triangulation and Verification
- 2.5 Market Size Measurement Basis
- 2.5.1 2025: USD 37.24 billion → 2035: USD 62.27 billion
- 2.6 Historical and Forecast Reference Periods
- 2.6.1 Historical Period: 2018-2025
- 2.6.2 Base Year: 2025
- 2.6.3 Forecast Period: 2025-2035
- 2.7 Research Assumptions and Limitations
Chapter 3 Executive Summary
- 3.1 Market Snapshot and Key Findings
- 3.2 Base-Year Market Size, 2025
- 3.3 Forecast Market Size, 2035
- 3.4 Revenue and Volume Growth Outlook
- 3.5 Key Demand and Supply Indicators
- 3.6 Leading Market Segments
- 3.7 Fastest-Growing Market Opportunities
- 3.8 Regional Performance Highlights
- 3.9 Technology and Industry Transformation
- 3.10 Competitive Landscape Summary
- 3.11 Analyst View and Strategic Implications
Chapter 4 North America Transmission Infrastructure Market Trends and Developments
- 4.1 Historical Industry Development, 2018-2025
- 4.2 Recent Market Trends and Developments
- 4.3 Demand and Customer Behavior Trends
- 4.4 Technology and Product Innovation
- 4.5 Artificial Intelligence, Automation and Digitalization
- 4.6 Local Manufacturing and Supply Chain Realignment
- 4.7 Industry Partnerships, Mergers and Acquisitions
- 4.8 Sustainability and Circular Economy Developments
- 4.9 Government and Private Sector Investment Trends
- 4.10 Emerging Business Models and Commercialization
- 4.11 Industry Developments and Announcements
Chapter 5 North America Transmission Infrastructure Market Production, Supply and Demand Analysis
- 5.1 Demand Trend and Consumption Analysis, 2018-2025
- 5.2 Demand Forecast, 2025-2035
- 5.3 Production and Output Trend, 2018-2025
- 5.4 Production and Output Forecast, 2025-2035
- 5.5 Installed Capacity and Capacity Utilization
- 5.6 Company-Wise Production Plants and Statistics
- 5.6.1 Installed Production Capacity
- 5.6.2 Actual Production
- 5.6.3 Planned Capacity and Expansion Targets
- 5.7 Supply Chain Structure and Procurement Trends
- 5.8 Supply-Demand Gap and Bottlenecks
- 5.9 Import Dependence and Sourcing Structure
- 5.10 Contract Manufacturing and Outsourcing
- 5.11 Regional Supply and Demand Concentration
Chapter 6 North America Transmission Infrastructure Market Pricing Analysis
- 6.1 Pricing Structure and Measurement
- 6.2 Historical Pricing Trends, 2018-2025
- 6.3 Pricing Outlook, 2025-2035
- 6.4 Average Selling Price and Unit Economics
- 6.5 Pricing by Product and Market Segment
- 6.6 Geographic Pricing Differences
- 6.7 Key Input, Energy, Labor and Logistics Costs
- 6.8 Contract Pricing and Purchasing Models
- 6.9 Pricing Sensitivity and Competitive Positioning
- 6.10 Price, Margin and Profitability Implications
Chapter 7 North America Transmission Infrastructure Market Dynamics
- 7.1 Market Growth Drivers
- 7.1.1 Demand-Side Drivers
- 7.1.2 Technology and Innovation Drivers
- 7.1.3 Infrastructure and Investment Drivers
- 7.1.4 Regulatory and Policy Drivers
- 7.2 Market Restraints
- 7.2.1 Cost and Affordability Constraints
- 7.2.2 Technology and Adoption Barriers
- 7.2.3 Supply Chain and Operational Constraints
- 7.3 Market Challenges
- 7.3.1 Competitive Pressure and Margin Erosion
- 7.3.2 Skills, Infrastructure and Implementation Gaps
- 7.4 Emerging Market Opportunities
- 7.5 Market Dynamics Impact and Time-Horizon Assessment
Chapter 8 North America Transmission Infrastructure Value Chain Analysis
- 8.1 Industry Value Chain Overview
- 8.2 Upstream Suppliers and Critical Inputs
- 8.3 Technology and Component Providers
- 8.4 Manufacturing or Service Delivery
- 8.5 Distribution, Channel Partners and Integrators
- 8.6 Downstream Applications and End Users
- 8.7 Value Addition and Profit Pools
- 8.8 Vertical Integration and Outsourcing
- 8.9 Supplier Concentration and Risk
- 8.10 Supply Chain Localization and Resilience
Chapter 9 North America Transmission Infrastructure Market Regulations and Policies
- 9.1 Relevant Laws, Standards and Compliance Frameworks
- 9.2 Product, Service, Safety and Quality Requirements
- 9.3 Government Policies, Incentives and Subsidies
- 9.4 Imports, Exports and Trade Barriers
- 9.5 Public Procurement and Local Content Requirements
- 9.6 Environmental and Sustainability Compliance
- 9.7 Upcoming Policy Changes and Market Implications
Chapter 10 North America Transmission Infrastructure Market Hotspots and Opportunities
- 10.1 Market Opportunity Mapping and Growth Hotspots
- 10.2 High-Growth Applications and Customer Groups
- 10.3 Underserved Markets and White-Space Opportunities
- 10.4 Emerging Technology and Product Opportunities
- 10.5 New Capacity and Investment Hotspots
- 10.6 Market Entry and Expansion Opportunities
- 10.7 Distribution and Partnership Opportunities
- 10.8 Near-Term and Long-Term Commercial Potential
- 10.9 Opportunity Attractiveness and Execution Risks
Chapter 11 North America Transmission Infrastructure Market Outlook, 2025-2035
- 11.1 Market Size and Analysis
- 11.1.1 Revenue (Market Measurement: 2025: USD 37.24 billion → 2035: USD 62.27 billion)
- 11.1.2 Market Volume and Quantity Sold
- 11.1.3 Historical Market Size, 2018-2025
- 11.1.4 Base-Year Market Size, 2025
- 11.2 Market Forecast, 2025-2035
- 11.2.1 Revenue Forecast to 2035
- 11.2.2 Volume Forecast to 2035
- 11.2.3 CAGR and Year-on-Year Growth
- 11.2.4 Incremental Revenue Opportunity
- 11.3 Forecast Assumptions and Scenario Analysis
- 11.3.1 Base-Case Forecast
- 11.3.2 Optimistic and Conservative Scenarios
- 11.3.3 Technology, Pricing and Policy Sensitivities
- 11.4 Market Attractiveness and Growth Outlook
Chapter 12 North America Transmission Infrastructure Market Segmentation and Outlook
- 12.1 Segmentation Summary and Market Shares, 2025
- 12.2 Largest and Fastest-Growing Segments
- 12.3 By Project Type - Market Size and Forecast, 2025-2035
- 12.3.1 Segment Definition and Scope
- 12.3.2 Historical Market Size, 2018-2025
- 12.3.3 Revenue Forecast, 2025-2035
- 12.3.4 Volume Forecast, 2025-2035
- 12.3.5 Base-Year Market Share, 2025
- 12.3.6 Segment CAGR and Growth Drivers
- 12.3.7 Subsegment Market Size and Forecast
- 12.3.7.1 Greenfield Expansion
- 12.3.7.2 Asset Replacement
- 12.3.7.3 Capacity Uprating
- 12.3.7.4 Outsourced Lifecycle Support
- 12.3.8 Subsegment Pricing and Adoption Trends
- 12.3.9 Leading Suppliers and Competition
- 12.3.10 Regional Demand and Opportunities
- 12.4 By Asset Type - Market Size and Forecast, 2025-2035
- 12.4.1 Segment Definition and Scope
- 12.4.2 Historical Market Size, 2018-2025
- 12.4.3 Revenue Forecast, 2025-2035
- 12.4.4 Volume Forecast, 2025-2035
- 12.4.5 Base-Year Market Share, 2025
- 12.4.6 Segment CAGR and Growth Drivers
- 12.4.7 Subsegment Market Size and Forecast
- 12.4.7.1 Overhead Transmission Lines
- 12.4.7.2 Underground and Submarine Cable Systems
- 12.4.7.3 AC Transmission Substations
- 12.4.7.4 HVDC Converter Stations
- 12.4.8 Subsegment Pricing and Adoption Trends
- 12.4.9 Leading Suppliers and Competition
- 12.4.10 Regional Demand and Opportunities
- 12.5 By End-Use Sector - Market Size and Forecast, 2025-2035
- 12.5.1 Segment Definition and Scope
- 12.5.2 Historical Market Size, 2018-2025
- 12.5.3 Revenue Forecast, 2025-2035
- 12.5.4 Volume Forecast, 2025-2035
- 12.5.5 Base-Year Market Share, 2025
- 12.5.6 Segment CAGR and Growth Drivers
- 12.5.7 Subsegment Market Size and Forecast
- 12.5.7.1 Shared Utility Network
- 12.5.7.2 Generation Interconnection
- 12.5.7.3 Dedicated Data Center Connections
- 12.5.7.4 Dedicated Manufacturing Connections
- 12.5.8 Subsegment Pricing and Adoption Trends
- 12.5.9 Leading Suppliers and Competition
- 12.5.10 Regional Demand and Opportunities
- 12.6 By Ownership Model - Market Size and Forecast, 2025-2035
- 12.6.1 Segment Definition and Scope
- 12.6.2 Historical Market Size, 2018-2025
- 12.6.3 Revenue Forecast, 2025-2035
- 12.6.4 Volume Forecast, 2025-2035
- 12.6.5 Base-Year Market Share, 2025
- 12.6.6 Segment CAGR and Growth Drivers
- 12.6.7 Subsegment Market Size and Forecast
- 12.6.7.1 Investor-Owned Utility Assets
- 12.6.7.2 Public Utility Assets
- 12.6.7.3 Cooperative Utility Assets
- 12.6.7.4 Independent Transmission Assets
- 12.6.8 Subsegment Pricing and Adoption Trends
- 12.6.9 Leading Suppliers and Competition
- 12.6.10 Regional Demand and Opportunities
- 12.7 By Country - Market Size and Forecast, 2025-2035
- 12.7.1 Segment Definition and Scope
- 12.7.2 Historical Market Size, 2018-2025
- 12.7.3 Revenue Forecast, 2025-2035
- 12.7.4 Volume Forecast, 2025-2035
- 12.7.5 Base-Year Market Share, 2025
- 12.7.6 Segment CAGR and Growth Drivers
- 12.7.7 Subsegment Market Size and Forecast
- 12.7.7.1 United States
- 12.7.7.2 Canada
- 12.7.7.3 Mexico
- 12.7.8 Subsegment Pricing and Adoption Trends
- 12.7.9 Leading Suppliers and Competition
- 12.7.10 Regional Demand and Opportunities
- 12.8 Segment Growth Comparison
- 12.9 Segment Attractiveness and Priority Matrix
Chapter 13 North America Transmission Infrastructure End-Use and Application Market Outlook
- 13.1 End-Use Industry and Customer Demand Structure
- 13.2 Leading Applications and Customer Groups
- 13.3 End-Use Market Size, Share and Forecast
- 13.4 Major End-Use Industry Deep Dives
- 13.4.1 Customer Requirements and Use Cases
- 13.4.2 Demand and Replacement Cycles
- 13.4.3 Technical and Regulatory Considerations
- 13.4.4 Purchasing and Procurement Models
- 13.4.5 Leading Vendors and Distribution Channels
- 13.4.6 Forecast and Commercial Opportunities
- 13.5 Emerging Applications and Cross-Segment Demand
- 13.6 End-Use Industry Investment Priorities
Chapter 14 North America Transmission Infrastructure Geographic Market Outlook, 2025-2035
- 14.1 Regional Market Size and Country-Level Shares, 2025
- 14.2 Country Market Size Comparison, 2025
- 14.3 Country Market Forecasts, 2025-2035
- 14.4 Subregional Industrial and Demand Clusters
- 14.5 Intra-Regional Pricing and Cost Differences
- 14.6 Cross-Border Trade and Supply Networks
- 14.7 Regional Supply and Demand Balances
- 14.8 Country Opportunity Comparison and Prioritization
Note: Every listed country is covered on the structure shown under the first country.
Chapter 15 North America Transmission Infrastructure Technology, Innovation and Sustainability Outlook
- 15.1 Technology Landscape and Maturity
- 15.2 Product, Process and Service Innovation
- 15.3 AI, Automation and Digital Tools in the Industry
- 15.4 Technology Adoption and Performance Benchmarking
- 15.5 Innovation Pipeline and R&D Investment
- 15.6 Patent and Intellectual Property Trends
- 15.7 Energy Efficiency and Resource Management
- 15.8 Sustainability, Recycling and Circularity
- 15.9 Technology Roadmap, 2025-2035
- 15.10 Risks of Obsolescence and Technology Substitution
Chapter 16 North America Transmission Infrastructure Market Key Strategic Imperatives
- 16.1 Growth and Market Entry Priorities
- 16.2 High-Return Products and Segments
- 16.3 Pricing, Profitability and Cost Optimization
- 16.4 Technology Investment and Product Differentiation
- 16.5 Supply Chain Localization and Resilience
- 16.6 Distribution and Customer Acquisition
- 16.7 Partnership, Acquisition and Capacity Strategy
- 16.8 Regional Expansion Priorities
- 16.9 Short-, Medium- and Long-Term Actions
Chapter 17 Competition Outlook
- 17.1 Industry Competition Characteristics
- 17.2 Market Structure and Concentration
- 17.3 Market Share and Competitive Positioning, 2025
- 17.4 Company-Wise Revenue and Product Benchmarking
- 17.5 Production and Service Capacity Benchmarking
- 17.6 Technology, Pricing and Differentiation
- 17.7 Regional Footprint and Distribution Strength
- 17.8 Mergers, Acquisitions and Strategic Alliances
- 17.9 New Entrants and Competitive Threats
- 17.10 Porter's Five Forces and Industry Attractiveness
- 17.11 Competitive Outlook, 2025-2035
Chapter 18 Company Profiles
- 18.1 Company Coverage and Selection Criteria
- 18.2 Quanta Services
- 18.2.1 Business Description
- 18.2.2 Company Ownership and Geographic Presence
- 18.2.3 Product and Service Portfolio
- 18.2.4 Manufacturing and Operating Footprint
- 18.2.5 Production Capacity and Expansion Plans
- 18.2.6 Financial Performance and Investment
- 18.2.7 Market Share and Competitive Position
- 18.2.8 Technology and Innovation Capabilities
- 18.2.9 Strategic Alliances or Partnerships
- 18.2.10 Recent Developments
- 18.2.11 Growth Strategy and Outlook
- 18.3 GE Vernova
- 18.4 Hitachi Energy
- 18.5 Siemens Energy
- 18.6 MYR Group
- 18.7 Primoris Services
- 18.8 Prysmian
- 18.9 Nexans
- 18.10 Hyosung Heavy Industries
- 18.11 Burns & McDonnell
- 18.12 Other Relevant Market Participants
Note: Every listed company is profiled on the structure shown under the first company. The company list is preliminary and may change based on research findings, market developments, data availability and client requirements.
Chapter 19 Disclaimer
- 19.1 Research and Forecast Disclaimer
- 19.2 Data Source and Estimation Limitations
Note: The depth of individual sections depends on data availability for this market. Volume, capacity, trade and other unit-based metrics are included where applicable.