Open test berths and first offtake deals move ocean power on
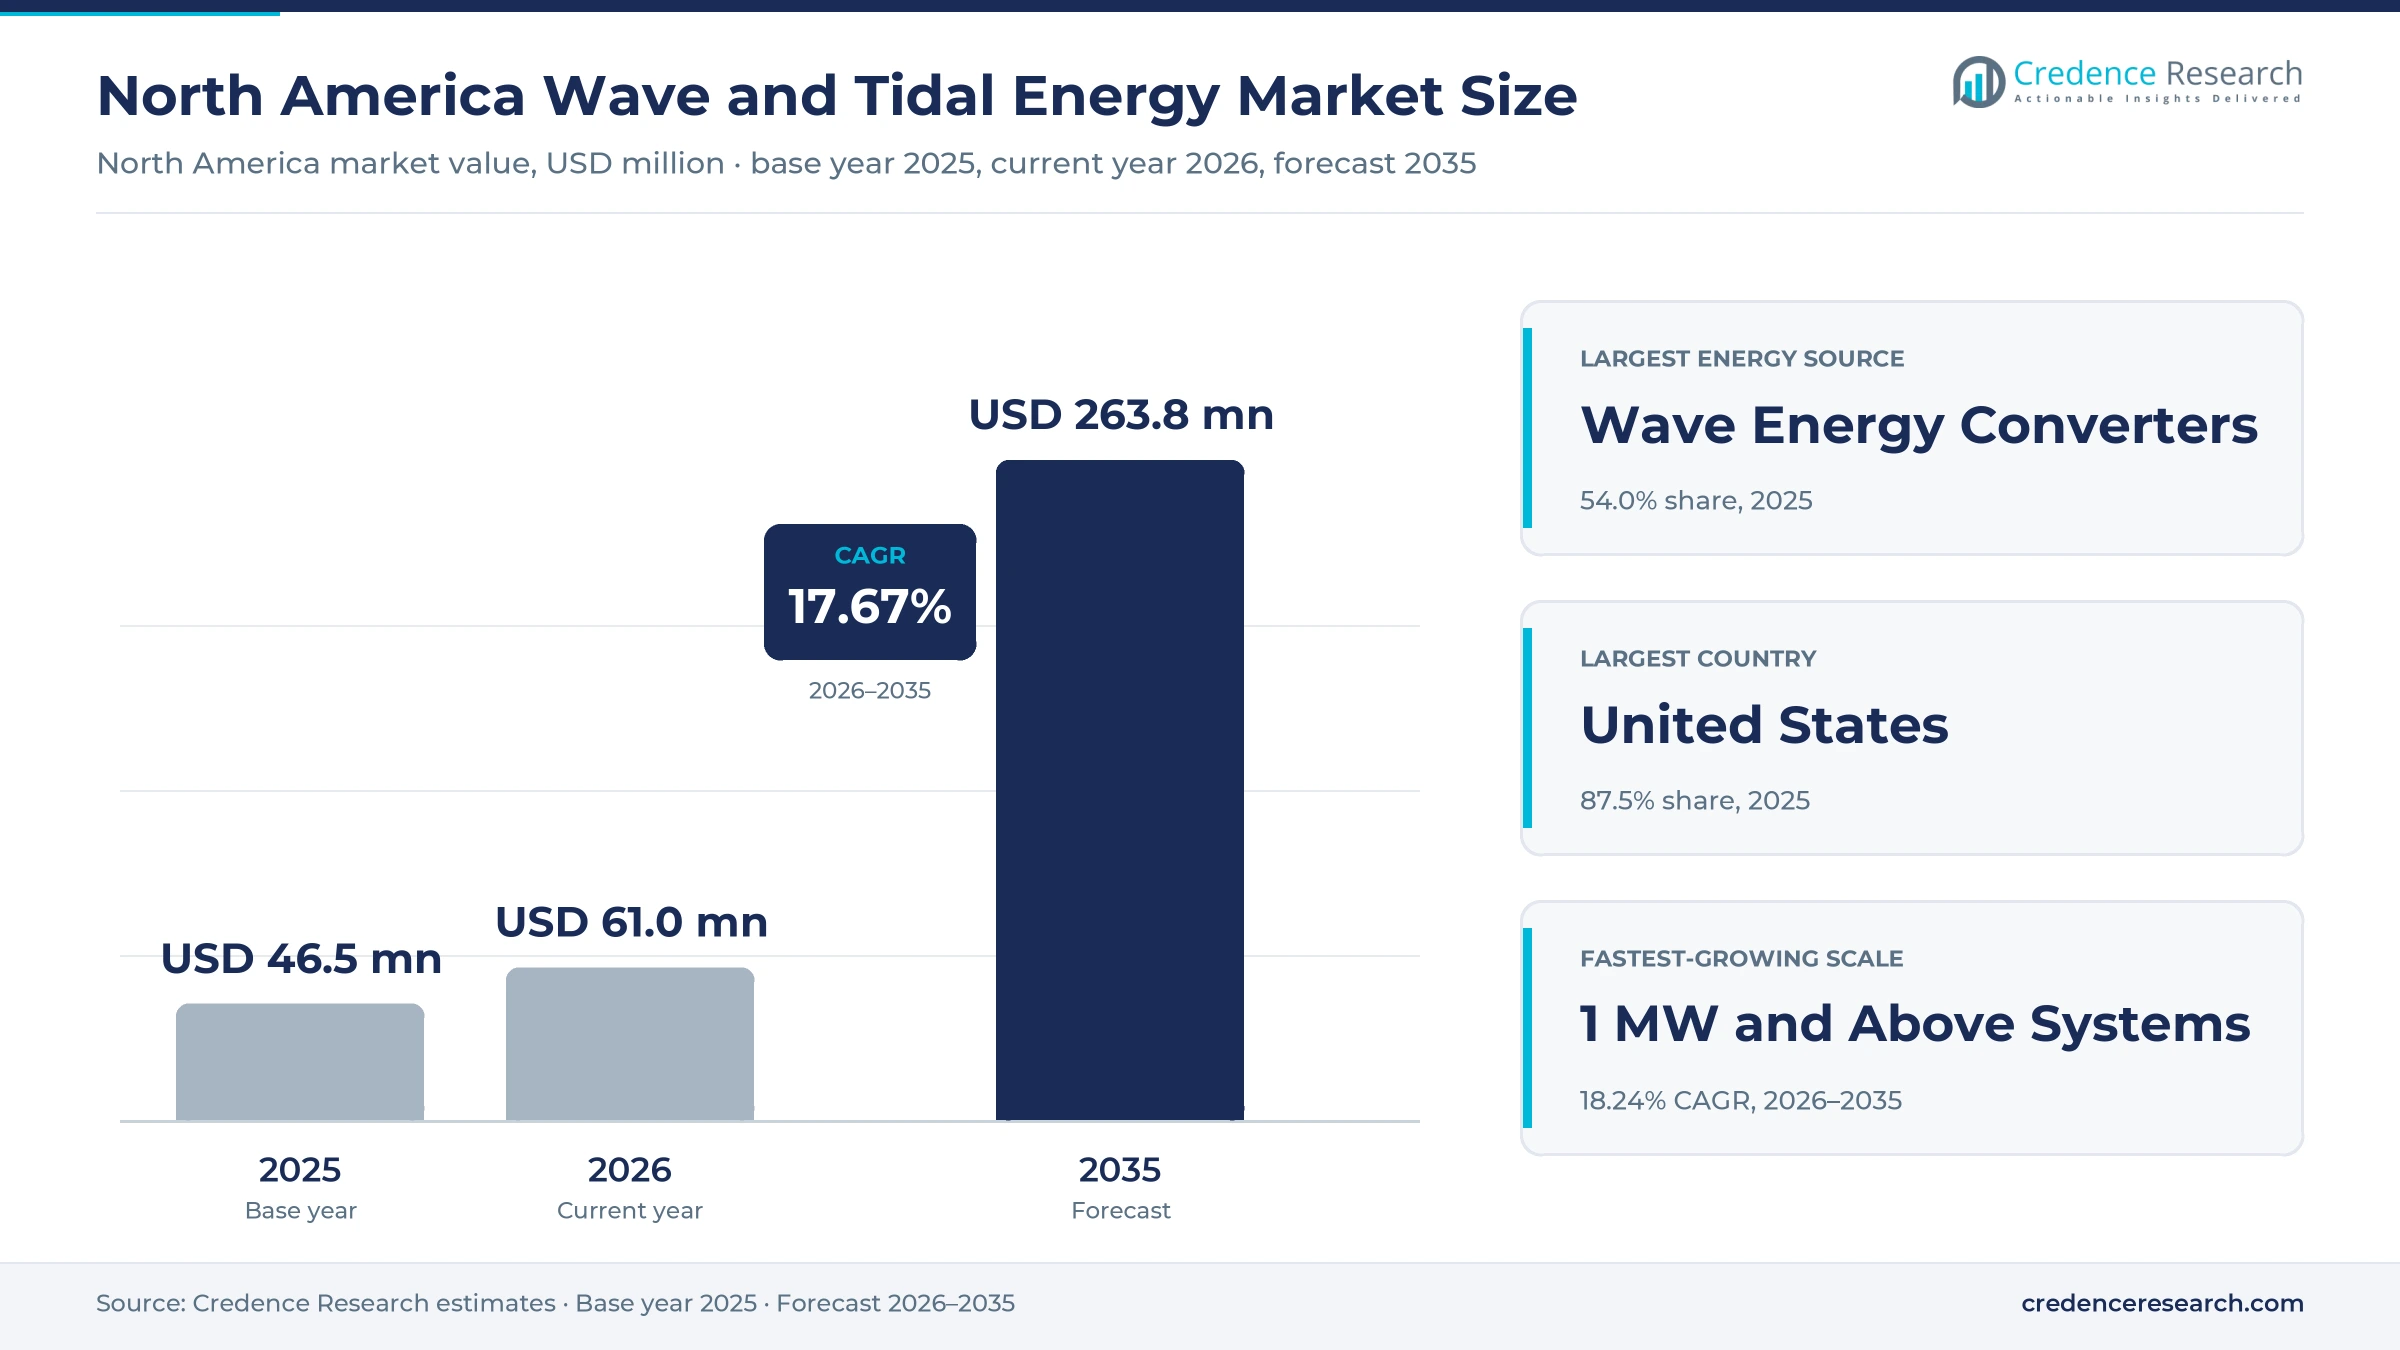
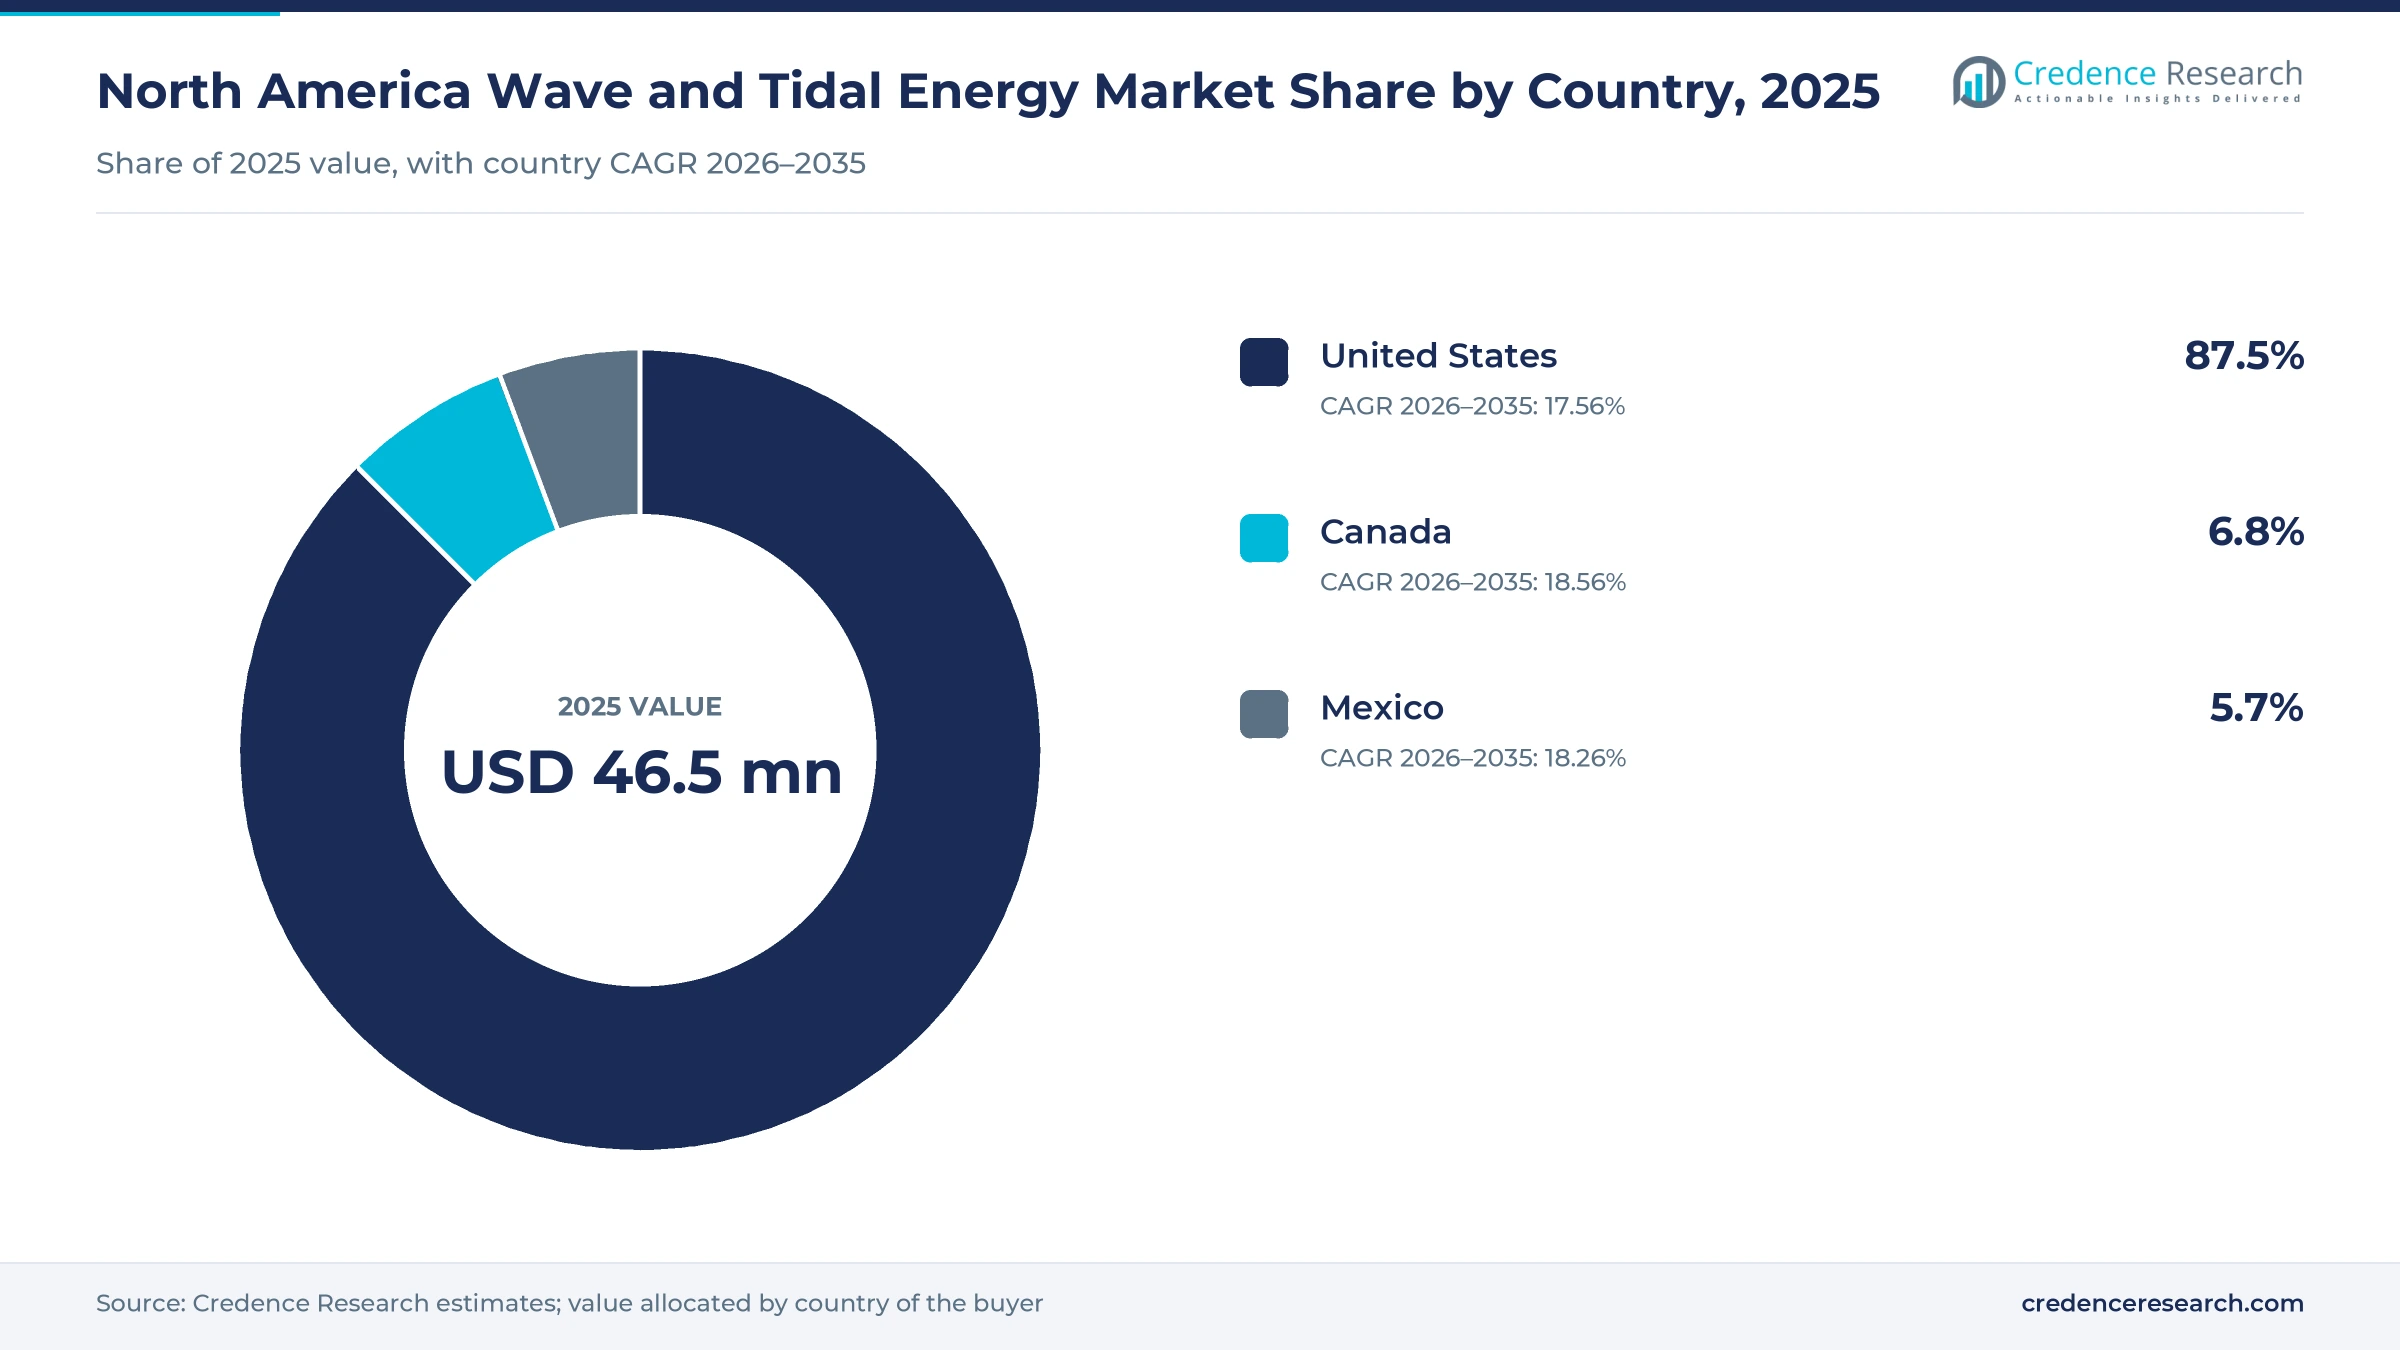
The North America wave and tidal energy market was valued at USD 51.8 million in 2025 and is projected to increase from USD 61.0 million in 2026 to USD 263.8 million by 2035, registering a CAGR of 17.67% during 2026–2035. Demand comes from federal test programs, from utilities that have begun signing offtake contracts for early arrays, and from defense and security buyers that need power for sensors far from shore. The United States held the largest regional share, 87.5% in 2025, because it hosts PacWave South in Oregon and the U.S. Navy Wave Energy Test Site in Hawaii. Canada is the fastest-growing country at 18.56% a year, as Nova Scotia awarded new tidal berths at FORCE in November 2025. Commercially, the Bonneville Power Administration agreed to buy power from PacWave South over 2026 to 2030, giving test devices a paid route to the grid. On the regulatory side, Fisheries and Oceans Canada authorized the first tidal array in the country in November 2025 under an adaptive framework.
What does wave and tidal power spending cover in North America?
This report counts spending on wave energy converters, tidal stream turbines and hybrid devices in the United States, Canada and Mexico, including device manufacture, installation, test berth fees, project engineering and operating support. Buyers include federal research agencies, utilities that sign offtake contracts and navy, coast guard and offshore operators that need power at sea.
The scope excludes tidal barrages and conventional river dams, offshore wind and ocean thermal or salinity gradient systems. The value chain runs from research and project engineering through device manufacture and installation to testing, monitoring and operational support, and values are stated at project and contract level.
North America Wave and Tidal Energy Market Insights
- The market grows from USD 51.8 million in 2025 to USD 263.8 million by 2035, a 17.67% CAGR, as shared test berths open and the first tidal arrays sign offtake contracts.
- The United States led with 87.5% of 2025 value, while Canada grows fastest at 18.56% a year after Nova Scotia awarded 16.5 MW of tidal berths at FORCE.
- Wave Energy Converters held 54.0% of 2025 value because federal wave programs, including a USD 112.5 million testing call from September 2024, fund most device work.
- PacWave South off Newport, Oregon, opened on Aug. 27, 2026, as the first pre-permitted, grid-connected wave test site in the continental United States.
- Ocean Power Technologies won a USD 1.5 million U.S. Coast Guard order in February 2026, showing how security missions now buy ocean-powered buoys.
Wave devices and mid-size systems hold most current value
Why do wave converters hold the larger share of value?
Based on energy source, the market is categorized into wave energy converters, tidal stream turbines and hybrid wave and tidal systems. Wave Energy Converters led with 54.0% of 2025 value because federal spending in the United States favors wave devices, and the Department of Energy announced up to USD 112.5 million for wave energy open water testing in September 2024, its largest marine energy funding call, according to OE Digital. Tidal Stream Turbines grow fastest at 18.16% a year as Nova Scotia moves from single units to arrays, with Eauclaire Tidal awarded berths totaling 16.5 MW at FORCE in November 2025. Hybrid systems remain small because most of them are still research platforms.
Which power uses carry the most project spending?
Based on application, the market is categorized into grid-connected electricity, coastal microgrid electricity and autonomous offshore power. Grid-Connected Electricity led with 47.0% of 2025 value because the largest contracts tie devices to utility grids, and the Bonneville Power Administration signed a five-year agreement in November 2025 to buy up to 20 MW from PacWave South over 2026 to 2030. Autonomous Offshore Power grows fastest at 18.12% a year as security buyers fund ocean-powered sensors, and Ocean Power Technologies received a USD 1.5 million U.S. Coast Guard order in February 2026, according to ROI-NJ. Coastal microgrid projects serve remote villages that still burn diesel for most of their power.
Who pays for most of the devices now in the water?
Based on end user, the market is categorized into public research buyers, electricity project buyers and offshore mission buyers. Public Research Buyers led with 49.0% of 2025 value because public agencies pay for most test work, and the Department of Energy has invested nearly USD 150 million since 2016 in siting and building PacWave South, according to OPB. Offshore Mission Buyers grow fastest at 18.35% a year as naval and homeland security users test power at sea, and the U.S. Naval Postgraduate School completed a PowerBuoy deployment, Ocean Power Technologies reported in July 2025. Electricity project buyers, led by Nova Scotia Power, sign offtake contracts for early arrays.
Which system sizes are moving from trials toward arrays?
Based on project scale, the market is categorized into sub-100 kW systems, 100 kW to below 1 MW systems, and 1 MW and above systems. 100 kW to Below 1 MW Systems led with 41.0% of 2025 value because most devices in sea trials sit in that band, and Oscilla Power validated its 100 kW Triton-C system at the Navy test site in Hawaii in October 2025, according to Modern Power Systems. 1 MW and Above Systems grow fastest at 18.24% a year as Fisheries and Oceans Canada authorized up to three 2.5 MW Orbital O2-X turbines for Eauclaire Tidal in November 2025. Sub-100 kW units mostly power data buoys and ocean sensors.
| Segment Group | Leading Sub-segment | Share, 2025 | Fastest-growing Sub-segment | CAGR, 2026–2035 |
|---|---|---|---|---|
| By Energy Source | Wave Energy Converters | 54.0% | Tidal Stream Turbines | 18.16% |
| By Application | Grid-Connected Electricity | 47.0% | Autonomous Offshore Power | 18.12% |
| By End User | Public Research Buyers | 49.0% | Offshore Mission Buyers | 18.35% |
| By Project Scale | 100 kW to Below 1 MW Systems | 41.0% | 1 MW and Above Systems | 18.24% |
Request a Free Sample
Fill in your details and we'll send you a free sample report.
- Sample data tables & charts
- Research methodology
Test sites, tidal contracts and sea missions lift spending
Shared testing infrastructure lowers developer entry costs
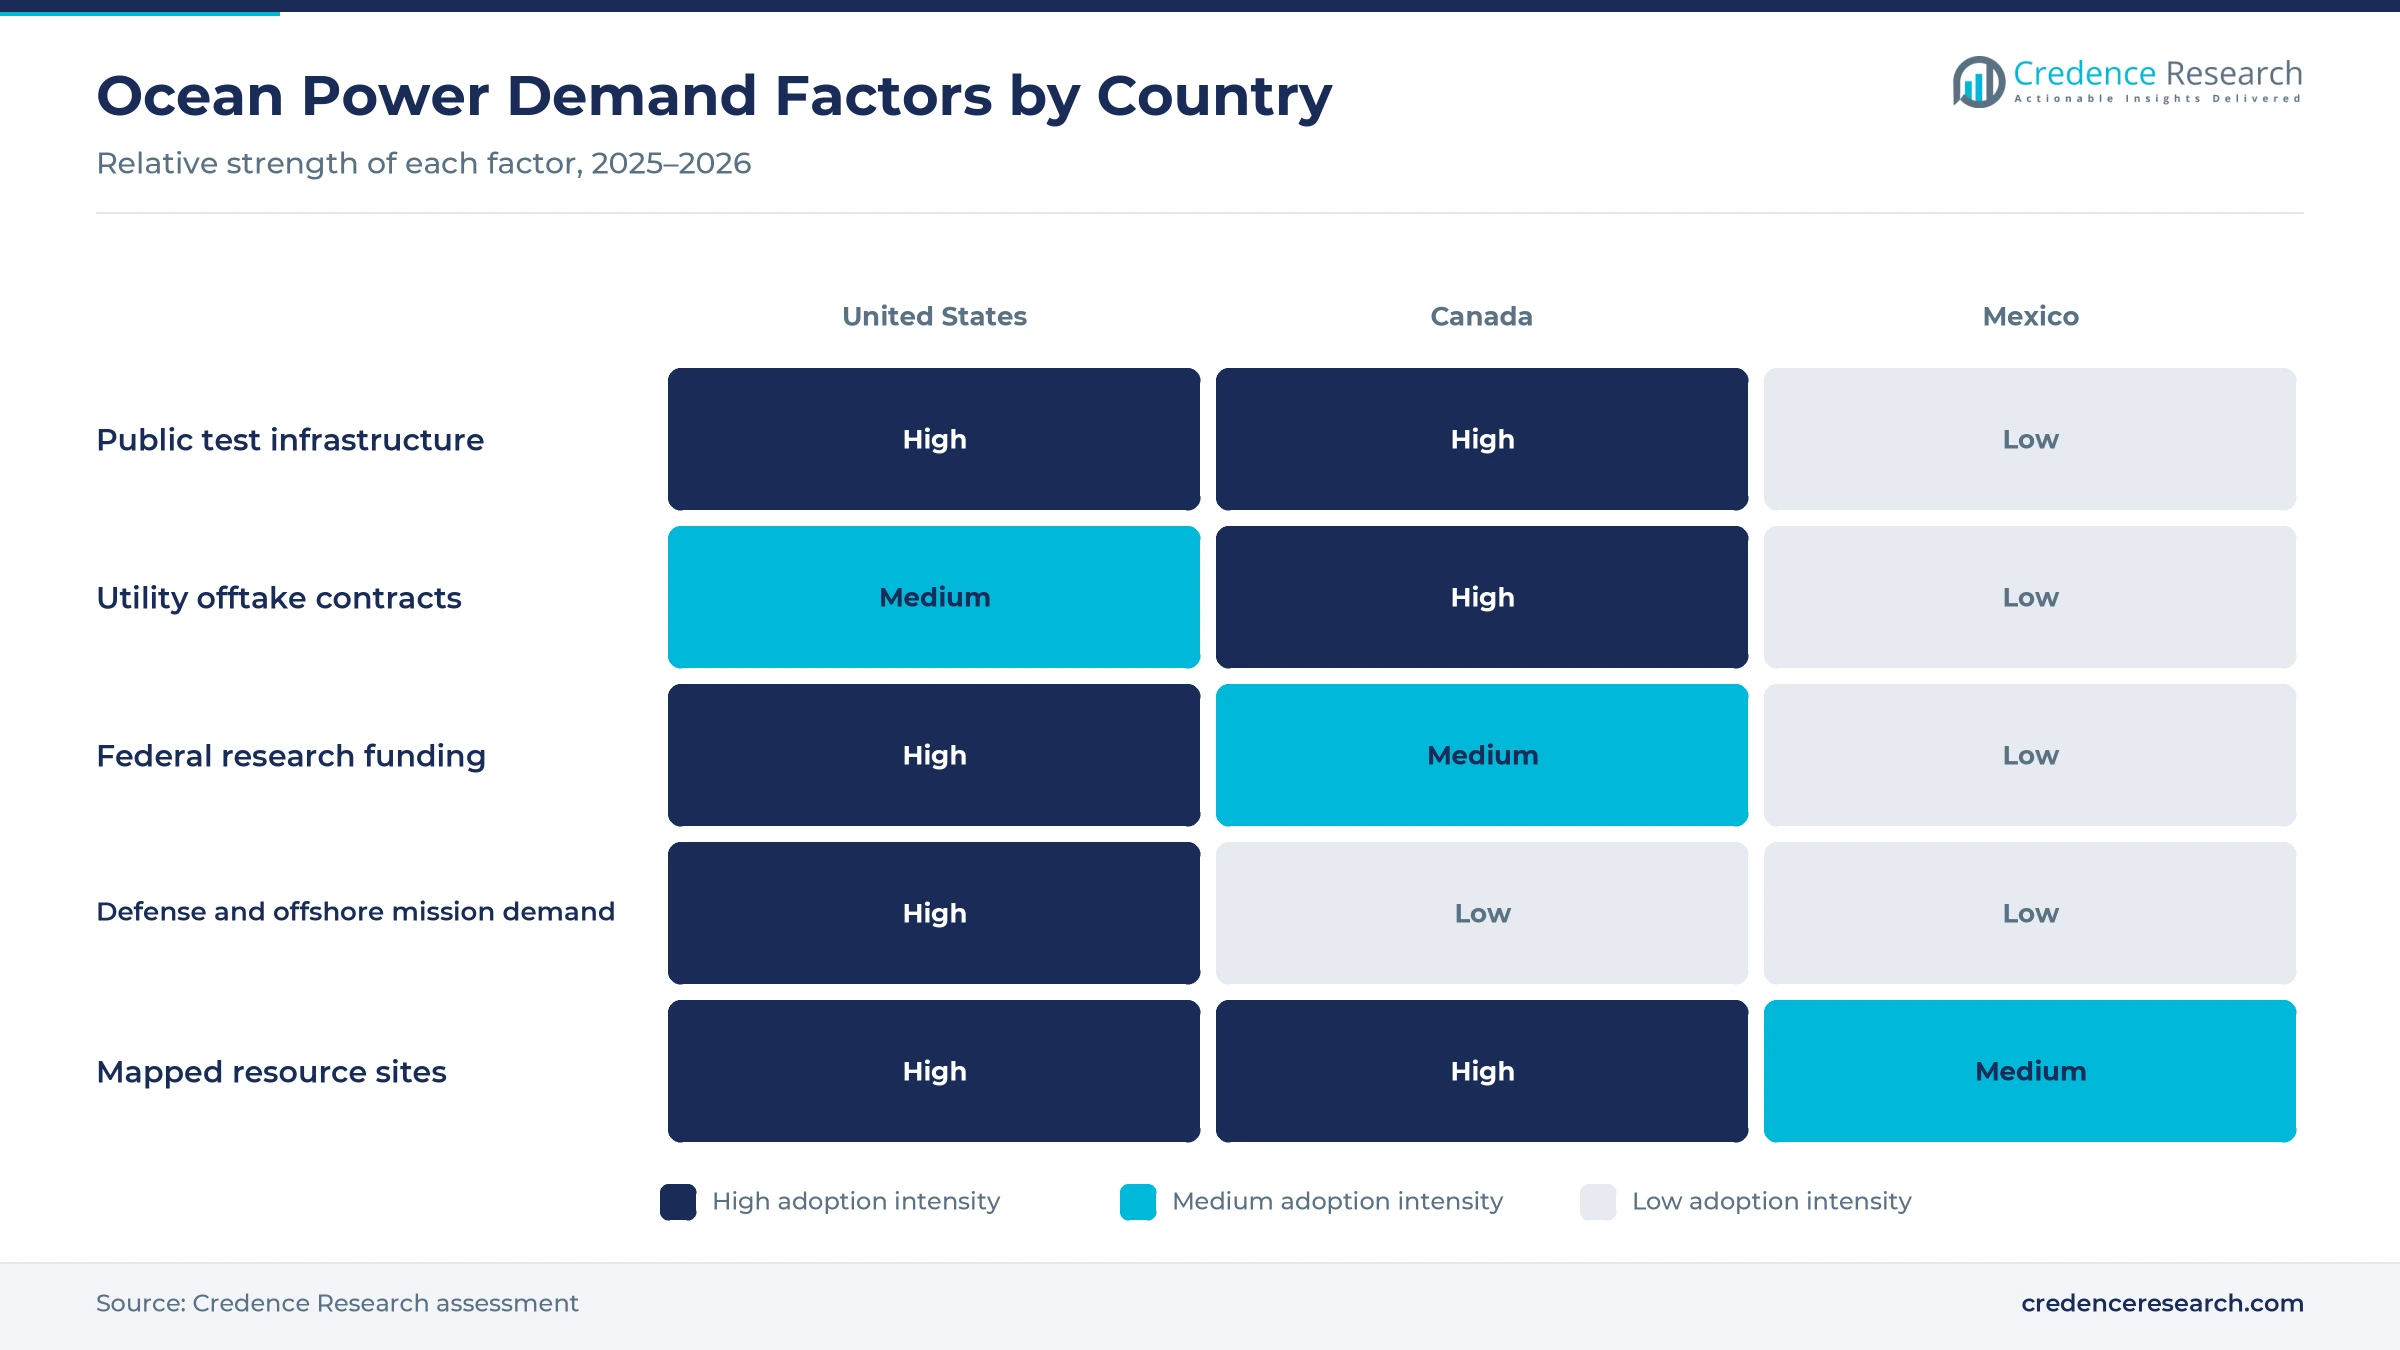
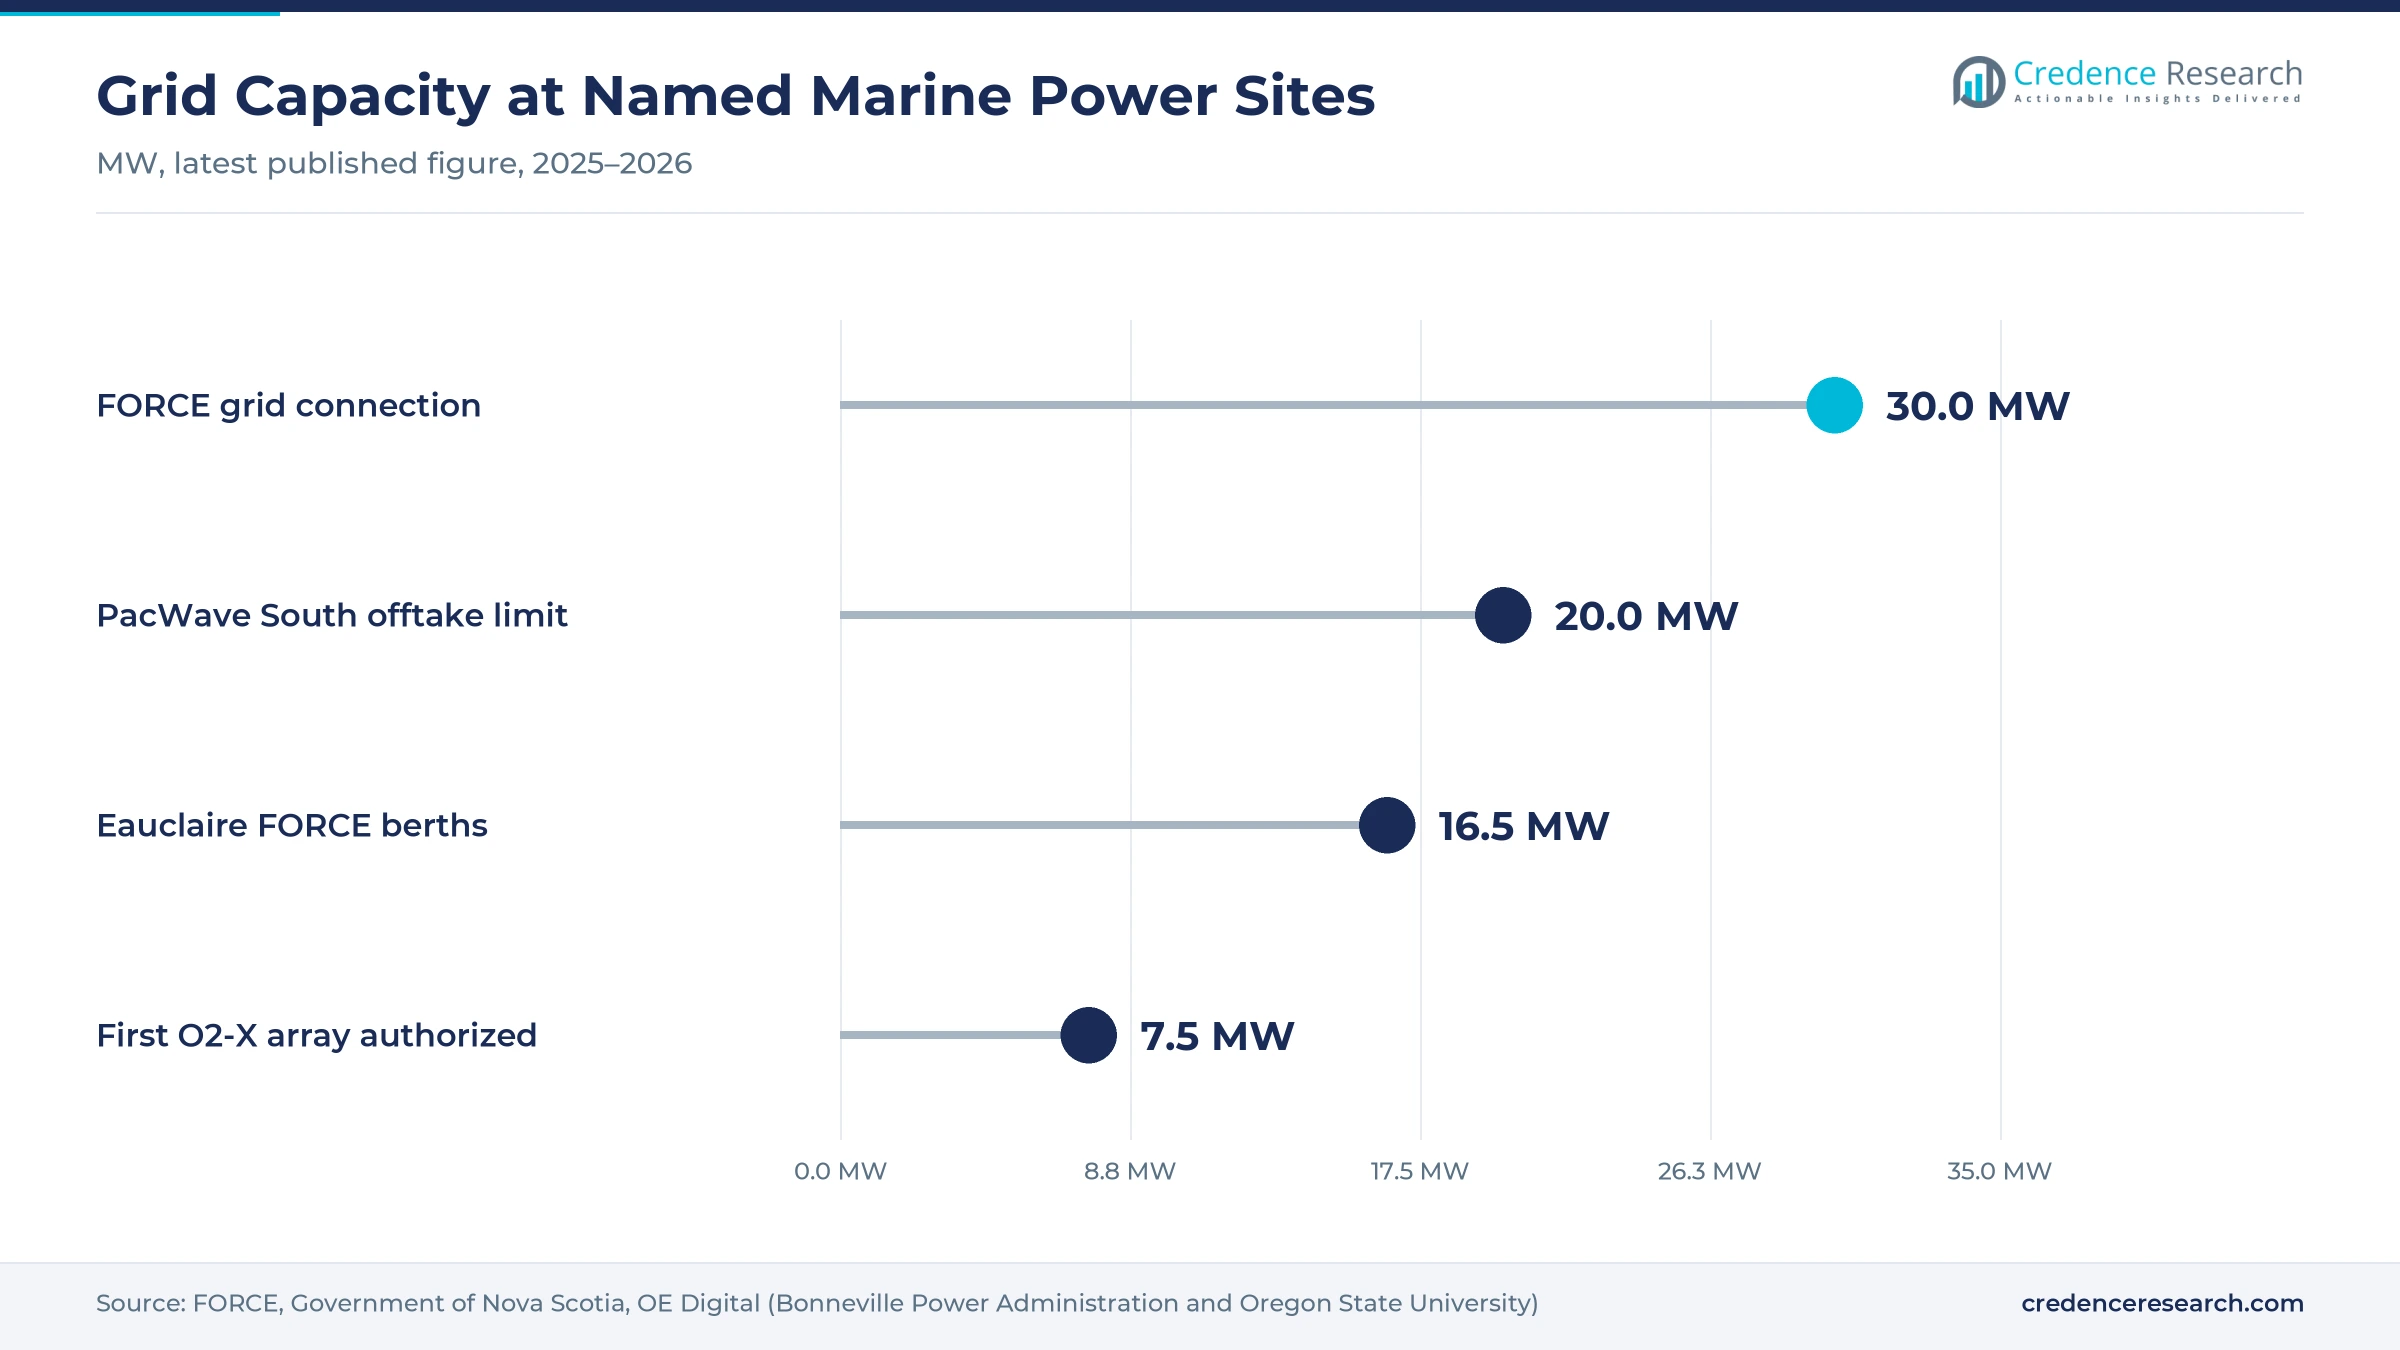
Shared, pre-permitted test sites let developers put full-scale devices in the sea without paying for their own permits, cables and grid links. PacWave South off Newport, Oregon, opened on Aug. 27, 2026, after nearly 15 years of planning, permitting and construction, according to Energy Global. The Department of Energy has invested nearly USD 150 million since 2016 in siting and building the facility, OPB reported and the site has four test berths with their own subsea export cables. In Hawaii, the U.S. Navy Wave Energy Test Site hosted the 100 kW Triton-C trial in 2025, while FORCE in Nova Scotia offers 30 MW of grid capacity. As a result, Public Research Buyers held 49.0% of 2025 value.
Tidal project contracting turns test berths into arrays
Tidal developers in the region now hold paid contracts rather than test permits alone, and that change pulls spending toward larger machines. Under the Nova Scotia Tidal Procurement 2025, Eauclaire Tidal Limited Partnership added two berths at FORCE of 7.5 MW and 5 MW to its original 4 MW berth, with power purchase agreements signed with Nova Scotia Power, the provincial government said on Nov. 10, 2025. Fisheries and Oceans Canada then authorized up to three Orbital O2-X turbines of about 2.5 MW each on Nov. 14, 2025, the first tidal array approval in Canada. FORCE puts the extractable potential of the Minas Passage at 2,500 MW. Consequently, 1 MW and Above Systems grow at 18.24% a year.
Autonomous offshore power demand from security missions
Navies, coast guards and offshore operators need steady power for sensors and vehicles far from shore, and wave devices can supply it without fuel runs. Ocean Power Technologies received a USD 1.5 million U.S. Coast Guard order on Feb. 24, 2026, to deploy buoy systems for homeland security surveillance, according to ROI-NJ. The company also reported in July 2025 that it holds a Department of Defense facility clearance at the Secret level. C-Power prepared a six-month SeaRAY pilot at the Navy site in Hawaii in which a subsea battery recharges a Saab Sabertooth underwater vehicle, Renewable Energy World reported in June 2023. The Department of Energy also names remote sensors and military bases as uses, so Autonomous Offshore Power grows at 18.12% a year.
Large mapped resource and steady federal research funding
A large and well-mapped ocean resource keeps public research money flowing, even though commercial fleets have not yet formed. The U.S. Energy Information Administration estimates the theoretical wave potential off U.S. coasts at up to 2.64 trillion kWh a year, about 63% of 2023 utility-scale generation. Ocean Renewable Power Company puts the U.S. tidal and river resource at 319 TWh a year, enough for about 30 million homes. The Department of Energy opened its five-year wave testing call of up to USD 112.5 million in September 2024, with concept papers due Oct. 25, 2024, according to OE Digital. Because these programs pay for engineering, devices and sea time, public research buyers remain the largest paying group in the United States.
Monitoring, port pilots and remote grids open new demand
Rise of shared environmental monitoring in Canadian permits
Environmental monitoring is moving from a cost each developer carries alone to a shared platform that regulators accept. Natural Resources Canada committed CAD 10.7 million through its Energy Innovation Program on Sept. 19, 2025, for the FORCE Ocean Sensors Innovation Platform and an Acadia University study of fish collision risk in the Minas Passage. Fisheries and Oceans Canada added in-kind support worth more than CAD 1.4 million for the Acadia work. The federal Task Force on Sustainable Tidal Energy Development, started in June 2023, shaped the adaptive approach used for the Eauclaire authorization in November 2025. As a result, Canadian tidal energy projects can now seek permits on shared evidence rather than on separate studies for each site.
Shift toward shoreline and port-based wave pilots
Developers are placing wave devices on existing breakwaters and piers, which cuts mooring and subsea cable costs during early trials. Eco Wave Power completed installation of its floaters, hydraulic pipes and onshore conversion unit at the Port of Los Angeles on Aug. 11, 2025, and unveiled the pilot at AltaSea on Sept. 9, 2025, according to ECO Magazine. The station is not grid-connected and supports permitting work with the U.S. Army Corps of Engineers. An April 2026 UNAM study also notes that Mexico has more than 10,000 km of coastline, where first-generation converters on firm coast are easier to install and maintain. These pilots matter because the Energy Information Administration states that the United States has no commercially operating wave energy projects yet.
Opening in diesel-dependent Alaskan village microgrids
Remote Alaskan communities that burn diesel give developers a buyer that values steady local power above the lowest cost per unit. Ocean Renewable Power Company reports that 220,000 Alaskans are affected by dependence on diesel-fired microgrids, and its RivGen project with the Igiugig community is the longest-operating marine energy device in the Americas. In New York, Verdant Power deployed three turbines in the East River on Oct. 22, 2020, and they generated more than 275 MWh in eight months for the Con Edison grid, according to Offshore Energy in June 2021. Consequently, coastal microgrid electricity gives wave and tidal energy developers early customers that pay for steady output.
Mexican coastline and Latin American buyers offer room
Mexico offers developers a long coastline with mapped wave sites and a growing network of buyers for ocean-powered equipment. The same UNAM study identified 56 suitable wave sites in Baja California, 21 in Oaxaca and 15 each in Guerrero and Jalisco. That work began through Cemie-Océano, sponsored by Conacyt and coordinated with the Secretaría de Energía. Ocean Power Technologies reported in July 2025 a USD 3 million reseller agreement with a leading Mexican engineering firm to expand across Central America. As a result, Mexico holds 5.7% of 2025 value and grows at 18.26% a year, ahead of the United States.
Funding gaps and permit risk slow device deployment
Federal funding delays leave new test berths idle
Federal funding delays now slow deployment even where test sites are ready. OPB reported on Aug. 26, 2026, that no wave devices had arrived at PacWave South because developers face delays in federal funding. The Department of Energy also canceled USD 7.6 billion of grants on Oct. 2, 2025, including an award of just under USD 4 million for an AI-controlled wave system by Littoral Power Systems, according to Connecticut Public. The administration has opposed offshore wind farms since late 2025, which adds policy doubt for ocean projects.
Permit risk in Canadian tidal waters raised investor caution
Permit risk has already cost Canada one tidal developer, so investors still price that risk into new projects. Sustainable Marine Energy entered voluntary bankruptcy in May 2023 after it could not obtain Fisheries Act authorization for its FORCE project, and about 20 Nova Scotia employees lost their jobs, according to Water Power Magazine. The firm had received CAD 28.5 million from Natural Resources Canada in November 2020 for a planned 9 MW tidal energy array. The adaptive framework used in November 2025 eases, but does not remove, that risk.
No commercial wave fleet means thin cost and output data
Lenders lack operating data on wave devices because none of them run commercially in the region yet. The Energy Information Administration states that the United States has no commercially operating wave energy projects, and the Port of Los Angeles pilot limits its U.S. output figures to demonstration measurements, according to ECO Magazine. Oscilla Power reported in October 2025 that Hawaii waves carry about half the rated energy intensity of its 100 kW Triton-C design, which limits what that trial proves for West Coast sites. Developers therefore rely on public grants for longer than they planned.
Retrieval and repair work at sea raises lifetime costs
Tidal turbines must be lifted from the seabed for service, and that work needs vessels, divers and calm windows. Verdant Power targets retrieve-and-replace intervals of five to seven years, meaning two planned recoveries over a 20-year life, and it swapped one East River turbine at mid-point in 2021, according to Offshore Energy. Smaller developers without their own vessels pay the most for this work. Longer service intervals and modular designs are the main responses, though each design still needs years of proof.
United States leads while Canada grows fastest
| Country | Value, 2025 (USD million) | Share, 2025 | CAGR, 2026–2035 |
|---|---|---|---|
| United States | 45.4 | 87.5% | 17.56% |
| Canada | 3.5 | 6.8% | 18.56% |
| Mexico | 3.0 | 5.7% | 18.26% |
United States leads on test sites and federal programs
The United States held 87.5% of 2025 regional value and grows at 17.56% a year on federal test spending and security contracts. The country hosts PacWave South, the first grid-connected wave test site in the continental United States, and the Navy test site in Hawaii, where Oscilla Power and C-Power have tested devices. Developers are spread along both coasts, with Ocean Power Technologies in Monroe Township, New Jersey, Ocean Renewable Power Company in Portland, Maine and CalWave preparing its xWave device for Oregon. The Bonneville Power Administration offtake from PacWave South adds a federal buyer for test power.
Canada grows fastest on Bay of Fundy tidal arrays
Canada held 6.8% of 2025 value and grows at 18.56% a year, the fastest pace in the region. The Bay of Fundy has a tidal range of up to 16 meters and moves about 160 billion tons of water on each tide, according to FORCE. Eauclaire Tidal holds berths totaling 16.5 MW at FORCE with Nova Scotia Power contracts, and its first array of up to three O2-X turbines won federal authorization in November 2025. Federal monitoring funds worth CAD 10.7 million support the permitting work that follows.
Mexico builds from mapped sites and research centers
Mexico held 5.7% of 2025 value and grows at 18.26% a year, from a base made up mostly of research projects. Cemie-Océano has mapped the national coast, and a UNAM study in April 2026 named Baja California and Oaxaca as the states with the best conditions for wave energy. Demand for ocean-powered equipment also comes through engineering firms, and Ocean Power Technologies signed a USD 3 million reseller agreement with a Mexican partner in 2025. No utility offtake contract for marine power in Mexico appeared in the public sources reviewed for this edition.
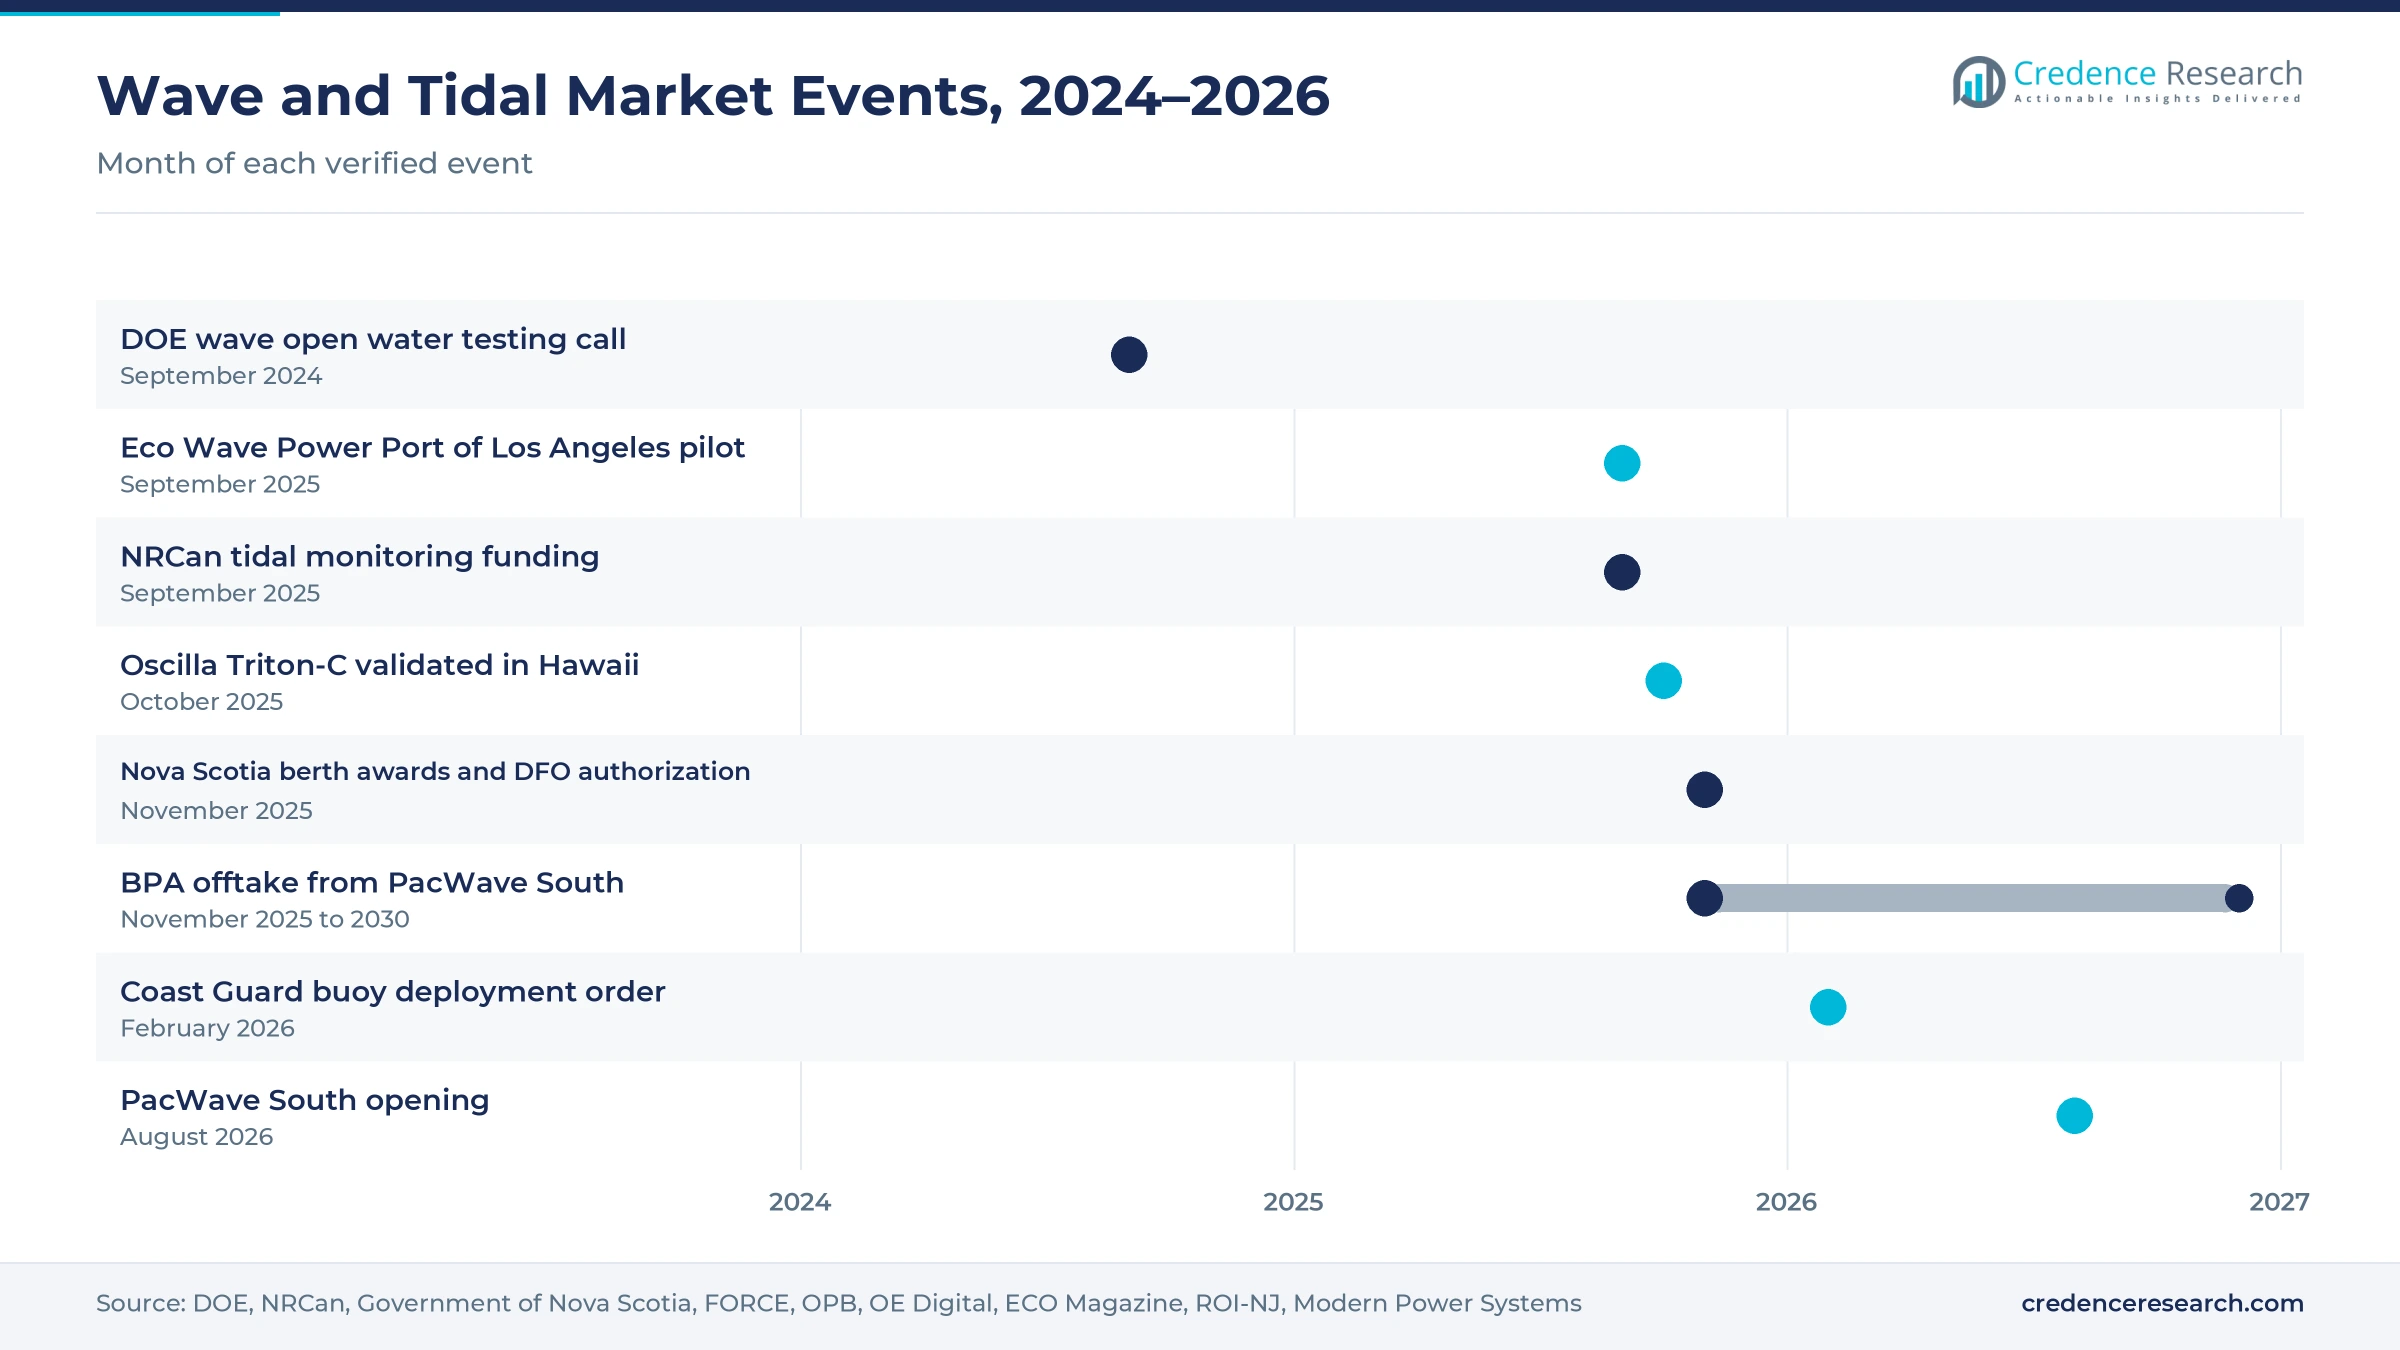
Funding calls, awards and site openings from 2024 to 2026
| Development | Status and market relevance |
|---|---|
| In September 2024, the Department of Energy opened a five-year wave energy open water testing call worth up to USD 112.5 million. | Open call; funds devices for PacWave South and other sites. |
| In November 2025, Nova Scotia awarded Eauclaire Tidal two more FORCE berths, bringing its total to 16.5 MW with Nova Scotia Power contracts. | Awarded; Fisheries and Oceans Canada authorized the first array on Nov. 14, 2025. |
| In November 2025, the Bonneville Power Administration signed a five-year offtake agreement with Oregon State University for PacWave South power. | Signed; covers up to 20 MW over 2026 to 2030. |
| In February 2026, Ocean Power Technologies received a USD 1.5 million U.S. Coast Guard order to install and deploy buoy systems. | Under way; supports homeland security surveillance missions. |
| In August 2026, Oregon State University and the Department of Energy opened PacWave South off Newport, Oregon. | Open; first developer tests are being arranged. |
Converter, turbine and subsea power designs in use
- Point absorbers such as the Oscilla Power Triton-C combine a surface float with a heave plate and are rated near 100 kW for high-energy coasts.
- Floating tidal turbines such as the Orbital O2-X carry about 2.5 MW each and are the units authorized for the first Eauclaire array at FORCE.
- Wave-powered subsea charging pairs the C-Power SeaRAY with a Halo subsea battery so that underwater vehicles can recharge without a support ship.
- Shoreline floaters attach to existing breakwaters and send hydraulic pressure to an onshore conversion unit, as at the Port of Los Angeles pilot.
- River hydrokinetic turbines such as the ORPC RivGen sit in river currents and supply village grids without the dams that conventional hydropower plants need.
Need a Custom Version of This Report?
Tailor the scope, geography, or segments to your exact requirements.
- Custom geography or segment scope
- Direct access to our analyst team
Developers compete on sea hours, berths and buyers
Competition turns on hours at sea, access to test berths and the ability to sign a paying buyer. Ocean Power Technologies competes on defense and security work, with PowerBuoy and WAM-V sales and a Coast Guard order in February 2026. Demand for test time is concentrated, since PacWave South offers only four berths and FORCE provides 30 MW of grid capacity for tidal developers. C-Power and Oscilla Power build their case on sea trials at the Navy site in Hawaii, while CalWave is preparing its xWave device for PacWave South. Ocean Renewable Power Company and Verdant Power hold the longest operating records for river and tidal turbines in the United States. In Canada, Eauclaire Tidal leads with 16.5 MW of contracted FORCE berths, using turbines from Orbital Marine Power, a Scottish firm that also competes in global ocean power generation projects. Smaller developers rely on federal awards, so funding cycles shape their pace.
Companies profiled and their roles in this market
| Company | Type | Role in the market |
|---|---|---|
| Ocean Power Technologies | Device maker and integrator | USD 1.5 million U.S. Coast Guard order in February 2026 to install and deploy buoy systems |
| Ocean Renewable Power Company | Tidal and river developer | RivGen project at Igiugig, Alaska and a tidal test site in Eastport, Maine |
| CalWave Power Technologies | Wave developer | xWave device to be deployed at PacWave South under the BPA offtake framework |
| Eauclaire Tidal Limited Partnership | Tidal project developer | Holds 16.5 MW of FORCE berths with Nova Scotia Power contracts since November 2025 |
| C-Power | Autonomous offshore power developer | Six-month SeaRAY pilot with subsea battery at the Navy site in Hawaii, announced in June 2023 |
| Verdant Power | Tidal developer | Three-turbine East River array in New York supplied the Con Edison grid |
| Oscilla Power | Wave developer | 100 kW Triton-C validated at the Navy Wave Energy Test Site in October 2025 |
Paid offtake will decide how fast arrays follow tests
Credence Research's view is that paid offtake will decide how fast arrays follow tests through 2035. The Bonneville Power Administration agreement at PacWave South and the Nova Scotia Power contracts for Eauclaire Tidal show that buyers will pay for early ocean power. Demand from the two Nova Scotia contracts and the 20 MW Oregon offtake gives North America wave and tidal energy developers their first paid sales. The weak point is the funding gap between grants and first sales, since no devices had reached the Oregon berths by late August 2026. Developers that also hold defense contracts should keep cash flowing while arrays are built.
How Credence Research built this regional estimate
The report uses 2025 as the base year and forecasts to 2035. Market values come from the Credence Research model, and country and segment splits are Credence Research estimates shaped by test infrastructure, federal funding, contracted capacity and device trials. Sources used include the Department of Energy, the Energy Information Administration, Natural Resources Canada, Fisheries and Oceans Canada, the Government of Nova Scotia, FORCE, UNAM, company filings with the SEC, company releases and trade press. No interviews or surveys were conducted for this edition, so project status reflects published information at the time of research.
Arrays in Fundy and berths in Oregon shape 2035 value
The North America wave and tidal energy market should reach USD 263.8 million by 2035, with most added value coming from Bay of Fundy arrays and the four PacWave South berths. Canada should post the fastest regional growth as Eauclaire Tidal builds out its 7.5 MW and 5 MW berths through the forecast period, while the United States keeps most of the value through federal programs and security contracts. Mexico adds a smaller stream led by research and equipment sales. The main risks are federal funding cuts, permit delays and the slow buildup of operating data that lenders need.
Frequently Asked Questions
How big is the North America wave and tidal energy market?
Which country leads the market?
Which country grows fastest?
Which energy source holds the largest share?
What is PacWave South?
Which application grows fastest?
What are the main challenges for developers?
Which companies operate in this market?
Table of Content
Chapter 1 Market Segmentation
- 1.1 Segmentation Framework
- 1.1.1 Product and Service Classification
- 1.1.2 Application and End-Use Classification
- 1.1.3 Technology and Solution Classification
- 1.1.4 Customer and Distribution Channel Classification
- 1.1.5 Geographic Segmentation
- 1.1.6 Market Segment Definitions and Boundaries
- 1.2 By Energy Source
- 1.2.1 Wave Energy Converters
- 1.2.2 Tidal Stream Turbines
- 1.2.3 Hybrid Wave and Tidal Systems
- 1.3 By Application
- 1.3.1 Grid-Connected Electricity
- 1.3.2 Coastal Microgrid Electricity
- 1.3.3 Autonomous Offshore Power
- 1.4 By End User
- 1.4.1 Public Research Buyers
- 1.4.2 Electricity Project Buyers
- 1.4.3 Offshore Mission Buyers
- 1.5 By Project Scale
- 1.5.1 Sub-100 kW Systems
- 1.5.2 100 kW to Below 1 MW Systems
- 1.5.3 1 MW and Above Systems
- 1.6 By Country
- 1.6.1 United States
- 1.6.2 Canada
- 1.6.3 Mexico
Chapter 2 Introduction
- 2.1 Report Objectives and Scope
- 2.2 Product Definition and Industry Terminology
- 2.3 Market Inclusions and Exclusions
- 2.4 Research Process
- 2.4.1 Primary Research and Expert Interviews
- 2.4.2 Secondary Research and Source Review
- 2.4.3 Top-Down and Bottom-Up Estimation
- 2.4.4 Data Triangulation and Verification
- 2.5 Market Size Measurement Basis
- 2.5.1 2025: USD 51.8 million → 2035: USD 263.8 million
- 2.6 Historical and Forecast Reference Periods
- 2.6.1 Historical Period: 2018-2025
- 2.6.2 Base Year: 2025
- 2.6.3 Forecast Period: 2025-2035
- 2.7 Research Assumptions and Limitations
Chapter 3 Executive Summary
- 3.1 Market Snapshot and Key Findings
- 3.2 Base-Year Market Size, 2025
- 3.3 Forecast Market Size, 2035
- 3.4 Revenue and Volume Growth Outlook
- 3.5 Key Demand and Supply Indicators
- 3.6 Leading Market Segments
- 3.7 Fastest-Growing Market Opportunities
- 3.8 Regional Performance Highlights
- 3.9 Technology and Industry Transformation
- 3.10 Competitive Landscape Summary
- 3.11 Analyst View and Strategic Implications
Chapter 4 North America Wave and Tidal Energy Market Trends and Developments
- 4.1 Historical Industry Development, 2018-2025
- 4.2 Recent Market Trends and Developments
- 4.3 Demand and Customer Behavior Trends
- 4.4 Technology and Product Innovation
- 4.5 Artificial Intelligence, Automation and Digitalization
- 4.6 Local Manufacturing and Supply Chain Realignment
- 4.7 Industry Partnerships, Mergers and Acquisitions
- 4.8 Sustainability and Circular Economy Developments
- 4.9 Government and Private Sector Investment Trends
- 4.10 Emerging Business Models and Commercialization
- 4.11 Industry Developments and Announcements
Chapter 5 North America Wave and Tidal Energy Market Production, Supply and Demand Analysis
- 5.1 Demand Trend and Consumption Analysis, 2018-2025
- 5.2 Demand Forecast, 2025-2035
- 5.3 Production and Output Trend, 2018-2025
- 5.4 Production and Output Forecast, 2025-2035
- 5.5 Installed Capacity and Capacity Utilization
- 5.6 Company-Wise Production Plants and Statistics
- 5.6.1 Installed Production Capacity
- 5.6.2 Actual Production
- 5.6.3 Planned Capacity and Expansion Targets
- 5.7 Supply Chain Structure and Procurement Trends
- 5.8 Supply-Demand Gap and Bottlenecks
- 5.9 Import Dependence and Sourcing Structure
- 5.10 Contract Manufacturing and Outsourcing
- 5.11 Regional Supply and Demand Concentration
Chapter 6 North America Wave and Tidal Energy Market Pricing Analysis
- 6.1 Pricing Structure and Measurement
- 6.2 Historical Pricing Trends, 2018-2025
- 6.3 Pricing Outlook, 2025-2035
- 6.4 Average Selling Price and Unit Economics
- 6.5 Pricing by Product and Market Segment
- 6.6 Geographic Pricing Differences
- 6.7 Key Input, Energy, Labor and Logistics Costs
- 6.8 Contract Pricing and Purchasing Models
- 6.9 Pricing Sensitivity and Competitive Positioning
- 6.10 Price, Margin and Profitability Implications
Chapter 7 North America Wave and Tidal Energy Market Dynamics
- 7.1 Market Growth Drivers
- 7.1.1 Demand-Side Drivers
- 7.1.2 Technology and Innovation Drivers
- 7.1.3 Infrastructure and Investment Drivers
- 7.1.4 Regulatory and Policy Drivers
- 7.2 Market Restraints
- 7.2.1 Cost and Affordability Constraints
- 7.2.2 Technology and Adoption Barriers
- 7.2.3 Supply Chain and Operational Constraints
- 7.3 Market Challenges
- 7.3.1 Competitive Pressure and Margin Erosion
- 7.3.2 Skills, Infrastructure and Implementation Gaps
- 7.4 Emerging Market Opportunities
- 7.5 Market Dynamics Impact and Time-Horizon Assessment
Chapter 8 North America Wave and Tidal Energy Value Chain Analysis
- 8.1 Industry Value Chain Overview
- 8.2 Upstream Suppliers and Critical Inputs
- 8.3 Technology and Component Providers
- 8.4 Manufacturing or Service Delivery
- 8.5 Distribution, Channel Partners and Integrators
- 8.6 Downstream Applications and End Users
- 8.7 Value Addition and Profit Pools
- 8.8 Vertical Integration and Outsourcing
- 8.9 Supplier Concentration and Risk
- 8.10 Supply Chain Localization and Resilience
Chapter 9 North America Wave and Tidal Energy Market Regulations and Policies
- 9.1 Relevant Laws, Standards and Compliance Frameworks
- 9.2 Product, Service, Safety and Quality Requirements
- 9.3 Government Policies, Incentives and Subsidies
- 9.4 Imports, Exports and Trade Barriers
- 9.5 Public Procurement and Local Content Requirements
- 9.6 Environmental and Sustainability Compliance
- 9.7 Upcoming Policy Changes and Market Implications
Chapter 10 North America Wave and Tidal Energy Market Hotspots and Opportunities
- 10.1 Market Opportunity Mapping and Growth Hotspots
- 10.2 High-Growth Applications and Customer Groups
- 10.3 Underserved Markets and White-Space Opportunities
- 10.4 Emerging Technology and Product Opportunities
- 10.5 New Capacity and Investment Hotspots
- 10.6 Market Entry and Expansion Opportunities
- 10.7 Distribution and Partnership Opportunities
- 10.8 Near-Term and Long-Term Commercial Potential
- 10.9 Opportunity Attractiveness and Execution Risks
Chapter 11 North America Wave and Tidal Energy Market Outlook, 2025-2035
- 11.1 Market Size and Analysis
- 11.1.1 Revenue (Market Measurement: 2025: USD 51.8 million → 2035: USD 263.8 million)
- 11.1.2 Market Volume and Quantity Sold
- 11.1.3 Historical Market Size, 2018-2025
- 11.1.4 Base-Year Market Size, 2025
- 11.2 Market Forecast, 2025-2035
- 11.2.1 Revenue Forecast to 2035
- 11.2.2 Volume Forecast to 2035
- 11.2.3 CAGR and Year-on-Year Growth
- 11.2.4 Incremental Revenue Opportunity
- 11.3 Forecast Assumptions and Scenario Analysis
- 11.3.1 Base-Case Forecast
- 11.3.2 Optimistic and Conservative Scenarios
- 11.3.3 Technology, Pricing and Policy Sensitivities
- 11.4 Market Attractiveness and Growth Outlook
Chapter 12 North America Wave and Tidal Energy Market Segmentation and Outlook
- 12.1 Segmentation Summary and Market Shares, 2025
- 12.2 Largest and Fastest-Growing Segments
- 12.3 By Energy Source - Market Size and Forecast, 2025-2035
- 12.3.1 Segment Definition and Scope
- 12.3.2 Historical Market Size, 2018-2025
- 12.3.3 Revenue Forecast, 2025-2035
- 12.3.4 Volume Forecast, 2025-2035
- 12.3.5 Base-Year Market Share, 2025
- 12.3.6 Segment CAGR and Growth Drivers
- 12.3.7 Subsegment Market Size and Forecast
- 12.3.7.1 Wave Energy Converters
- 12.3.7.2 Tidal Stream Turbines
- 12.3.7.3 Hybrid Wave and Tidal Systems
- 12.3.8 Subsegment Pricing and Adoption Trends
- 12.3.9 Leading Suppliers and Competition
- 12.3.10 Regional Demand and Opportunities
- 12.4 By Application - Market Size and Forecast, 2025-2035
- 12.4.1 Segment Definition and Scope
- 12.4.2 Historical Market Size, 2018-2025
- 12.4.3 Revenue Forecast, 2025-2035
- 12.4.4 Volume Forecast, 2025-2035
- 12.4.5 Base-Year Market Share, 2025
- 12.4.6 Segment CAGR and Growth Drivers
- 12.4.7 Subsegment Market Size and Forecast
- 12.4.7.1 Grid-Connected Electricity
- 12.4.7.2 Coastal Microgrid Electricity
- 12.4.7.3 Autonomous Offshore Power
- 12.4.8 Subsegment Pricing and Adoption Trends
- 12.4.9 Leading Suppliers and Competition
- 12.4.10 Regional Demand and Opportunities
- 12.5 By End User - Market Size and Forecast, 2025-2035
- 12.5.1 Segment Definition and Scope
- 12.5.2 Historical Market Size, 2018-2025
- 12.5.3 Revenue Forecast, 2025-2035
- 12.5.4 Volume Forecast, 2025-2035
- 12.5.5 Base-Year Market Share, 2025
- 12.5.6 Segment CAGR and Growth Drivers
- 12.5.7 Subsegment Market Size and Forecast
- 12.5.7.1 Public Research Buyers
- 12.5.7.2 Electricity Project Buyers
- 12.5.7.3 Offshore Mission Buyers
- 12.5.8 Subsegment Pricing and Adoption Trends
- 12.5.9 Leading Suppliers and Competition
- 12.5.10 Regional Demand and Opportunities
- 12.6 By Project Scale - Market Size and Forecast, 2025-2035
- 12.6.1 Segment Definition and Scope
- 12.6.2 Historical Market Size, 2018-2025
- 12.6.3 Revenue Forecast, 2025-2035
- 12.6.4 Volume Forecast, 2025-2035
- 12.6.5 Base-Year Market Share, 2025
- 12.6.6 Segment CAGR and Growth Drivers
- 12.6.7 Subsegment Market Size and Forecast
- 12.6.7.1 Sub-100 kW Systems
- 12.6.7.2 100 kW to Below 1 MW Systems
- 12.6.7.3 1 MW and Above Systems
- 12.6.8 Subsegment Pricing and Adoption Trends
- 12.6.9 Leading Suppliers and Competition
- 12.6.10 Regional Demand and Opportunities
- 12.7 By Country - Market Size and Forecast, 2025-2035
- 12.7.1 Segment Definition and Scope
- 12.7.2 Historical Market Size, 2018-2025
- 12.7.3 Revenue Forecast, 2025-2035
- 12.7.4 Volume Forecast, 2025-2035
- 12.7.5 Base-Year Market Share, 2025
- 12.7.6 Segment CAGR and Growth Drivers
- 12.7.7 Subsegment Market Size and Forecast
- 12.7.7.1 United States
- 12.7.7.2 Canada
- 12.7.7.3 Mexico
- 12.7.8 Subsegment Pricing and Adoption Trends
- 12.7.9 Leading Suppliers and Competition
- 12.7.10 Regional Demand and Opportunities
- 12.8 Segment Growth Comparison
- 12.9 Segment Attractiveness and Priority Matrix
Chapter 13 North America Wave and Tidal Energy End-Use and Application Market Outlook
- 13.1 End-Use Industry and Customer Demand Structure
- 13.2 Leading Applications and Customer Groups
- 13.3 End-Use Market Size, Share and Forecast
- 13.4 Major End-Use Industry Deep Dives
- 13.4.1 Customer Requirements and Use Cases
- 13.4.2 Demand and Replacement Cycles
- 13.4.3 Technical and Regulatory Considerations
- 13.4.4 Purchasing and Procurement Models
- 13.4.5 Leading Vendors and Distribution Channels
- 13.4.6 Forecast and Commercial Opportunities
- 13.5 Emerging Applications and Cross-Segment Demand
- 13.6 End-Use Industry Investment Priorities
Chapter 14 North America Wave and Tidal Energy Geographic Market Outlook, 2025-2035
- 14.1 Regional Market Size and Country-Level Shares, 2025
- 14.2 Country Market Size Comparison, 2025
- 14.3 Country Market Forecasts, 2025-2035
- 14.4 Subregional Industrial and Demand Clusters
- 14.5 Intra-Regional Pricing and Cost Differences
- 14.6 Cross-Border Trade and Supply Networks
- 14.7 Regional Supply and Demand Balances
- 14.8 Country Opportunity Comparison and Prioritization
Note: Every listed country is covered on the structure shown under the first country.
Chapter 15 North America Wave and Tidal Energy Technology, Innovation and Sustainability Outlook
- 15.1 Technology Landscape and Maturity
- 15.2 Product, Process and Service Innovation
- 15.3 AI, Automation and Digital Tools in the Industry
- 15.4 Technology Adoption and Performance Benchmarking
- 15.5 Innovation Pipeline and R&D Investment
- 15.6 Patent and Intellectual Property Trends
- 15.7 Energy Efficiency and Resource Management
- 15.8 Sustainability, Recycling and Circularity
- 15.9 Technology Roadmap, 2025-2035
- 15.10 Risks of Obsolescence and Technology Substitution
Chapter 16 North America Wave and Tidal Energy Market Key Strategic Imperatives
- 16.1 Growth and Market Entry Priorities
- 16.2 High-Return Products and Segments
- 16.3 Pricing, Profitability and Cost Optimization
- 16.4 Technology Investment and Product Differentiation
- 16.5 Supply Chain Localization and Resilience
- 16.6 Distribution and Customer Acquisition
- 16.7 Partnership, Acquisition and Capacity Strategy
- 16.8 Regional Expansion Priorities
- 16.9 Short-, Medium- and Long-Term Actions
Chapter 17 Competition Outlook
- 17.1 Industry Competition Characteristics
- 17.2 Market Structure and Concentration
- 17.3 Market Share and Competitive Positioning, 2025
- 17.4 Company-Wise Revenue and Product Benchmarking
- 17.5 Production and Service Capacity Benchmarking
- 17.6 Technology, Pricing and Differentiation
- 17.7 Regional Footprint and Distribution Strength
- 17.8 Mergers, Acquisitions and Strategic Alliances
- 17.9 New Entrants and Competitive Threats
- 17.10 Porter's Five Forces and Industry Attractiveness
- 17.11 Competitive Outlook, 2025-2035
Chapter 18 Company Profiles
- 18.1 Company Coverage and Selection Criteria
- 18.2 Ocean Power Technologies
- 18.2.1 Business Description
- 18.2.2 Company Ownership and Geographic Presence
- 18.2.3 Product and Service Portfolio
- 18.2.4 Manufacturing and Operating Footprint
- 18.2.5 Production Capacity and Expansion Plans
- 18.2.6 Financial Performance and Investment
- 18.2.7 Market Share and Competitive Position
- 18.2.8 Technology and Innovation Capabilities
- 18.2.9 Strategic Alliances or Partnerships
- 18.2.10 Recent Developments
- 18.2.11 Growth Strategy and Outlook
- 18.3 Ocean Renewable Power Company
- 18.4 CalWave Power Technologies
- 18.5 Eauclaire Tidal Limited Partnership
- 18.6 C-Power
- 18.7 Verdant Power
- 18.8 Oscilla Power
- 18.9 OceanEnergy Group
- 18.10 Northwest Energy Innovations
- 18.11 Triton Systems
- 18.12 Other Relevant Market Participants
Note: Every listed company is profiled on the structure shown under the first company. The company list is preliminary and may change based on research findings, market developments, data availability and client requirements.
Chapter 19 Disclaimer
- 19.1 Research and Forecast Disclaimer
- 19.2 Data Source and Estimation Limitations
Note: The depth of individual sections depends on data availability for this market. Volume, capacity, trade and other unit-based metrics are included where applicable.