
Kilns burn about 7 million metric tons of waste fuel a year
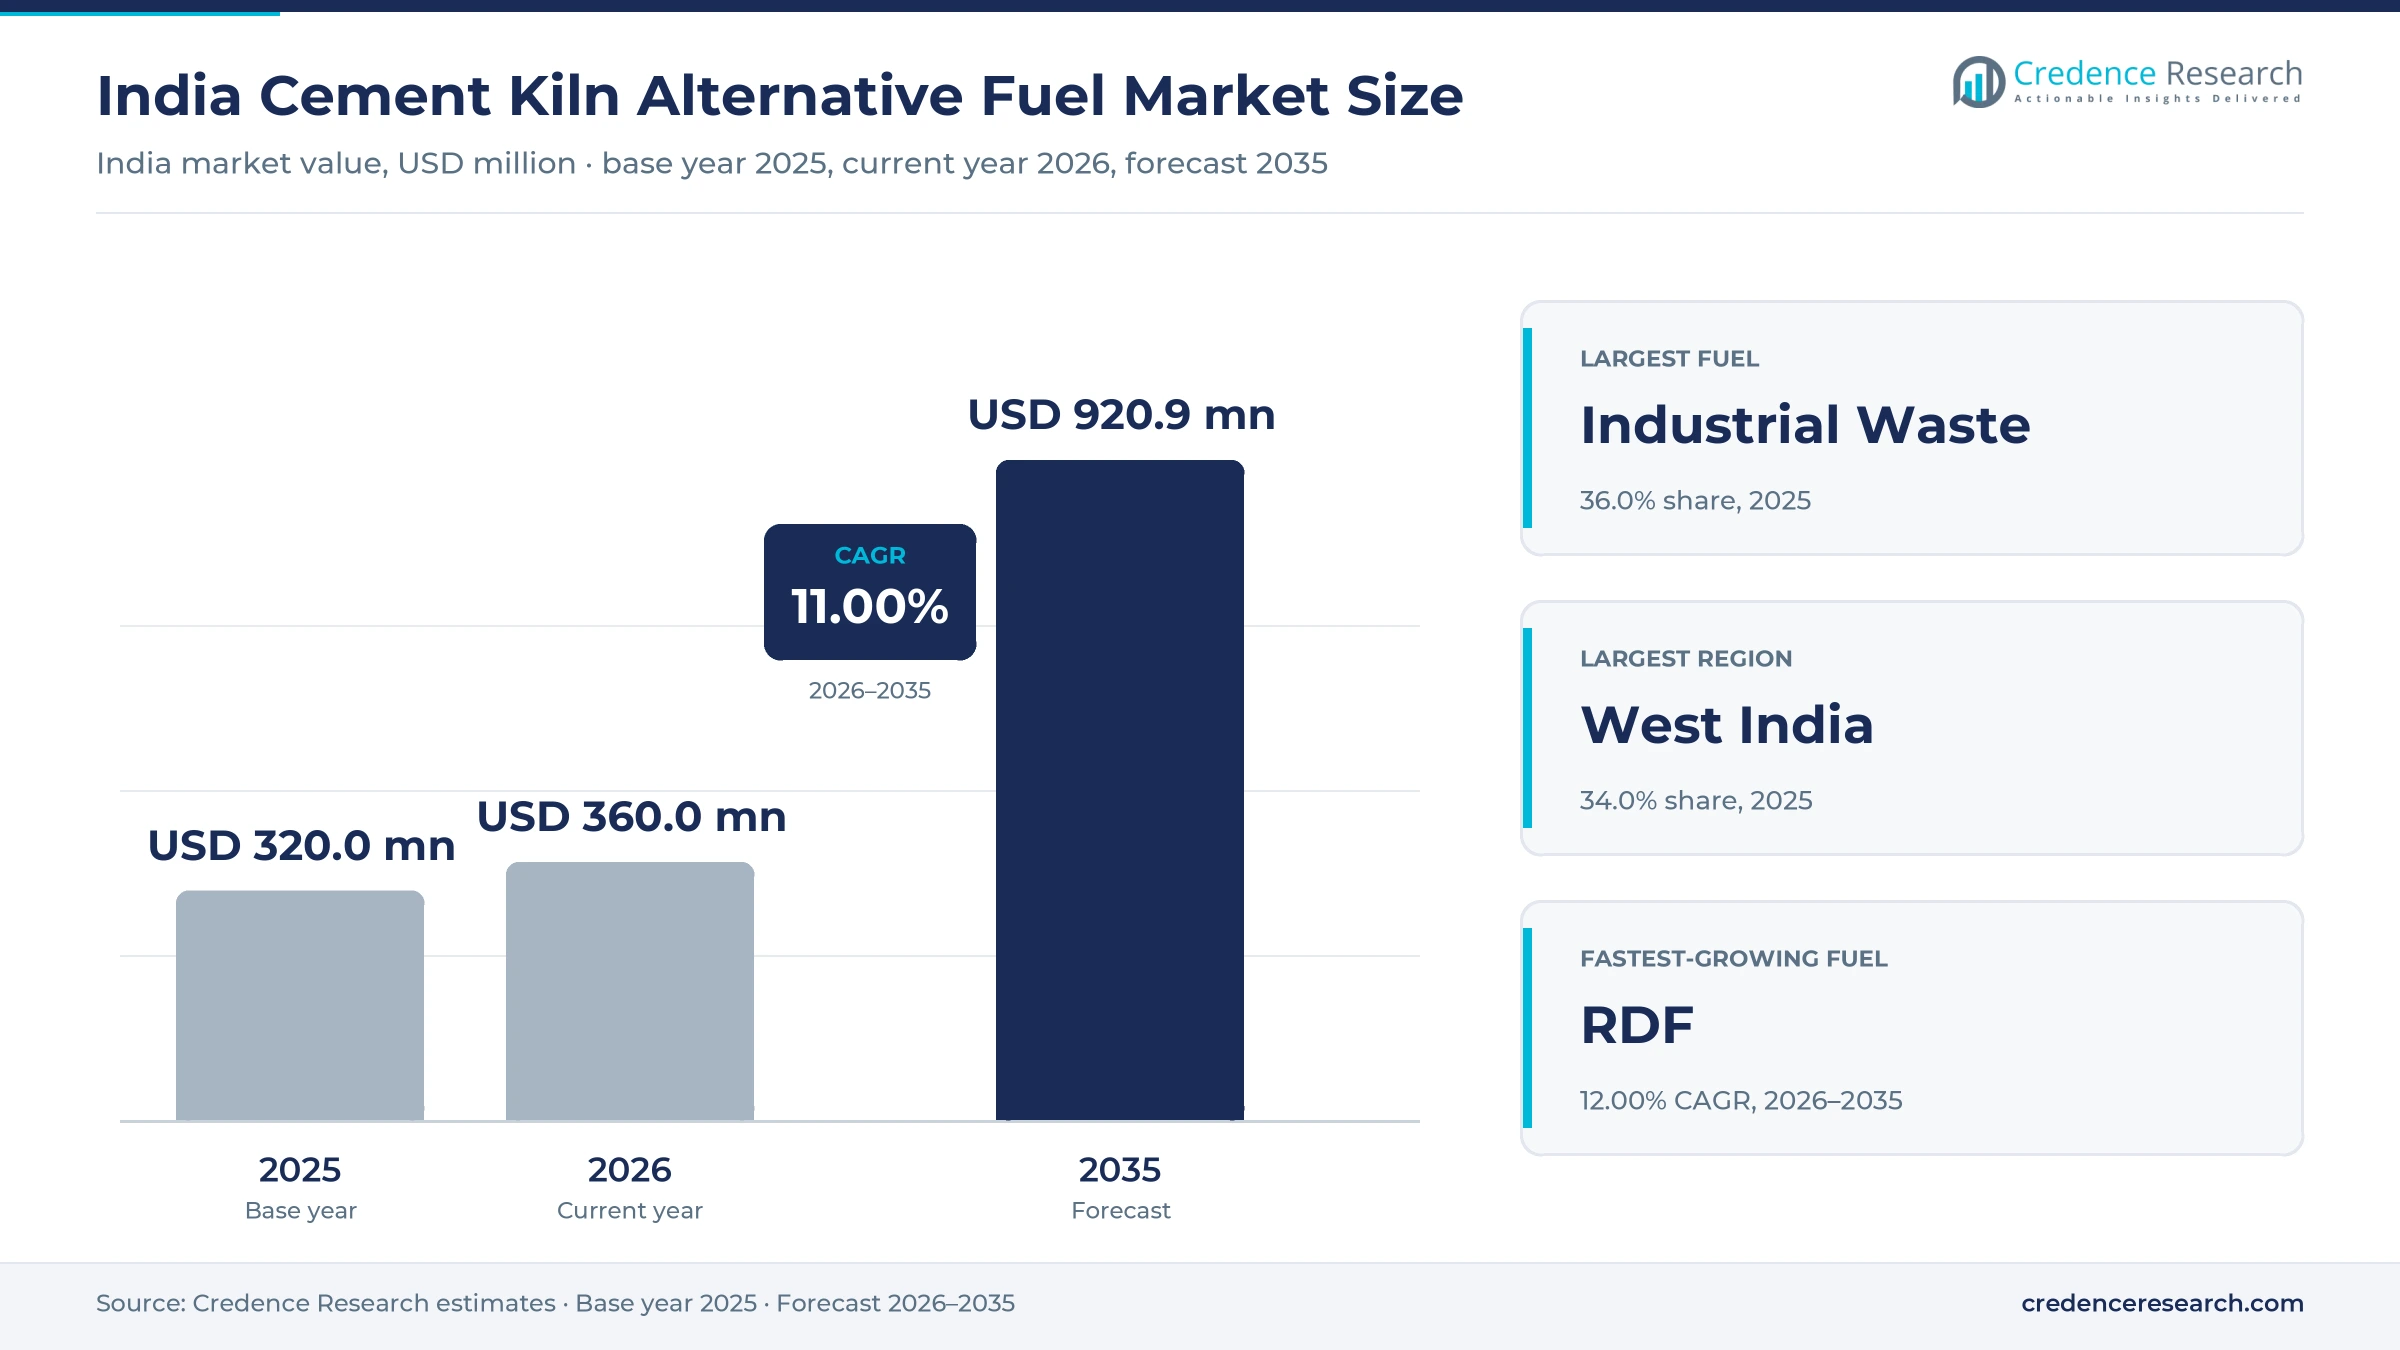
The India cement kiln alternative fuel market was valued at USD 320.0 million in 2025 and is projected to increase from USD 360.0 million in 2026 to USD 920.9 million by 2035, registering a CAGR of 11.00% during 2026–2035. Demand comes from integrated cement plants that replace coal and petcoke in kilns and calciners with refuse-derived fuel, industrial waste, agricultural biomass and shredded tyres, buying them from city waste bodies, waste processors and industrial generators. West India held the largest regional share, 34.0% in 2025, because the chemical and engineering clusters of Gujarat and Maharashtra produce the largest industrial waste streams fed to kilns. Northeast India is the fastest-growing region at 12.13% a year, from a small base as new clinker capacity is built in Assam. Thermal substitution still averages only single digits across Indian kilns, so most heat still comes from coal and petcoke. The main regulatory change is the Solid Waste Management Rules, 2026, which took effect on April 1, 2026, and require cement plants to raise refuse-derived fuel use from 5% to 15% over six years.
Which kiln fuels and supply payments are counted here?
The market counts the delivered value of non-fossil and waste-derived fuels fired in Indian cement kilns and calciners. It covers refuse-derived fuel made from municipal dry waste, industrial and hazardous waste sent for co-processing, agricultural residues and other biomass, and whole or shredded end-of-life tyres, valued at the price cement plants pay at the plant gate, including pre-processing.
The scope excludes coal, petcoke and lignite, alternative raw materials such as fly ash and slag, waste heat recovery power and biomass burned in captive power plants. Gate fees that cement plants earn for destroying some hazardous wastes are netted against fuel purchases, so the value is measured once at the kiln.
India Cement Kiln Alternative Fuel Market Insights
- The market grows from USD 320.0 million in 2025 to USD 920.9 million by 2035 at an 11.00% CAGR, as kilns burned about 7 million metric tons of alternative fuel in FY2025-26.
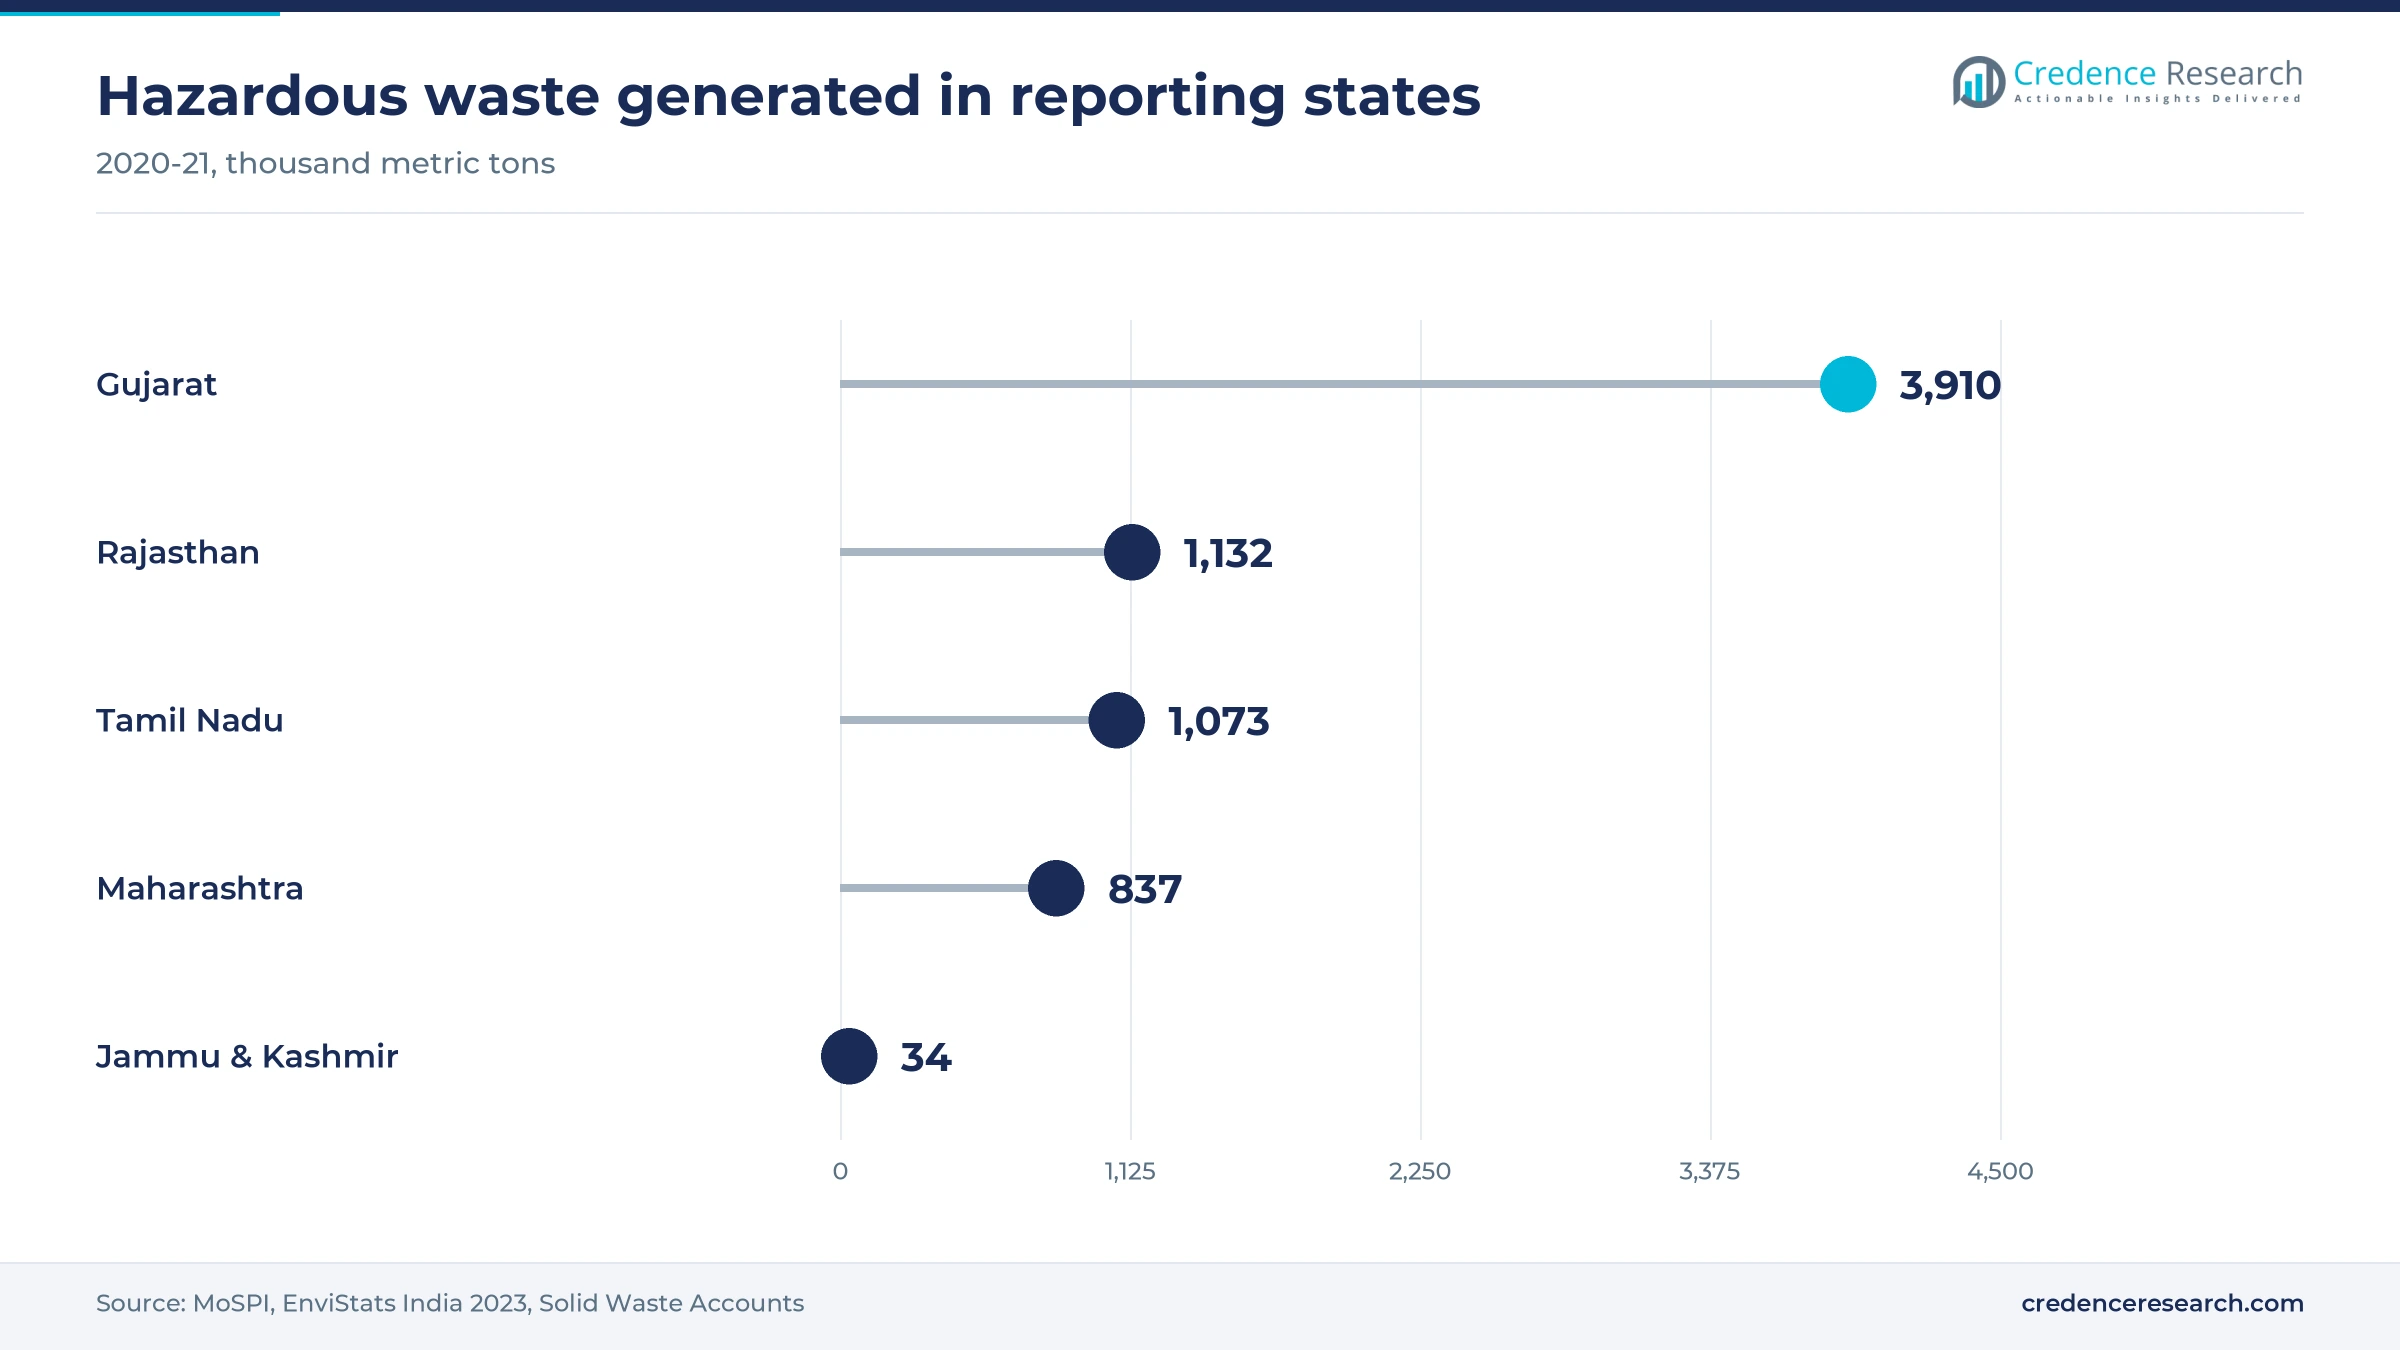
- West India held 34.0% of 2025 value, because Gujarat generated about 3.91 million metric tons of hazardous waste in 2020-21, the largest volume reported by MoSPI.
- Industrial waste led the fuel split with 36.0% in 2025, while RDF grows fastest at 12.00% a year under the Solid Waste Management Rules, 2026.
- The Solid Waste Management Rules, 2026 took effect on April 1, 2026, and require plants to lift RDF use from 5% to 15% over six years.
- UltraTech Cement used 2.57 million metric tons of waste as alternative fuel in its kilns and captive power plants in FY26, the year to March 2026.
Industrial waste leads while municipal RDF grows fastest
Why does industrial waste hold the largest fuel share?
Based on fuel, the market is categorized into RDF, biomass, industrial waste and tyres. Industrial Waste led with 36.0% of 2025 value because it arrives from fewer, larger sources with steadier heat value, and MoSPI data show Gujarat alone generated 3.91 million metric tons of hazardous waste in 2020-21. Biomass follows, as Geoclean set up 50,000 metric tons a year of agro-waste supply for the Ambuja Marwar plant in March 2024. RDF grows fastest at 12.00% a year as the Solid Waste Management Rules, 2026, in force since April 1, 2026, set a rising RDF floor for cement plants.
How do municipal and industrial suppliers compare?
Based on supplier, the market is categorized into municipal and industrial. Industrial suppliers led with 57.0% of 2025 value because chemical, pharmaceutical and engineering plants sign long contracts for waste destruction, and Gujarat, Rajasthan, Tamil Nadu and Maharashtra together reported about 6.95 million metric tons of hazardous waste in 2020-21, according to MoSPI. Biomass aggregators that bale crop residues for kilns are also counted in this group. Municipal supply grows fastest at 11.89% a year as city bodies sign offtake deals, and Bengaluru Solid Waste Management agreed in December 2025 to send 200 to 250 metric tons of RDF a day to Dalmia Cement.
Why do large cement groups buy most kiln fuel?
Based on producer, the market is categorized into large cement groups and mid-size & regional producers. Large Cement Groups led with 64.0% of 2025 value because UltraTech Cement alone used 2.57 million metric tons of waste as alternative fuel in its kilns and captive power plants in FY26, according to its bond report, against about 7 million metric tons burned in kilns nationally, as CII stated. ACC added about 4.5 lakh metric tons in FY26, Business Today reported. Mid-size & Regional Producers grow fastest at 11.88% a year as the Solid Waste Management Rules, 2026 extend an RDF floor of 5% rising to 15% to every cement plant, Drishti IAS reported.
| Segment Group | Leading Sub-segment | Share, 2025 | Fastest-growing Sub-segment | CAGR, 2026–2035 |
|---|---|---|---|---|
| By Fuel | Industrial Waste | 36.0% | RDF | 12.00% |
| By Supplier | Industrial | 57.0% | Municipal | 11.89% |
| By Producer | Large Cement Groups | 64.0% | Mid-size & Regional Producers | 11.88% |
Request a Free Sample
Fill in your details and we'll send you a free sample report.
- Sample data tables & charts
- Research methodology
Net-zero roadmaps and RDF rules raise substitution
Decarbonization targets push kilns off coal
Cement producers are raising alternative fuel use because fuel combustion is a large share of their emissions and net-zero plans now set dated substitution goals. ACEEE reported in July 2026 that fuel burning causes about 32% of Indian cement emissions and that alternative fuels supply only about 6% of kiln heat. The NITI Aayog roadmap for cement decarbonization, released in January 2026, targets a 20% to 25% thermal substitution rate by 2030, according to Indian Cement Review. Geoclean, the waste arm of Ambuja Cements and ACC, is aiming for a 25% rate by 2027-28. In the Credence Research model this adds about 4.6 percentage points to annual demand growth to 2035.
Municipal and industrial waste processing widens feedstock
More processed waste is reaching kilns because cities and states now require segregation and RDF recovery from dry waste. India generates about 62.4 million metric tons of municipal solid waste a year, Indian Cement Review reported in April 2026, citing CPCB and NITI Aayog. The Solid Waste Management Rules, 2026 took effect on April 1, 2026, with four-stream segregation at source. Andhra Pradesh asked plants within 400 km of its towns in March 2025 to take RDF from 7,000 metric tons a day of waste collected by 123 urban local bodies, Global Cement reported. Karnataka already makes about 215 metric tons of RDF a day from dry waste, Renewable Watch reported in March 2025. In the Credence Research model this adds about 2.9 percentage points to annual demand growth.
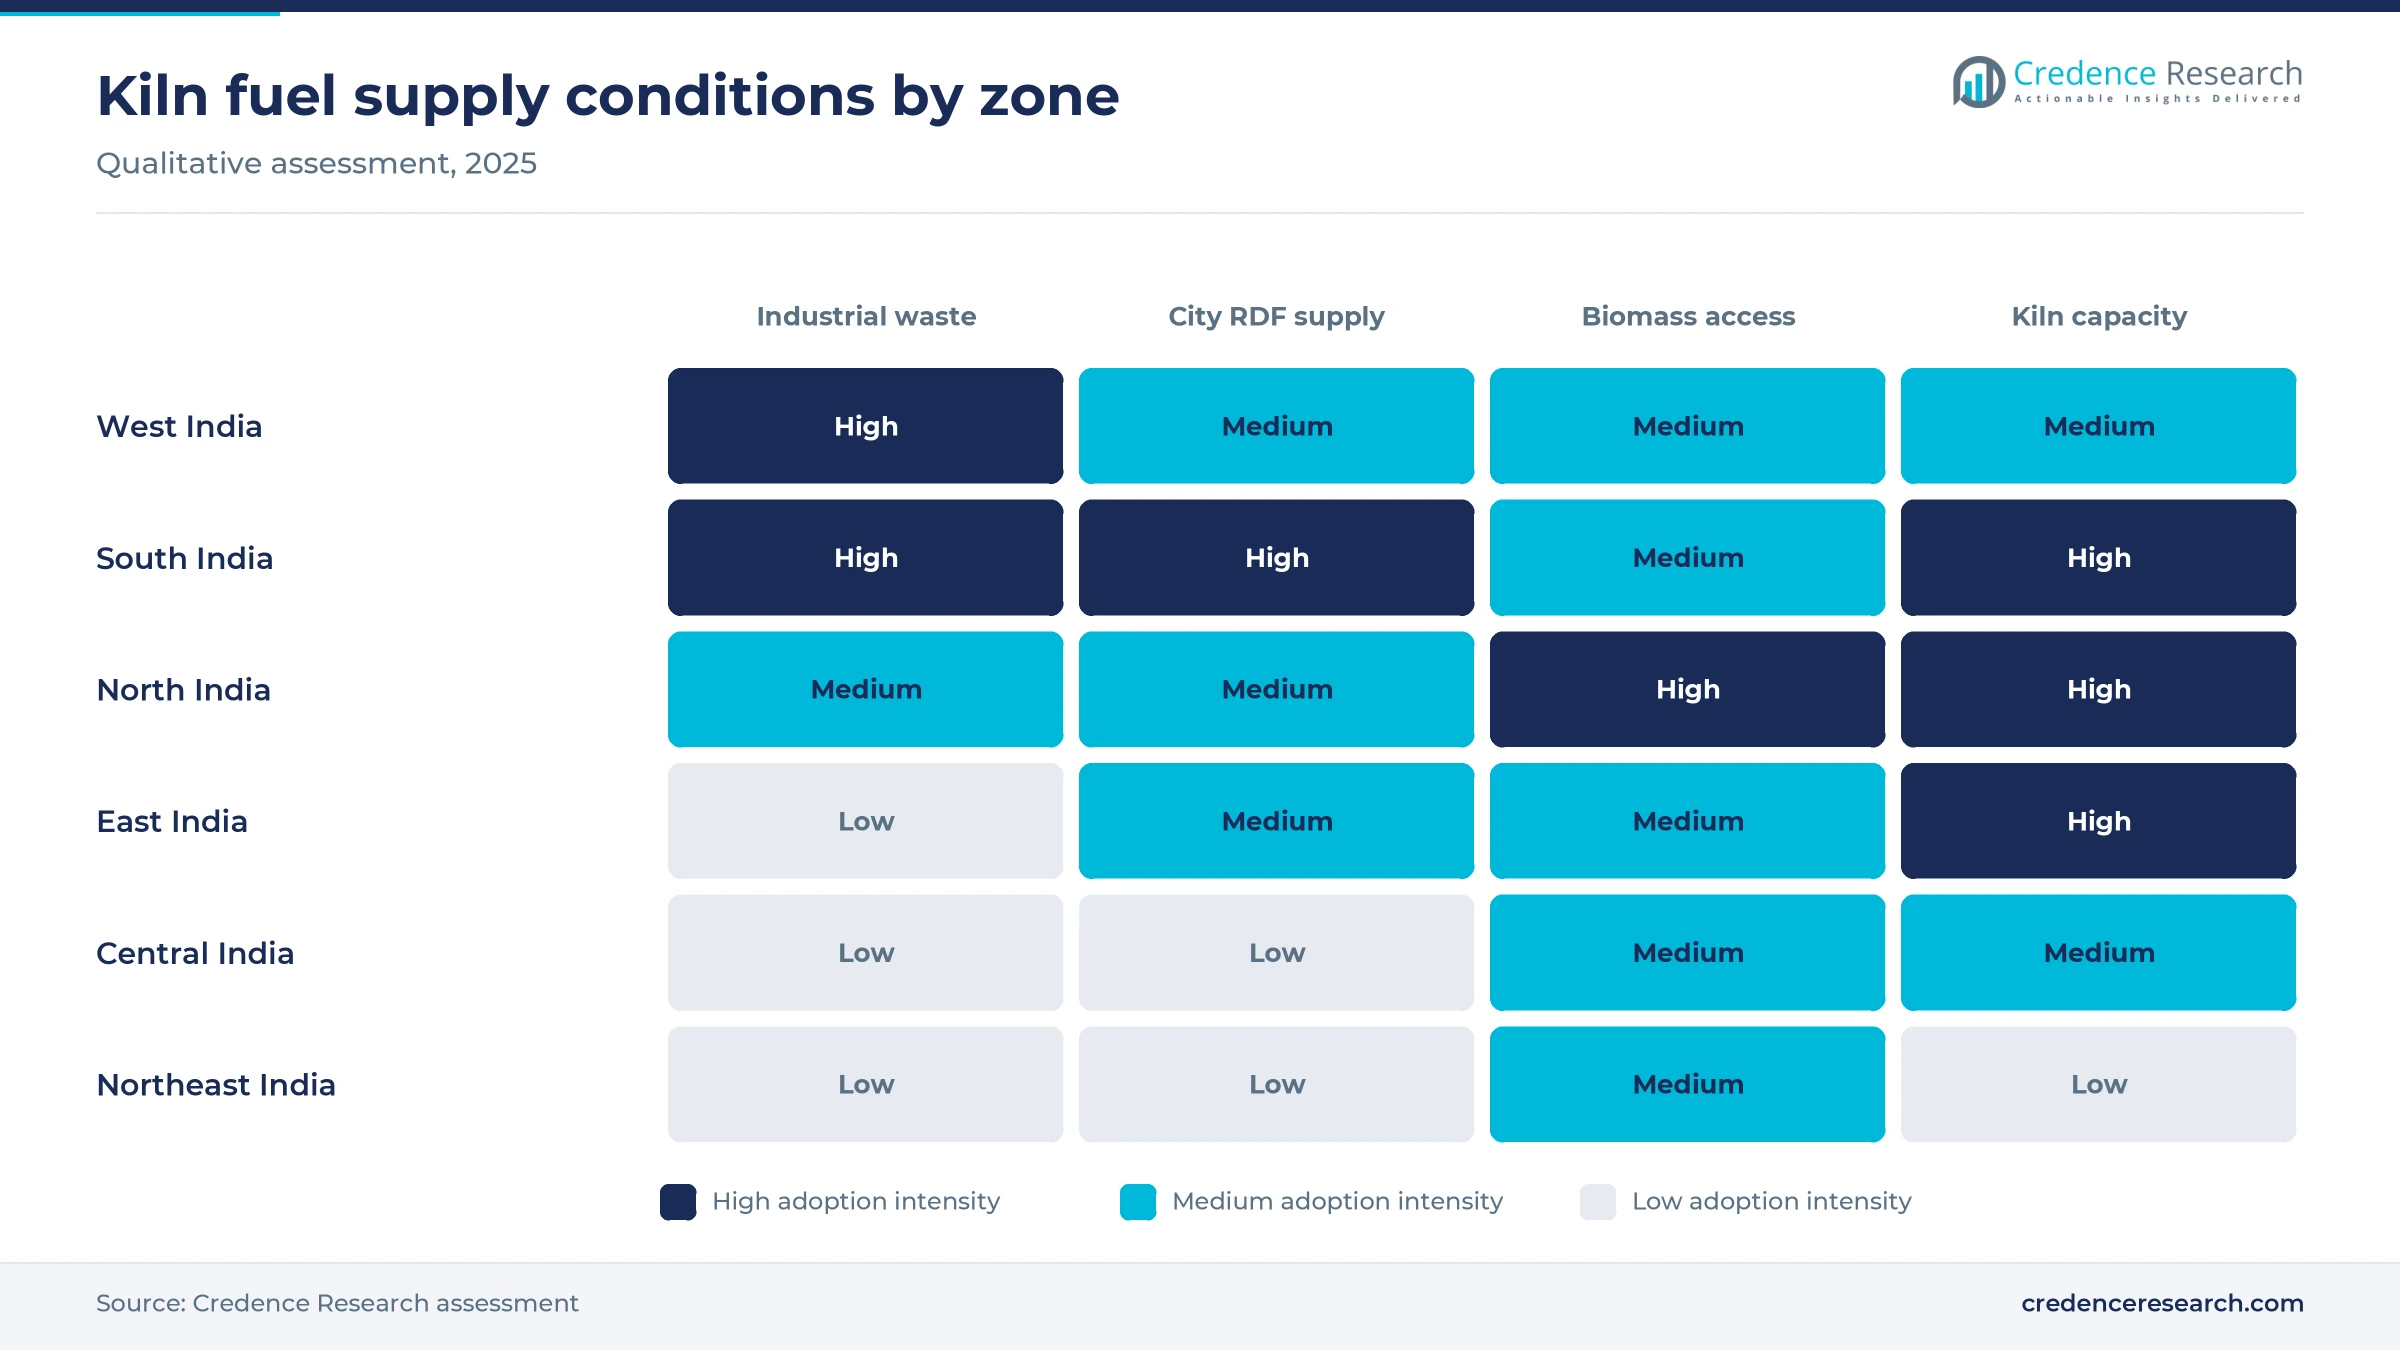
Higher substitution rates create recurring supply contracts
Each step up in thermal substitution turns into a standing order for fuel, because a kiln that reaches double-digit substitution must be fed every day of the year. UltraTech Cement used 2.57 million metric tons of waste as alternative fuel in its kilns and captive power plants in FY26, reaching a 6.6% kiln rate. ACC co-processed about 4.5 lakh metric tons of alternative fuels and waste-derived materials in FY26, Business Today reported in June 2026. Geoclean's Ambuja Marwar facility, opened in March 2024, converts 220,000 metric tons of waste a year and lifts that plant well into double-digit substitution. In the Credence Research model this adds about 1.9 percentage points to annual demand growth to 2035.
Rising output and petcoke prices raise fuel savings
Growing clinker output and volatile fossil fuel prices raise the value of every metric ton of fuel a kiln can replace. Cement production rose 8.6% to 491.4 million metric tons in FY26, Construction World reported in May 2026. The same report put petcoke at about Rs 15,800 a metric ton in April 2026, up 22% from a year earlier, against imported coal at USD 102 a metric ton. CII said in October 2026 that the sector now burns about 7 million metric tons of alternative fuel a year at a 7.5% substitution rate, after more than Rs 12 billion of co-processing investment in six years. As a result, more plants can justify pre-processing lines that pay back on fuel savings.
City offtake deals and plant pre-processing reshape supply
Shift toward city RDF offtake contracts
Cement groups are shifting from spot purchases to standing offtake contracts with city waste bodies, which gives them steadier volumes and gives cities a disposal outlet. Bengaluru Solid Waste Management agreed in December 2025 to send 200 to 250 metric tons of RDF a day to Dalmia Cement in Kadapa, and Dalmia offered to accept up to 1,000 metric tons a day. Bhubaneswar Municipal Corporation extended its deal with Dalmia Cement by another 70,000 metric tons in July 2024, Global Cement reported. Tiruchi has diverted 2,384 metric tons of plastics to Dalmia and UltraTech plants since July 2024, Global Cement reported in September 2025. Municipal supply therefore grows at 11.89% a year in the Credence Research model.
Rise of pre-processing platforms at cement plants
Producers are building their own shredding, drying and feeding platforms, because raw city waste is too mixed to fire without preparation. Geoclean opened the Ambuja Marwar pre-processing and co-processing facility and the ACC Jamul co-processing facility in March 2024, with capacity for 220,000 and 120,000 metric tons a year, Cemnet reported. Zuari Cement, part of Heidelberg Materials, installed an RDF line at Yerraguntla in Andhra Pradesh that processes 20 metric tons an hour, Bioenergy International reported in September 2023. Indian Cement Review noted in April 2026 that meaningful coal displacement needs 40 to 70 metric tons an hour of processing. As a result, fuel preparation is moving inside cement companies.
Agro-residue biomass supply chains near plants
Crop residues offer an opening for suppliers that can collect, bale and deliver biomass on a fixed schedule, because kilns need steady volumes after the harvest season ends. The Ambuja Marwar Farmer Producer Organization supplies 50,000 metric tons a year of agro-waste to the Marwar facility, according to The CSR Journal. The same facility has capacity to convert 220,000 metric tons of waste a year into kiln fuel. UltraTech signed an MoU with Punjab Renewable Energy Systems in October 2021 to replace coal with biomass at three units, saving more than 150,000 metric tons of CO2 a year, T&D India reported. JSW Cement signed a similar agri-waste deal with the same aggregator in April 2022, according to Cemnet. Aggregators that add storage near plants can therefore win multi-year supply contracts.
Tyre EPR rules open a kiln route for scrap tyres
End-of-life tyres offer a second opening, because producer responsibility rules now push tyre makers to pay for certified disposal. Under the waste tyre EPR rules, producers had to cover 100% of their 2020-21 output in 2024-25, Drishti IAS reported in September 2024. The same guidelines set penalties of up to Rs 8.40 per kg for missed targets and banned tyre imports for pyrolysis oil or char. CSE reported in July 2025 that India recycles more than 3 million metric tons of waste tyres a year, with nearly three-fourths sent to pyrolysis. Kilns that burn shredded tire chips can take part of that stream.
Wet waste, long hauls and cheap coal slow substitution
Wet and mixed city waste lowers heat value
Poorly segregated city waste reaches kilns wet and mixed, which cuts heat value and damages feeding equipment. Plants told Down To Earth in October 2023 that incoming waste carried 30% to 50% moisture and 30% to 40% ash. Wonder Cement's 5,000-ton storage shed received about 300 metric tons a day, below its design input, the same report said. Plants respond with drying, sorting and penalties linked to calorific value, which raise handling costs before any coal is saved.
Long hauls push up delivered fuel costs
Freight is a large share of delivered fuel cost, because many plants sit far from the cities that produce RDF. Down To Earth reported in October 2023 that companies source waste from 500 to 1,000 km away and that one truck of coal equals nine trucks of waste in heat value. The Kalaburagi cement hub is more than 400 km from Bengaluru, Renewable Watch noted in March 2025. Long hauls narrow savings, so plants prefer nearby industrial waste and biomass where they can find it.
Contract disputes interrupt municipal supply
Municipal supply can stop abruptly when plants, transporters and city bodies fall out, leaving RDF stranded at landfills. The Tribune reported in February 2023 that Ambuja's Darlaghat plant and ACC's Barmana plant in Himachal Pradesh had been shut since Dec. 15, 2022, so RDF piled up at the Solan and Shimla disposal sites. Such breaks hurt both sides, as cities miss disposal targets and kilns fall back on coal. Longer written offtake contracts with fixed quality bands reduce that risk.
Lower coal prices narrow the fuel saving
Alternative fuel competes with coal on delivered heat cost, so cheaper coal weakens the case for new pre-processing lines. Construction World reported in May 2026 that imported coal fell 17% from a year earlier to USD 102 a metric ton in April 2026. Indian cement plants also pay city bodies for RDF, unlike plants in Germany or the U.S. that local governments often pay to take waste, Renewable Watch noted in March 2025. Mandated RDF shares under the 2026 rules keep demand steady when coal is cheap.
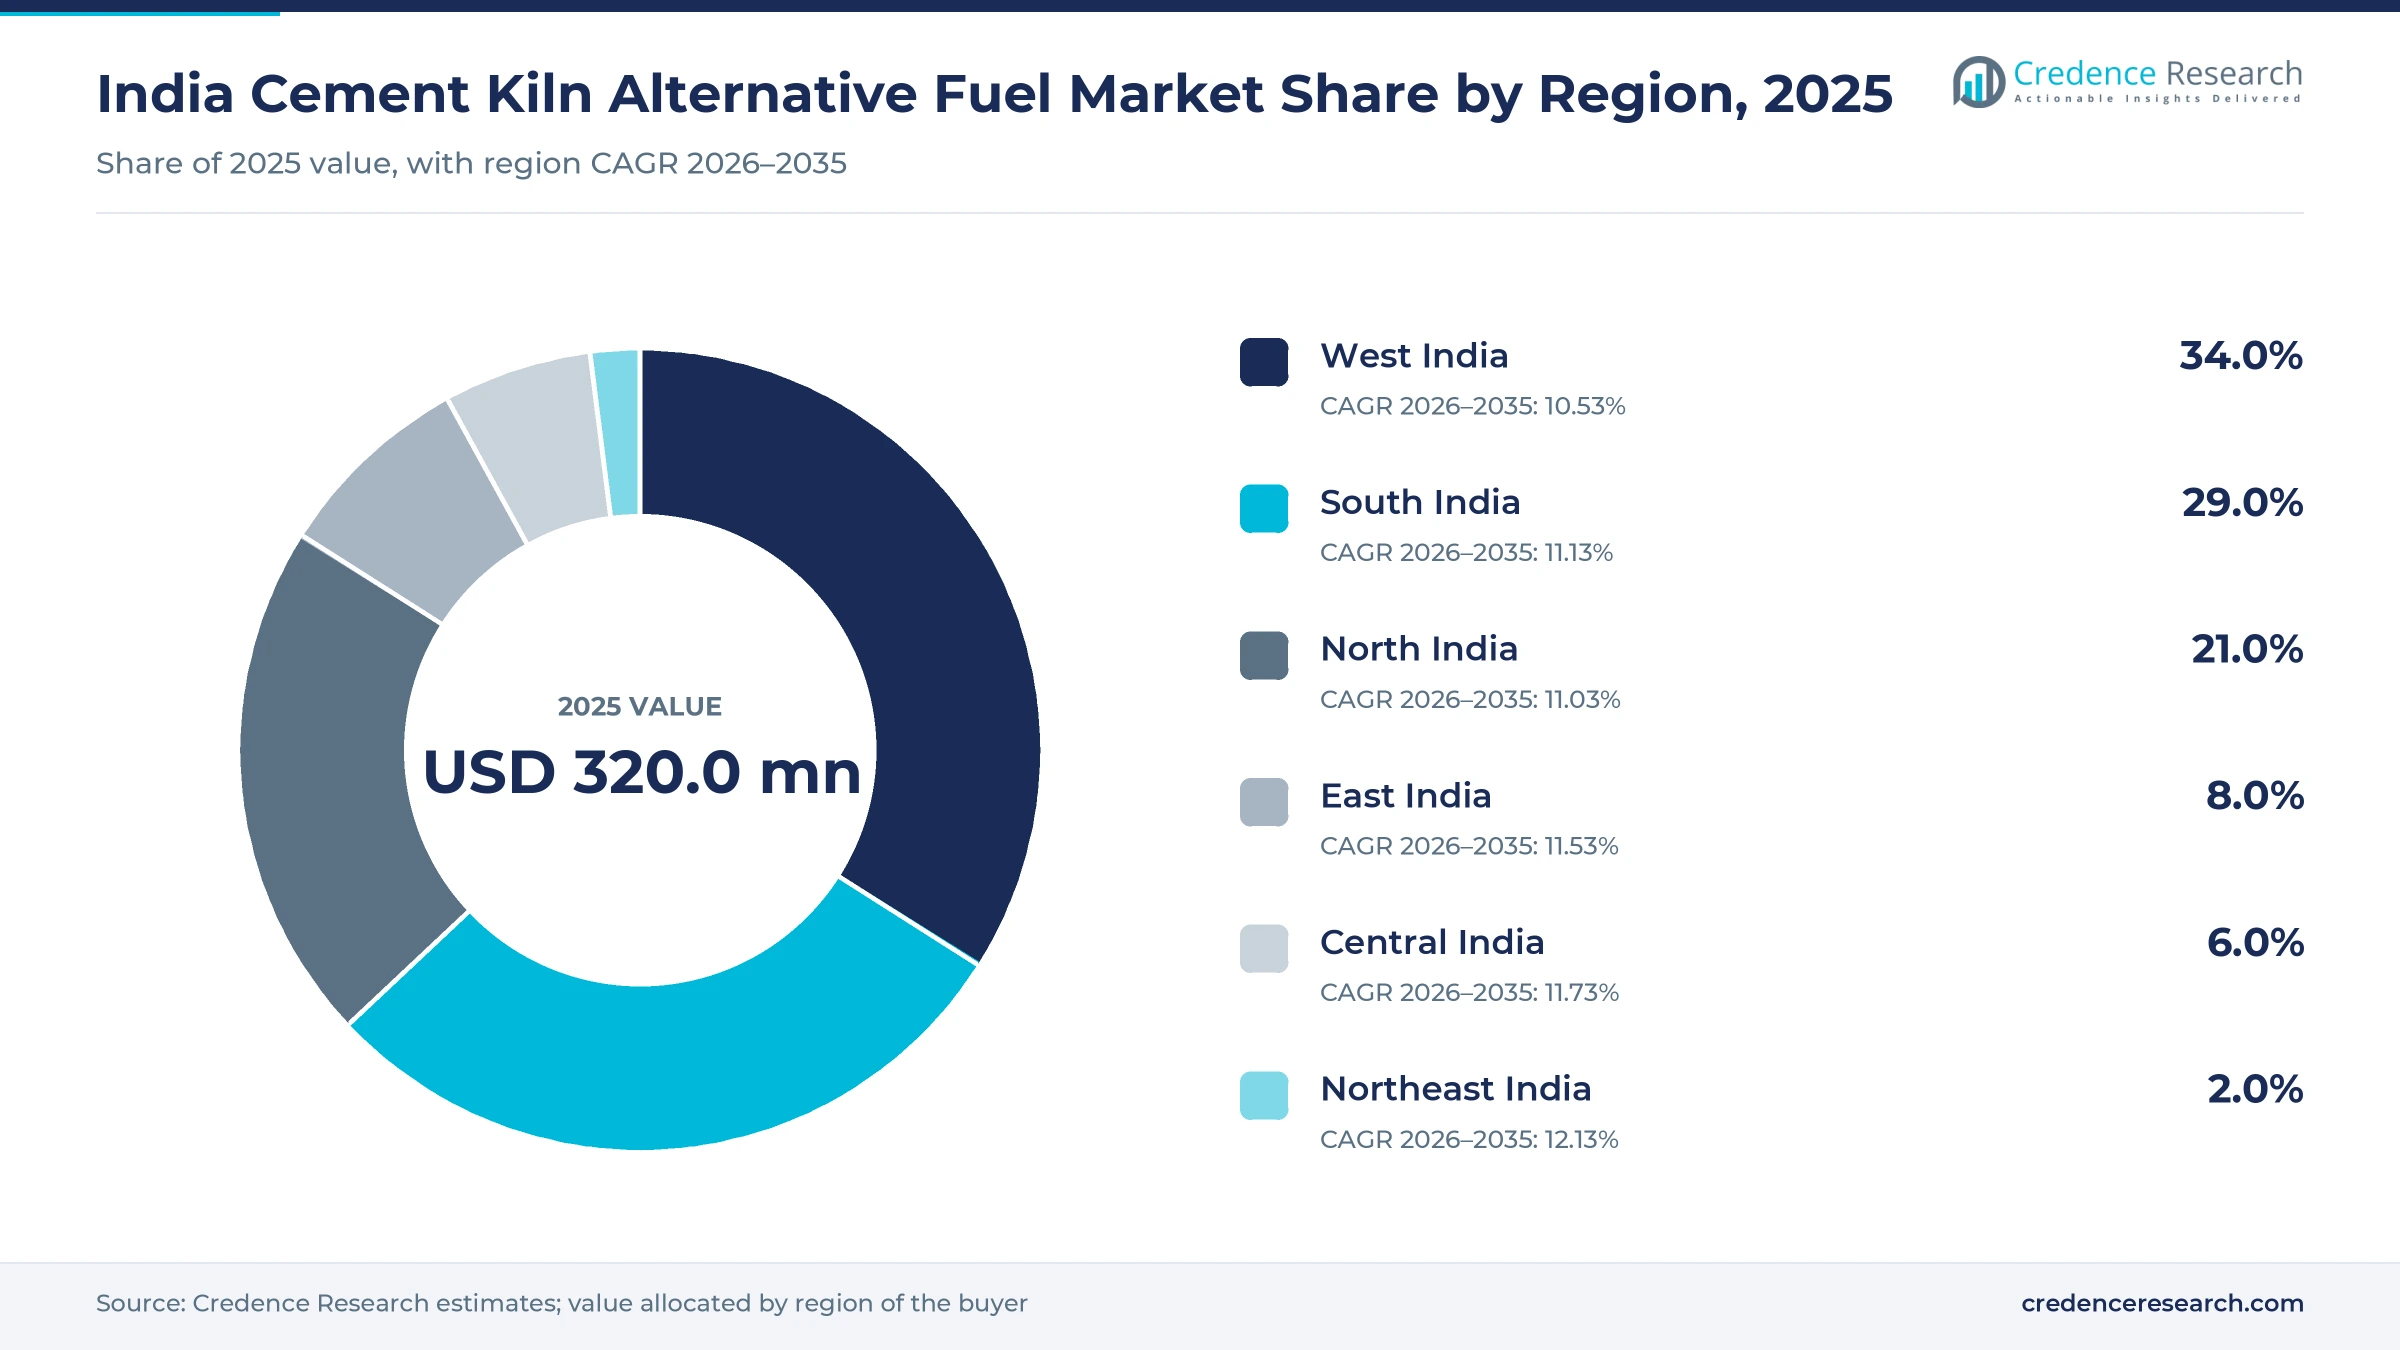
West India leads on Gujarat and Maharashtra waste streams
| Region | Value, 2025 (USD million) | Share, 2025 | CAGR, 2026–2035 |
|---|---|---|---|
| West India | 108.8 | 34.0% | 10.53% |
| South India | 92.8 | 29.0% | 11.13% |
| North India | 67.2 | 21.0% | 11.03% |
| East India | 25.6 | 8.0% | 11.53% |
| Central India | 19.2 | 6.0% | 11.73% |
| Northeast India | 6.4 | 2.0% | 12.13% |
West India leads on Gujarat and Maharashtra waste
West India held 34.0% of 2025 value and grows at 10.53% a year, the largest base in the country. MoSPI EnviStats data show Gujarat generated 3.91 million metric tons of hazardous waste in 2020-21 and Maharashtra 0.84 million metric tons, much of it suitable for co-processing. Maharashtra also generated about 8.26 million metric tons of municipal solid waste that year, the most among reporting states. Growth is slightly below the national rate because industrial waste contracts are already well developed in these states.
South India gains on city RDF offtake deals
South India held 29.0% of 2025 value and grows at 11.13% a year. The zone has the most active city offtake deals, including Bengaluru's December 2025 supply agreement with Dalmia Cement in Kadapa and Tiruchi's plastics diversion since July 2024. Andhra Pradesh asked plants in March 2025 to raise RDF use, and Kerala converted about 48,000 metric tons of non-recyclable waste into RDF for cement plants in 2023, Global Cement reported. Tamil Nadu also generated 1.07 million metric tons of hazardous waste in 2020-21, according to MoSPI.
North India builds on Rajasthan and Himachal plants
North India held 21.0% of 2025 value and grows at 11.03% a year. Rajasthan generated 1.13 million metric tons of hazardous waste in 2020-21, according to MoSPI, and Geoclean's Marwar facility in the state converts 220,000 metric tons of waste a year. In Himachal Pradesh, UltraTech signed an MoU in February 2025 to co-process non-recyclable plastic from 29 department units at its Baga kiln, ThePrint reported. Delhi landfill RDF also reaches plants, as JK Cement agreed in 2022 to remove 50,000 metric tons a year.
East India grows on Odisha city waste deals
East India held 8.0% of 2025 value and grows at 11.53% a year, faster than the national rate. In Odisha, Bhubaneswar Municipal Corporation sent about 50,000 metric tons of RDF to Dalmia Cement's Rajgangpur plant in six months and extended the deal by 70,000 metric tons in July 2024, Global Cement reported. The zone has about 135 million metric tons a year of cement capacity, according to IBEF. City supply is still thin outside the state capitals, so most plants rely on industrial and biomass fuel.
Central India rises with new co-processing lines
Central India held 6.0% of 2025 value and grows at 11.73% a year, among the fastest zones. Geoclean opened the ACC Jamul co-processing facility in Chhattisgarh in March 2024, which handles 120,000 metric tons of alternative fuel a year and lifts the plant to a 10% rate. IBEF data put Central India cement capacity at about 91 million metric tons a year. More plants in the zone can add co-processing as nearby cities expand dry waste collection under the 2026 rules.
Northeast India starts from new Assam capacity
Northeast India held 2.0% of 2025 value and grows at 12.13% a year, the fastest rate of any zone. JK Lakshmi Cement is building a Rs 110 billion plant at Umrangso in Assam with 2.5 million metric tons of cement and 1 million metric tons of clinker capacity, due by FY2029, Indian Cement Review reported. New clinker lines can be designed for alternative fuel feeding from the start. Growth stays small in absolute terms because the zone has few kilns today.
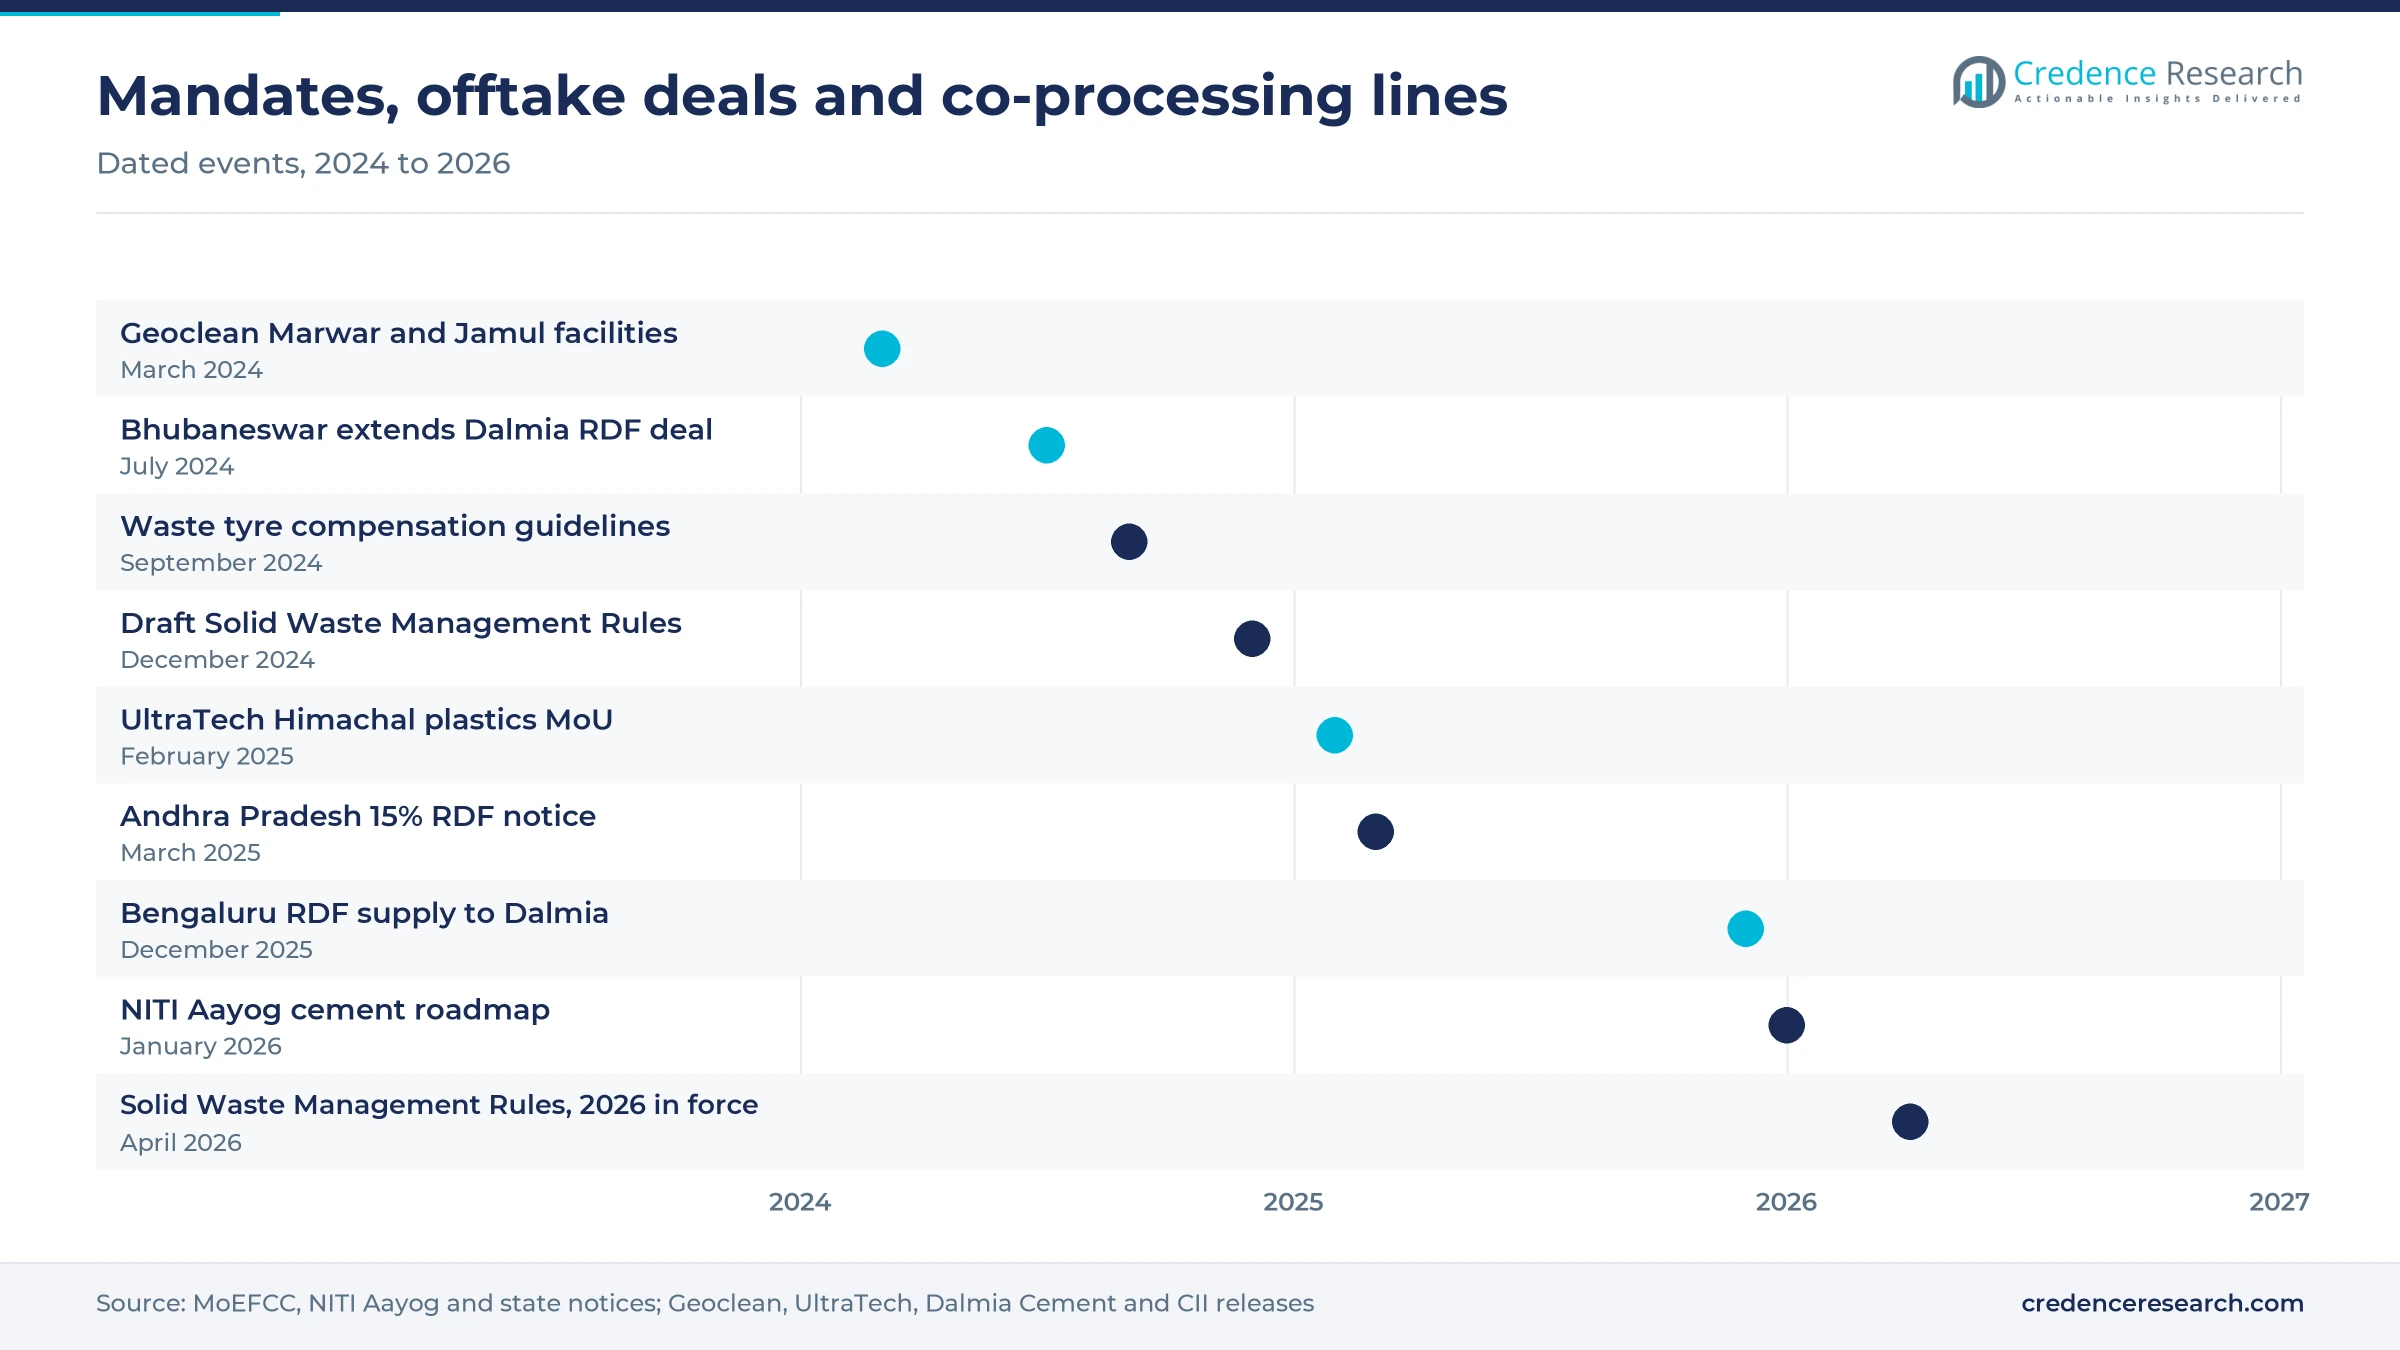
Rules, offtake deals and co-processing lines, 2024 to 2026
| Development | Status and market relevance |
|---|---|
| In March 2024, Geoclean opened the Ambuja Marwar pre-processing facility for 220,000 metric tons of waste a year and the ACC Jamul co-processing facility for 120,000 metric tons. | Operating; plants target 15% and 10% substitution rates |
| In December 2024, the Ministry of Environment, Forest and Climate Change released draft Solid Waste Management Rules with RDF reporting duties for plants. | Finalized as the Solid Waste Management Rules, 2026 |
| In February 2025, UltraTech Cement signed an MoU with the Himachal Pradesh Rural Development Department to co-process plastic waste at Baga. | Active; waste from five districts and 29 units |
| In December 2025, Bengaluru Solid Waste Management began sending RDF to Dalmia Cement in Kadapa, with 160 metric tons dispatched on the first day. | Operating; 200 to 250 metric tons a day agreed |
| In April 2026, the Solid Waste Management Rules, 2026 took effect, raising required RDF use in cement plants from 5% to 15% over six years. | In force; applies to urban and rural local bodies |
Shredders, feeders and lab checks lift kiln substitution
- Primary and secondary shredders cut mixed waste to 30 mm to 80 mm pieces, and Indian suppliers now offer units rated at up to 40 metric tons an hour.
- Calciner feeding systems let plants fire coarse RDF and tyre chips in the precalciner, where lower temperatures allow larger fuel pieces.
- Drying and storage sheds reduce moisture in monsoon waste, which can exceed 40% to 50% and lowers usable heat value.
- Online fuel quality checks track calorific value and chlorine, so plants can price deliveries and protect kilns from buildup.
Need a Custom Version of This Report?
Tailor the scope, geography, or segments to your exact requirements.
- Custom geography or segment scope
- Direct access to our analyst team
Cement groups build their own waste arms
Competition in kiln fuel is shaped by cement groups that own waste arms and by independent processors that sell to them. Geoclean, the waste business of Ambuja Cements and ACC, runs pre-processing and co-processing sites across both companies' plants. UltraTech Cement buys municipal and industrial waste for its kilns and signs state agreements such as the Himachal Pradesh plastics MoU. Dalmia Bharat has built municipal offtake deals in Bhubaneswar, Tiruchi and Bengaluru. JK Cement and Zuari Cement, part of Heidelberg Materials, run their own RDF intake and shredding. Biomass aggregators such as Punjab Renewable Energy Systems supply crop residues under multi-year agreements. Fuel preparation links to refuse-derived material processing, and the winners are the groups that secure close and steady sources of dry waste.
Companies profiled and their roles in this market
| Company | Type | Role in the market |
|---|---|---|
| Geoclean (Ambuja Cements and ACC) | Cement group waste arm | Marwar and Jamul facilities opened in March 2024; 25% TSR goal by 2027-28 |
| UltraTech Cement | Cement producer | 2.57 million metric tons of waste used as fuel in kilns and captive power plants in FY26; 6.6% kiln TSR |
| Dalmia Bharat | Cement producer | RDF deals with Bengaluru, Bhubaneswar and Tiruchi civic bodies |
| JK Cement | Cement producer | Agreement to remove 50,000 metric tons a year of RDF from Delhi dump sites |
| Zuari Cement (Heidelberg Materials) | Cement producer | RDF line of 20 metric tons an hour at Yerraguntla, Andhra Pradesh |
| Punjab Renewable Energy Systems | Biomass aggregator | Agri-residue supply agreements with UltraTech and JSW Cement |
Owned supply chains will decide who reaches 20% TSR
Credence Research's view is that owned supply chains will decide which producers reach the NITI Aayog substitution goal as the market grows from USD 320.0 million through 2035. The rules now set a rising RDF floor for every plant, but city waste is still wet and far from many kilns. Producers that combine local industrial waste, biomass contracts and city RDF deals will cut freight and quality risk. Plants that pair fuel switching with low-clinker blends gain the most on emissions. RDF grows fastest at 12.00% a year, so municipal offtake becomes the core supply route by 2035.
How the kiln fuel value model was built
The report uses 2025 as the base year and forecasts to 2035. Market values come from the Credence Research model, built from national cement output, clinker ratio, kiln heat demand, reported thermal substitution rates and delivered prices for each fuel. Regional, fuel and supplier splits are Credence Research estimates built from these public inputs. Inputs include MoSPI environment statistics, government rules and state notices, company sustainability reports, industry association statements and trade press coverage. The report did not conduct interviews or surveys, and it relies only on published sources.
Mandated RDF and biomass carry demand to 2035
Through 2035 the market grows at an 11.00% CAGR to reach USD 920.9 million, as mandated RDF shares, net-zero targets and new clinker capacity raise the amount of waste and biomass that kilns burn. West India keeps the lead on its industrial waste base, while Central and Northeast India grow fastest as new plants come online. Municipal RDF will take a larger share as segregation under the 2026 rules improves feedstock, even as city waste-to-energy plants bid for the same dry waste. Producers with pre-processing platforms and close supply contracts should capture most of the added value.
Frequently Asked Questions
How big is the India cement kiln alternative fuel market?
Which region leads the market?
Which fuel holds the largest share?
Which fuel grows fastest?
What is the current thermal substitution rate?
Which companies are active in the market?
What are the main challenges?
How do the 2026 waste rules affect cement plants?
Table of Content
Chapter 1 Market Segmentation
- 1.1 Segmentation Framework
- 1.1.1 Product and Service Classification
- 1.1.2 Application and End-Use Classification
- 1.1.3 Technology and Solution Classification
- 1.1.4 Customer and Distribution Channel Classification
- 1.1.5 Geographic Segmentation
- 1.1.6 Market Segment Definitions and Boundaries
- 1.2 By Fuel
- 1.2.1 Industrial Waste
- 1.2.2 RDF
- 1.2.3 Biomass
- 1.2.4 Tyres
- 1.3 By Supplier
- 1.3.1 Industrial
- 1.3.2 Municipal
- 1.4 By Producer
- 1.4.1 Large Cement Groups
- 1.4.2 Mid-size & Regional Producers
Chapter 2 Introduction
- 2.1 Report Objectives and Scope
- 2.2 Product Definition and Industry Terminology
- 2.3 Market Inclusions and Exclusions
- 2.4 Research Process
- 2.4.1 Primary Research and Expert Interviews
- 2.4.2 Secondary Research and Source Review
- 2.4.3 Top-Down and Bottom-Up Estimation
- 2.4.4 Data Triangulation and Verification
- 2.5 Market Size Measurement Basis
- 2.5.1 2025: USD 320.0 million → 2035: USD 920.9 million
- 2.6 Historical and Forecast Reference Periods
- 2.6.1 Historical Period: 2018-2025
- 2.6.2 Base Year: 2025
- 2.6.3 Forecast Period: 2025-2035
- 2.7 Research Assumptions and Limitations
Chapter 3 Executive Summary
- 3.1 Market Snapshot and Key Findings
- 3.2 Base-Year Market Size, 2025
- 3.3 Forecast Market Size, 2035
- 3.4 Revenue and Volume Growth Outlook
- 3.5 Key Demand and Supply Indicators
- 3.6 Leading Market Segments
- 3.7 Fastest-Growing Market Opportunities
- 3.8 Regional Performance Highlights
- 3.9 Technology and Industry Transformation
- 3.10 Competitive Landscape Summary
- 3.11 Analyst View and Strategic Implications
Chapter 4 India Cement Kiln Alternative Fuel Market Trends and Developments
- 4.1 Historical Industry Development, 2018-2025
- 4.2 Recent Market Trends and Developments
- 4.3 Demand and Customer Behavior Trends
- 4.4 Technology and Product Innovation
- 4.5 Artificial Intelligence, Automation and Digitalization
- 4.6 Local Manufacturing and Supply Chain Realignment
- 4.7 Industry Partnerships, Mergers and Acquisitions
- 4.8 Sustainability and Circular Economy Developments
- 4.9 Government and Private Sector Investment Trends
- 4.10 Emerging Business Models and Commercialization
- 4.11 Industry Developments and Announcements
Chapter 5 India Cement Kiln Alternative Fuel Market Production, Supply and Demand Analysis
- 5.1 Demand Trend and Consumption Analysis, 2018-2025
- 5.2 Demand Forecast, 2025-2035
- 5.3 Production and Output Trend, 2018-2025
- 5.4 Production and Output Forecast, 2025-2035
- 5.5 Installed Capacity and Capacity Utilization
- 5.6 Company-Wise Production Plants and Statistics
- 5.6.1 Installed Production Capacity
- 5.6.2 Actual Production
- 5.6.3 Planned Capacity and Expansion Targets
- 5.7 Supply Chain Structure and Procurement Trends
- 5.8 Supply-Demand Gap and Bottlenecks
- 5.9 Import Dependence and Sourcing Structure
- 5.10 Contract Manufacturing and Outsourcing
- 5.11 Regional Supply and Demand Concentration
Chapter 6 India Cement Kiln Alternative Fuel Market Pricing Analysis
- 6.1 Pricing Structure and Measurement
- 6.2 Historical Pricing Trends, 2018-2025
- 6.3 Pricing Outlook, 2025-2035
- 6.4 Average Selling Price and Unit Economics
- 6.5 Pricing by Product and Market Segment
- 6.6 Geographic Pricing Differences
- 6.7 Key Input, Energy, Labor and Logistics Costs
- 6.8 Contract Pricing and Purchasing Models
- 6.9 Pricing Sensitivity and Competitive Positioning
- 6.10 Price, Margin and Profitability Implications
Chapter 7 India Cement Kiln Alternative Fuel Market Dynamics
- 7.1 Market Growth Drivers
- 7.1.1 Demand-Side Drivers
- 7.1.2 Technology and Innovation Drivers
- 7.1.3 Infrastructure and Investment Drivers
- 7.1.4 Regulatory and Policy Drivers
- 7.2 Market Restraints
- 7.2.1 Cost and Affordability Constraints
- 7.2.2 Technology and Adoption Barriers
- 7.2.3 Supply Chain and Operational Constraints
- 7.3 Market Challenges
- 7.3.1 Competitive Pressure and Margin Erosion
- 7.3.2 Skills, Infrastructure and Implementation Gaps
- 7.4 Emerging Market Opportunities
- 7.5 Market Dynamics Impact and Time-Horizon Assessment
Chapter 8 India Cement Kiln Alternative Fuel Value Chain Analysis
- 8.1 Industry Value Chain Overview
- 8.2 Upstream Suppliers and Critical Inputs
- 8.3 Technology and Component Providers
- 8.4 Manufacturing or Service Delivery
- 8.5 Distribution, Channel Partners and Integrators
- 8.6 Downstream Applications and End Users
- 8.7 Value Addition and Profit Pools
- 8.8 Vertical Integration and Outsourcing
- 8.9 Supplier Concentration and Risk
- 8.10 Supply Chain Localization and Resilience
Chapter 9 India Cement Kiln Alternative Fuel Market Regulations and Policies
- 9.1 Relevant Laws, Standards and Compliance Frameworks
- 9.2 Product, Service, Safety and Quality Requirements
- 9.3 Government Policies, Incentives and Subsidies
- 9.4 Imports, Exports and Trade Barriers
- 9.5 Public Procurement and Local Content Requirements
- 9.6 Environmental and Sustainability Compliance
- 9.7 Upcoming Policy Changes and Market Implications
Chapter 10 India Cement Kiln Alternative Fuel Market Hotspots and Opportunities
- 10.1 Market Opportunity Mapping and Growth Hotspots
- 10.2 High-Growth Applications and Customer Groups
- 10.3 Underserved Markets and White-Space Opportunities
- 10.4 Emerging Technology and Product Opportunities
- 10.5 New Capacity and Investment Hotspots
- 10.6 Market Entry and Expansion Opportunities
- 10.7 Distribution and Partnership Opportunities
- 10.8 Near-Term and Long-Term Commercial Potential
- 10.9 Opportunity Attractiveness and Execution Risks
Chapter 11 India Cement Kiln Alternative Fuel Market Outlook, 2025-2035
- 11.1 Market Size and Analysis
- 11.1.1 Revenue (Market Measurement: 2025: USD 320.0 million → 2035: USD 920.9 million)
- 11.1.2 Market Volume and Quantity Sold
- 11.1.3 Historical Market Size, 2018-2025
- 11.1.4 Base-Year Market Size, 2025
- 11.2 Market Forecast, 2025-2035
- 11.2.1 Revenue Forecast to 2035
- 11.2.2 Volume Forecast to 2035
- 11.2.3 CAGR and Year-on-Year Growth
- 11.2.4 Incremental Revenue Opportunity
- 11.3 Forecast Assumptions and Scenario Analysis
- 11.3.1 Base-Case Forecast
- 11.3.2 Optimistic and Conservative Scenarios
- 11.3.3 Technology, Pricing and Policy Sensitivities
- 11.4 Market Attractiveness and Growth Outlook
Chapter 12 India Cement Kiln Alternative Fuel Market Segmentation and Outlook
- 12.1 Segmentation Summary and Market Shares, 2025
- 12.2 Largest and Fastest-Growing Segments
- 12.3 By Fuel - Market Size and Forecast, 2025-2035
- 12.3.1 Segment Definition and Scope
- 12.3.2 Historical Market Size, 2018-2025
- 12.3.3 Revenue Forecast, 2025-2035
- 12.3.4 Volume Forecast, 2025-2035
- 12.3.5 Base-Year Market Share, 2025
- 12.3.6 Segment CAGR and Growth Drivers
- 12.3.7 Subsegment Market Size and Forecast
- 12.3.7.1 Industrial Waste
- 12.3.7.2 RDF
- 12.3.7.3 Biomass
- 12.3.7.4 Tyres
- 12.3.8 Subsegment Pricing and Adoption Trends
- 12.3.9 Leading Suppliers and Competition
- 12.3.10 Regional Demand and Opportunities
- 12.4 By Supplier - Market Size and Forecast, 2025-2035
- 12.4.1 Segment Definition and Scope
- 12.4.2 Historical Market Size, 2018-2025
- 12.4.3 Revenue Forecast, 2025-2035
- 12.4.4 Volume Forecast, 2025-2035
- 12.4.5 Base-Year Market Share, 2025
- 12.4.6 Segment CAGR and Growth Drivers
- 12.4.7 Subsegment Market Size and Forecast
- 12.4.7.1 Industrial
- 12.4.7.2 Municipal
- 12.4.8 Subsegment Pricing and Adoption Trends
- 12.4.9 Leading Suppliers and Competition
- 12.4.10 Regional Demand and Opportunities
- 12.5 By Producer - Market Size and Forecast, 2025-2035
- 12.5.1 Segment Definition and Scope
- 12.5.2 Historical Market Size, 2018-2025
- 12.5.3 Revenue Forecast, 2025-2035
- 12.5.4 Volume Forecast, 2025-2035
- 12.5.5 Base-Year Market Share, 2025
- 12.5.6 Segment CAGR and Growth Drivers
- 12.5.7 Subsegment Market Size and Forecast
- 12.5.7.1 Large Cement Groups
- 12.5.7.2 Mid-size & Regional Producers
- 12.5.8 Subsegment Pricing and Adoption Trends
- 12.5.9 Leading Suppliers and Competition
- 12.5.10 Regional Demand and Opportunities
- 12.6 Segment Growth Comparison
- 12.7 Segment Attractiveness and Priority Matrix
Chapter 13 India Cement Kiln Alternative Fuel Geographic Market Outlook, 2025-2035
- 13.1 Domestic Market Distribution and Demand Clusters
- 13.2 State- or Province-Wise Market Size and Forecast, 2025-2035
- 13.3 City and Metropolitan Market Outlook
- 13.4 Industrial, Manufacturing and Commercial Clusters
- 13.5 Geographic Concentration of Key End Users
- 13.6 Local Pricing and Purchasing Differences
- 13.7 Domestic Production Facilities and Capacity Map
- 13.8 Local Infrastructure and Project Pipeline
- 13.9 State-Level Policy and Incentive Differences
- 13.10 Subnational Investment Hotspots and Opportunities
- 13.11 Distribution and Logistics Networks
- 13.12 Domestic Competitive Footprint
Chapter 14 India Cement Kiln Alternative Fuel Technology, Innovation and Sustainability Outlook
- 14.1 Technology Landscape and Maturity
- 14.2 Product, Process and Service Innovation
- 14.3 AI, Automation and Digital Tools in the Industry
- 14.4 Technology Adoption and Performance Benchmarking
- 14.5 Innovation Pipeline and R&D Investment
- 14.6 Patent and Intellectual Property Trends
- 14.7 Energy Efficiency and Resource Management
- 14.8 Sustainability, Recycling and Circularity
- 14.9 Technology Roadmap, 2025-2035
- 14.10 Risks of Obsolescence and Technology Substitution
Chapter 15 India Cement Kiln Alternative Fuel Market Key Strategic Imperatives
- 15.1 Growth and Market Entry Priorities
- 15.2 High-Return Products and Segments
- 15.3 Pricing, Profitability and Cost Optimization
- 15.4 Technology Investment and Product Differentiation
- 15.5 Supply Chain Localization and Resilience
- 15.6 Distribution and Customer Acquisition
- 15.7 Partnership, Acquisition and Capacity Strategy
- 15.8 Regional Expansion Priorities
- 15.9 Short-, Medium- and Long-Term Actions
Chapter 16 Competition Outlook
- 16.1 Industry Competition Characteristics
- 16.2 Market Structure and Concentration
- 16.3 Market Share and Competitive Positioning, 2025
- 16.4 Company-Wise Revenue and Product Benchmarking
- 16.5 Production and Service Capacity Benchmarking
- 16.6 Technology, Pricing and Differentiation
- 16.7 Regional Footprint and Distribution Strength
- 16.8 Mergers, Acquisitions and Strategic Alliances
- 16.9 New Entrants and Competitive Threats
- 16.10 Porter's Five Forces and Industry Attractiveness
- 16.11 Competitive Outlook, 2025-2035
Chapter 17 Company Profiles
- 17.1 Company Coverage and Selection Criteria
- 17.2 Geoclean (Ambuja Cements and ACC)
- 17.2.1 Business Description
- 17.2.2 Company Ownership and Geographic Presence
- 17.2.3 Product and Service Portfolio
- 17.2.4 Manufacturing and Operating Footprint
- 17.2.5 Production Capacity and Expansion Plans
- 17.2.6 Financial Performance and Investment
- 17.2.7 Market Share and Competitive Position
- 17.2.8 Technology and Innovation Capabilities
- 17.2.9 Strategic Alliances or Partnerships
- 17.2.10 Recent Developments
- 17.2.11 Growth Strategy and Outlook
- 17.3 UltraTech Cement
- 17.4 Dalmia Bharat
- 17.5 JK Cement
- 17.6 Zuari Cement (Heidelberg Materials)
- 17.7 Punjab Renewable Energy Systems
- 17.8 Other Relevant Market Participants
Note: Every listed company is profiled on the structure shown under the first company. The company list is preliminary and may change based on research findings, market developments, data availability and client requirements.
Chapter 18 Disclaimer
- 18.1 Research and Forecast Disclaimer
- 18.2 Data Source and Estimation Limitations
Note: The depth of individual sections depends on data availability for this market. Volume, capacity, trade and other unit-based metrics are included where applicable.

