Land cost and EV readiness turn garages into machines
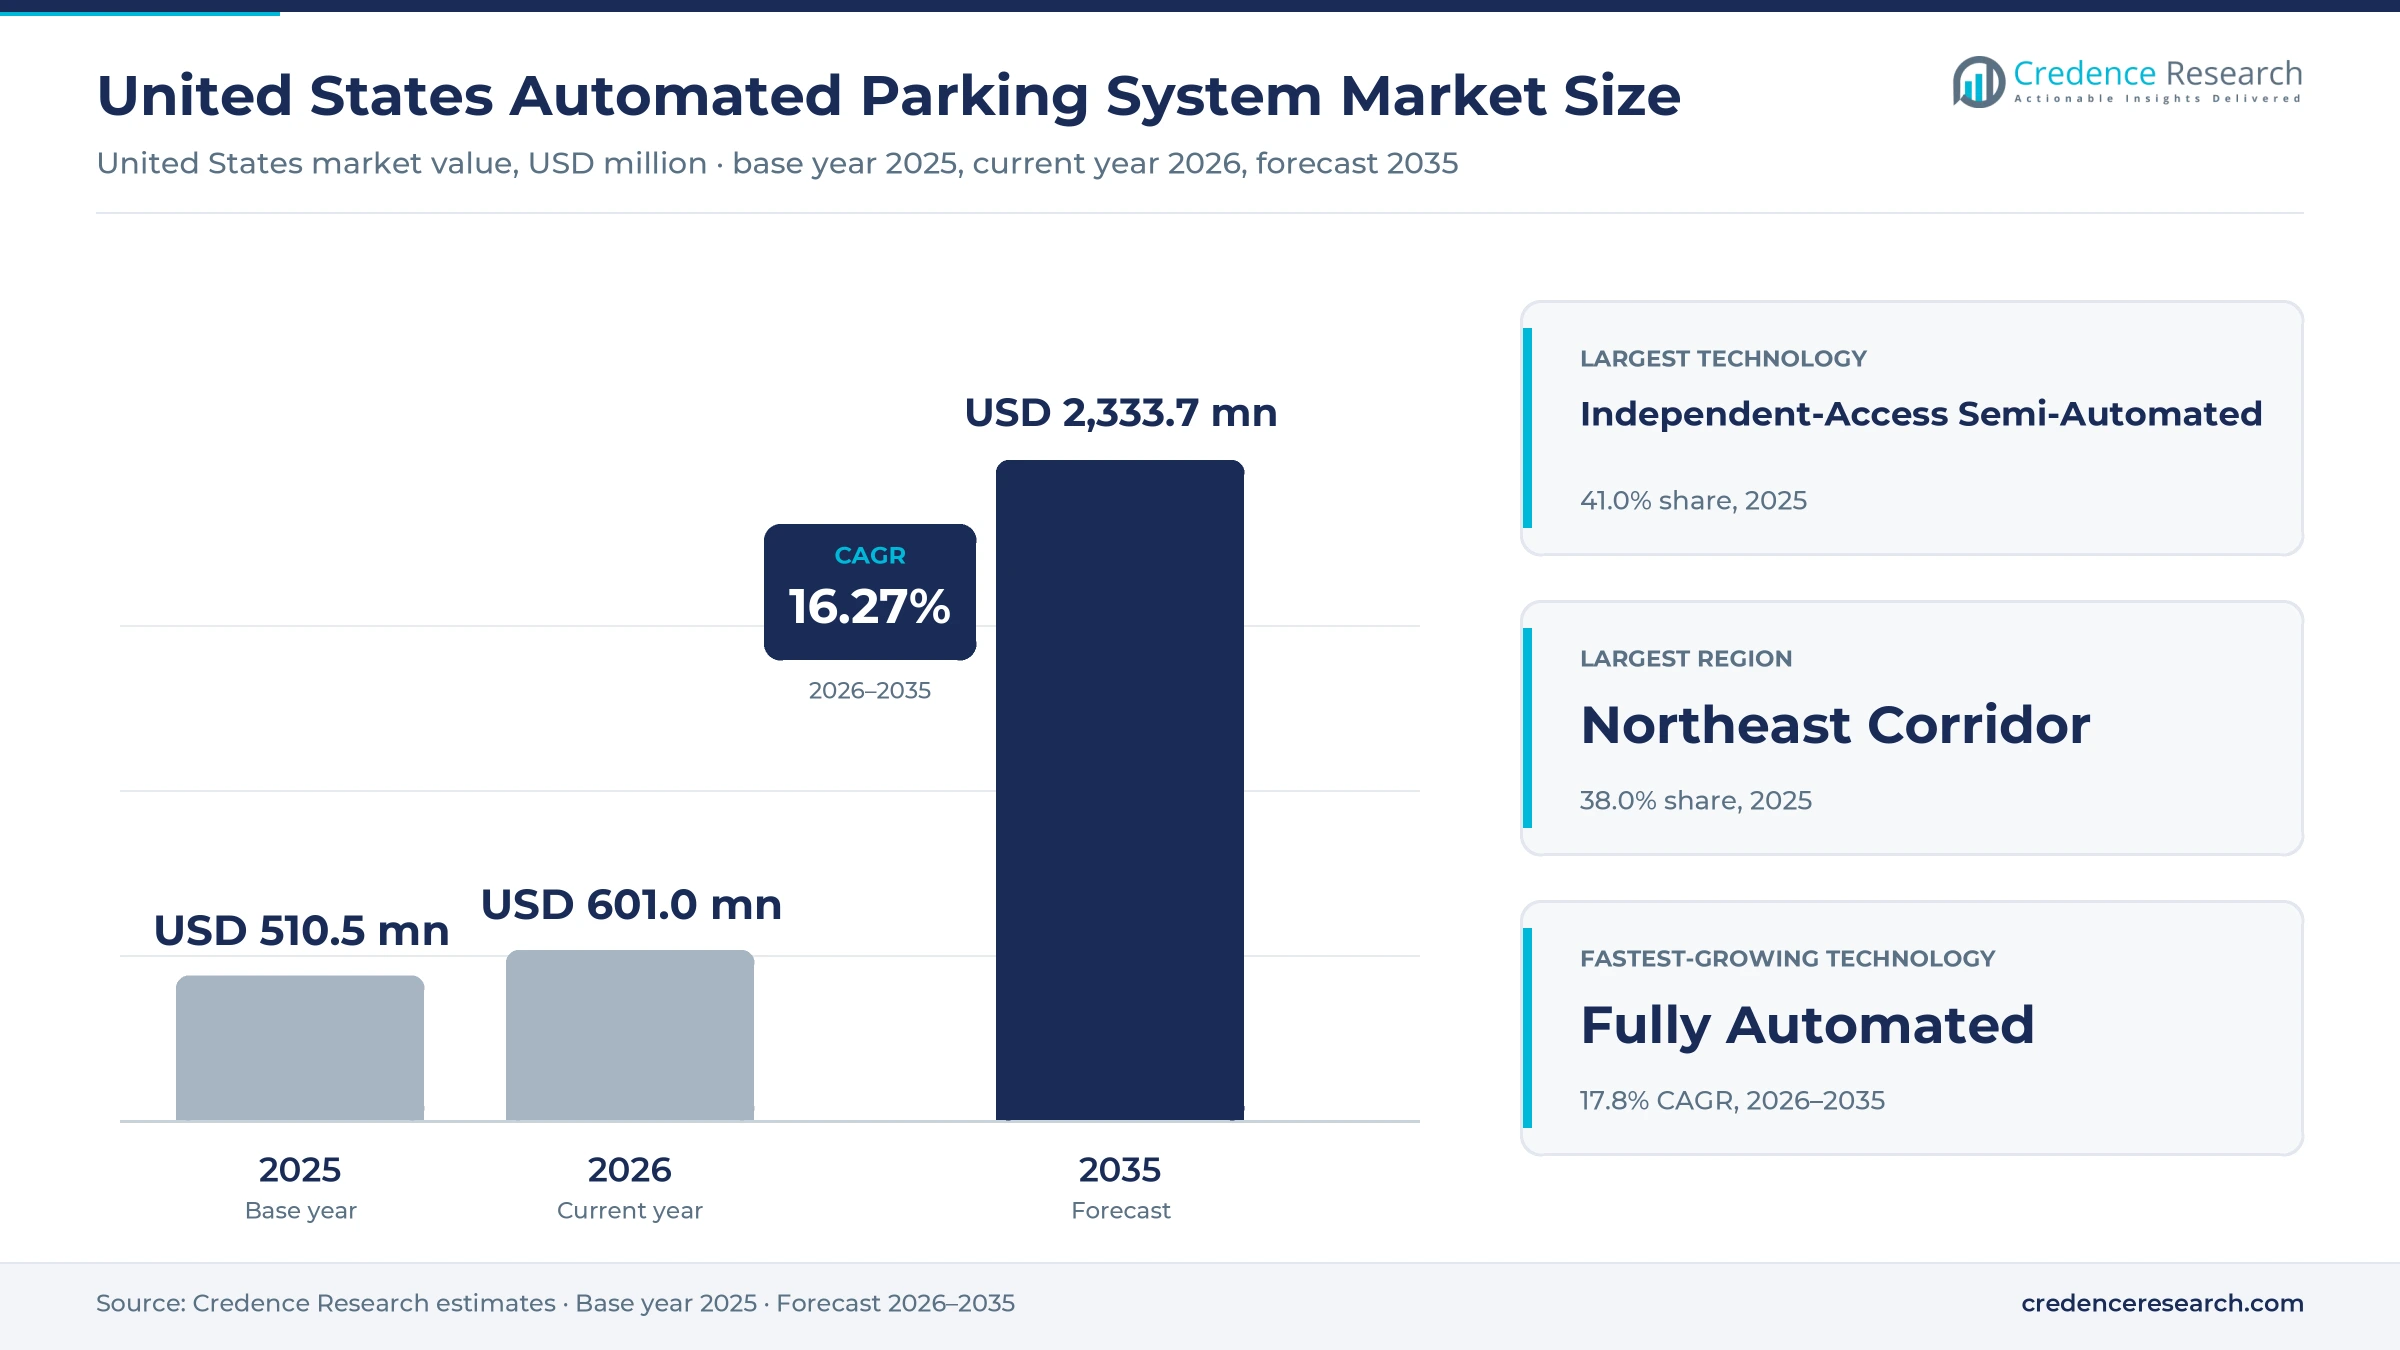
The United States automated parking system market was valued at USD 510.5 million in 2025 and is projected to increase from USD 601.0 million in 2026 to USD 2.33 billion by 2035, registering a CAGR of 16.27% during 2026–2035. Demand comes from developers of condominium and rental towers, mixed-use districts, hospitals and city garages that need to fit more cars on less land, or to free floor area for homes and shops. The Northeast Corridor held the largest regional share, 38.0% in 2025, because New York, New Jersey and Philadelphia combine the highest land values with the longest record of mechanized garages. The South Atlantic and Southeast is the fastest-growing region at 17.5% a year, as Miami towers and Raleigh districts plan robotic garages from the start. On the supply side, suppliers now sell the garage as an EV charging asset, moving cars to chargers instead of wiring every stall.
Which equipment, software and services the U.S. figures include
The market covers mechanized and robotic systems that store and retrieve cars in U.S. buildings, from two-level dependent stackers to puzzle systems and fully automated garages with lifts, shuttles or mobile robots. Values include hardware, control software and apps, installation and the maintenance and modernization contracts billed to owners.
The concrete or steel shell of the building, conventional ramp garages, parking guidance and payment systems sold on their own, and charging hardware bought separately are excluded. The value chain runs from steel and drive suppliers to system makers, integrators, installers and the service crews that keep systems running for decades.
United States Automated Parking System Market Insights
- The automated parking system market grows from USD 510.5 million in 2025 to USD 2.33 billion by 2035 at a 16.27% CAGR, as dense cities trade ramps for sellable floor area.
- The Northeast Corridor held 38.0% of 2025 value, the deepest base of puzzle, stacker and robotic garages in New York, New Jersey and Philadelphia.
- Independent-access semi-automated systems led technology with 41.0% of 2025 value, while fully automated garages grow fastest at 17.8% a year.
- Lödige Industries started a garage in Philadelphia in February 2025 in which every space can charge an electric vehicle, a first for the United States.
- AUTOParkit began building a 228-space robotic garage in Raleigh in May 2026, designed for EV charging at every stall and for driverless vehicles.
Puzzle systems lead while robotic garages gain fastest
Why puzzle systems lead and robotic garages grow fastest
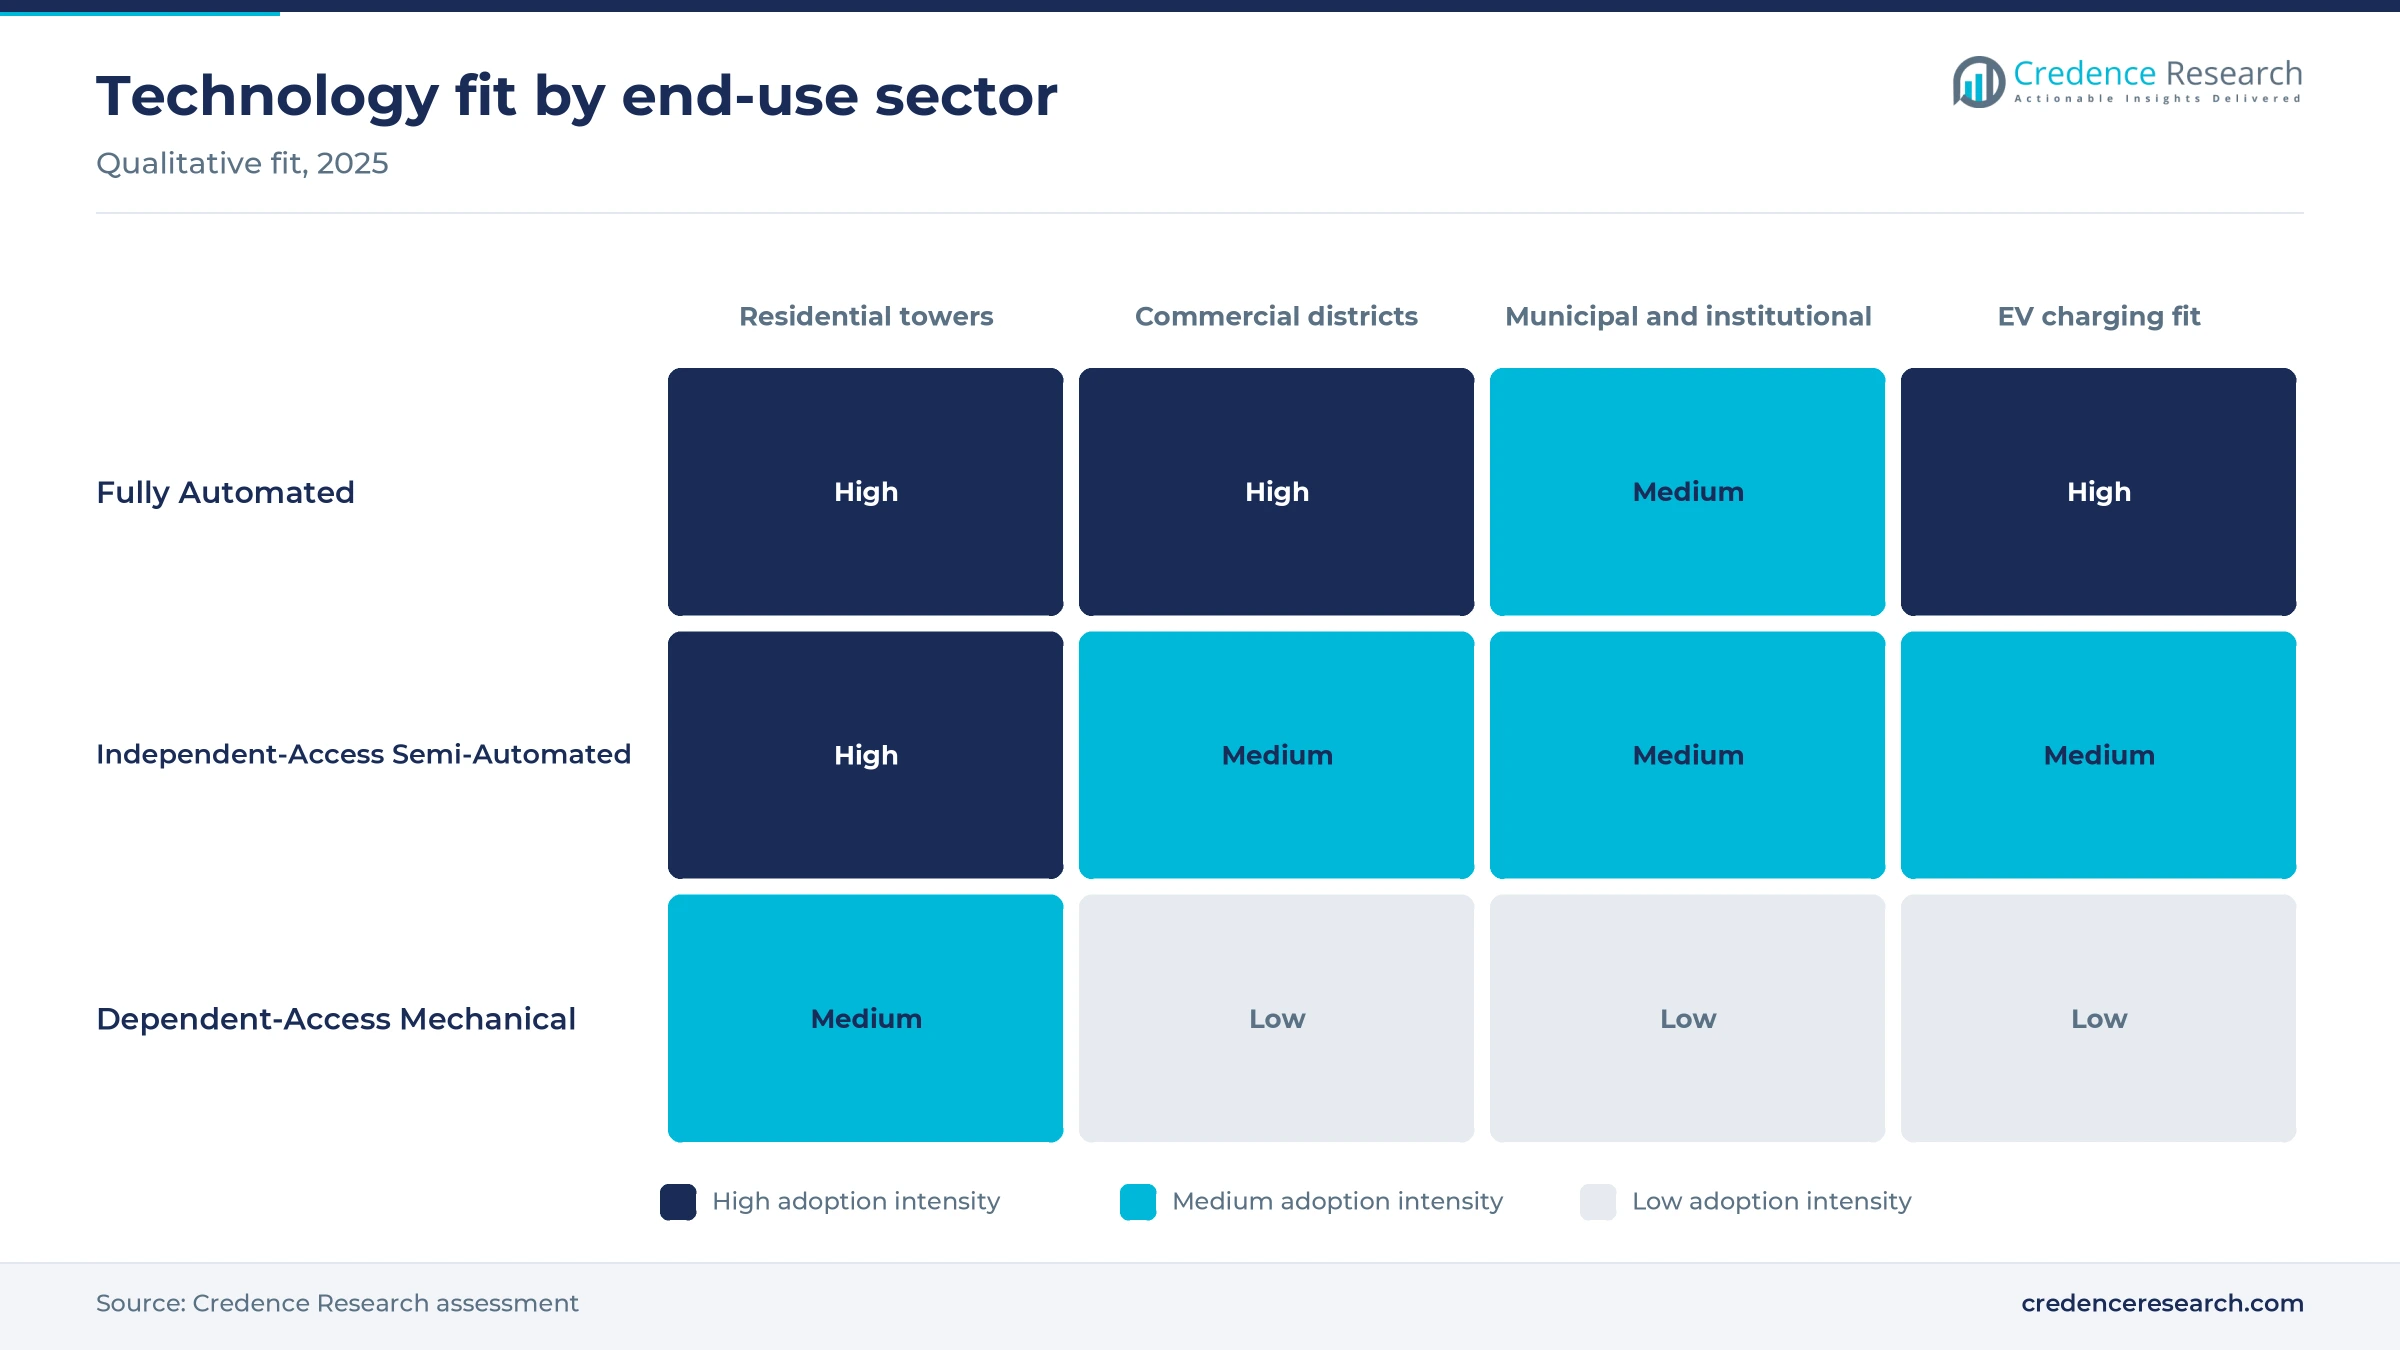
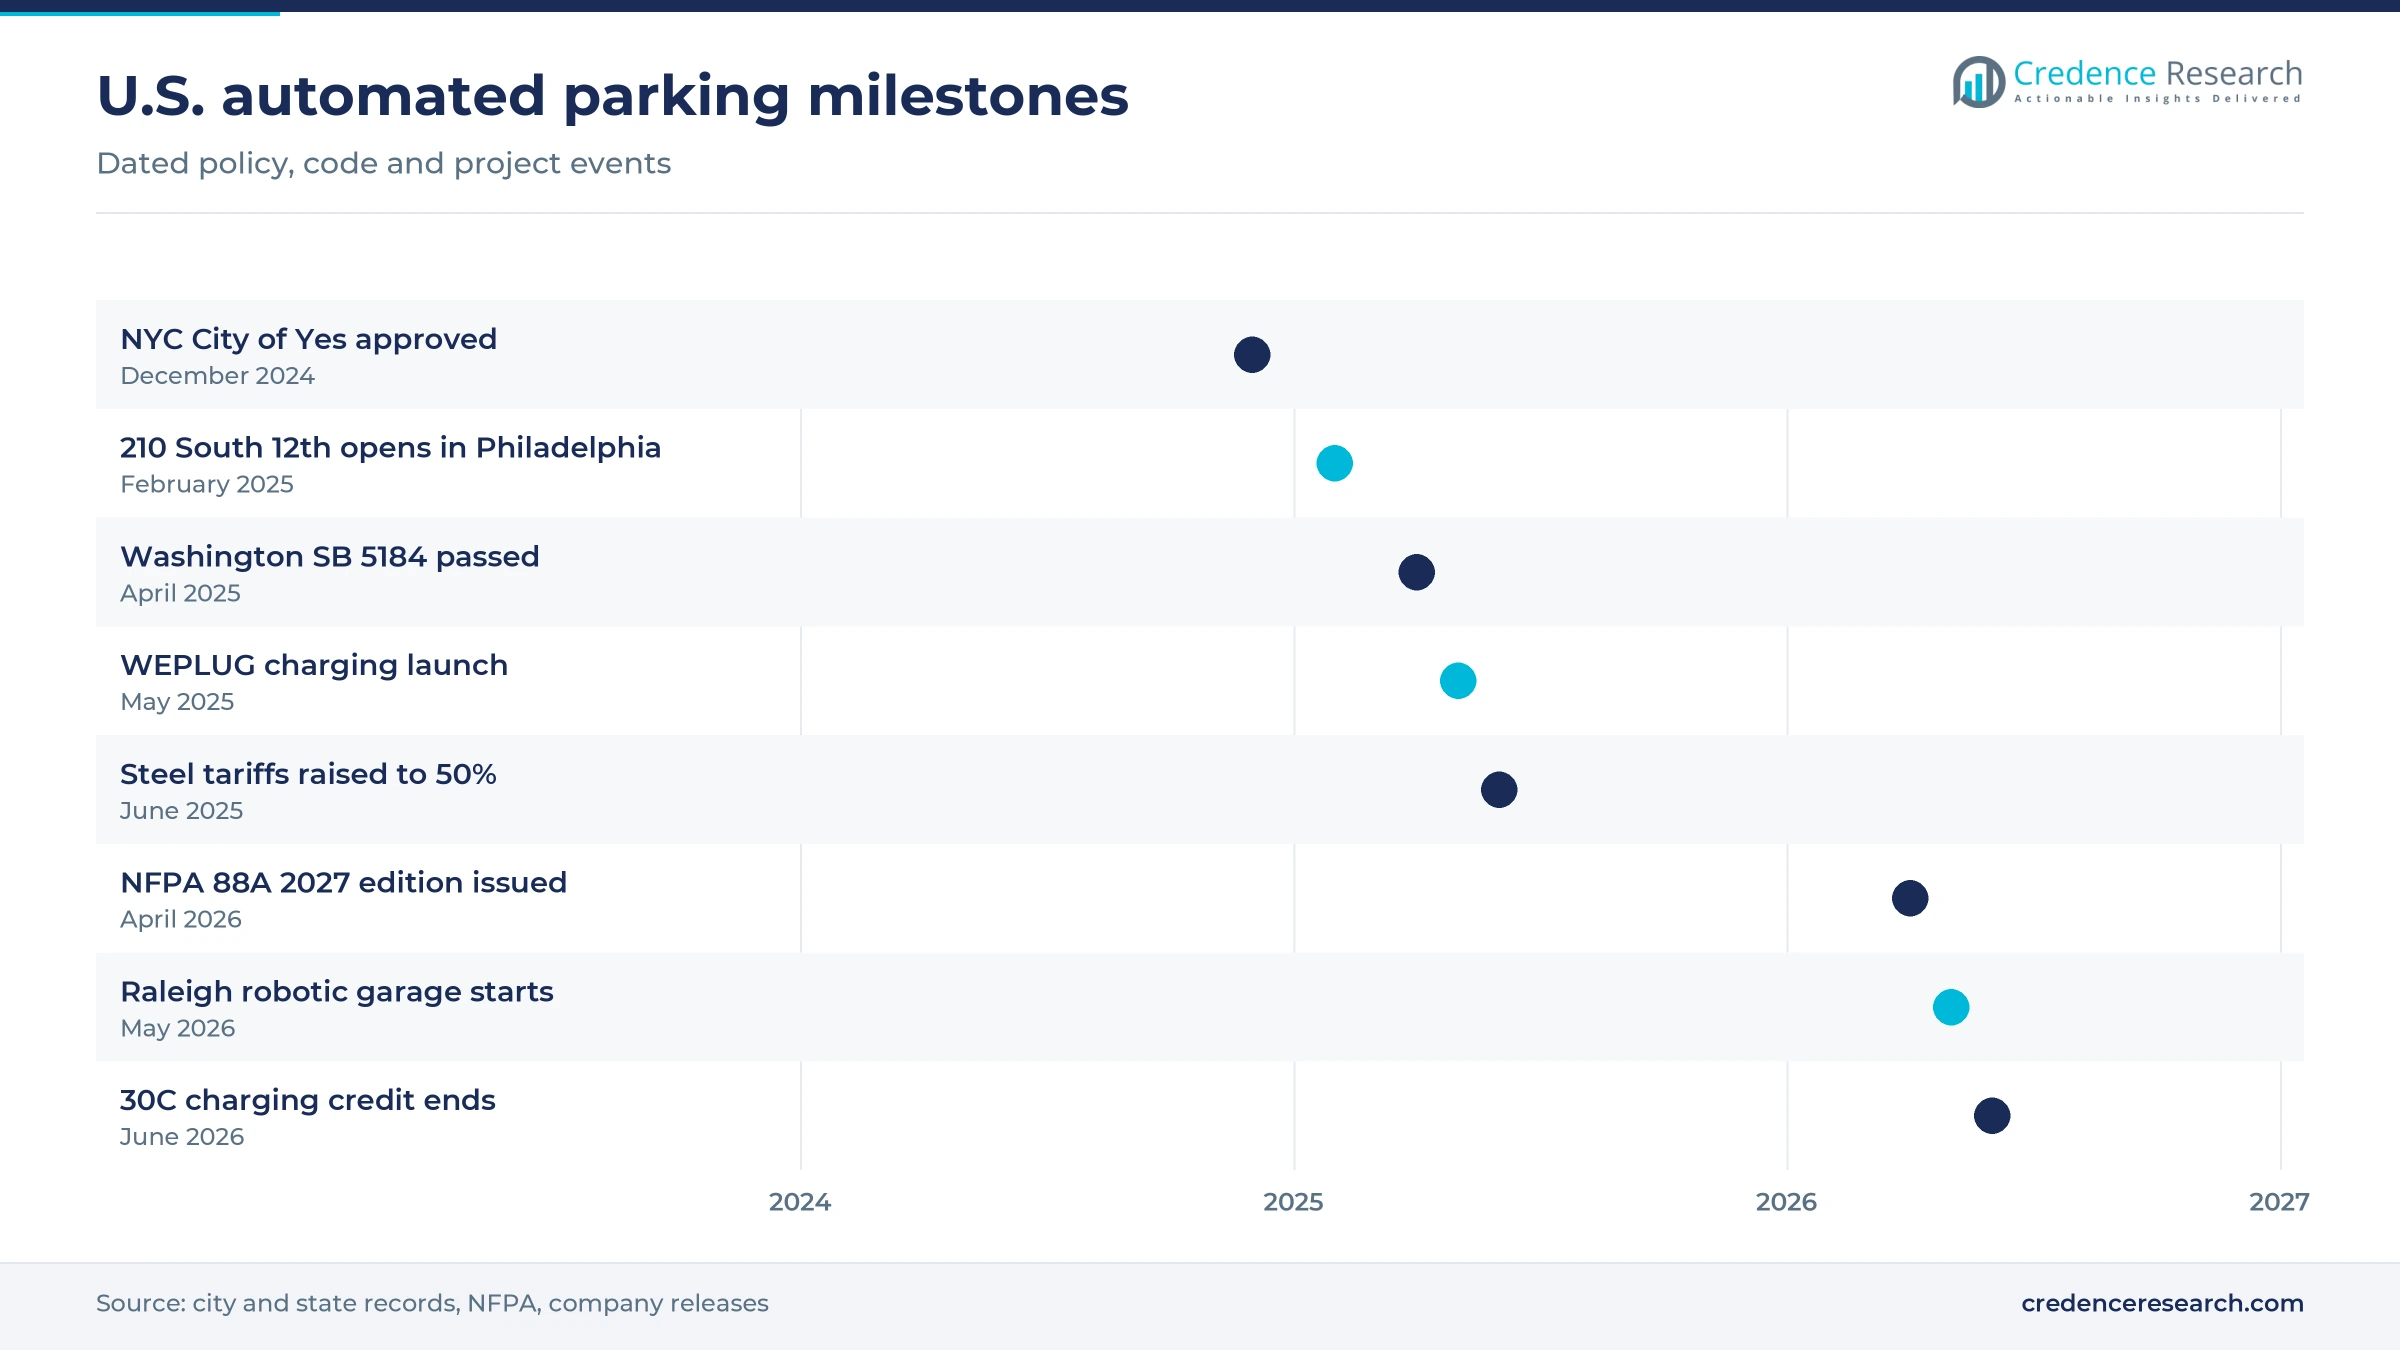
Based on technology, the market is categorized into fully automated, independent-access semi-automated and dependent-access mechanical systems. Independent-Access Semi-Automated systems led with 41.0% of 2025 value because they cost $20,000 to $40,000 per space against $65,000 to $100,000 for fully automated garages, according to Multi-Housing News, which suits mid-rise rentals. Fully Automated garages grow fastest at 17.8% a year, as projects such as the 210 South 12th tower in Philadelphia, opened in February 2025, show that robotic garages now win high-end towers. The gap in cost per space decides which model a developer chooses.
Hardware dominates value while software grows fastest
Based on component, the market is categorized into hardware, software, installation services and maintenance. Hardware led with 58.0% of 2025 value because each system carries steel racks, pallets, lifts and drives, so the higher Section 232 steel tariff in force since June 4, 2025, discussed under challenges, feeds directly into quotes. Software grows fastest at 19.2% a year, as Westfalia now runs its Savanna.NET control platform on Siemens SIMATIC S7-1500 controllers and apps let drivers order cars by phone, much like garage management software. That software layer ties each automated parking system owner to one supplier for years.
Residential towers lead while commercial districts gain
Based on end-use sector, the market is categorized into commercial, residential and municipal and institutional buyers. Residential buildings led with 47.0% of 2025 value because condominium towers pay for parking that buyers expect, and Brickell House in Miami contracted ParkPlus in June 2021 for a 411-space replacement robotic garage with 80 charging spaces. Commercial projects grow fastest at 16.9% a year, as AUTOParkit began building a shared robotic garage for Raleigh's City Gateway district in May 2026. District garages serve several buildings and future fleets at once.
New towers lead and modernization grows fastest
Based on project type, the market is categorized into new-build installations, modernization and capacity expansion. New-Build Installations led with 72.0% of 2025 value because systems are designed into the structure, and multifamily starts reached 402,000 at an annual rate in December 2025, their 2025 high, according to Multifamily Dive. Modernization grows fastest at 18.2% a year, as Lödige says the garages it and 5BY2 built, close to 3,000 spaces, all remain under its maintenance. Aging controls in that installed base create steady upgrade work.
| Segment Group | Leading Sub-segment | Share, 2025 | Fastest-growing Sub-segment | CAGR, 2026–2035 |
|---|---|---|---|---|
| By Technology | Independent-Access Semi-Automated | 41.0% | Fully Automated | 17.8% |
| By Component | Hardware | 58.0% | Software | 19.2% |
| By End-Use Sector | Residential | 47.0% | Commercial | 16.9% |
| By Project Type | New-Build Installations | 72.0% | Modernization | 18.2% |
Robotic stalls cost more but undercut deep basements
Pricing works per space, with the supplier quoting equipment, controls and installation as one package and the owner signing a separate service contract for the life of the system. The price that matters is the cost of the conventional garage it replaces, so robotic systems win most often where excavation is deep, sites are narrow or every saved floor becomes sellable area. Steel content, sprinkler design, charging fit-out and retrieval speed move the quote most. Developers who compare cost per space only against surface lots rarely buy, while those comparing against a third basement level often find the robotic option cheaper per usable stall.
| System or benchmark | Typical price or fee | Basis |
|---|---|---|
| Fully automated garage | USD 65,000 to 100,000 per space | Multi-Housing News estimate |
| Semi-automated puzzle system | USD 20,000 to 40,000 per space | Multi-Housing News estimate |
| Conventional underground garage | About USD 73,000 per space, average of 17 cities | UCLA Institute of Transportation Studies, February 2026 |
| Conventional above-ground structure | USD 33,300 median per space, 2026 | WGI Parking Structure Cost Outlook, September 2026 |
Request a Free Sample
Fill in your details and we'll send you a free sample report.
- Sample data tables & charts
- Research methodology
Costly land, EV charging and service revenue lift orders
Land-efficient development pays for the machinery
Land-efficient development is the core reason U.S. developers buy these systems, because every floor saved from ramps can be sold or rented. The UCLA Institute of Transportation Studies found that underground parking costs about $73,000 per space across 17 cities, rising to $111,000 in Portland, Oregon, before land is counted. Lödige says its systems can cut the area needed for parking by up to 60%. Even above ground, the same study put the average at about $52,000 per space, and $99,000 in Portland, so each stall a machine saves is worth more than most buyers assume. Developers in the costliest cores therefore treat the garage as a way to recover floor area rather than as an amenity.
Electric vehicle charging integration moves into the garage
Electric vehicle charging integration is turning the robotic garage from a space saver into a charging asset, because the system can move cars to chargers instead of wiring every stall. Lödige said in February 2025 that 210 South 12th in Philadelphia was the first U.S. system with charging capability on all of its spaces. In May 2025, Westfalia launched WEPLUG, a 50 kW DC fast charger on an overhead gantry, which the company says serves several cars from one utility connection. In Seattle, Parkworks added robotic charging to the Spire tower that can fully charge up to 192 vehicles in 24 hours, GeekWire reported in 2024. Owners gain charging capacity without rebuilding electrical service for every space.
Established channels and software-led lifecycle value
Established channels and software-led lifecycle value keep revenue flowing long after a garage opens, because owners rarely switch suppliers once controls and spare parts are tied to one platform. ParkPlus told Multi-Housing News that it holds 40% to 50% of the U.S. market, with hundreds of projects including nearly 30 fully automated systems. Lödige has worked in the United States since 1985 from Long Island City, New York and offers 24/7 remote monitoring from a control center. Westfalia runs a service hotline and preventive maintenance programs from York, Pennsylvania. Recurring service, software updates and upgrades turn each automated parking system into an annuity, and they reward suppliers with deep local crews.
Fleet-ready district garages attract new financing
Garages designed for driverless fleets and district use are opening a new type of project that lenders are willing to fund. In Raleigh, Capital City Urban Development began building a 228-space robotic garage at City Gateway in May 2026, with completion scheduled for late 2026. North Carolina Construction News reported that the $52 million project combines a $13.5 million C-PACE loan, a $28 million loan and $10.5 million of private equity, and that every stall carries universal EV charging. Its developers say the garage could one day serve as a hub for robotaxi fleets, although no operator has signed, since such fleets need dense, charged storage near demand. Commercial C-PACE finance lowers the cost of capital for such garages.
Mobile robots and stricter fire codes reshape the offer
Shift from fixed shuttles to mobile robots and app retrieval
The technology frontier is shifting from fixed lifts and shuttles toward mobile robots that lift cars and move freely across a floor. Volley Automation will install robotic parking at 38 Gramercy Park East and 550 West 21st Street, two Manhattan condominium towers under construction for Legion Investment Group, and says the systems offer up to twice the capacity of a conventional garage, according to a July 8, 2026 release. At the Lume apartments in Menlo Park, California, a Sotefin system installed by Parkworks holds more than 450 cars and uses a robotic arm to plug in Level 2 chargers. This shift lets architects shape automated parking systems around irregular sites and columns.
Rise of fire codes written for automated garages
Fire codes are rising as a design driver, because the latest standards now treat automated garages as their own building type. The 2023 edition of NFPA 88A requires all new parking structures to be fully sprinklered, open or closed, according to the National Fire Sprinkler Association. A 2027 edition of NFPA 88A is now on sale, and Westfalia, a system supplier, says it is the first edition with prescriptive sprinkler criteria for automated parking, including flue sprinklers at every platform level. Designers therefore have to plan sprinkler piping, water supply and fire service access around the storage racks from the first drawings rather than after layout is fixed. Suppliers with tested designs now win approvals faster than new entrants.
Opportunity in modernizing an aging installed base
The installed base of older mechanized garages is an opening for upgrade contracts, because controls and lifts age faster than the steel structure. Multi-Housing News, citing the National Parking Association, counts about 100 fully automated garages in the country, alongside many older stackers and puzzle systems. A failed car lift in a Bronx garage left about 50 cars stuck for more than five months in 2022, CBS New York reported. Lödige offers modernization that rebuilds controls, cabins and safety sensors, and says such upgrades restore spare parts supply and bring older garages up to current safety standards. Owners familiar with elevator modernization budgets will treat garages the same way.
Opportunity in hospital, campus and city garages
Hospitals, campuses and city garages are an opening on narrow sites where ramps waste space and patients need quick retrieval. ParkPlus opened a 119-space robotic garage across four floors for a hospital complex on Manhattan's east side in December 2018, according to Facility Executive. In Seattle, Wöhr Parking and Harding Steel were chosen for a 160- to 180-car automated garage at the Seattle Cancer Care Alliance, where patients need their cars within about two minutes, Bisnow reported. In December 2012, West Hollywood approved a $16 million city garage for 200 cars on a lot that held 66, WeHo Online reported. Public owners can finance such garages with parking revenue bonds.
Tariffs, parking reform and reliability risks limit uptake
Steel tariffs raise hardware cost per space
Steel-heavy hardware is exposed to trade policy risk, which raises the cost of racks, pallets and lift structures. Section 232 tariffs on steel and aluminum imports doubled to 50% from June 4, 2025, according to Kelley Drye. Suppliers that import German, Swiss or Israeli components face higher landed costs, and developers see quotes rise between design and contract. Local fabrication and fixed-price supply agreements are the main ways suppliers protect margins.
Parking reform cuts the stalls developers must build
Parking reform reduces the number of stalls that zoning forces developers to provide, which removes one reason to buy and limits demand at the low end. Washington's legislature passed SB 5184 in April 2025, capping requirements at 0.5 spaces per new multifamily unit in larger cities. The New York City Council approved City of Yes on Dec. 5, 2024, ending mandates in transit-rich areas. Developers who still want parking for buyers remain the target, but projects built only to meet minimums will shrink.
Reliability failures weigh on buyer confidence
Reliability is a key risk, because a single failure can strand residents and damage the reputation of the whole category. At Brickell House in Miami, residents had been without parking since November 2015 after the original robotic system malfunctioned, and a Miami-Dade judge awarded the condominium association $40.6 million against the developer in August 2019, The Real Deal reported. Lenders and condominium boards now ask for retrieval guarantees, spare parts commitments and local service crews. Suppliers without a long U.S. service record find that requirement hard to meet.
Slower EV adoption softens the charging case
Slower electric vehicle uptake weakens one of the newest selling points for robotic garages. Kelley Blue Book estimates that EVs took 7.8% of new vehicle sales in 2025, down from 8.1% in 2024, after the federal clean vehicle credit ended on Sept. 30, 2025. The 30C credit for charging equipment expires for property placed in service after June 30, 2026, per the Electrification Coalition. Owners may delay charging fit-outs, although public EV charging growth keeps the long-term case intact.
The Northeast Corridor holds the deepest project base
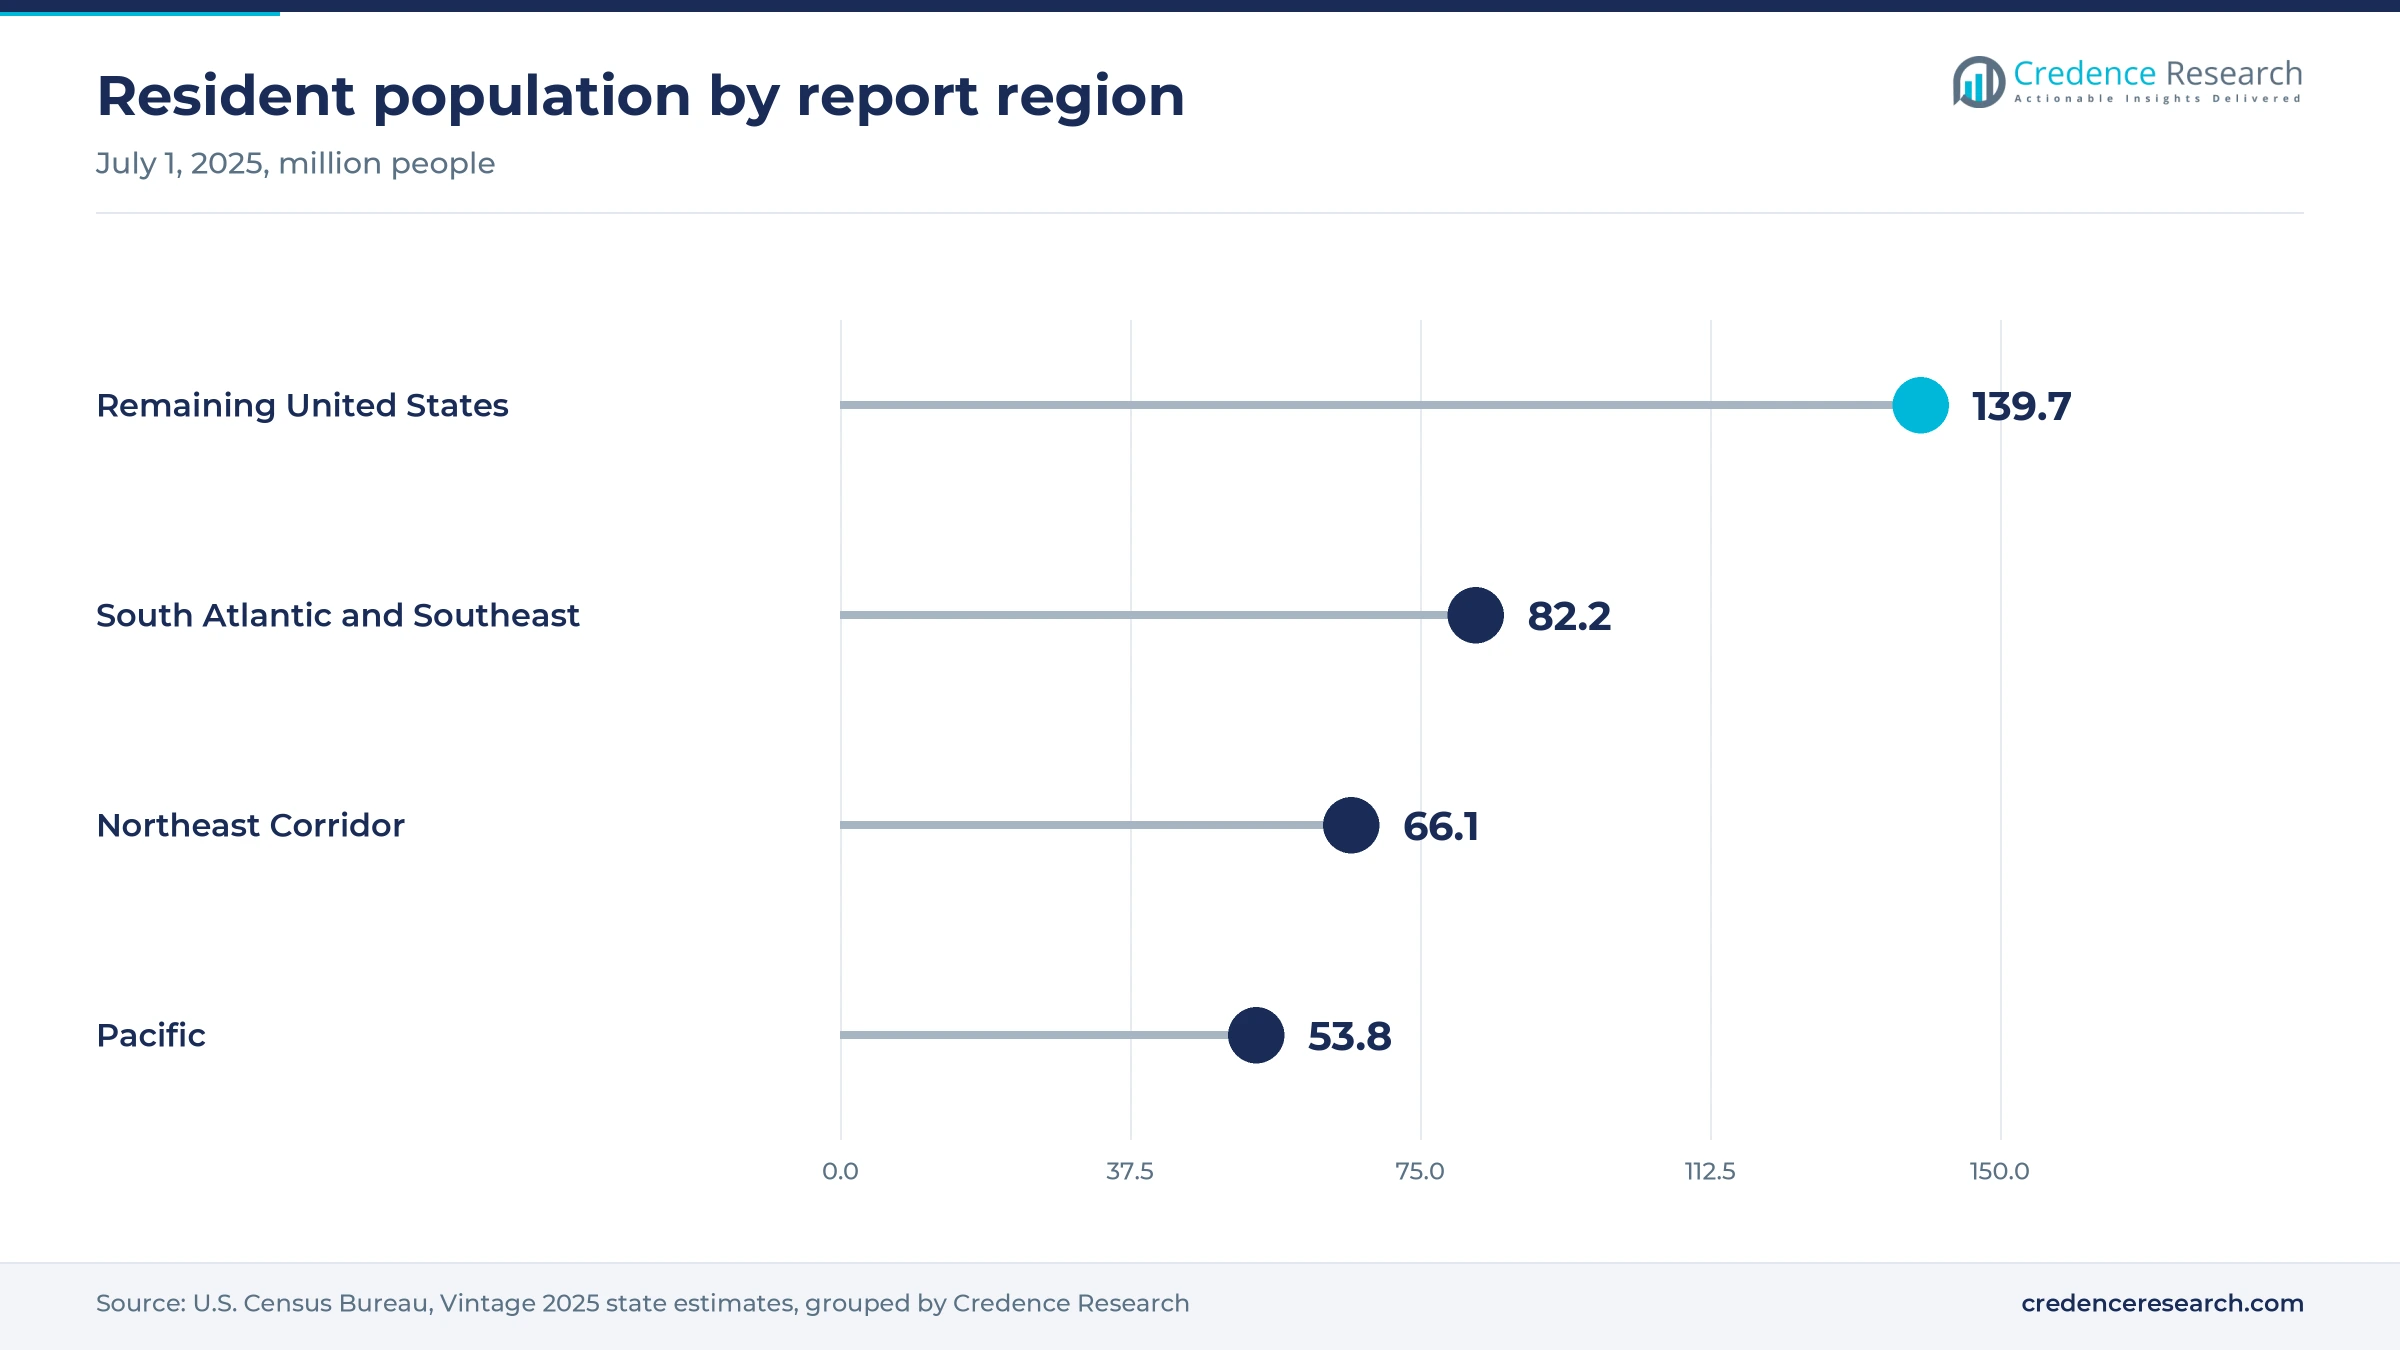
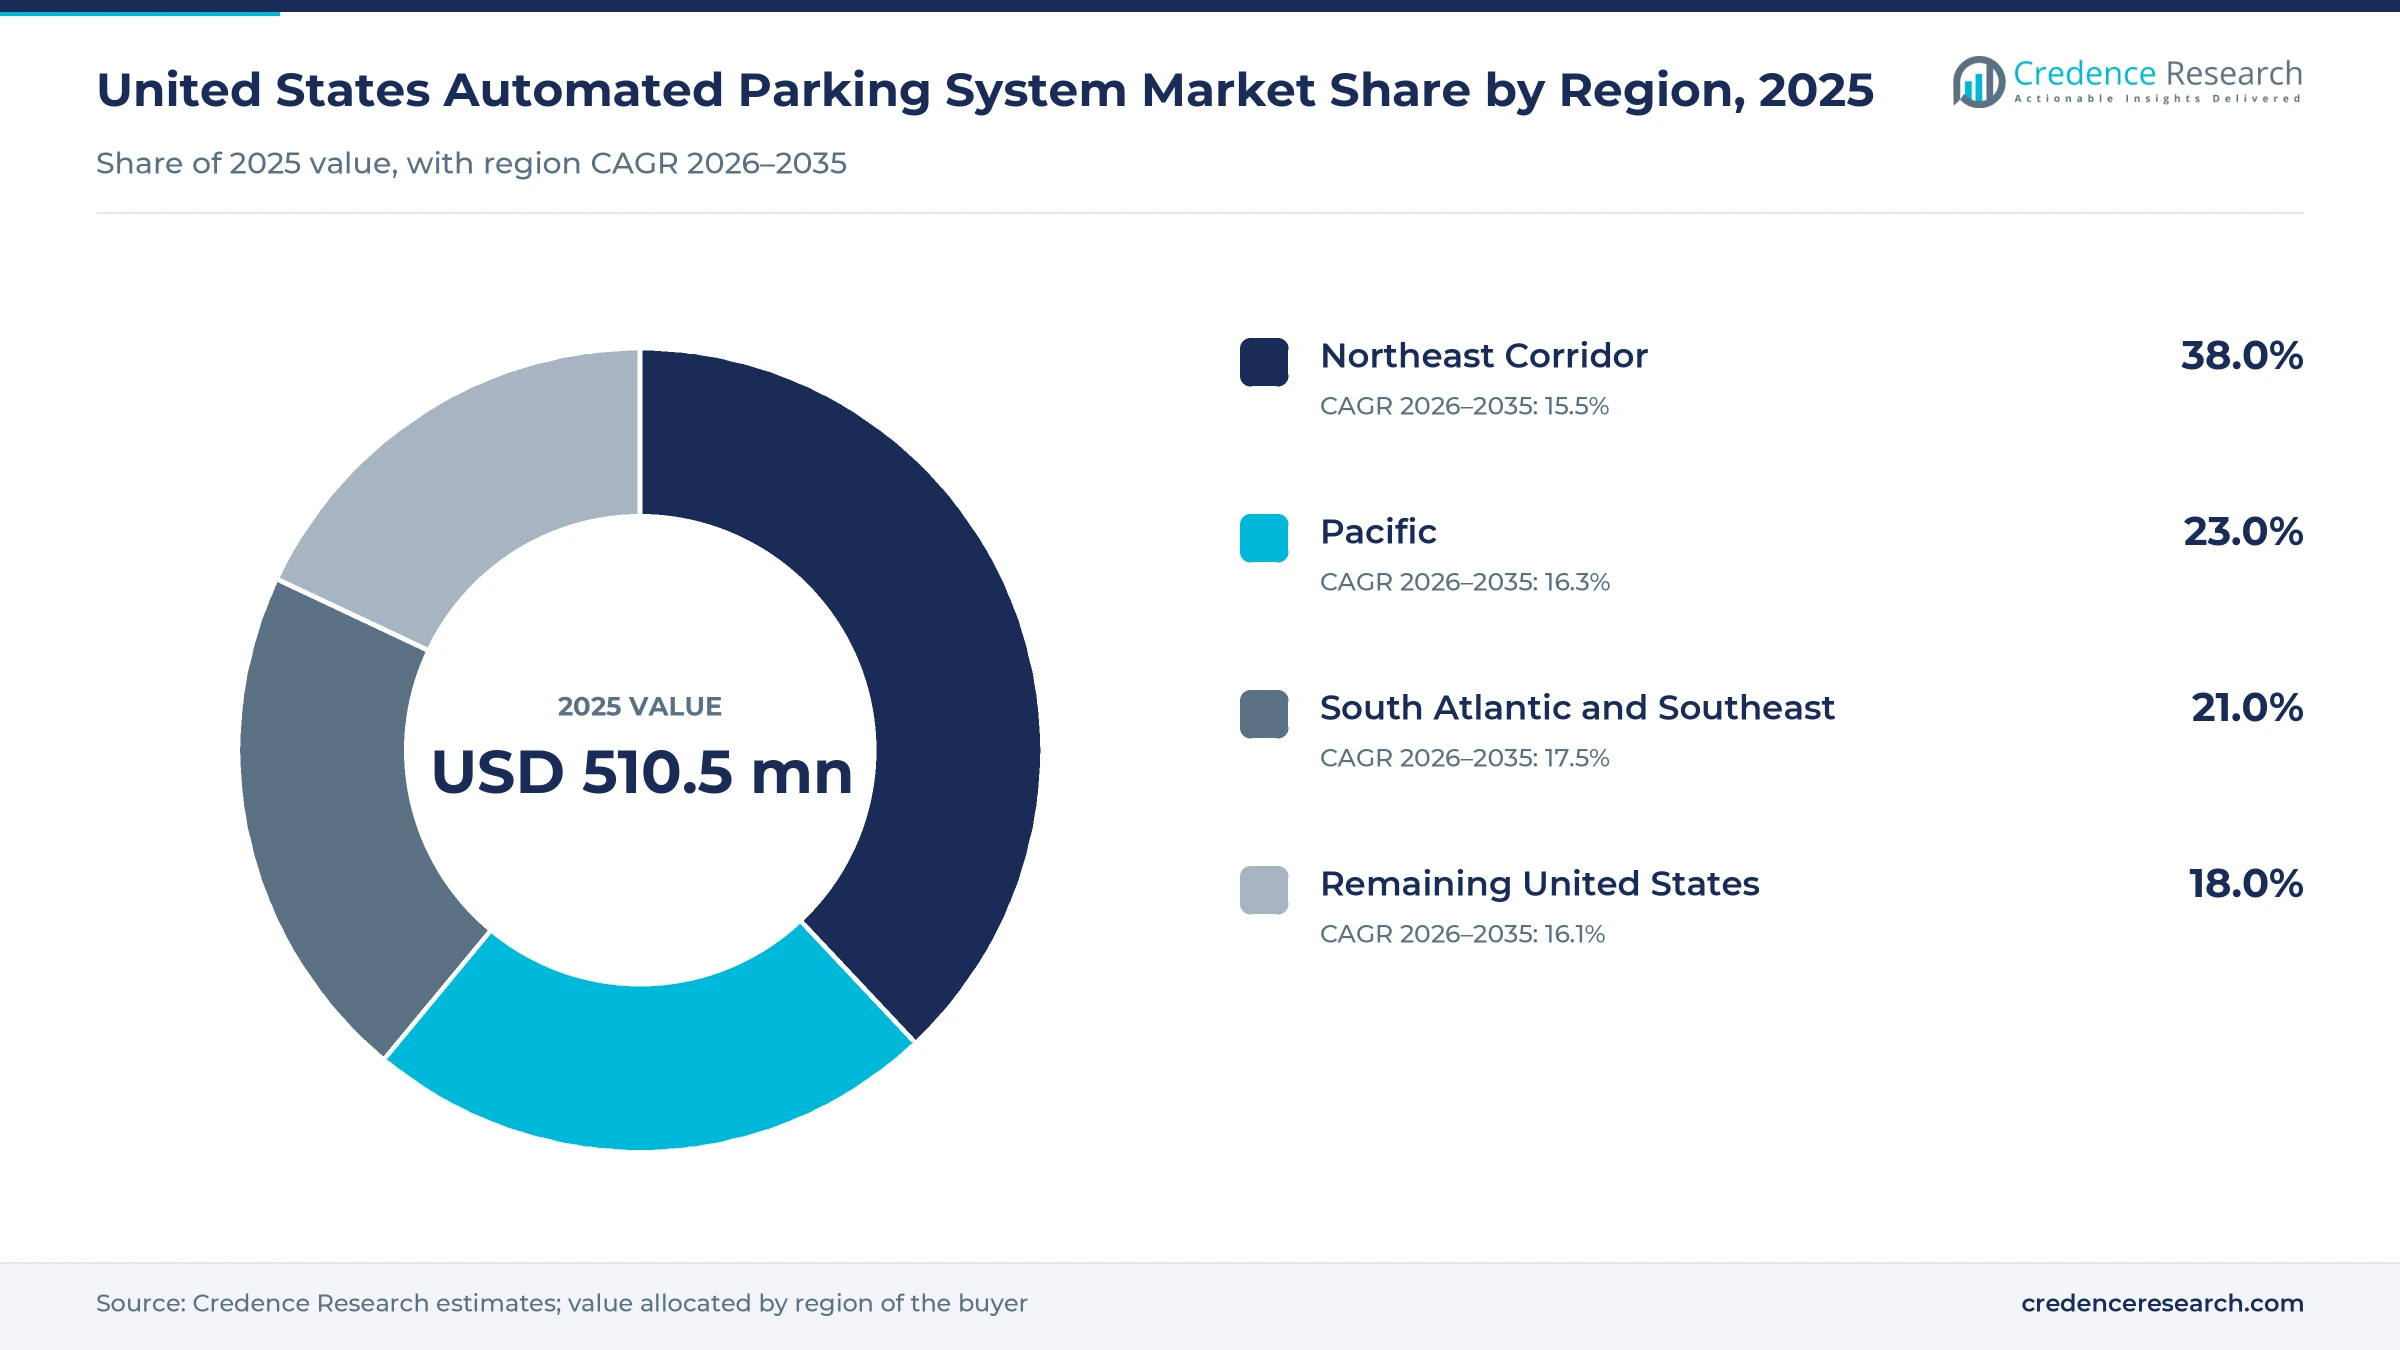
The four regions differ mainly in land values, the density of tower construction and how long local developers have used mechanized garages. The Northeast Corridor and the Pacific together held 61.0% of 2025 demand, although the other two zones hold most of the population.
| Region | Value, 2025 (USD million) | Share, 2025 | CAGR, 2026–2035 |
|---|---|---|---|
| Northeast Corridor | 194.0 | 38.0% | 15.5% |
| Pacific | 117.4 | 23.0% | 16.3% |
| South Atlantic and Southeast | 107.2 | 21.0% | 17.5% |
| Remaining United States | 91.9 | 18.0% | 16.1% |
Northeast Corridor leads on land values and tower density
The Northeast Corridor held 38.0% of 2025 value and grows at 15.5% a year. The zone had about 66.1 million residents in 2025, according to a Credence Research tally of Census Bureau state estimates, and its cities have the longest record of puzzle and robotic garages. Utron condensed 373 spaces at Park + Garden in Hoboken, New Jersey, from 10 underground floors to four, and Lödige and Volley are active in Philadelphia and Manhattan. Slower population growth keeps the pace below the national rate.
South Atlantic and Southeast grows fastest on new towers
The South Atlantic and Southeast held 21.0% of 2025 value and is the fastest-growing region at 17.5% a year. The zone gained about 5.8% in population between 2020 and 2025, the fastest of the four zones on Census Bureau data. In Sunny Isles, Florida, The Muse has a 208-space ParkPlus rack-and-rail system rising 26 levels, and a Miami design board backed a 301-car automated garage at One Edgewater in February 2023. Raleigh adds a district-scale project that serves several buildings at once.
Pacific demand comes from Seattle and California towers
The Pacific region held 23.0% of 2025 value and grows at 16.3% a year. The Census Bureau reports that national population grew only 0.5% between 2024 and 2025, and the Pacific states added just 0.2% over five years, so demand rests on land cost rather than population. Seattle's Spire, the Lume project in Menlo Park and a Volley installation at 1355 Fulton Street in San Francisco anchor the base. Washington's 2025 parking reform is the main brake on new stall counts.
Remaining United States builds on scattered urban projects
The Remaining United States held 18.0% of 2025 value and grows at 16.1% a year. The zone is the largest by population, at about 139.7 million, but its land prices are lower outside a few city cores. Projects include a 120-space ParkPlus rack-and-rail system at The Lux in Madison, Wisconsin and Utron work in Houston, Boulder and Vail, Colorado. Demand concentrates in Midwestern city cores, Texas cities and Colorado resort towns with costly land.
Philadelphia, Raleigh and New York set the 2025-2026 pace
| Development | Status and market relevance |
|---|---|
| In February 2025, Lödige Industries started operation of a three-level automated garage at 210 South 12th in Philadelphia. | First U.S. system with charging capability on all spaces |
| In May 2025, Westfalia Technologies launched WEPLUG, a gantry-mounted 50 kW DC automated charging system. | Lets one charger serve many cars inside automated garages |
| In May 2026, construction began on an AUTOParkit robotic garage at City Gateway in Raleigh. | Combines EV charging at every stall with C-PACE financing |
| In July 2026, Volley Automation was reported as supplier for two Manhattan towers by Legion Investment Group. | Brings mobile robot parking to two New York condominium towers under construction |
Three access models trade density against retrieval time
- Fully automated systems store cars on pallets or robots with no driver inside the storage area, which gives the highest density and suits towers and narrow lots.
- Independent-access semi-automated systems shift platforms horizontally and vertically so any car can be retrieved without moving others, a common choice for mid-rise rentals.
- Dependent-access mechanical systems stack two or more cars on lifts, which costs least per space but often needs a valet to move cars.
- Mobile robot platforms lift cars on free-roaming robots guided by software, which lets one fleet serve irregular floor plates and charging bays.
Need a Custom Version of This Report?
Tailor the scope, geography, or segments to your exact requirements.
- Custom geography or segment scope
- Direct access to our analyst team
Engineering depth and service reach decide contracts
U.S. automated parking suppliers compete on engineering references, retrieval speed, fire code approvals and the reach of their service crews rather than on list price alone. ParkPlus offers the widest range of stackers, puzzle and robotic systems and claims the largest share of projects. Lödige and Westfalia compete for fully automated towers with controls designed in house and charging built into the system, while Wöhr supplies puzzle and automated systems through U.S. partners such as Harding Steel. Utron sells pallet and shuttle systems from New Jersey, and newer entrants such as AUTOParkit and Volley Automation compete with robot designs and financing support. Developers usually shortlist suppliers with at least one operating U.S. automated parking system, so references count heavily. Service contracts and modernization work protect incumbents once systems are installed.
A concentrated field of specialists with high service barriers
The U.S. supply side is concentrated among a small group of specialists, led by ParkPlus in volume and by European engineering houses such as Lödige, Westfalia and Wöhr in fully automated projects. Utron, AUTOParkit and Volley add robot and shuttle designs, while integrators such as Parkworks install imported platforms. Entry barriers come from fire code approvals, references from operating garages and a local service network rather than from manufacturing scale. Margins sit mainly in controls, engineering and long-term service contracts, while steel fabrication and installation labor carry thinner margins.
Companies profiled and their roles in this market
| Company | Type | Role in the market |
|---|---|---|
| ParkPlus | System maker, New York | Stackers, puzzle and robotic systems, including Brickell House and The Muse |
| Lödige Industries | System maker, U.S. office in Long Island City, New York | Fully automated garages, including 210 South 12th in Philadelphia |
| Westfalia Technologies | System maker, York, Pennsylvania | Automated garages with Savanna.NET controls and WEPLUG charging |
| Utron | System maker, Hackensack, New Jersey | Pallet and shuttle systems such as Park + Garden in Hoboken |
| WÖHR Autoparksysteme | System maker, U.S. projects through partners | Puzzle and automated systems in Philadelphia and Seattle |
| AUTOParkit | System maker, U.S. | Robotic garage with EV charging at City Gateway in Raleigh |
| Volley Automation | Robot parking provider, Denver | Mobile robot systems for San Francisco and Manhattan towers |
| Parkworks | Integrator, California | Installs Sotefin systems at Spire in Seattle and Lume in Menlo Park |
The garage is now sold as land and charging capacity
Credence Research's view is that U.S. buyers now buy robotic garages for the land and charging capacity they create, not for convenience. A developer who can sell or rent the floor area saved from ramps, and offer charging without rebuilding power service, can justify a cost per space that would never pass against a surface lot. That is why towers in high-cost cores lead demand while parking reform erodes the low end. The main risk lies with reliability, because one stranded garage can set back a supplier in a metro for years.
Project counts, price points and zone data anchor estimates
The report uses 2025 as the base year and forecasts to 2035 in current U.S. dollars. Market values come from the Credence Research model, which combines documented project counts and space totals, per-space prices from trade press and public cost studies, and an estimate of service revenue on the installed base. Regional shares follow the Credence Research regional model, informed by Census Bureau population data and where documented installations cluster. Segment splits are Credence Research estimates from company, trade press and code sources. No primary interviews or surveys were used in building these estimates.
Fleet-ready and EV-ready garages set the upper range
Through 2035, demand is likely to rise in two phases toward USD 2.33 billion. Until about 2029, towers in New York, Philadelphia, Miami and Seattle, plus modernization of older systems, carry most of the gains. After that, growth depends on whether district garages and fleet operators adopt dense, charged storage near demand, which would add larger single projects than condominium towers. Semi-automated parking systems will stay the volume base for mid-rise buildings, while fully automated garages gain share where charging and fleet storage add value. A single district or fleet garage of 200 or more spaces can match the parking demand of several condominium towers.
Fleet adoption and code approvals set the range to 2035
The range of outcomes depends on whether developers keep building parking as mandates fall, and on whether EV and fleet charging make the garage a revenue asset. A downside case combines higher steel costs, slower EV uptake and faster parking reform. The upside requires robotaxi operators and district garages to adopt dense charged storage in several metros, and the 2027 fire code to speed approvals.
| Scenario | CAGR, 2026–2035 | Value, 2035 | What has to hold |
|---|---|---|---|
| Downside | 13.8% | USD 1.92 billion | Parking reform spreads, tariffs stay high and EV sales stall near 2025 levels |
| Base | 16.27% | USD 2.33 billion | Steady tower demand, gradual EV growth and rising modernization of older systems |
| Upside | 18.3% | USD 2.72 billion | Fleet operators and district garages adopt charged robotic storage in several large metros |
Frequently Asked Questions
How big is the United States automated parking system market?
Which region leads the U.S. market?
Which technology holds the largest share?
How do automated garages support electric vehicle charging?
What does an automated parking space cost?
What limits adoption in the United States?
Which fire code changes affect automated garages?
Which companies are active in the U.S. market?
Table of Content
Chapter 1 Market Segmentation
- 1.1 Segmentation Framework
- 1.1.1 Product and Service Classification
- 1.1.2 Application and End-Use Classification
- 1.1.3 Technology and Solution Classification
- 1.1.4 Customer and Distribution Channel Classification
- 1.1.5 Geographic Segmentation
- 1.1.6 Market Segment Definitions and Boundaries
- 1.2 By Technology
- 1.2.1 Independent-Access Semi-Automated
- 1.2.2 Fully Automated
- 1.2.3 Dependent-Access Mechanical
- 1.3 By Component
- 1.3.1 Hardware
- 1.3.2 Software
- 1.3.3 Installation Services
- 1.3.4 Maintenance
- 1.4 By End-Use Sector
- 1.4.1 Residential
- 1.4.2 Commercial
- 1.4.3 Municipal and Institutional
- 1.5 By Project Type
- 1.5.1 New-Build Installations
- 1.5.2 Modernization
- 1.5.3 Capacity Expansion
Chapter 2 Introduction
- 2.1 Report Objectives and Scope
- 2.2 Product Definition and Industry Terminology
- 2.3 Market Inclusions and Exclusions
- 2.4 Research Process
- 2.4.1 Primary Research and Expert Interviews
- 2.4.2 Secondary Research and Source Review
- 2.4.3 Top-Down and Bottom-Up Estimation
- 2.4.4 Data Triangulation and Verification
- 2.5 Market Size Measurement Basis
- 2.5.1 2025: USD 510.5 million → 2035: USD 2.33 billion
- 2.6 Historical and Forecast Reference Periods
- 2.6.1 Historical Period: 2018-2025
- 2.6.2 Base Year: 2025
- 2.6.3 Forecast Period: 2025-2035
- 2.7 Research Assumptions and Limitations
Chapter 3 Executive Summary
- 3.1 Market Snapshot and Key Findings
- 3.2 Base-Year Market Size, 2025
- 3.3 Forecast Market Size, 2035
- 3.4 Revenue and Volume Growth Outlook
- 3.5 Key Demand and Supply Indicators
- 3.6 Leading Market Segments
- 3.7 Fastest-Growing Market Opportunities
- 3.8 Regional Performance Highlights
- 3.9 Technology and Industry Transformation
- 3.10 Competitive Landscape Summary
- 3.11 Analyst View and Strategic Implications
Chapter 4 United States Automated Parking System Market Trends and Developments
- 4.1 Historical Industry Development, 2018-2025
- 4.2 Recent Market Trends and Developments
- 4.3 Demand and Customer Behavior Trends
- 4.4 Technology and Product Innovation
- 4.5 Artificial Intelligence, Automation and Digitalization
- 4.6 Local Manufacturing and Supply Chain Realignment
- 4.7 Industry Partnerships, Mergers and Acquisitions
- 4.8 Sustainability and Circular Economy Developments
- 4.9 Government and Private Sector Investment Trends
- 4.10 Emerging Business Models and Commercialization
- 4.11 Industry Developments and Announcements
Chapter 5 United States Automated Parking System Market Production, Supply and Demand Analysis
- 5.1 Demand Trend and Consumption Analysis, 2018-2025
- 5.2 Demand Forecast, 2025-2035
- 5.3 Production and Output Trend, 2018-2025
- 5.4 Production and Output Forecast, 2025-2035
- 5.5 Installed Capacity and Capacity Utilization
- 5.6 Company-Wise Production Plants and Statistics
- 5.6.1 Installed Production Capacity
- 5.6.2 Actual Production
- 5.6.3 Planned Capacity and Expansion Targets
- 5.7 Supply Chain Structure and Procurement Trends
- 5.8 Supply-Demand Gap and Bottlenecks
- 5.9 Import Dependence and Sourcing Structure
- 5.10 Contract Manufacturing and Outsourcing
- 5.11 Regional Supply and Demand Concentration
Chapter 6 United States Automated Parking System Market Pricing Analysis
- 6.1 Pricing Structure and Measurement
- 6.2 Historical Pricing Trends, 2018-2025
- 6.3 Pricing Outlook, 2025-2035
- 6.4 Average Selling Price and Unit Economics
- 6.5 Pricing by Product and Market Segment
- 6.6 Geographic Pricing Differences
- 6.7 Key Input, Energy, Labor and Logistics Costs
- 6.8 Contract Pricing and Purchasing Models
- 6.9 Pricing Sensitivity and Competitive Positioning
- 6.10 Price, Margin and Profitability Implications
Chapter 7 United States Automated Parking System Market Dynamics
- 7.1 Market Growth Drivers
- 7.1.1 Demand-Side Drivers
- 7.1.2 Technology and Innovation Drivers
- 7.1.3 Infrastructure and Investment Drivers
- 7.1.4 Regulatory and Policy Drivers
- 7.2 Market Restraints
- 7.2.1 Cost and Affordability Constraints
- 7.2.2 Technology and Adoption Barriers
- 7.2.3 Supply Chain and Operational Constraints
- 7.3 Market Challenges
- 7.3.1 Competitive Pressure and Margin Erosion
- 7.3.2 Skills, Infrastructure and Implementation Gaps
- 7.4 Emerging Market Opportunities
- 7.5 Market Dynamics Impact and Time-Horizon Assessment
Chapter 8 United States Automated Parking System Value Chain Analysis
- 8.1 Industry Value Chain Overview
- 8.2 Upstream Suppliers and Critical Inputs
- 8.3 Technology and Component Providers
- 8.4 Manufacturing or Service Delivery
- 8.5 Distribution, Channel Partners and Integrators
- 8.6 Downstream Applications and End Users
- 8.7 Value Addition and Profit Pools
- 8.8 Vertical Integration and Outsourcing
- 8.9 Supplier Concentration and Risk
- 8.10 Supply Chain Localization and Resilience
Chapter 9 United States Automated Parking System Market Regulations and Policies
- 9.1 Relevant Laws, Standards and Compliance Frameworks
- 9.2 Product, Service, Safety and Quality Requirements
- 9.3 Government Policies, Incentives and Subsidies
- 9.4 Imports, Exports and Trade Barriers
- 9.5 Public Procurement and Local Content Requirements
- 9.6 Environmental and Sustainability Compliance
- 9.7 Upcoming Policy Changes and Market Implications
Chapter 10 United States Automated Parking System Market Hotspots and Opportunities
- 10.1 Market Opportunity Mapping and Growth Hotspots
- 10.2 High-Growth Applications and Customer Groups
- 10.3 Underserved Markets and White-Space Opportunities
- 10.4 Emerging Technology and Product Opportunities
- 10.5 New Capacity and Investment Hotspots
- 10.6 Market Entry and Expansion Opportunities
- 10.7 Distribution and Partnership Opportunities
- 10.8 Near-Term and Long-Term Commercial Potential
- 10.9 Opportunity Attractiveness and Execution Risks
Chapter 11 United States Automated Parking System Market Outlook, 2025-2035
- 11.1 Market Size and Analysis
- 11.1.1 Revenue (Market Measurement: 2025: USD 510.5 million → 2035: USD 2.33 billion)
- 11.1.2 Market Volume and Quantity Sold
- 11.1.3 Historical Market Size, 2018-2025
- 11.1.4 Base-Year Market Size, 2025
- 11.2 Market Forecast, 2025-2035
- 11.2.1 Revenue Forecast to 2035
- 11.2.2 Volume Forecast to 2035
- 11.2.3 CAGR and Year-on-Year Growth
- 11.2.4 Incremental Revenue Opportunity
- 11.3 Forecast Assumptions and Scenario Analysis
- 11.3.1 Base-Case Forecast
- 11.3.2 Optimistic and Conservative Scenarios
- 11.3.3 Technology, Pricing and Policy Sensitivities
- 11.4 Market Attractiveness and Growth Outlook
Chapter 12 United States Automated Parking System Market Segmentation and Outlook
- 12.1 Segmentation Summary and Market Shares, 2025
- 12.2 Largest and Fastest-Growing Segments
- 12.3 By Technology - Market Size and Forecast, 2025-2035
- 12.3.1 Segment Definition and Scope
- 12.3.2 Historical Market Size, 2018-2025
- 12.3.3 Revenue Forecast, 2025-2035
- 12.3.4 Volume Forecast, 2025-2035
- 12.3.5 Base-Year Market Share, 2025
- 12.3.6 Segment CAGR and Growth Drivers
- 12.3.7 Subsegment Market Size and Forecast
- 12.3.7.1 Independent-Access Semi-Automated
- 12.3.7.2 Fully Automated
- 12.3.7.3 Dependent-Access Mechanical
- 12.3.8 Subsegment Pricing and Adoption Trends
- 12.3.9 Leading Suppliers and Competition
- 12.3.10 Regional Demand and Opportunities
- 12.4 By Component - Market Size and Forecast, 2025-2035
- 12.4.1 Segment Definition and Scope
- 12.4.2 Historical Market Size, 2018-2025
- 12.4.3 Revenue Forecast, 2025-2035
- 12.4.4 Volume Forecast, 2025-2035
- 12.4.5 Base-Year Market Share, 2025
- 12.4.6 Segment CAGR and Growth Drivers
- 12.4.7 Subsegment Market Size and Forecast
- 12.4.7.1 Hardware
- 12.4.7.2 Software
- 12.4.7.3 Installation Services
- 12.4.7.4 Maintenance
- 12.4.8 Subsegment Pricing and Adoption Trends
- 12.4.9 Leading Suppliers and Competition
- 12.4.10 Regional Demand and Opportunities
- 12.5 By End-Use Sector - Market Size and Forecast, 2025-2035
- 12.5.1 Segment Definition and Scope
- 12.5.2 Historical Market Size, 2018-2025
- 12.5.3 Revenue Forecast, 2025-2035
- 12.5.4 Volume Forecast, 2025-2035
- 12.5.5 Base-Year Market Share, 2025
- 12.5.6 Segment CAGR and Growth Drivers
- 12.5.7 Subsegment Market Size and Forecast
- 12.5.7.1 Residential
- 12.5.7.2 Commercial
- 12.5.7.3 Municipal and Institutional
- 12.5.8 Subsegment Pricing and Adoption Trends
- 12.5.9 Leading Suppliers and Competition
- 12.5.10 Regional Demand and Opportunities
- 12.6 By Project Type - Market Size and Forecast, 2025-2035
- 12.6.1 Segment Definition and Scope
- 12.6.2 Historical Market Size, 2018-2025
- 12.6.3 Revenue Forecast, 2025-2035
- 12.6.4 Volume Forecast, 2025-2035
- 12.6.5 Base-Year Market Share, 2025
- 12.6.6 Segment CAGR and Growth Drivers
- 12.6.7 Subsegment Market Size and Forecast
- 12.6.7.1 New-Build Installations
- 12.6.7.2 Modernization
- 12.6.7.3 Capacity Expansion
- 12.6.8 Subsegment Pricing and Adoption Trends
- 12.6.9 Leading Suppliers and Competition
- 12.6.10 Regional Demand and Opportunities
- 12.7 Segment Growth Comparison
- 12.8 Segment Attractiveness and Priority Matrix
Chapter 13 United States Automated Parking System End-Use and Application Market Outlook
- 13.1 End-Use Industry and Customer Demand Structure
- 13.2 Leading Applications and Customer Groups
- 13.3 End-Use Market Size, Share and Forecast
- 13.4 Major End-Use Industry Deep Dives
- 13.4.1 Customer Requirements and Use Cases
- 13.4.2 Demand and Replacement Cycles
- 13.4.3 Technical and Regulatory Considerations
- 13.4.4 Purchasing and Procurement Models
- 13.4.5 Leading Vendors and Distribution Channels
- 13.4.6 Forecast and Commercial Opportunities
- 13.5 Emerging Applications and Cross-Segment Demand
- 13.6 End-Use Industry Investment Priorities
Chapter 14 United States Automated Parking System Geographic Market Outlook, 2025-2035
- 14.1 Domestic Market Distribution and Demand Clusters
- 14.2 State- or Province-Wise Market Size and Forecast, 2025-2035
- 14.3 City and Metropolitan Market Outlook
- 14.4 Industrial, Manufacturing and Commercial Clusters
- 14.5 Geographic Concentration of Key End Users
- 14.6 Local Pricing and Purchasing Differences
- 14.7 Domestic Production Facilities and Capacity Map
- 14.8 Local Infrastructure and Project Pipeline
- 14.9 State-Level Policy and Incentive Differences
- 14.10 Subnational Investment Hotspots and Opportunities
- 14.11 Distribution and Logistics Networks
- 14.12 Domestic Competitive Footprint
Chapter 15 United States Automated Parking System Technology, Innovation and Sustainability Outlook
- 15.1 Technology Landscape and Maturity
- 15.2 Product, Process and Service Innovation
- 15.3 AI, Automation and Digital Tools in the Industry
- 15.4 Technology Adoption and Performance Benchmarking
- 15.5 Innovation Pipeline and R&D Investment
- 15.6 Patent and Intellectual Property Trends
- 15.7 Energy Efficiency and Resource Management
- 15.8 Sustainability, Recycling and Circularity
- 15.9 Technology Roadmap, 2025-2035
- 15.10 Risks of Obsolescence and Technology Substitution
Chapter 16 United States Automated Parking System Market Key Strategic Imperatives
- 16.1 Growth and Market Entry Priorities
- 16.2 High-Return Products and Segments
- 16.3 Pricing, Profitability and Cost Optimization
- 16.4 Technology Investment and Product Differentiation
- 16.5 Supply Chain Localization and Resilience
- 16.6 Distribution and Customer Acquisition
- 16.7 Partnership, Acquisition and Capacity Strategy
- 16.8 Regional Expansion Priorities
- 16.9 Short-, Medium- and Long-Term Actions
Chapter 17 Competition Outlook
- 17.1 Industry Competition Characteristics
- 17.2 Market Structure and Concentration
- 17.3 Market Share and Competitive Positioning, 2025
- 17.4 Company-Wise Revenue and Product Benchmarking
- 17.5 Production and Service Capacity Benchmarking
- 17.6 Technology, Pricing and Differentiation
- 17.7 Regional Footprint and Distribution Strength
- 17.8 Mergers, Acquisitions and Strategic Alliances
- 17.9 New Entrants and Competitive Threats
- 17.10 Porter's Five Forces and Industry Attractiveness
- 17.11 Competitive Outlook, 2025-2035
Chapter 18 Company Profiles
- 18.1 Company Coverage and Selection Criteria
- 18.2 Westfalia Technologies
- 18.2.1 Business Description
- 18.2.2 Company Ownership and Geographic Presence
- 18.2.3 Product and Service Portfolio
- 18.2.4 Manufacturing and Operating Footprint
- 18.2.5 Production Capacity and Expansion Plans
- 18.2.6 Financial Performance and Investment
- 18.2.7 Market Share and Competitive Position
- 18.2.8 Technology and Innovation Capabilities
- 18.2.9 Strategic Alliances or Partnerships
- 18.2.10 Recent Developments
- 18.2.11 Growth Strategy and Outlook
- 18.3 Lödige Industries
- 18.4 ParkPlus
- 18.5 Utron
- 18.6 WÖHR Autoparksysteme
- 18.7 AUTOParkit
- 18.8 Volley Automation
- 18.9 Parkworks
- 18.10 Other Relevant Market Participants
Note: Every listed company is profiled on the structure shown under the first company. The company list is preliminary and may change based on research findings, market developments, data availability and client requirements.
Chapter 19 Disclaimer
- 19.1 Research and Forecast Disclaimer
- 19.2 Data Source and Estimation Limitations
Note: The depth of individual sections depends on data availability for this market. Volume, capacity, trade and other unit-based metrics are included where applicable.