Market overviews
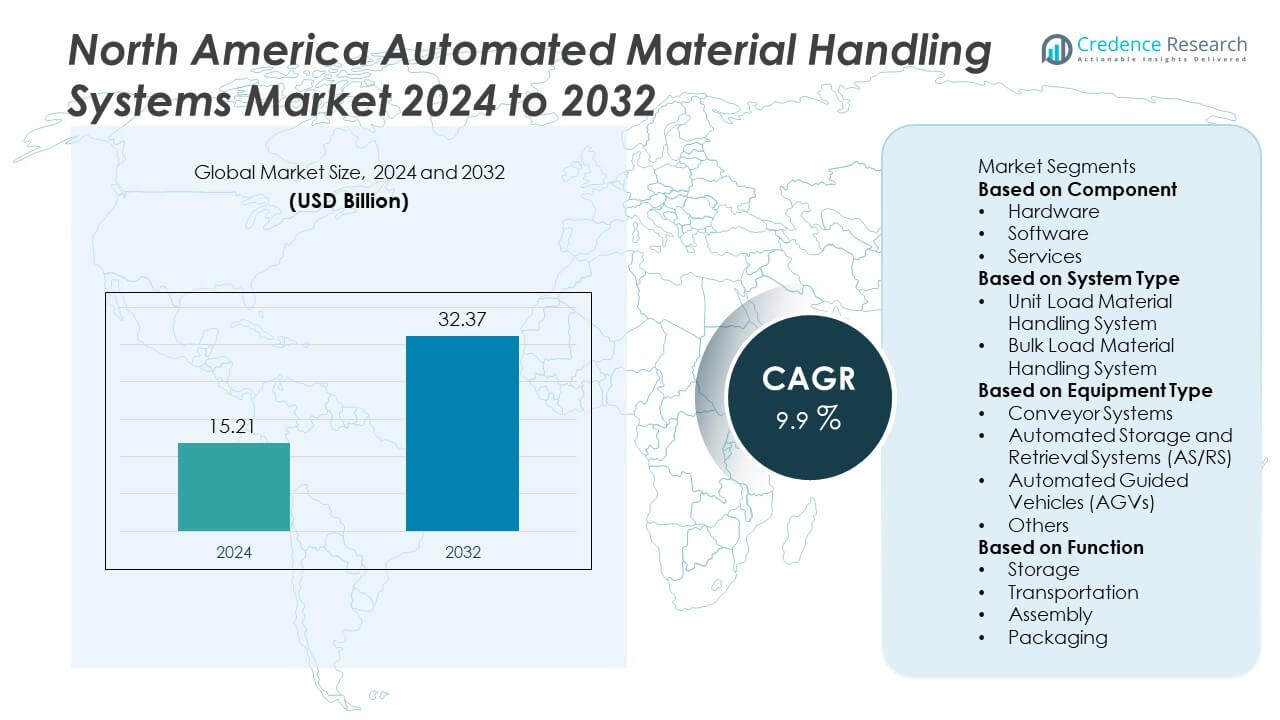
The North America Automated Material Handling Systems Market was valued at USD 15.21 billion in 2024 and is projected to reach USD 32.37 billion by 2032, expanding at a CAGR of 9.9% during the forecast period.
| REPORT ATTRIBUTE |
DETAILS |
| Historical Period |
2020-2023 |
| Base Year |
2024 |
| Forecast Period |
2025-2032 |
| North America Automated Material Handling Systems Market Size 2024 |
USD 15.21 Billion |
| North America Automated Material Handling Systems Market, CAGR |
9.9% |
| North America Automated Material Handling Systems Market Size 2032 |
USD 32.37 Billion |
The North America automated material handling systems market is led by major players such as Daifuku Co., Ltd., Dematic (KION Group AG), Honeywell Intelligrated, SSI SCHÄFER Group, Toyota Material Handling, Swisslog Holding AG (KUKA AG), Murata Machinery, Ltd., Vanderlande Industries B.V., Bastian Solutions, LLC, and BEUMER Group. These companies focus on robotics integration, smart warehousing, and AI-driven automation to enhance operational efficiency across industries. The United States leads the regional market with a 73.6% share in 2024, driven by strong investments in logistics and e-commerce automation. Canada follows with 17.9% share, supported by advancements in smart warehouses, while Mexico holds 8.5% share, emerging as a nearshoring hub for manufacturing automation and supply chain modernization.
Access crucial information at unmatched prices!
Request your sample report today & start making informed decisions powered by Credence Research Inc.!
Download Sample
Market Insights
- The North America automated material handling systems market was valued at USD 15.21 billion in 2024 and is projected to reach USD 32.37 billion by 2032, expanding at a CAGR of 9.9%.
- Growth is driven by rising demand for warehouse automation, increasing e-commerce volumes, and the adoption of robotics and AI in manufacturing and logistics operations.
- Key trends include the integration of IoT-enabled smart warehousing, Robotics-as-a-Service (RaaS) models, and predictive maintenance technologies enhancing system efficiency.
- Leading players such as Daifuku Co., Ltd., Dematic, Honeywell Intelligrated, SSI SCHÄFER, and Toyota Material Handling are investing in robotics, scalable platforms, and digital supply chain solutions to strengthen competitiveness.
- The United States leads with 73.6% share, followed by Canada at 17.9% and Mexico at 8.5%; by equipment type, conveyor systems dominate with 29.6% share, while the unit load handling system segment holds 67.8% of total market share.
Market Segmentation Analysis:
By Component
The hardware segment dominates the North America automated material handling systems market with a 62.4% share in 2024. This dominance is driven by increasing demand for conveyors, sensors, robotic arms, and automated storage systems that enhance throughput and reduce labor dependency. The rise of Industry 4.0 and smart factory initiatives across manufacturing and logistics sectors has accelerated hardware adoption. Software solutions are also gaining momentum due to the growing need for real-time data analytics, predictive maintenance, and system integration, while services are expanding as companies seek system upgrades and maintenance support.
- For instance, Daifuku Co., Ltd. has leveraged its state-of-the-art robotic systems to improve throughput in warehouses, with its automated storage and retrieval systems (ASRS) achieving up to 85% improvement in floor space utilization while reducing energy consumption by more than 50 percent in some configurations compared to conventional racking.
By System Type
The unit load material handling system segment leads the market with a 67.8% share in 2024, supported by its widespread use in warehouses, distribution centers, and automotive assembly lines. These systems efficiently handle discrete items such as pallets, boxes, and containers, improving storage density and operational efficiency. The bulk load segment is witnessing steady growth in industries such as mining, construction, and agriculture, where heavy and granular materials require high-capacity transport and automated transfer solutions to reduce manual intervention and operational risks.
- For instance, Dematic (KION Group AG) has implemented unit load systems in major distribution centers, boosting operational efficiency by optimizing storage space and reducing order-picking time. These systems improve pick rates, enhance accuracy, and streamline fulfillment efficiency.
By Equipment Type
The conveyor systems segment holds the largest market share of 29.6% in 2024, driven by high deployment in e-commerce, food processing, and automotive manufacturing facilities. Conveyors enable smooth and continuous movement of goods across facilities, ensuring speed, consistency, and reduced handling time. Automated storage and retrieval systems (AS/RS) follow closely, benefiting from growing warehouse automation and high-density storage needs. Automated guided vehicles (AGVs) are rapidly gaining traction with the expansion of flexible intralogistics solutions in manufacturing and retail distribution, supported by the integration of advanced navigation and control technologies.
Key Growth Drivers
Rising Demand for Warehouse Automation in E-commerce and Retail
The rapid growth of e-commerce and omnichannel retailing is driving strong demand for automated material handling systems in North America. Retailers and logistics providers are investing in advanced automation to handle increasing order volumes, reduce delivery times, and improve inventory accuracy. Automated storage, retrieval, and conveyor systems are optimizing warehouse workflows, enabling faster fulfillment. The rise of micro-fulfillment centers and distribution automation across the U.S. and Canada further strengthens adoption, making automation a cornerstone of modern logistics infrastructure.
- For instance, Honeywell Intelligrated’s order fulfillment systems, including automated conveyors and sortation equipment, have helped various retailers and other customers increase productivity by up to 35% with technologies such as voice picking, and achieve throughput increases of nearly 40% with automated storage and retrieval systems (AS/RS).
Adoption of Robotics and AI in Manufacturing Operations
The growing integration of robotics, artificial intelligence, and machine vision technologies is transforming material handling in manufacturing facilities. These systems enhance precision, speed, and flexibility while reducing reliance on manual labor. Automotive, electronics, and food processing industries are implementing robotic solutions for assembly, sorting, and packaging. AI-enabled systems also support predictive maintenance and dynamic workflow optimization. This shift toward smart manufacturing, supported by federal incentives and reshoring initiatives, is accelerating automation investments across North America’s industrial landscape.
- For instance, Toyota Motor Corporation has implemented an AI platform across its manufacturing factories to allow employees to develop and deploy machine learning models, an initiative which led to a reduction of over 10,000 man-hours per year and improved overall efficiency.
Labor Shortages and the Need for Operational Efficiency
Persistent labor shortages and high labor costs are pushing industries to automate repetitive material handling tasks. Automated guided vehicles, conveyors, and robotic picking systems are helping companies maintain productivity amid workforce challenges. These systems minimize downtime, enhance safety, and enable 24/7 operations. In sectors like logistics, automotive, and food processing, automation reduces dependency on seasonal labor and improves workplace ergonomics. As industries face growing pressure to meet rising production and distribution demands, automation provides a sustainable long-term solution to workforce constraints.
Key Trends and Opportunities
Emergence of Smart and Connected Warehouses
The shift toward digitalized, connected warehouses is creating new opportunities in the North America automated material handling systems market. Integration of IoT, cloud computing, and real-time data analytics enables predictive maintenance, performance optimization, and better asset tracking. Smart warehouse ecosystems are allowing end-users to monitor operations remotely, enhance inventory visibility, and reduce energy consumption. The convergence of automation and digitalization supports a seamless supply chain, driving adoption across major logistics and retail facilities in the region.
- For instance, Swisslog (KUKA AG) implements smart warehouse solutions that use technologies like IoT sensors and real-time tracking to improve operational efficiency and cut energy consumption by optimizing automated material handling systems.
Expansion of Robotics-as-a-Service (RaaS) Models
Rising adoption of subscription-based robotics solutions is reshaping automation deployment. Robotics-as-a-Service (RaaS) allows companies to implement automated systems without significant upfront investment, reducing financial barriers for small and medium enterprises. Vendors are offering scalable, pay-per-use automation tailored to operational needs, increasing flexibility for end-users. This trend is particularly prominent in warehouse operations and manufacturing, where demand for cost-efficient, adaptable systems continues to grow, supporting broader accessibility to automation technologies across the North American market.
- For instance, Bastian Solutions, LLC (a subsidiary of Toyota Industries Corporation) integrates advanced robotic palletizing systems for clients across various industries (such as automotive, retail, and food & beverage). These systems are designed to improve throughput and ergonomics, reduce labor costs, and enhance load stability by utilizing proprietary software and end-of-arm tools.
Key Challenges
High Initial Investment and Integration Costs
The significant upfront cost of installing automated systems remains a key challenge for market expansion. Expenses related to robotics, conveyors, software, and system integration can be prohibitive for small and medium enterprises. Additionally, implementing automation often requires facility redesigns and workforce training, adding to total project costs. Although long-term savings and productivity gains justify the investment, limited capital budgets and extended return-on-investment cycles continue to hinder widespread adoption among cost-sensitive businesses.
Cybersecurity and Data Management Concerns
As automation systems become increasingly connected through IoT and cloud platforms, cybersecurity risks are growing. Unauthorized access, system downtime, and data breaches can disrupt operations and compromise sensitive logistics information. Companies must invest in robust security frameworks, encryption protocols, and continuous monitoring to safeguard digital infrastructure. Ensuring data integrity across interconnected automated systems remains a complex challenge, particularly as facilities adopt AI-driven solutions and rely more heavily on real-time cloud-based communication for operational control.
Regional Analysis
United States
The United States dominates the North America automated material handling systems market with a 73.6% share in 2024. The country’s strong industrial base, advanced manufacturing ecosystem, and rapid adoption of warehouse automation drive market leadership. E-commerce giants and logistics firms are investing heavily in robotics, automated guided vehicles, and smart storage systems to meet growing fulfillment demands. Government initiatives promoting industrial digitalization and reshoring of production are further accelerating adoption. The presence of major automation providers and ongoing innovation in AI and IoT-enabled systems continue to enhance operational efficiency and system reliability.
Canada
Canada holds a 17.9% share of the North America automated material handling systems market in 2024, supported by expanding logistics, food processing, and automotive manufacturing sectors. Increasing investments in smart warehouse infrastructure and cold-chain automation drive market growth. The adoption of robotics and conveyor-based systems is gaining momentum as industries seek to improve productivity amid labor shortages. Moreover, government support for technology modernization and sustainable operations encourages integration of energy-efficient automation solutions. The growing e-commerce sector and cross-border trade activities further contribute to the rising demand for automated handling systems.
Mexico
Mexico accounts for a 8.5% share of the North America automated material handling systems market in 2024. The country’s growing industrialization, particularly in automotive and electronics manufacturing, is boosting automation deployment. Mexico’s strategic position as a nearshoring hub for U.S. companies has accelerated investment in advanced material handling technologies. Warehousing and logistics operators are increasingly adopting automated guided vehicles, sortation systems, and storage automation to enhance operational accuracy. Rising foreign direct investment, infrastructure development, and focus on improving supply chain efficiency are strengthening Mexico’s role in the region’s automation landscape.
Market Segmentations:
By Component
- Hardware
- Software
- Services
By System Type
- Unit Load Material Handling System
- Bulk Load Material Handling System
By Equipment Type
- Conveyor Systems
- Automated Storage and Retrieval Systems (AS/RS)
- Automated Guided Vehicles (AGVs)
- Others
By Function
- Storage
- Transportation
- Assembly
- Packaging
By Geography
- United States
- Canada
- Mexico
Competitive Landscape
The competitive landscape of the North America automated material handling systems market is defined by key players such as Daifuku Co., Ltd., Dematic (KION Group AG), Honeywell Intelligrated, SSI SCHÄFER Group, Toyota Material Handling, Swisslog Holding AG (KUKA AG), Murata Machinery, Ltd., Vanderlande Industries B.V. (KION Group AG), Bastian Solutions, LLC (Toyota Industries Corporation), and BEUMER Group. These companies compete through advanced automation technologies, product customization, and integrated software solutions. Strategic partnerships and mergers are helping expand their regional presence and service networks. Major players are investing heavily in robotics, AI, and IoT-enabled systems to enhance warehouse efficiency and real-time visibility. The focus on modular and scalable automation platforms supports customer flexibility across industries such as e-commerce, automotive, and food processing. Continuous innovation in energy-efficient designs and predictive maintenance solutions is further strengthening competitiveness in this fast-evolving automation landscape.
Shape Your Report to Specific Countries or Regions & Enjoy 30% Off!
Key Player Analysis
- Daifuku Co., Ltd.
- Dematic (KION Group AG)
- Honeywell Intelligrated
- SSI SCHÄFER Group
- Toyota Material Handling
- Swisslog Holding AG (KUKA AG)
- Murata Machinery, Ltd.
- Vanderlande Industries B.V. (KION Group AG)
- Bastian Solutions, LLC (Toyota Industries Corporation)
- BEUMER Group
Recent Developments
- In October 2024, Vanderlande Industries B.V. announced a collaboration with Hai Robotics to bring Automated Case‑Handling Mobile Robots (ACRs) into its Tote AV portfolio serving North America.
- In June 2024, Swisslog Holding AG (Americas HQ) announced the opening of a new Americas region headquarters in Atlanta, Georgia to support continued growth and extend its warehouse‑automation market position in North America.
- In May 2024, Toyota Material Handling North America broke ground on a nearly US$100 million expansion project in Columbus, Indiana, for a new factory dedicated to electric forklifts and material‑handling equipment production to support North American demand.
- In January 2024, Honeywell Intelligrated (USA) announced a collaboration with Hai Robotics to deliver flexible, high‑density storage & retrieval solutions in distribution centres, combining Hai’s robotics with Honeywell’s software and integration expertise.
Report Coverage
The research report offers an in-depth analysis based on Component, System Type, Equipment Type, Function and Geography. It details leading market players, providing an overview of their business, product offerings, investments, revenue streams, and key applications. Additionally, the report includes insights into the competitive environment, SWOT analysis, current market trends, as well as the primary drivers and constraints. Furthermore, it discusses various factors that have driven market expansion in recent years. The report also explores market dynamics, regulatory scenarios, and technological advancements that are shaping the industry. It assesses the impact of external factors and global economic changes on market growth. Lastly, it provides strategic recommendations for new entrants and established companies to navigate the complexities of the market.
Future Outlook
- Adoption of AI-driven and robotics-based automation will continue to accelerate across industries.
- Growth in e-commerce and last-mile delivery will fuel demand for advanced warehouse automation.
- Integration of IoT and cloud-based analytics will improve real-time monitoring and system performance.
- Robotics-as-a-Service (RaaS) models will make automation more accessible to small and medium enterprises.
- Manufacturers will invest in modular and scalable automation systems to enhance flexibility.
- Autonomous mobile robots and AGVs will see higher deployment in logistics and distribution centers.
- Energy-efficient and low-maintenance automation systems will gain preference across facilities.
- Nearshoring in Mexico will drive new opportunities in manufacturing automation.
- Predictive maintenance and AI-enabled analytics will reduce downtime and improve productivity.
- Collaboration between technology providers and logistics operators will strengthen innovation and regional market growth.


