Portable pumps keep diesel moving on farms and job sites
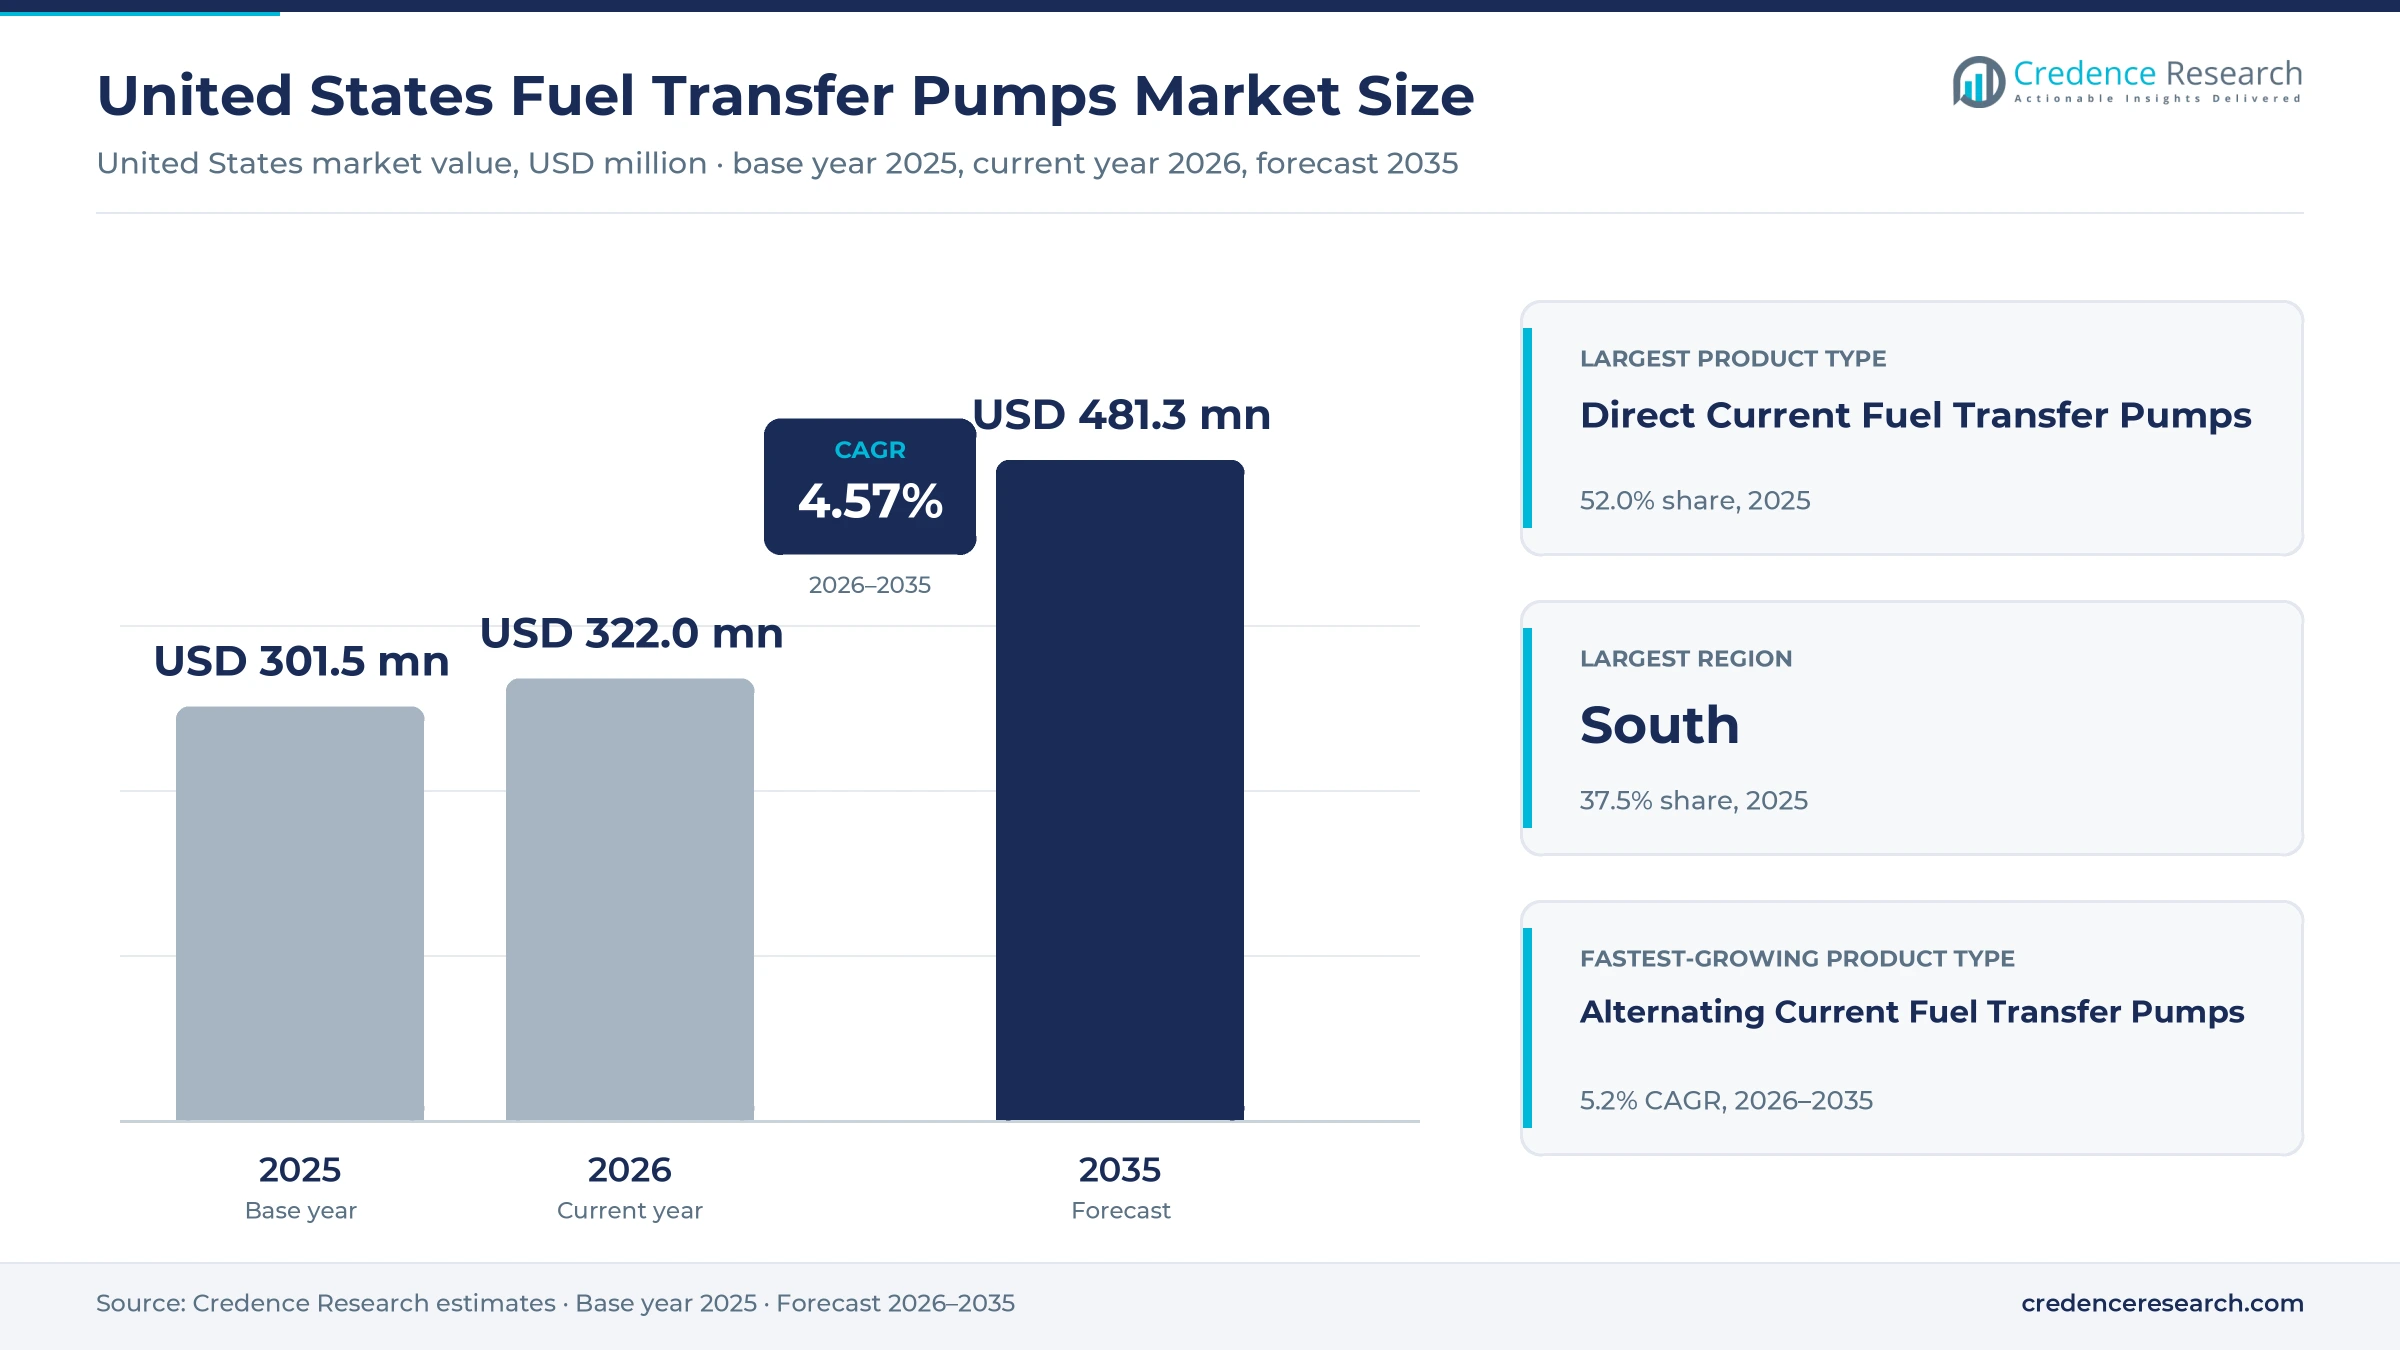
The United States fuel transfer pumps market was valued at USD 301.5 million in 2025 and is projected to increase from USD 322.0 million in 2026 to USD 481.3 million by 2035, registering a CAGR of 4.57% during 2026–2035. Demand comes from farms, trucking fleets, contractors, rental yards and oil field crews that refuel equipment away from retail stations. The South held the largest regional share, 37.5% in 2025, and it is also the fastest-growing region at 4.9% a year as Permian Basin activity and population growth add fuel handling sites. Most purchases replace worn 12-volt and 115-volt pumps on tanks that already exist, so buyers weigh price, flow rate and duty cycle against downtime. Section 232 duties on the steel and aluminum content of imported pumps and parts, widened in August 2025, are shifting the cost gap between domestic and imported units.
Diesel and gasoline transfer away from retail forecourts defines demand
The market counts the value of electric and hand-operated pumps that move diesel, gasoline, kerosene and biodiesel blends from storage tanks, drums and totes into vehicles, equipment and other tanks in the United States. It covers 12-volt and 24-volt DC pumps, 115-volt and 230-volt AC pumps and manual piston and rotary pumps, sold bare or as kits with hoses, nozzles and meters. Buyers include equipment owner-operators, equipment rental businesses and tank-system integrators across the country.
Retail forecourt dispensers, bulk truck and terminal pumps and engine fuel pumps are excluded. The value chain runs from motor, casting and vane suppliers through pump makers to industrial distributors, farm and equipment dealers and online marketplaces that serve buyers in every state.
United States Fuel Transfer Pumps Market Insights
- The United States fuel transfer pumps market grows from USD 301.5 million in 2025 to USD 481.3 million by 2035 at a 4.57% CAGR as farms and fleets replace worn pumps.
- The South held the largest regional share at 37.5% in 2025, supported by the Permian Basin, which produced 48% of U.S. crude oil that year.
- Direct Current Fuel Transfer Pumps led product types with 52.0% in 2025 because 12-volt units mount on pickups, service trucks and farm tanks.
- The Commerce Department added 407 tariff codes, including pump and pump-parts codes, to the Section 232 steel and aluminum derivative list on Aug. 18, 2025.
- Alternating Current Fuel Transfer Pumps grow fastest at 5.2% a year during 2026–2035 as fixed farm, fleet and generator tanks move to continuous-duty units.
12-volt pumps lead while AC units gain on fixed tanks
12-volt pumps lead as AC units grow on fixed tanks
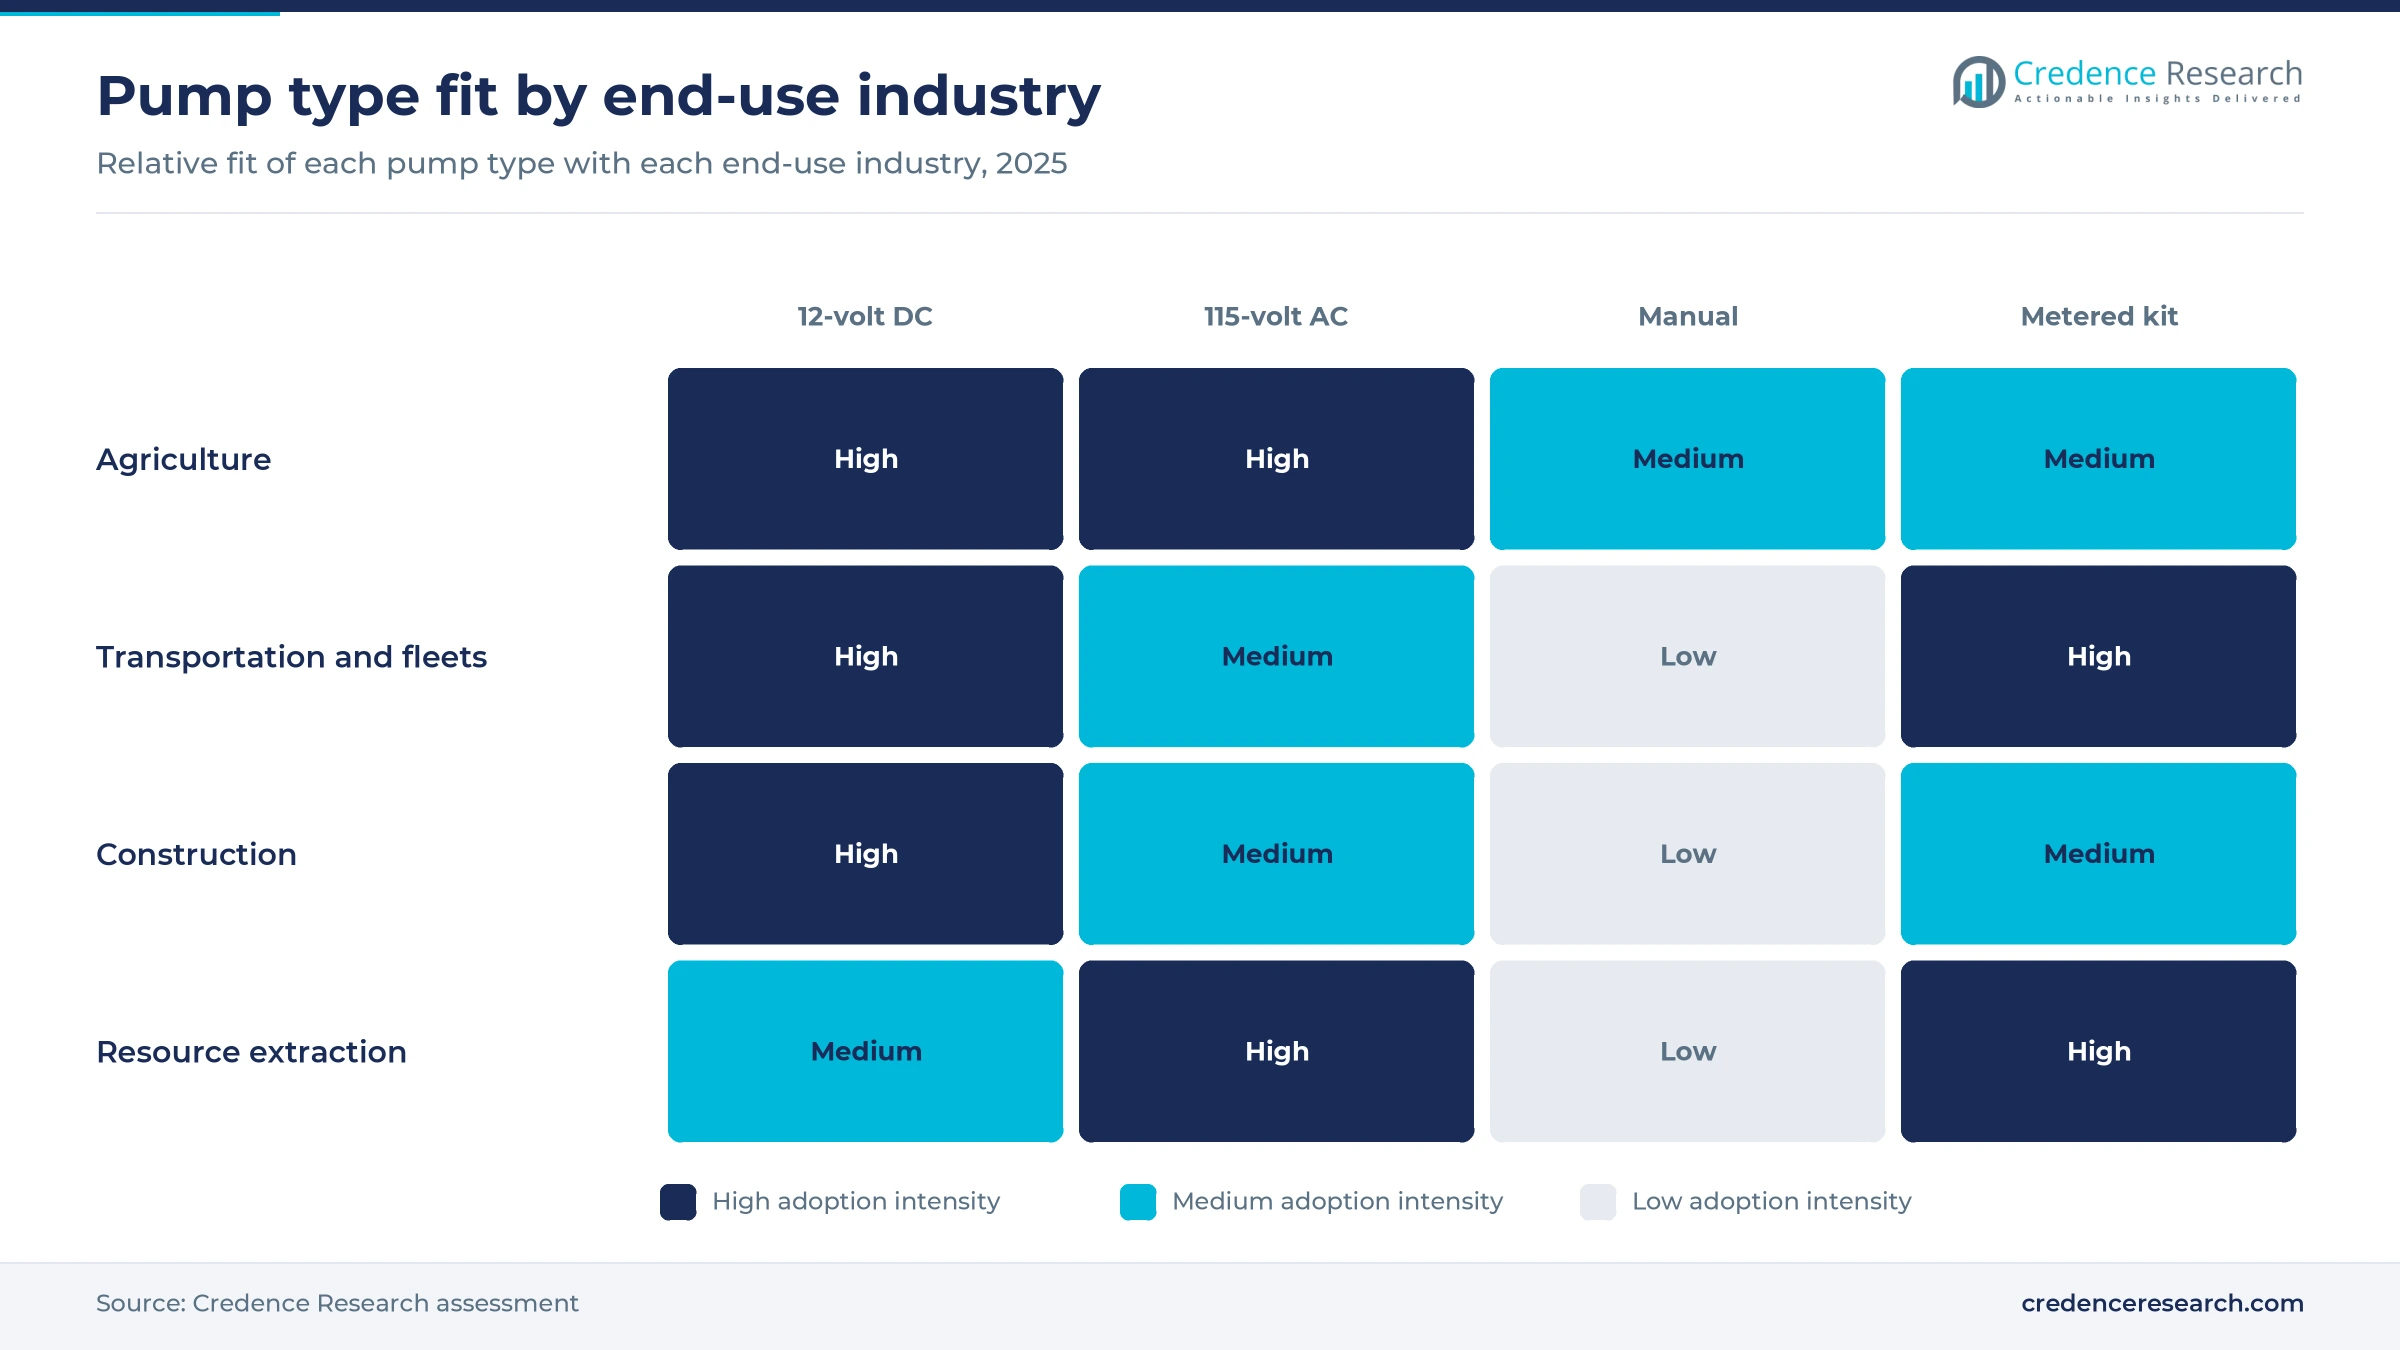
Based on product type, the market is categorized into direct current, alternating current and manual fuel transfer pumps. Direct Current Fuel Transfer Pumps led with 52.0% of 2025 value because they run from a vehicle battery, and, as the price table shows, 12-volt units cost about half as much as AC kits. Alternating Current Fuel Transfer Pumps grow fastest at 5.2% a year as fixed farm, fleet and generator tanks move to 115-volt units, which list at about twice the price of 12-volt units. AC pumps carry higher prices and longer duty cycles, which lifts value faster than units.
Farms lead while resource extraction grows fastest
Based on end-use industry, the market is categorized into transportation and fleet operations, construction, agriculture and resource extraction and ancillary operations. Agriculture led with 33.0% of 2025 value because most farms refuel tractors and combines from their own tanks, and U.S. farms spent USD 15.6 billion on fuel in 2025, according to the USDA. Resource Extraction and Ancillary Operations grows fastest at 5.3% a year as U.S. crude output reached a record and nonfuel mineral production rose 5.6% to about USD 112 billion in 2025, according to the USGS. Remote sites refuel haul trucks, pumps and generators from skid tanks.
Refueling leads as recovery and maintenance gain
Based on application, the market is categorized into vehicle and equipment refueling, tank-to-tank transfer, drum and tote decanting, and fuel recovery and maintenance. Vehicle and Equipment Refueling led with 48.0% of 2025 value because pickup beds, service trucks and farm tanks fuel machines where they work, so most pumps are bought as kits with hose, nozzle and meter for one tank. Fuel Recovery and Maintenance grows fastest at 5.7% a year as the EPA tank rule, in force since Oct. 13, 2018, requires overfill equipment checks and spill equipment tests every three years at regulated tank sites. Owners pump out, filter and refill tanks during those repairs.
Distributors lead while online marketplaces gain
Based on sales channel, the market is categorized into industrial distributors, agricultural and equipment dealers, manufacturer direct sales and third-party e-commerce. Industrial Distributors led with 36.0% of 2025 value because fleets and contractors buy pumps with filters, hoses and parts, and heavy-duty distributor Automann added the Fill-Rite line in August 2026. Third-Party E-Commerce grows fastest at 5.9% a year as Zoro and Global Industrial list GROZ pumps, alongside branded 115-volt units. Online listings make price comparison easy for farmers and small contractors.
| Segment Group | Leading Sub-segment | Share, 2025 | Fastest-growing Sub-segment | CAGR, 2026–2035 |
|---|---|---|---|---|
| By Product Type | Direct Current Fuel Transfer Pumps | 52.0% | Alternating Current Fuel Transfer Pumps | 5.2% |
| By End-Use Industry | Agriculture | 33.0% | Resource Extraction and Ancillary Operations | 5.3% |
| By Application | Vehicle and Equipment Refueling | 48.0% | Fuel Recovery and Maintenance | 5.7% |
| By Sales Channel | Industrial Distributors | 36.0% | Third-Party E-Commerce | 5.9% |
Duty cycle and meters set a USD 250 to USD 1,050 price range
U.S. buyers pay by flow rate, voltage and duty cycle, and the cheapest pump is rarely the cheapest to own. A 12-volt branded pump with a 30-minute duty cycle sits near USD 370 to USD 500 at farm retail, while continuous-duty 115-volt pumps for fixed tanks cost about twice that. A factory-fitted meter adds little to the price of an AC kit but lets fleets track gallons by machine. Imported 20-gallon 12-volt units sell near USD 216, which caps what branded makers can charge small buyers. Branded suppliers defend margins with UL listings, warranties and parts support, while price-led imports win one-off purchases online.
| Pump type | Typical price or fee | Basis |
|---|---|---|
| Manual rotary hand pump (Fill-Rite FR112) | USD 249.99 | Tractor Supply listing, November 2026 |
| 12-volt DC, 15 GPM (Fill-Rite FR1204H to FR1210H) | USD 369.99 to 499.99 | Tractor Supply listings, November 2026 |
| 12-volt DC, 20 GPM (GPI G20 series) | USD 499.99 to 749.99 | Tractor Supply listings, November 2026 |
| 115-volt AC, 20 GPM kit (Fill-Rite FR710VB) | USD 999.99 | Tractor Supply listing, November 2026 |
| 120-volt AC, 20 GPM with K90 meter (PIUSI Panther EX 72) | USD 1,053.95 | JME Sales listing, November 2026 |
| Imported 12-volt DC, 20 GPM (VEVOR) | USD 215.99 sale price | Tractor Supply listing, November 2026 |
Request a Free Sample
Fill in your details and we'll send you a free sample report.
- Sample data tables & charts
- Research methodology
Road work, fleet replacement and inspections lift orders
Highway and site work keeps diesel equipment running
Public road and bridge projects keep excavators, pavers and generators running on job sites that are refueled from tanks and service trucks. The Census Bureau put public highway and street construction at a USD 150.6 billion annual rate in August 2026, up 4.4% from a year earlier. The Bridge Formula Program received USD 5.5 billion a year from fiscal 2022 through 2026, according to NACo. The American Rental Association expects U.S. equipment rental revenue to rise 3.4% to USD 83.5 billion in 2026, and construction equipment rental fleets fit transfer pumps on fuel trailers and tanks they hire out. Construction holds a steady share of pump demand, but its pace follows federal funding decisions.
Worn pumps on dispersed tanks set the replacement cycle
Most U.S. demand comes from replacing worn pumps on tanks spread across farms, fleet yards and small businesses, rather than from new tank sites. The USDA found that U.S. farms spent USD 15.6 billion on fuels in 2025, 3.2% of USD 490.3 billion in total production expenditures. EPA set the farm spill-plan threshold at 2,500 gallons of aboveground storage, which exempts more than 80% of farms, according to USA Rice, so most farm tanks are small units with their own pumps. Buyers with agricultural equipment to fuel tend to replace a failed pump within days, which keeps demand steady even when farm income is weak.
Tank inspections and enforcement force equipment repairs
Inspections of fuel tanks often end with repairs that include new pumps, hoses and nozzles. EPA reported a technical compliance rate of 62.9% at federally regulated underground tank sites in fiscal 2025. In January 2025, the Iowa 80 and Joplin 44 truck stops signed an agreement to pay USD 390,784 over spill-plan violations found in earlier inspections, and both completed tank inspections and repairs, according to Insurance Journal. EPA also reached a consent agreement with an Alaska bulk plant in September 2025 over containment and piping findings. Each enforcement case raises the cost of delay, so owners replace leaking or outdated transfer equipment sooner.
Record oil output and mining keep remote sites busy
Oil fields and mines run large fleets far from retail stations, so they depend on skid tanks and transfer pumps. The EIA reported that U.S. crude oil production averaged a record 13.6 million barrels a day in 2025, up about 3% from 2024. The Permian Basin produced 6.6 million barrels a day, or 48% of the national total, according to the same report. Drilling pads, frac sites and gathering yards each keep their own fuel tanks, which multiplies the pumps each operator owns. Resource Extraction and Ancillary Operations grows at 5.3% a year, the fastest end-use rate, because these sites need continuous-duty pumps and frequent replacement.
Metered pumps and backup power open new demand
Metered pumps rise as fleets track every gallon
Fleets and farms are moving from basic pumps to metered kits, because diesel is a large cost they now want to assign to each machine. The price table shows a metered PIUSI AC kit costing only about 5% more than an unmetered Fill-Rite AC kit, so the meter is no longer a budget decision. Fill-Rite sells 800 and 900 Series mechanical meters and TN620 and TN860 digital meters alongside its pumps, according to its catalog. Great Plains Industries pairs its GPI and GPRO pumps with FLOMEC meters made in Australia. Flow meters therefore move from accessory to standard part, which lifts value per sale.
Battery and low-flow pumps spread for drums and totes
Small cordless pumps are emerging for drums, totes and small tanks where a 12-volt cable or outlet is not handy. Fill-Rite lists its FRBPA battery-powered pump at up to 3.8 gallons per minute, powered by four AA cells or USB-C, as coming soon. Tractor Supply also sells battery-powered 2.4-gallon pumps from Deway at entry-level prices that pull casual buyers online. Macnaught USA announced in October 2025 that it would show its battery-operated BOP pump for oils, DEF and coolants in 5-, 16- and 55-gallon containers at AAPEX 2025. Drum and Tote Decanting stays a smaller share of U.S. demand, but cordless units widen the buyer base beyond farms and fleets to workshops, marinas and landscapers.
Backup-power fueling at data centers opens a new niche
Data centers and other critical sites give pump makers an opening, because their standby generators need fuel delivered, transferred between tanks and polished. Gorman-Rupp said in August 2026 that backup-generator fueling and construction-equipment fueling at data centers were sources of demand for its pumps. Facilities storing 1,320 gallons or more of oil in aboveground tanks must keep spill plans with inspections and integrity testing, according to Insurance Journal, a rule that reaches many generator sites. Fuel Recovery and Maintenance grows at 5.7% a year, the fastest application rate. Suppliers that sell AC pumps, filters and meters for diesel generators gain repeat service work as each site tests and refreshes its stored fuel.
U.S.-made pumps can win share as import costs rise
Domestic makers have an opportunity to take share from imports, because the metal duties described below now weigh on pumps built abroad. Fill-Rite builds pumps and meters in Fort Wayne, Indiana and Lenexa, Kansas, according to Gorman-Rupp, which bought the brand in 2022. Great Plains Industries manufactures and engineers its 12-volt DC and dual-voltage AC GPI and GPRO pumps in Wichita, Kansas and its GPRO V20 delivers 20 gallons per minute at up to 25 psi for large equipment. Gorman-Rupp said in August 2026 that its U.S.-centric supply chain helped it hold a record gross margin despite tariffs. Buyers who value quick parts supply and warranty service are likely to favor these domestic brands as import prices rise.
Tariffs, cheap imports and funding gaps squeeze margins
Steel and aluminum duties raise imported pump costs
Duties on metal content have raised the landed cost of imported pumps and parts. The Commerce Department added 407 tariff codes to the Section 232 derivative list from Aug. 18, 2025, including other pumps under subheading 8413.81.00 and three pump-parts lines under 8413.91. Importers must now declare and pay duties on steel and aluminum content, which adds paperwork as well as cost. Importers of finished pumps face the largest effect, while domestic makers still pay more for imported motors and castings.
Low-cost online imports cap branded prices
Generic imports sold online undercut branded U.S. pumps on price. The imported 20-gallon unit in the price table sells for less than half the price of a branded 15-gallon 12-volt pump at the same retailer. Occasional users often choose the cheaper unit, even when duty cycles and listings differ. Under that price pressure, branded makers must defend price with warranty, UL listing and parts supply, or they lose low-volume buyers.
Slower building activity weighs on contractor demand
Slower private building delays pump purchases by contractors and rental fleets. Total U.S. construction spending fell 3.1% in the first eight months of 2026 from a year earlier, according to the Census Bureau, even as highway work rose. The American Rental Association said in May 2026 that construction equipment rental was growing more slowly because construction activity was stagnant. Rental yards hold off on new fuel trailers, which defers pump replacement.
Federal highway funding faces a reauthorization gap
Uncertain federal funding could slow the road work that supports contractor fuel use. Program authorities under the Infrastructure Investment and Jobs Act expired on Sept. 30, 2026, according to NACo. A Senate Appropriations Committee proposal passed on Aug. 8, 2026 would extend many programs to Dec. 11, 2026 but not the advance appropriations that funded 15% of guaranteed highway, bridge, transit and safety money. States may delay new contracts until a new bill passes.
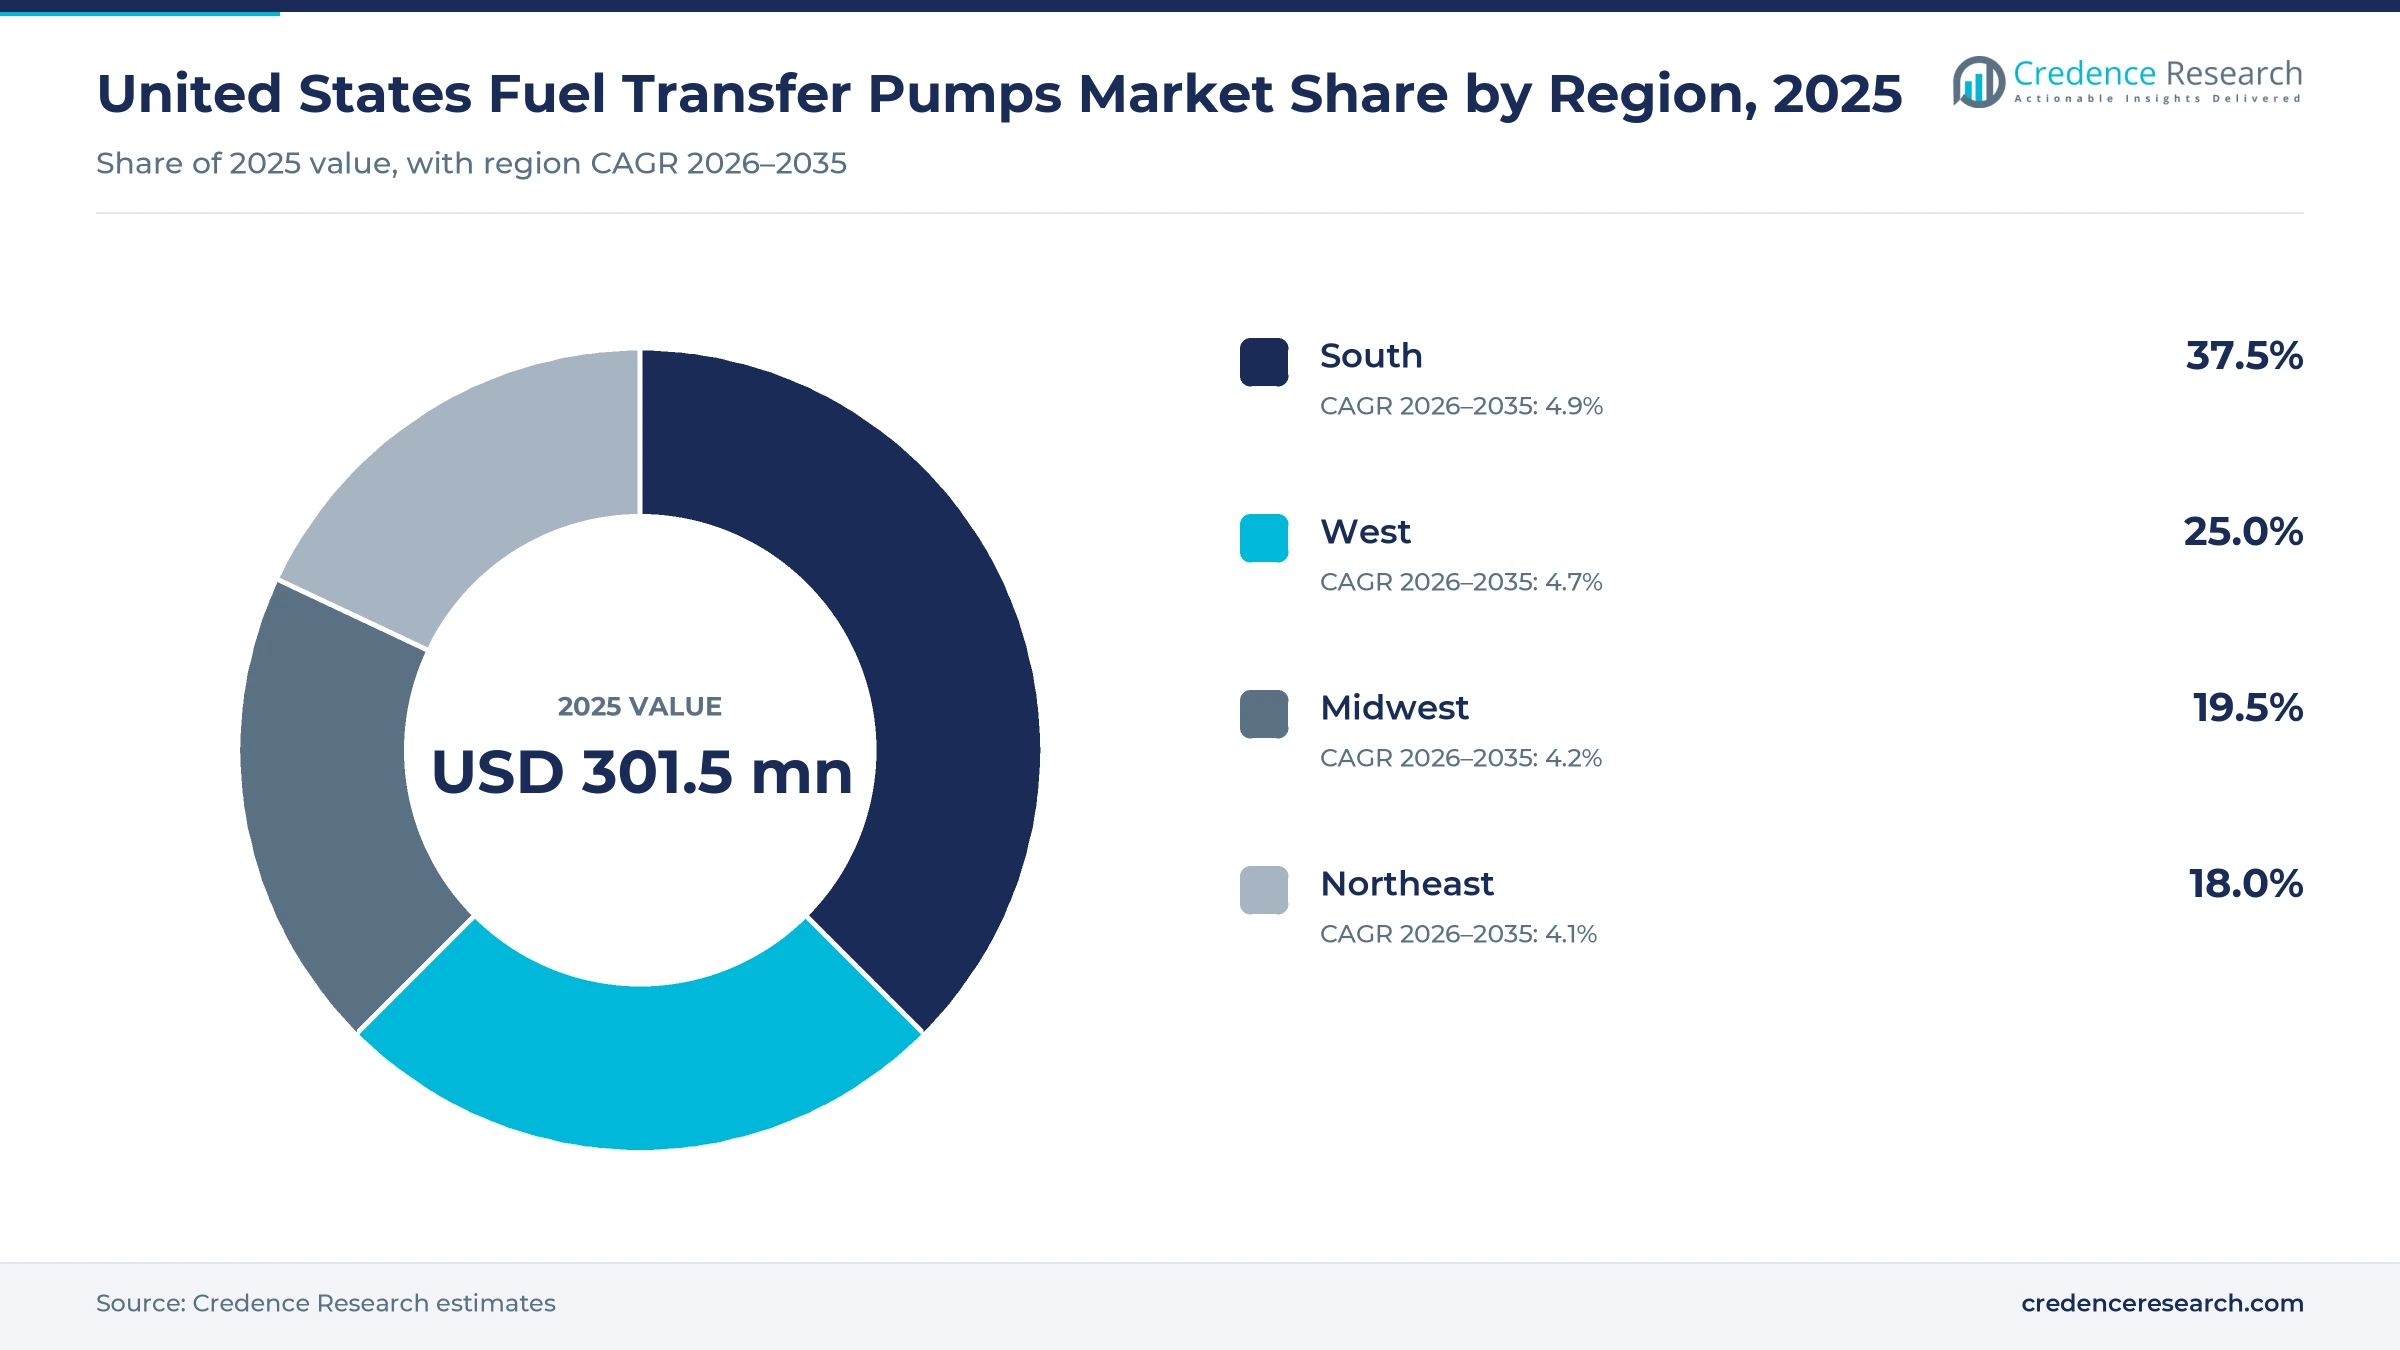
The South leads on oil fields and population growth
| Region | Value, 2025 (USD million) | Share, 2025 | CAGR, 2026–2035 |
|---|---|---|---|
| South | 113.1 | 37.5% | 4.9% |
| West | 75.4 | 25.0% | 4.7% |
| Midwest | 58.8 | 19.5% | 4.2% |
| Northeast | 54.3 | 18.0% | 4.0% |
The South leads on oil fields and fast population growth
The South held 37.5% of 2025 value and grows at 4.9% a year, the fastest of the four regions. Texas holds most of the Permian Basin, which accounts for nearly half of U.S. crude output, so skid tanks and service trucks there replace pumps often. The region's population grew 6.0% from April 2020 to July 2025, nearly double the national 3.1%, according to the Census Bureau. New suburbs add road, utility and site work that runs on diesel equipment.
The West draws demand from mines and large farms
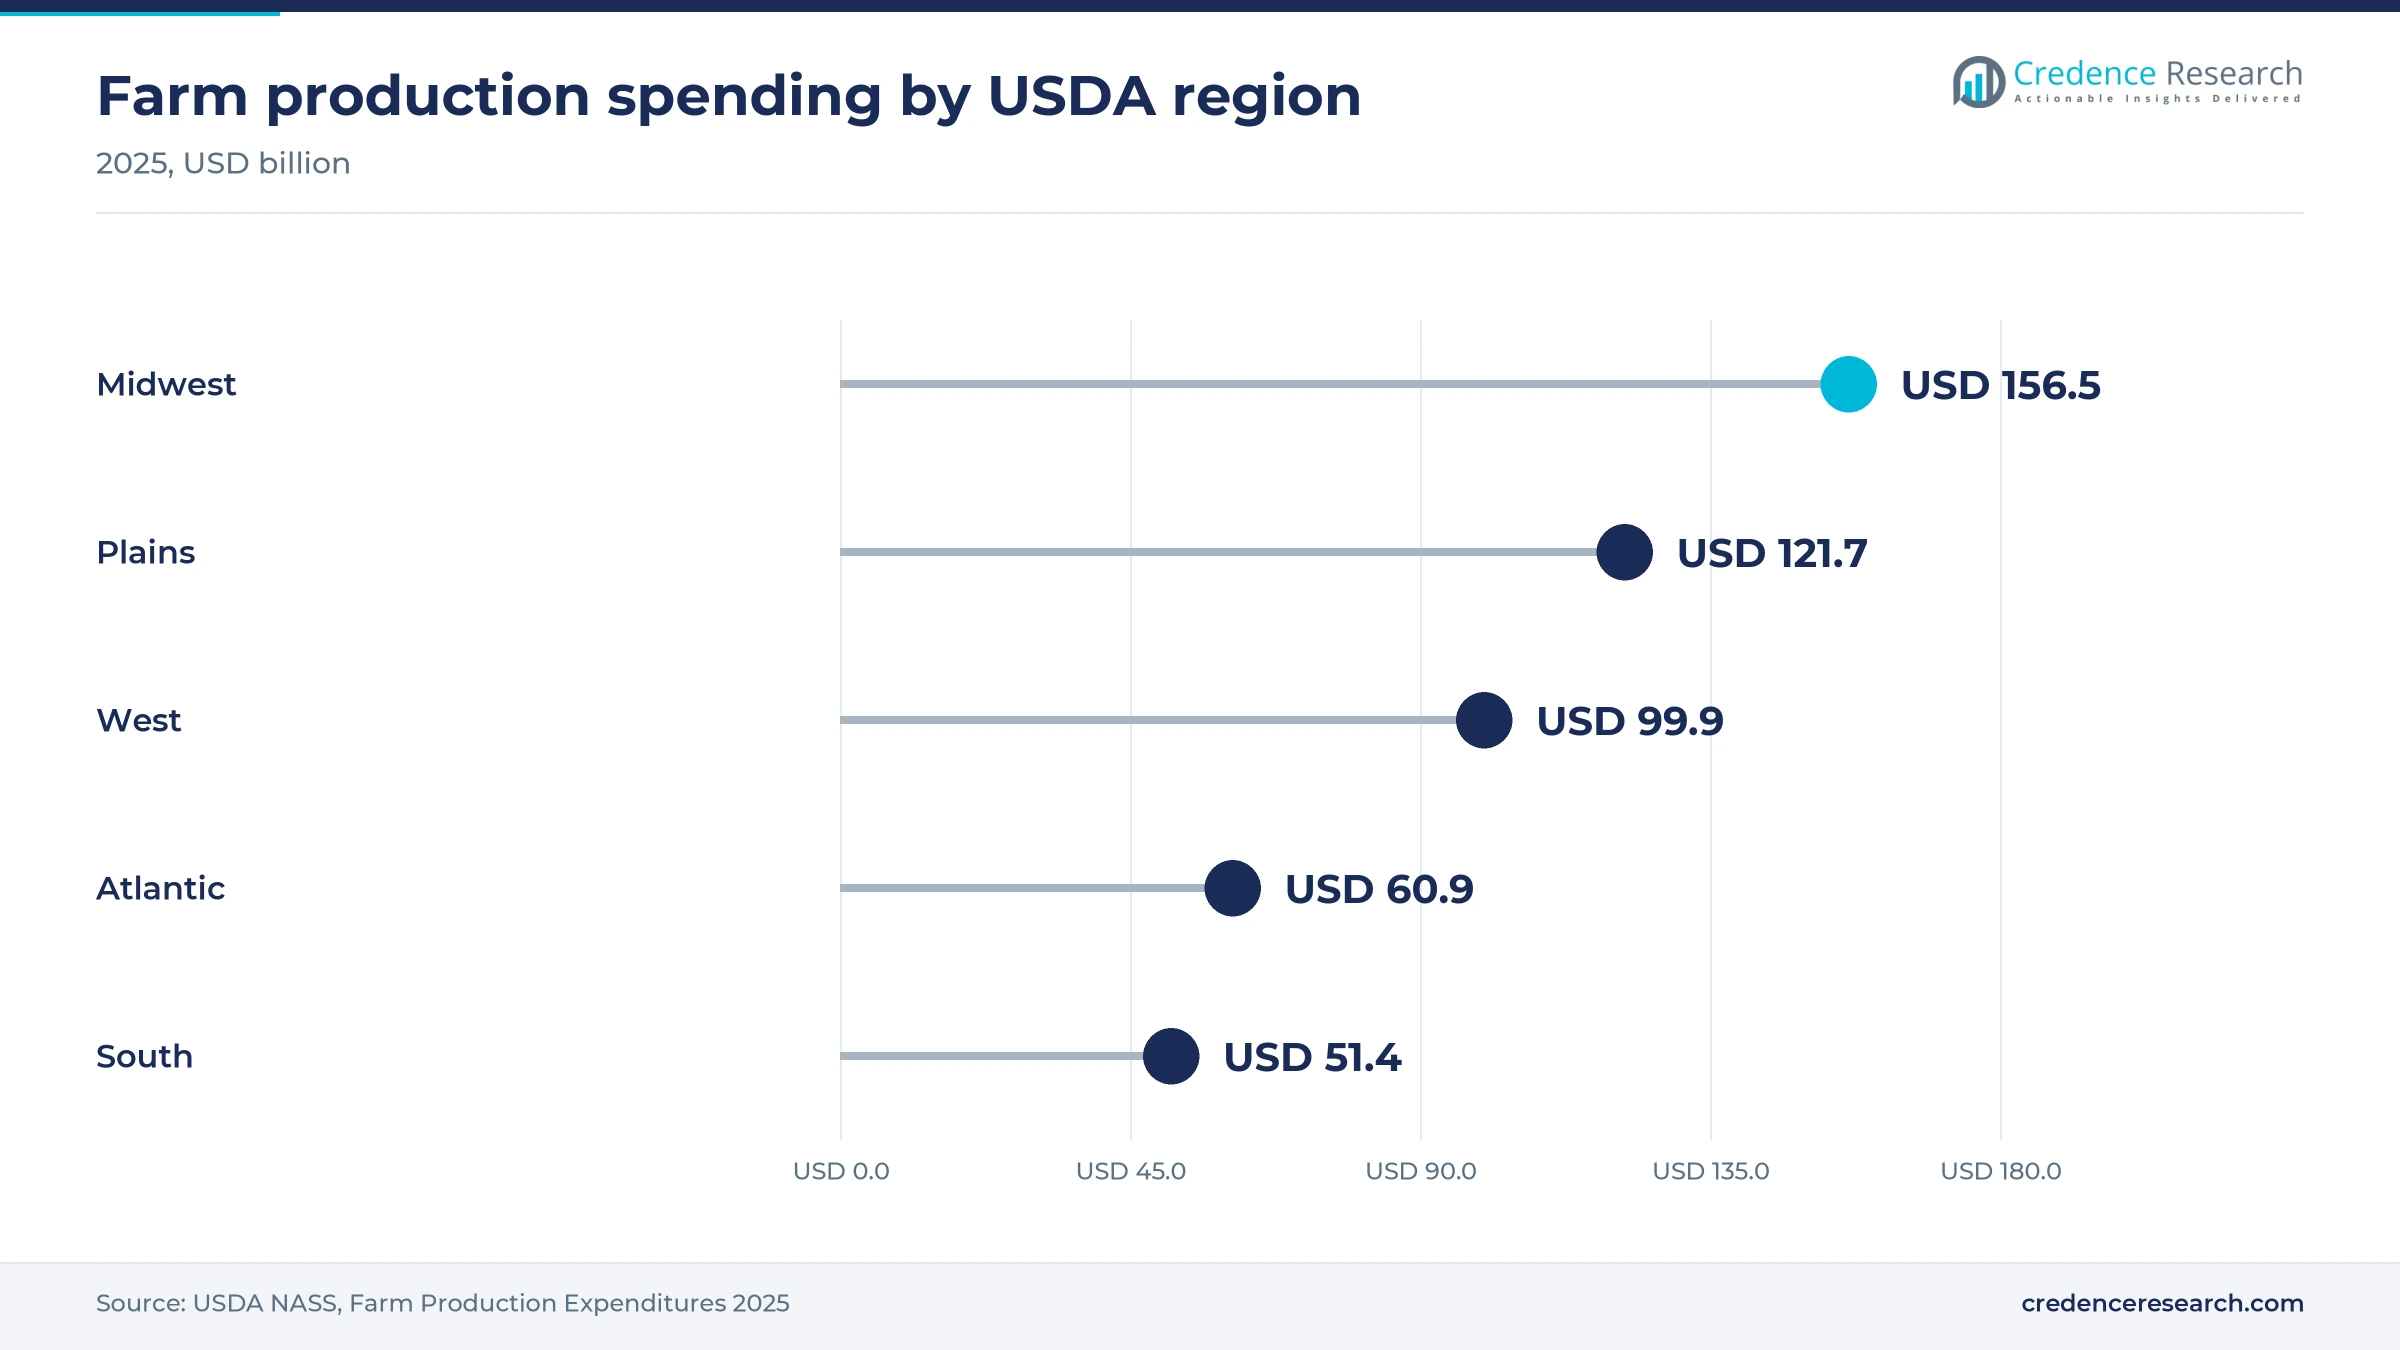
The West held 25.0% of 2025 value and grows at 4.7% a year. Nevada was the top producer of nonfuel minerals by value in 2025 and Arizona moved into second place on copper, gold and silver, according to the USGS. Mines in both states run haul trucks and generators that are refueled on site. However, farm production spending in the West fell 7.7% in 2025, according to the USDA, which slows replacement on farms.
The Midwest holds the largest farm fuel base
The Midwest held 19.5% of 2025 value and grows at 4.2% a year, below the national rate. The USDA put Midwest farm production spending at USD 156.5 billion in 2025, or 31.9% of the national total, up 4.8% from 2024. Corn and soybean farms refuel tractors and combines from on-farm tanks during short planting and harvest windows. The region's population grew only 1.1% from April 2020 to July 2025, according to the Census Bureau, so farm and road work rather than new households set the pace of replacement.
The Northeast depends on heating oil and road work
The Northeast held 18.0% of 2025 value and grows at 4.0% a year, the slowest of the four regions. Oil heats about 3% of U.S. homes, mostly in the Northeast, and the EIA forecast in October 2026 that heating oil would cost 34% more this winter. Oil dealers and building owners use transfer pumps for tank-to-tank moves and recovery. The region grew only 0.7% in population from 2020 to 2025, which limits new site work.
Tariff rules and new distribution reshape supply
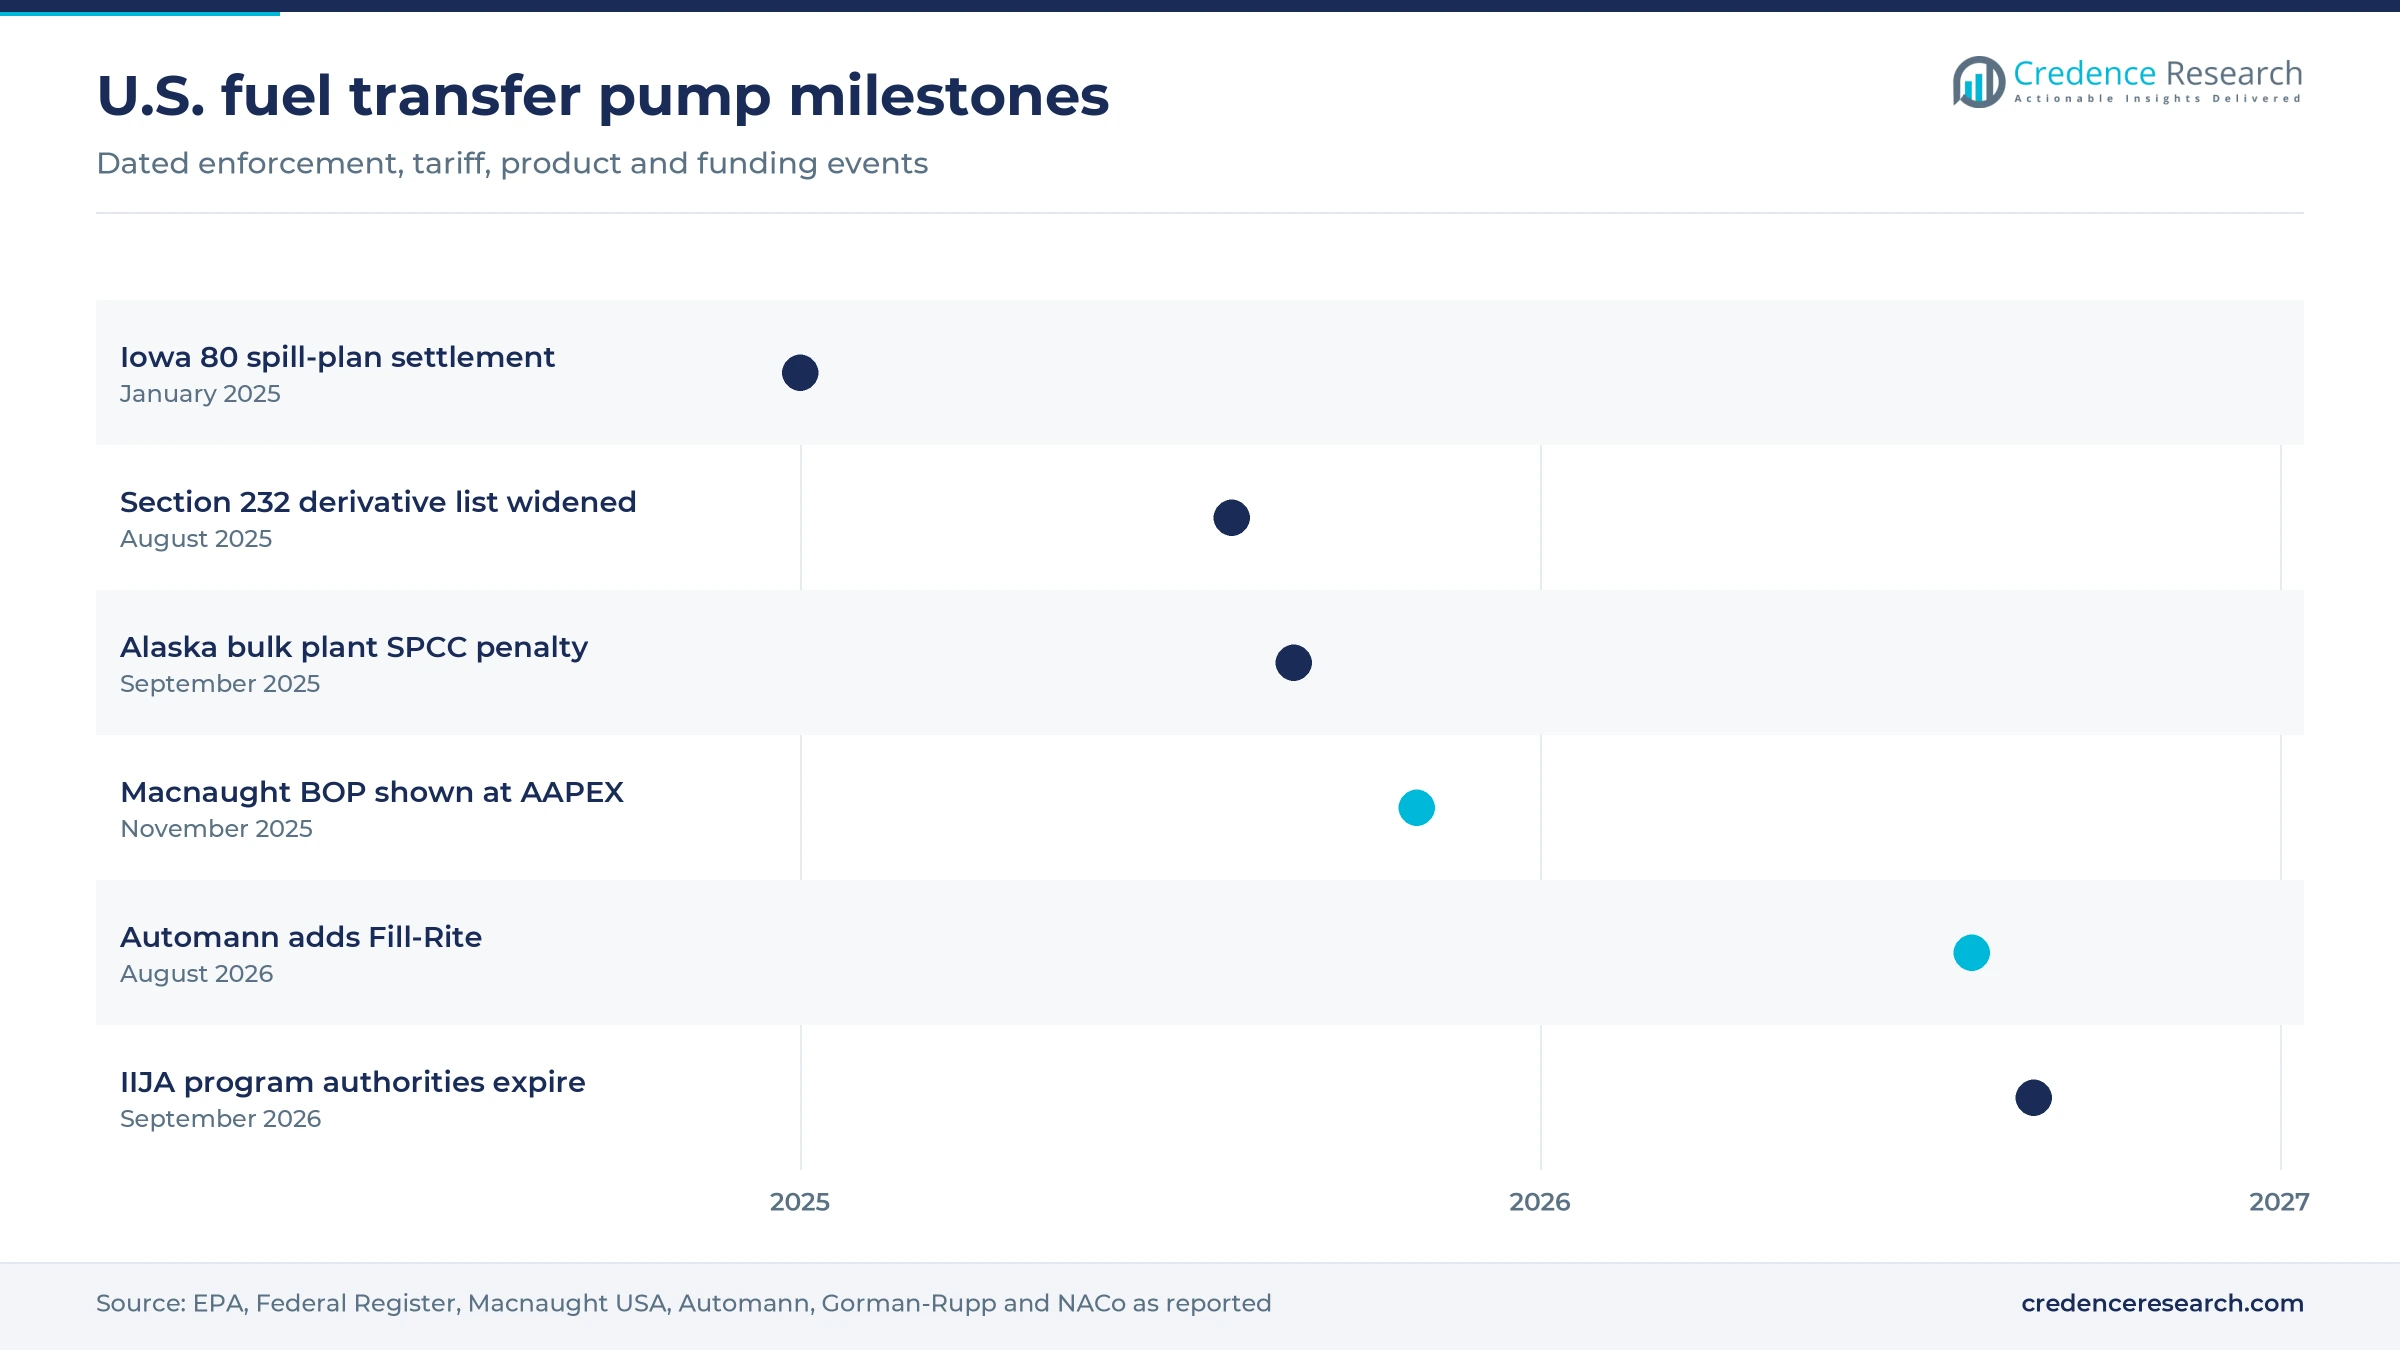
| Development | Status and market relevance |
|---|---|
| In January 2025, the Iowa 80 and Joplin 44 truck stops agreed to pay USD 390,784 to settle EPA spill-plan violations. | Settled; repairs completed |
| In August 2025, the Commerce Department added 407 tariff codes, including pump and pump-parts codes, to the Section 232 derivative list. | In force; raises import costs |
| In October 2025, Macnaught USA announced it would show its battery-operated BOP pump at AAPEX 2025 in Las Vegas. | Shown; widens cordless range |
| In August 2026, heavy-duty distributor Automann expanded its portfolio with Fill-Rite DC and AC transfer pumps and accessories. | Live; widens distributor reach |
Meters and controls turn pumps into tracking tools
- Basic transfer pumps use rotary vane designs with 30-minute or continuous duty cycles and cover most farm and pickup-truck purchases.
- Meter-integrated transfer pumps add mechanical or digital meters, such as Fill-Rite's TN620 and TN860 or the PIUSI K90, so each fill is counted.
- Control-ready transfer pumps connect to tank monitors and fuel management systems, and Fill-Rite lists a TankDefender monitor among its accessories.
- Cold-rated and biofuel-ready pumps handle gasoline blends up to E15 and diesel blends up to B20, and GPI rates its GPRO XT models for use down to minus 40 degrees.
Need a Custom Version of This Report?
Tailor the scope, geography, or segments to your exact requirements.
- Custom geography or segment scope
- Direct access to our analyst team
Midwest makers face Italian, Australian and Indian rivals
Competition in the U.S. market turns on duty cycle, listings, distribution and price. Fill-Rite, owned by Gorman-Rupp, offers the widest range of DC, AC and hand pumps with meters and accessories, and it expanded heavy-duty distribution when Automann added the line in 2026. Great Plains Industries competes with GPI and GPRO pumps and FLOMEC meters, and it targets large equipment fueling with cold-rated and E15-approved models. PIUSI sells metered AC pumps such as the Panther EX 72 through U.S. distributors, which suits fleets that track fuel use. Macnaught USA adds fuel and lubrication equipment, while GROZ supplies low-priced AC and hand pumps through online industrial channels. Buyers often switch brands at replacement time, so parts supply and warranty service decide loyalty more than first price.
Two Midwest brands anchor a market with many niche rivals
U.S. supply is moderately concentrated at the branded end and fragmented at the low end. Fill-Rite and Great Plains Industries make pumps in the Midwest and sell through the same farm stores, distributors and online channels, while PIUSI and Macnaught bring Italian and Australian designs and GROZ adds Indian-made value pumps. Barriers lie in UL listings, dealer shelf space and parts networks rather than in factories. Margins sit with brands that bundle pumps, meters and nozzles, while unbranded imports compete only on price.
Companies profiled and their roles in this market
| Company | Type | Role in the market |
|---|---|---|
| Fill-Rite Company (Gorman-Rupp) | Full-line supplier | DC, AC and hand fuel transfer pumps, meters and nozzles made in Indiana and Kansas |
| Great Plains Industries | Full-line supplier | GPI and GPRO transfer pumps and FLOMEC meters built in Wichita |
| PIUSI | Specialist | Metered AC and DC transfer pumps such as the Panther EX 72 |
| Macnaught | Specialist | Fuel and lubrication pumps and meters through Macnaught USA |
| GROZ Engineering Tools | Value supplier | Low-priced AC, DC and hand fuel pumps sold through U.S. online channels |
Replacement cycles, not new fleets, carry growth to 2035
Credence Research's view is that U.S. fuel transfer pump demand will grow mainly through replacement and upgrading rather than through new tank sites. Buyers on farms and in fleets will keep paying for branded 12-volt pumps they trust, but more of them will choose metered AC units for fixed tanks to track diesel costs. Domestic makers hold an advantage while tariffs raise import costs, though they must still answer cheap online imports. Alternating Current Fuel Transfer Pumps, growing at 5.2% a year, will gain the most share. Suppliers that pair pumps with meters, filters and fast parts supply are best placed to win repeat orders.
Federal statistics and listed prices anchor the model
The report uses 2025 as the base year and 2026 to 2035 as the forecast period. Market values come from the Credence Research model, which measures the value of electric and manual fuel transfer pumps and kits sold in the United States at manufacturer selling prices. Segment and regional splits are Credence Research estimates built from Census Bureau construction and population data, USDA farm spending, EIA and USGS output data, EPA tank records, company releases and listed retail prices. No interviews or primary surveys were conducted for this edition of the report.
Metered and AC pumps gain share through 2035
The United States fuel transfer pumps market is expected to grow from USD 322.0 million in 2026 to USD 481.3 million by 2035 at a 4.57% CAGR. Replacement of worn pumps on farms, fleet yards and job sites will remain the base of U.S. demand through the forecast period. Alternating current pumps and metered kits will gain share as owners of fixed tanks track fuel by machine. The South will add the most value as oil field and site work grows. By 2035, branded suppliers that combine domestic production, meters and parts service are likely to hold the strongest positions.
Funding and replacement timing set the 2035 range
Outcomes to 2035 depend on how quickly federal road funding is renewed and on how long buyers stretch the life of worn pumps. A downside case assumes a long reauthorization gap, weak farm income and cheaper imports that pull value down. The base case assumes steady replacement and a gradual shift to metered AC pumps. An upside case needs a fully funded highway bill, faster data center construction and tighter tank inspections that speed repairs.
| Scenario | CAGR, 2026–2035 | Value, 2035 | What has to hold |
|---|---|---|---|
| Downside | 3.1% | USD 422.7 million | Highway funding lapses, farm income stays weak and low-cost imports take more volume |
| Base | 4.57% | USD 481.3 million | Replacement cycles hold and metered AC pumps gain share gradually |
| Upside | 5.8% | USD 533.5 million | A new highway bill passes and backup-power and inspection work speed purchases |
Frequently Asked Questions
How big is the United States fuel transfer pumps market?
Which product type leads the U.S. market?
Which product type grows fastest?
Which U.S. region leads the market?
What do U.S. buyers pay for a fuel transfer pump?
How do tariffs affect the U.S. market?
Who are the key companies in the United States fuel transfer pumps market?
Which application grows fastest?
Table of Content
Chapter 1 Market Segmentation
- 1.1 Segmentation Framework
- 1.1.1 Product and Service Classification
- 1.1.2 Application and End-Use Classification
- 1.1.3 Technology and Solution Classification
- 1.1.4 Customer and Distribution Channel Classification
- 1.1.5 Geographic Segmentation
- 1.1.6 Market Segment Definitions and Boundaries
- 1.2 By Product Type
- 1.2.1 Direct Current Fuel Transfer Pumps
- 1.2.2 Alternating Current Fuel Transfer Pumps
- 1.2.3 Manual Fuel Transfer Pumps
- 1.3 By End-Use Industry
- 1.3.1 Agriculture
- 1.3.2 Transportation and Fleet Operations
- 1.3.3 Construction
- 1.3.4 Resource Extraction and Ancillary Operations
- 1.4 By Application
- 1.4.1 Vehicle and Equipment Refueling
- 1.4.2 Tank-to-Tank Transfer
- 1.4.3 Drum and Tote Decanting
- 1.4.4 Fuel Recovery and Maintenance
- 1.5 By Sales Channel
- 1.5.1 Industrial Distributors
- 1.5.2 Agricultural and Equipment Dealers
- 1.5.3 Third-Party E-Commerce
- 1.5.4 Manufacturer Direct Sales
Chapter 2 Introduction
- 2.1 Report Objectives and Scope
- 2.2 Product Definition and Industry Terminology
- 2.3 Market Inclusions and Exclusions
- 2.4 Research Process
- 2.4.1 Primary Research and Expert Interviews
- 2.4.2 Secondary Research and Source Review
- 2.4.3 Top-Down and Bottom-Up Estimation
- 2.4.4 Data Triangulation and Verification
- 2.5 Market Size Measurement Basis
- 2.5.1 2025: USD 301.5 million → 2035: USD 481.3 million
- 2.6 Historical and Forecast Reference Periods
- 2.6.1 Historical Period: 2018-2025
- 2.6.2 Base Year: 2025
- 2.6.3 Forecast Period: 2025-2035
- 2.7 Research Assumptions and Limitations
Chapter 3 Executive Summary
- 3.1 Market Snapshot and Key Findings
- 3.2 Base-Year Market Size, 2025
- 3.3 Forecast Market Size, 2035
- 3.4 Revenue and Volume Growth Outlook
- 3.5 Key Demand and Supply Indicators
- 3.6 Leading Market Segments
- 3.7 Fastest-Growing Market Opportunities
- 3.8 Regional Performance Highlights
- 3.9 Technology and Industry Transformation
- 3.10 Competitive Landscape Summary
- 3.11 Analyst View and Strategic Implications
Chapter 4 United States Fuel Transfer Pumps Market Trends and Developments
- 4.1 Historical Industry Development, 2018-2025
- 4.2 Recent Market Trends and Developments
- 4.3 Demand and Customer Behavior Trends
- 4.4 Technology and Product Innovation
- 4.5 Artificial Intelligence, Automation and Digitalization
- 4.6 Local Manufacturing and Supply Chain Realignment
- 4.7 Industry Partnerships, Mergers and Acquisitions
- 4.8 Sustainability and Circular Economy Developments
- 4.9 Government and Private Sector Investment Trends
- 4.10 Emerging Business Models and Commercialization
- 4.11 Industry Developments and Announcements
Chapter 5 United States Fuel Transfer Pumps Market Production, Supply and Demand Analysis
- 5.1 Demand Trend and Consumption Analysis, 2018-2025
- 5.2 Demand Forecast, 2025-2035
- 5.3 Production and Output Trend, 2018-2025
- 5.4 Production and Output Forecast, 2025-2035
- 5.5 Installed Capacity and Capacity Utilization
- 5.6 Company-Wise Production Plants and Statistics
- 5.6.1 Installed Production Capacity
- 5.6.2 Actual Production
- 5.6.3 Planned Capacity and Expansion Targets
- 5.7 Supply Chain Structure and Procurement Trends
- 5.8 Supply-Demand Gap and Bottlenecks
- 5.9 Import Dependence and Sourcing Structure
- 5.10 Contract Manufacturing and Outsourcing
- 5.11 Regional Supply and Demand Concentration
Chapter 6 United States Fuel Transfer Pumps Market Pricing Analysis
- 6.1 Pricing Structure and Measurement
- 6.2 Historical Pricing Trends, 2018-2025
- 6.3 Pricing Outlook, 2025-2035
- 6.4 Average Selling Price and Unit Economics
- 6.5 Pricing by Product and Market Segment
- 6.6 Geographic Pricing Differences
- 6.7 Key Input, Energy, Labor and Logistics Costs
- 6.8 Contract Pricing and Purchasing Models
- 6.9 Pricing Sensitivity and Competitive Positioning
- 6.10 Price, Margin and Profitability Implications
Chapter 7 United States Fuel Transfer Pumps Market Dynamics
- 7.1 Market Growth Drivers
- 7.1.1 Demand-Side Drivers
- 7.1.2 Technology and Innovation Drivers
- 7.1.3 Infrastructure and Investment Drivers
- 7.1.4 Regulatory and Policy Drivers
- 7.2 Market Restraints
- 7.2.1 Cost and Affordability Constraints
- 7.2.2 Technology and Adoption Barriers
- 7.2.3 Supply Chain and Operational Constraints
- 7.3 Market Challenges
- 7.3.1 Competitive Pressure and Margin Erosion
- 7.3.2 Skills, Infrastructure and Implementation Gaps
- 7.4 Emerging Market Opportunities
- 7.5 Market Dynamics Impact and Time-Horizon Assessment
Chapter 8 United States Fuel Transfer Pumps Value Chain Analysis
- 8.1 Industry Value Chain Overview
- 8.2 Upstream Suppliers and Critical Inputs
- 8.3 Technology and Component Providers
- 8.4 Manufacturing or Service Delivery
- 8.5 Distribution, Channel Partners and Integrators
- 8.6 Downstream Applications and End Users
- 8.7 Value Addition and Profit Pools
- 8.8 Vertical Integration and Outsourcing
- 8.9 Supplier Concentration and Risk
- 8.10 Supply Chain Localization and Resilience
Chapter 9 United States Fuel Transfer Pumps Market Regulations and Policies
- 9.1 Relevant Laws, Standards and Compliance Frameworks
- 9.2 Product, Service, Safety and Quality Requirements
- 9.3 Government Policies, Incentives and Subsidies
- 9.4 Imports, Exports and Trade Barriers
- 9.5 Public Procurement and Local Content Requirements
- 9.6 Environmental and Sustainability Compliance
- 9.7 Upcoming Policy Changes and Market Implications
Chapter 10 United States Fuel Transfer Pumps Market Hotspots and Opportunities
- 10.1 Market Opportunity Mapping and Growth Hotspots
- 10.2 High-Growth Applications and Customer Groups
- 10.3 Underserved Markets and White-Space Opportunities
- 10.4 Emerging Technology and Product Opportunities
- 10.5 New Capacity and Investment Hotspots
- 10.6 Market Entry and Expansion Opportunities
- 10.7 Distribution and Partnership Opportunities
- 10.8 Near-Term and Long-Term Commercial Potential
- 10.9 Opportunity Attractiveness and Execution Risks
Chapter 11 United States Fuel Transfer Pumps Market Outlook, 2025-2035
- 11.1 Market Size and Analysis
- 11.1.1 Revenue (Market Measurement: 2025: USD 301.5 million → 2035: USD 481.3 million)
- 11.1.2 Market Volume and Quantity Sold
- 11.1.3 Historical Market Size, 2018-2025
- 11.1.4 Base-Year Market Size, 2025
- 11.2 Market Forecast, 2025-2035
- 11.2.1 Revenue Forecast to 2035
- 11.2.2 Volume Forecast to 2035
- 11.2.3 CAGR and Year-on-Year Growth
- 11.2.4 Incremental Revenue Opportunity
- 11.3 Forecast Assumptions and Scenario Analysis
- 11.3.1 Base-Case Forecast
- 11.3.2 Optimistic and Conservative Scenarios
- 11.3.3 Technology, Pricing and Policy Sensitivities
- 11.4 Market Attractiveness and Growth Outlook
Chapter 12 United States Fuel Transfer Pumps Market Segmentation and Outlook
- 12.1 Segmentation Summary and Market Shares, 2025
- 12.2 Largest and Fastest-Growing Segments
- 12.3 By Product Type - Market Size and Forecast, 2025-2035
- 12.3.1 Segment Definition and Scope
- 12.3.2 Historical Market Size, 2018-2025
- 12.3.3 Revenue Forecast, 2025-2035
- 12.3.4 Volume Forecast, 2025-2035
- 12.3.5 Base-Year Market Share, 2025
- 12.3.6 Segment CAGR and Growth Drivers
- 12.3.7 Subsegment Market Size and Forecast
- 12.3.7.1 Direct Current Fuel Transfer Pumps
- 12.3.7.2 Alternating Current Fuel Transfer Pumps
- 12.3.7.3 Manual Fuel Transfer Pumps
- 12.3.8 Subsegment Pricing and Adoption Trends
- 12.3.9 Leading Suppliers and Competition
- 12.3.10 Regional Demand and Opportunities
- 12.4 By End-Use Industry - Market Size and Forecast, 2025-2035
- 12.4.1 Segment Definition and Scope
- 12.4.2 Historical Market Size, 2018-2025
- 12.4.3 Revenue Forecast, 2025-2035
- 12.4.4 Volume Forecast, 2025-2035
- 12.4.5 Base-Year Market Share, 2025
- 12.4.6 Segment CAGR and Growth Drivers
- 12.4.7 Subsegment Market Size and Forecast
- 12.4.7.1 Agriculture
- 12.4.7.2 Transportation and Fleet Operations
- 12.4.7.3 Construction
- 12.4.7.4 Resource Extraction and Ancillary Operations
- 12.4.8 Subsegment Pricing and Adoption Trends
- 12.4.9 Leading Suppliers and Competition
- 12.4.10 Regional Demand and Opportunities
- 12.5 By Application - Market Size and Forecast, 2025-2035
- 12.5.1 Segment Definition and Scope
- 12.5.2 Historical Market Size, 2018-2025
- 12.5.3 Revenue Forecast, 2025-2035
- 12.5.4 Volume Forecast, 2025-2035
- 12.5.5 Base-Year Market Share, 2025
- 12.5.6 Segment CAGR and Growth Drivers
- 12.5.7 Subsegment Market Size and Forecast
- 12.5.7.1 Vehicle and Equipment Refueling
- 12.5.7.2 Tank-to-Tank Transfer
- 12.5.7.3 Drum and Tote Decanting
- 12.5.7.4 Fuel Recovery and Maintenance
- 12.5.8 Subsegment Pricing and Adoption Trends
- 12.5.9 Leading Suppliers and Competition
- 12.5.10 Regional Demand and Opportunities
- 12.6 By Sales Channel - Market Size and Forecast, 2025-2035
- 12.6.1 Segment Definition and Scope
- 12.6.2 Historical Market Size, 2018-2025
- 12.6.3 Revenue Forecast, 2025-2035
- 12.6.4 Volume Forecast, 2025-2035
- 12.6.5 Base-Year Market Share, 2025
- 12.6.6 Segment CAGR and Growth Drivers
- 12.6.7 Subsegment Market Size and Forecast
- 12.6.7.1 Industrial Distributors
- 12.6.7.2 Agricultural and Equipment Dealers
- 12.6.7.3 Third-Party E-Commerce
- 12.6.7.4 Manufacturer Direct Sales
- 12.6.8 Subsegment Pricing and Adoption Trends
- 12.6.9 Leading Suppliers and Competition
- 12.6.10 Regional Demand and Opportunities
- 12.7 Segment Growth Comparison
- 12.8 Segment Attractiveness and Priority Matrix
Chapter 13 United States Fuel Transfer Pumps End-Use and Application Market Outlook
- 13.1 End-Use Industry and Customer Demand Structure
- 13.2 Leading Applications and Customer Groups
- 13.3 End-Use Market Size, Share and Forecast
- 13.4 Major End-Use Industry Deep Dives
- 13.4.1 Customer Requirements and Use Cases
- 13.4.2 Demand and Replacement Cycles
- 13.4.3 Technical and Regulatory Considerations
- 13.4.4 Purchasing and Procurement Models
- 13.4.5 Leading Vendors and Distribution Channels
- 13.4.6 Forecast and Commercial Opportunities
- 13.5 Emerging Applications and Cross-Segment Demand
- 13.6 End-Use Industry Investment Priorities
Chapter 14 United States Fuel Transfer Pumps Geographic Market Outlook, 2025-2035
- 14.1 Domestic Market Distribution and Demand Clusters
- 14.2 State- or Province-Wise Market Size and Forecast, 2025-2035
- 14.3 City and Metropolitan Market Outlook
- 14.4 Industrial, Manufacturing and Commercial Clusters
- 14.5 Geographic Concentration of Key End Users
- 14.6 Local Pricing and Purchasing Differences
- 14.7 Domestic Production Facilities and Capacity Map
- 14.8 Local Infrastructure and Project Pipeline
- 14.9 State-Level Policy and Incentive Differences
- 14.10 Subnational Investment Hotspots and Opportunities
- 14.11 Distribution and Logistics Networks
- 14.12 Domestic Competitive Footprint
Chapter 15 United States Fuel Transfer Pumps Technology, Innovation and Sustainability Outlook
- 15.1 Technology Landscape and Maturity
- 15.2 Product, Process and Service Innovation
- 15.3 AI, Automation and Digital Tools in the Industry
- 15.4 Technology Adoption and Performance Benchmarking
- 15.5 Innovation Pipeline and R&D Investment
- 15.6 Patent and Intellectual Property Trends
- 15.7 Energy Efficiency and Resource Management
- 15.8 Sustainability, Recycling and Circularity
- 15.9 Technology Roadmap, 2025-2035
- 15.10 Risks of Obsolescence and Technology Substitution
Chapter 16 United States Fuel Transfer Pumps Market Key Strategic Imperatives
- 16.1 Growth and Market Entry Priorities
- 16.2 High-Return Products and Segments
- 16.3 Pricing, Profitability and Cost Optimization
- 16.4 Technology Investment and Product Differentiation
- 16.5 Supply Chain Localization and Resilience
- 16.6 Distribution and Customer Acquisition
- 16.7 Partnership, Acquisition and Capacity Strategy
- 16.8 Regional Expansion Priorities
- 16.9 Short-, Medium- and Long-Term Actions
Chapter 17 Competition Outlook
- 17.1 Industry Competition Characteristics
- 17.2 Market Structure and Concentration
- 17.3 Market Share and Competitive Positioning, 2025
- 17.4 Company-Wise Revenue and Product Benchmarking
- 17.5 Production and Service Capacity Benchmarking
- 17.6 Technology, Pricing and Differentiation
- 17.7 Regional Footprint and Distribution Strength
- 17.8 Mergers, Acquisitions and Strategic Alliances
- 17.9 New Entrants and Competitive Threats
- 17.10 Porter's Five Forces and Industry Attractiveness
- 17.11 Competitive Outlook, 2025-2035
Chapter 18 Company Profiles
- 18.1 Company Coverage and Selection Criteria
- 18.2 Fill-Rite Company (Gorman-Rupp)
- 18.2.1 Business Description
- 18.2.2 Company Ownership and Geographic Presence
- 18.2.3 Product and Service Portfolio
- 18.2.4 Manufacturing and Operating Footprint
- 18.2.5 Production Capacity and Expansion Plans
- 18.2.6 Financial Performance and Investment
- 18.2.7 Market Share and Competitive Position
- 18.2.8 Technology and Innovation Capabilities
- 18.2.9 Strategic Alliances or Partnerships
- 18.2.10 Recent Developments
- 18.2.11 Growth Strategy and Outlook
- 18.3 Great Plains Industries
- 18.4 PIUSI
- 18.5 Macnaught
- 18.6 GROZ Engineering Tools
- 18.7 Other Relevant Market Participants
Note: Every listed company is profiled on the structure shown under the first company. The company list is preliminary and may change based on research findings, market developments, data availability and client requirements.
Chapter 19 Disclaimer
- 19.1 Research and Forecast Disclaimer
- 19.2 Data Source and Estimation Limitations
Note: The depth of individual sections depends on data availability for this market. Volume, capacity, trade and other unit-based metrics are included where applicable.