Replacement cycles anchor demand as cleanroom work rises
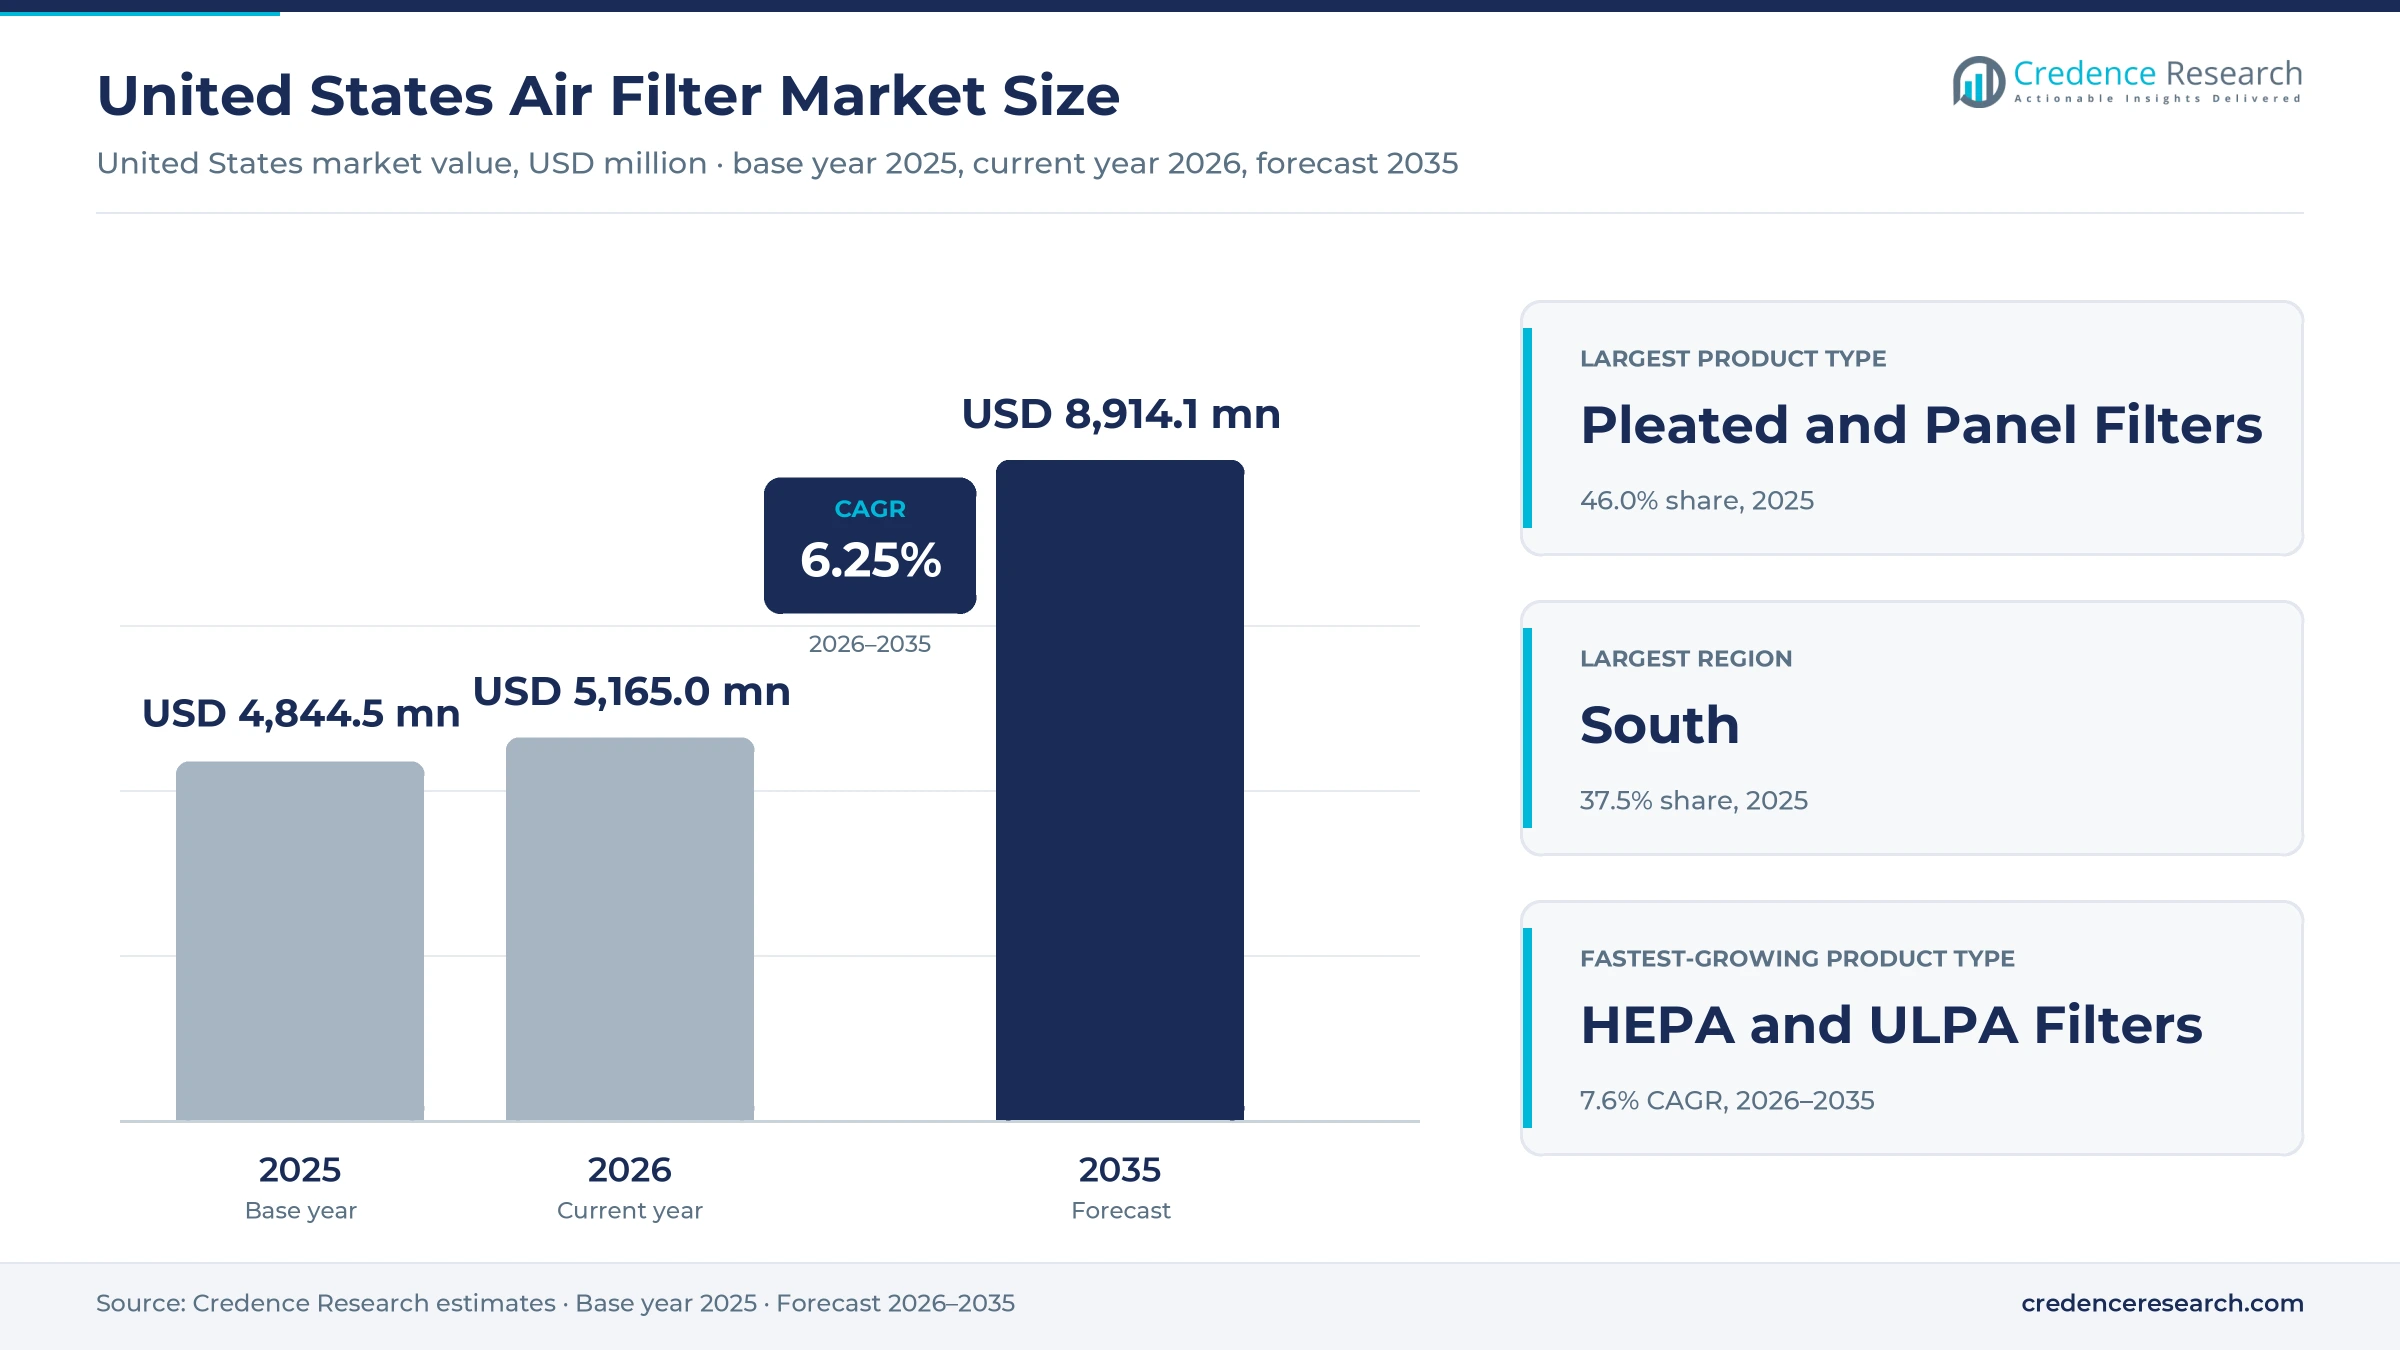
The United States air filter market was valued at USD 4.84 billion in 2025 and is projected to increase from USD 5.17 billion in 2026 to USD 8.91 billion by 2035, registering a CAGR of 6.25% during 2026–2035. Most spending is recurring, because homes, offices, hospitals, factories and vehicles replace filters on fixed service intervals whether or not new equipment is installed. The South held the largest regional share, 37.5% in 2025, as it adds people, buildings and semiconductor plants faster than any other region. It is also the fastest-growing region at 6.6% a year, helped by fab construction in Texas and a large base of commercial buildings. Demand is moving toward higher efficiency, as building operators adopt MERV 13 media and chip and drug makers specify HEPA, ULPA and chemical filters for new cleanrooms. Supply is consolidating at the same time, with a large merger in 2026 bringing aftermarket brands under one owner.
Which filters and services the U.S. figures include
The market covers replaceable air filters sold in the United States for residential and commercial HVAC systems, industrial process and dust collection equipment, cleanrooms and vehicle engines and cabins. Values include pleated and panel filters, bag and cartridge filters, HEPA and ULPA panels and molecular filter cassettes, priced at the first sale to the end buyer or installer.
Room air purifiers, dust collector housings, air handlers and fan filter units are excluded as equipment, although their installed base sets the volume of replacement media. The value chain runs from media makers of glass, synthetic and sorbent materials to filter converters, distributors, service contractors, retailers and vehicle parts suppliers.
United States Air Filter Market Insights
- The market grows from USD 4.84 billion in 2025 to USD 8.91 billion by 2035 at a 6.25% CAGR, as replacement cycles hold steady and cleanroom and industrial buyers specify higher-efficiency media.
- The South held 37.5% of 2025 value, supported by a 6.0% population gain between 2020 and 2025 and new semiconductor capacity in Texas.
- Pleated and panel filters led product type with 46.0% of 2025 value, while HEPA and ULPA filters grow fastest at 7.6% a year.
- Parker Hannifin completed its $9.25 billion purchase of Filtration Group in August 2026, combining two large aftermarket filter portfolios under one owner.
- The U.S. light vehicle fleet reached 289 million in 2025 with an average age of 12.8 years, which keeps engine and cabin filter replacement steady.
Pleated panels lead while HEPA and ULPA grow fastest
Pleated panels lead and high-purity panels grow fastest
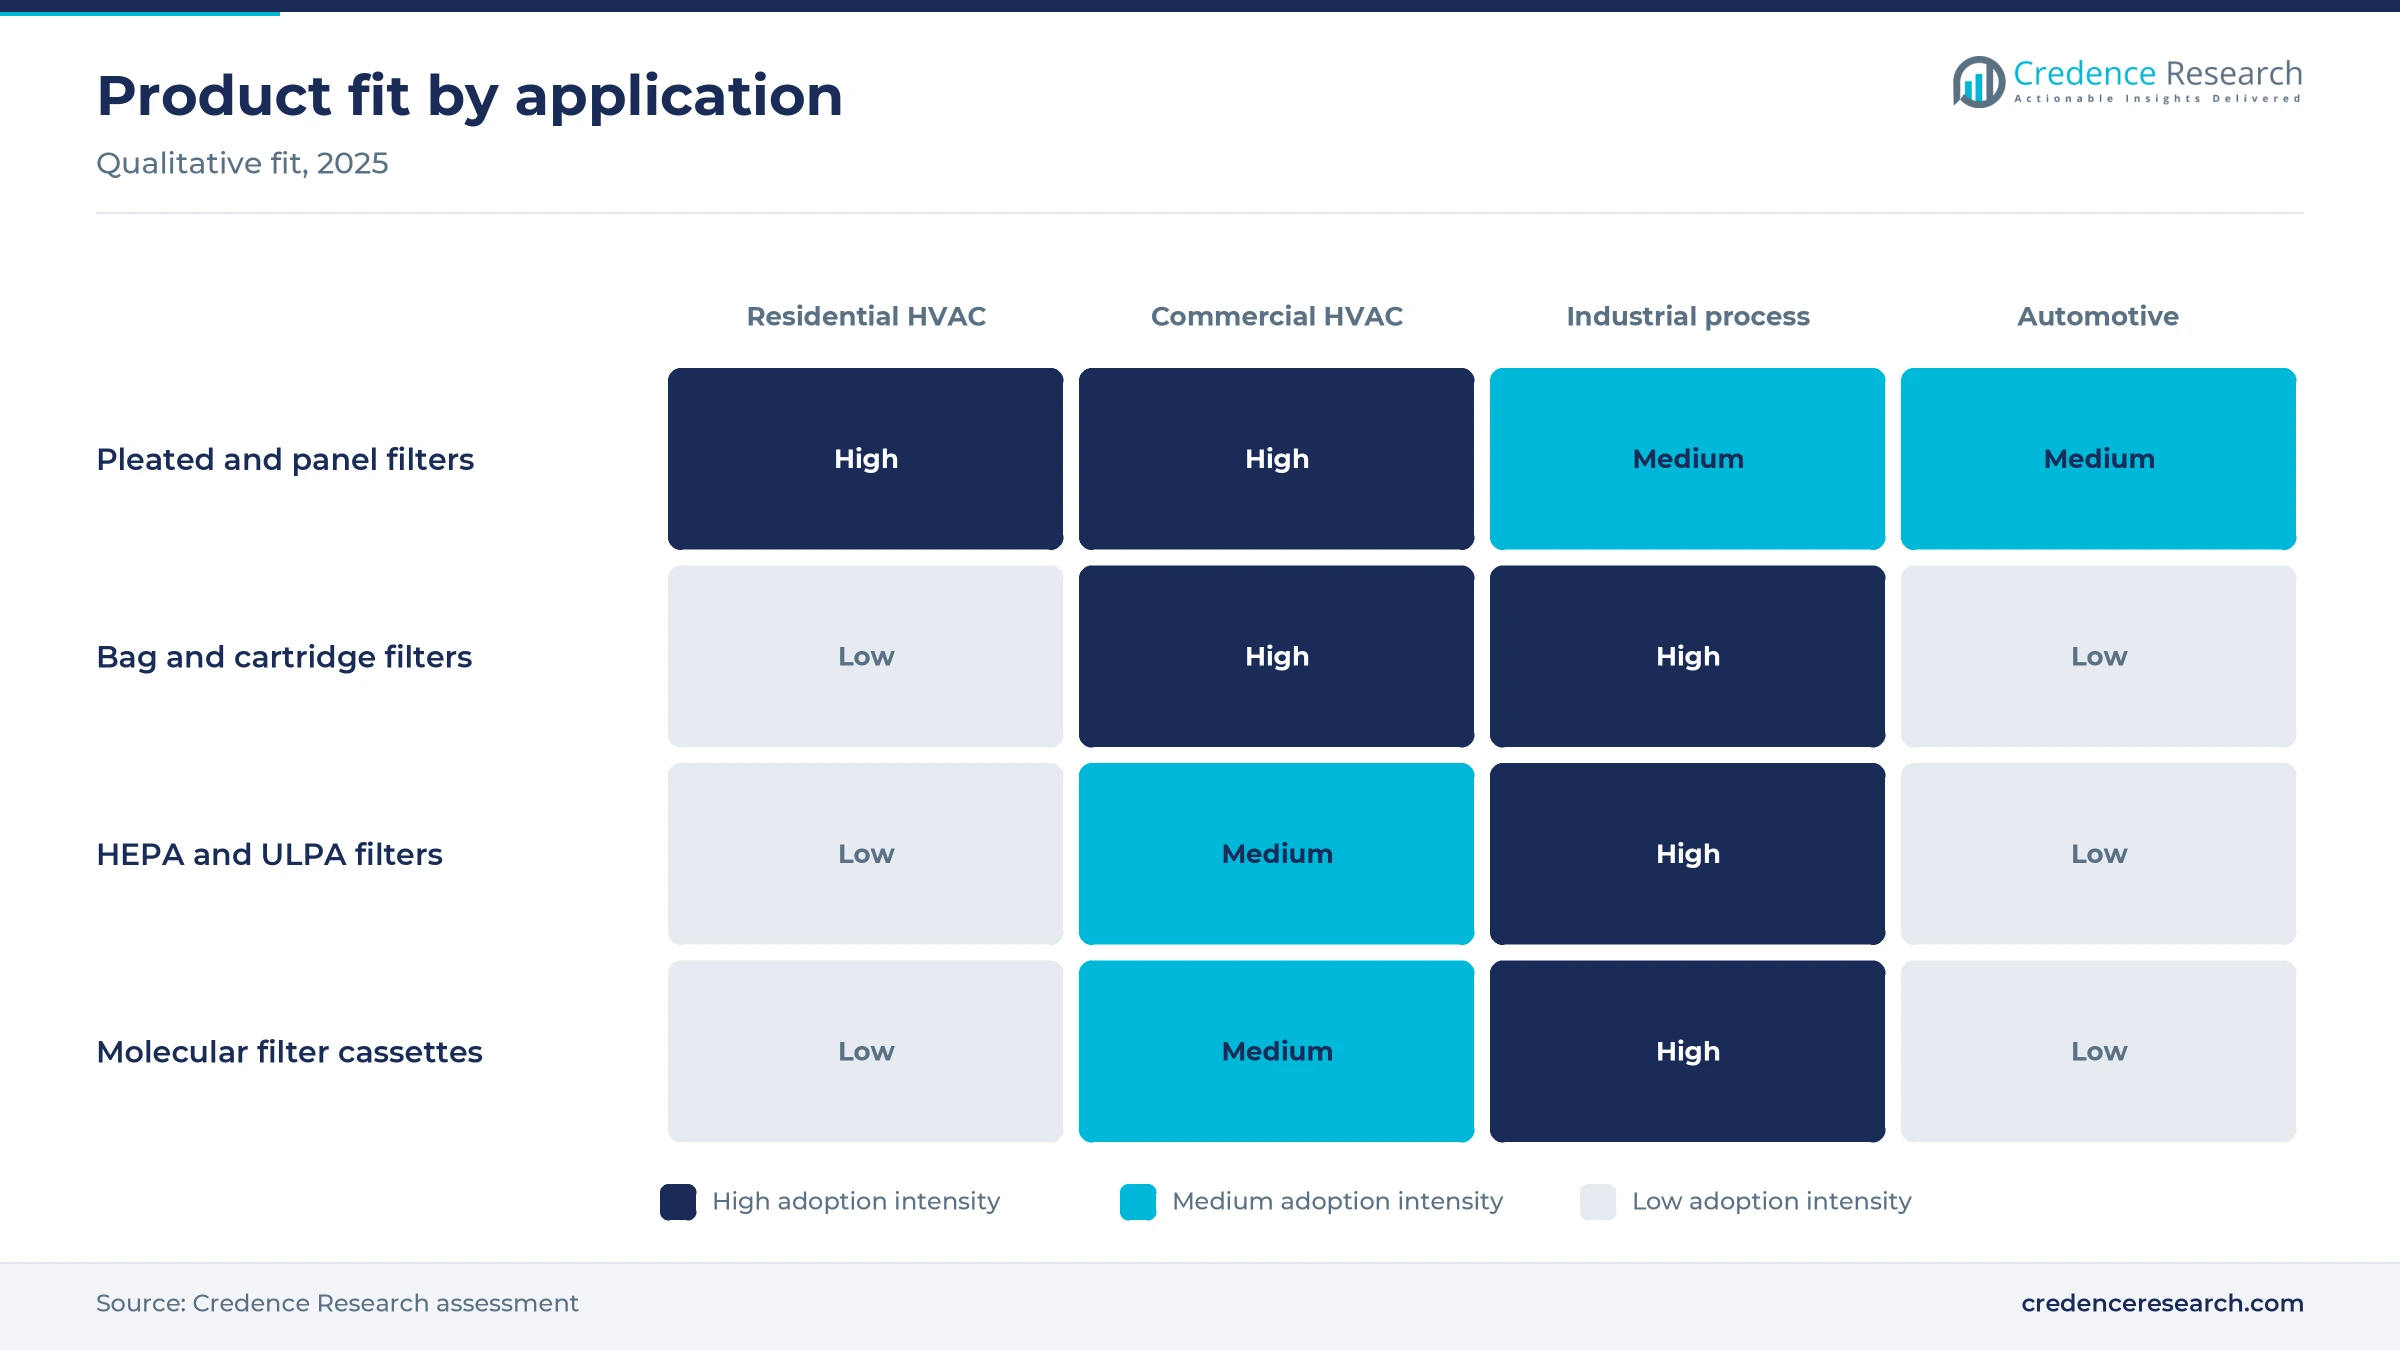
Based on product type, the market is categorized into pleated and panel filters, bag and cartridge filters, HEPA and ULPA filters and molecular filter cassettes. Pleated and panel filters led with 46.0% of 2025 value because they sit in almost every forced-air furnace and rooftop unit, and AHRI counted 3,247,426 gas furnace shipments in 2025, up 4.1% from 2024. HEPA and ULPA filters grow fastest at 7.6% a year, as AAF International relaunched its Washington, North Carolina, plant in June 2024 after a $20 million upgrade for microelectronics, pharmaceutical and battery plants, the Washington Daily News reported. High-purity panels carry far higher unit prices than home filters.
Commercial buildings lead while industrial process use grows fastest
Based on application, the market is categorized into residential HVAC filters, commercial building HVAC filters, industrial process filters and automotive air filters. Commercial building HVAC filters led with 31.0% of 2025 value because offices, hospitals, schools and data halls run larger filter banks on shorter service intervals than homes, and data center construction spending passed office construction for the first time in December 2025, at about $3.5 billion for the month, according to Building Design and Construction. Industrial process filters grow fastest at 7.1% a year, as GE Vernova lifted its gas power backlog and slot reservations to 122 GW in the third quarter of 2026, and each turbine needs intake filter houses.
Mechanical capture leads as sorbent media gains in fabs
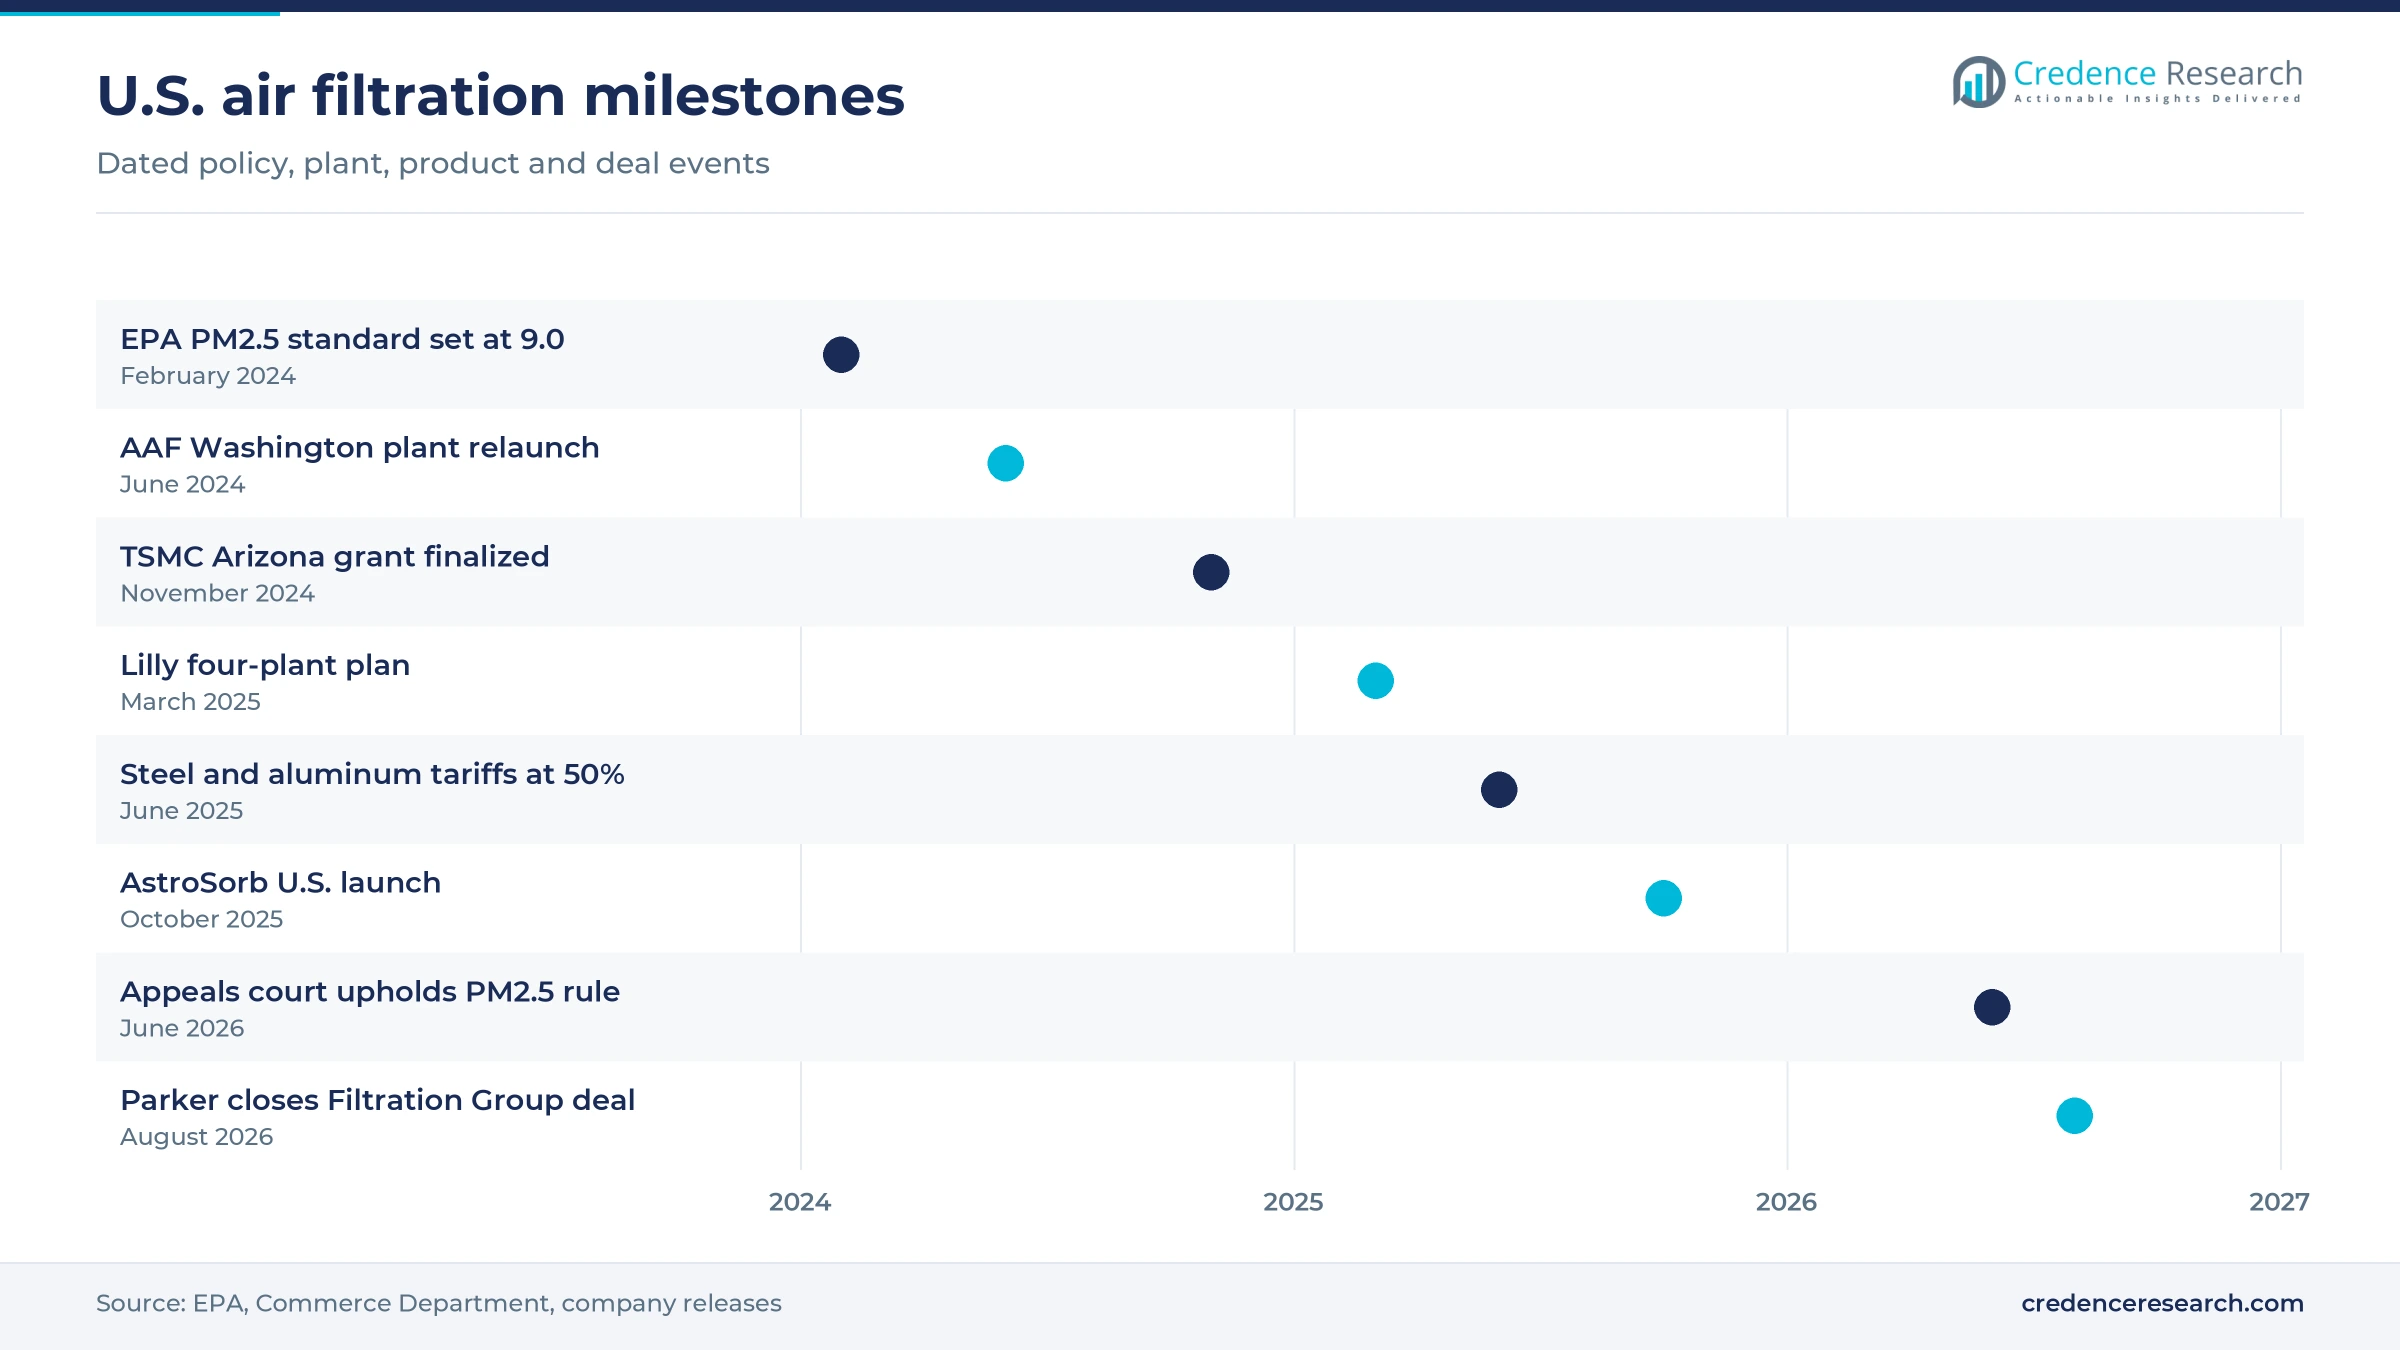
Based on technology, the market is categorized into mechanical capture, electrostatically charged media and sorbent capture. Mechanical capture led with 58.0% of 2025 value because glass and synthetic media rated to fixed test standards, including HEPA panels that must trap 99.97% of 0.3-micron particles according to The ACHR News, dominate commercial, industrial and vehicle use. Sorbent capture grows fastest at 7.7% a year, as AAF International launched its AstroSorb line in the United States in October 2025 to remove ammonia, acids, volatile organic compounds and ozone from semiconductor cleanroom air.
Direct enterprise sales lead as consumer supply grows fastest
Based on distribution channel, the market is categorized into direct enterprise sales, wholesale distribution and consumer-facing supply. Direct enterprise sales led with 38.0% of 2025 value because hospitals, fabs and campuses buy under service contracts that include change-outs and testing, and AAF International bought Northeast Air Solutions of Wilmington, Massachusetts, in March 2024 to extend its branch network across the United States and Canada, according to Filtration and Separation. Consumer-facing supply grows fastest at 6.8% a year, as Filterbuy, a manufacturer based in Talladega, Alabama, expanded its two-inch residential line in March 2026 and sells sized filters directly online.
| Segment Group | Leading Sub-segment | Share, 2025 | Fastest-growing Sub-segment | CAGR, 2026–2035 |
|---|---|---|---|---|
| By Product Type | Pleated and Panel Filters | 46.0% | HEPA and ULPA Filters | 7.6% |
| By Application | Commercial Building HVAC Filters | 31.0% | Industrial Process Filters | 7.1% |
| By Technology | Mechanical Capture | 58.0% | Sorbent Capture | 7.7% |
| By Distribution Channel | Direct Enterprise Sales | 38.0% | Consumer-Facing Supply | 6.8% |
Shelf prices hold steady while premium media earns more
Residential filters are priced per unit at retail, while commercial and industrial filters are sold per case or under service contracts that bundle change-outs. Factory prices have flattened after a sharp rise, and the BLS producer price index for furnace and air-conditioner filters moved from 169.2 in January 2025 to 171.8 in January 2026, after rising from 129.0 in January 2020 to 168.6 in January 2024. Efficiency rating, depth and certification move price far more than size. A HEPA panel costs about twenty times a pleated home filter, so suppliers earn margin on high-purity work while volume pays for plants.
| Product or service | Typical price or fee | Basis |
|---|---|---|
| 1-inch MERV 13 pleated home filter, 4-pack | USD 45.99, about USD 11.50 per filter | Home Depot listing, November 2026 |
| Filtrete 700 MPR electrostatic 1-inch filter | USD 12.99 each | Kroger grocery listing, November 2026 |
| HEPA panel, 24 x 24 x 11.5 inches, 99.97% | USD 229.50 each | DAMN Filters list price, November 2026 |
| Engine filter replacement at a repair shop | USD 79 to 99, parts and labor | RepairPal estimate, November 2026 |
Request a Free Sample
Fill in your details and we'll send you a free sample report.
- Sample data tables & charts
- Research methodology
Ventilation guidance, PM2.5 rules and fabs drive orders
Building filtration upgrades move offices to MERV 13
Building owners are raising filter efficiency as federal guidance and new standards set clearer targets for indoor air. The CDC asked operators in May 2023 to aim for at least five air changes an hour in occupied spaces and to upgrade filters to MERV 13 or higher, according to the American Industrial Hygiene Association. ASHRAE then published Standard 241 in July 2023, which sets clean airflow targets per occupant and gives filtration and air cleaning a central role. Wildfire smoke added urgency, because about 123 million people were under air quality alerts in early June 2023 and contractors advised MERV 13 media, The ACHR News reported. Each step from MERV 8 to MERV 13 raises the value of every change-out on the same installed base.
Industrial emission and contamination rules keep plants buying
Tighter outdoor air rules and in-plant contamination control keep industrial sites spending on filter media through the cycle. The EPA lowered the annual PM2.5 standard from 12.0 to 9.0 micrograms per cubic meter on Feb. 7, 2024, and the federal appeals court in the District of Columbia upheld the standard on June 26, 2026, according to the Harvard Environmental and Energy Law Program. That keeps permits for new or expanded plants tied to particulate controls. Donaldson describes its industrial systems as collecting dust, fume and mist inside factories, and it also builds custom air intake systems for gas turbines and compressors. For filter makers, replacement cartridges and bags in these systems are the most dependable revenue, because plants cannot run without them.
High-purity manufacturing builds new cleanroom demand
New semiconductor and pharmaceutical plants are the largest source of new filter demand in the country. The Semiconductor Industry Association counted more than $500 billion in announced private investment by July 2025 and expects U.S. chipmaking capacity to triple by 2032. The Commerce Department finalized a $6.6 billion grant for TSMC's three Phoenix fabs in November 2024, according to The Spokesman-Review. Eli Lilly announced four new U.S. plants worth $27 billion in March 2025, three for active ingredients and one for injectables, Plant Services reported. Each project fills its cleanroom equipment with ceiling HEPA or ULPA panels, which are replaced on a schedule.
An aging vehicle fleet sustains service replacement
Older vehicles stay on the road longer, which keeps engine and cabin filter replacement steady even when new car sales soften. S&P Global Mobility puts the U.S. light vehicle fleet at 289 million in 2025, with an average age of 12.8 years, up two months for the second straight year. The same release says vehicles registered between 2015 and 2019 are leaving warranty, which shifts maintenance to independent shops and do-it-yourself buyers. Scrappage held at about 4.5%, so the fleet keeps growing. Repair shops and parts retailers carry the resulting volume, which makes automotive filters the most predictable part of the replacement base.
Low-resistance media and data centers reshape demand
Shift toward low-resistance and reusable media
Buyers are shifting toward media that hold efficiency at lower pressure drop, because fan energy is a recurring cost on top of the filter price. Camfil USA introduced Megalam ES in October 2024, an ePTFE HEPA filter for life sciences that it says resists damage and lowers airflow resistance. On the residential side, Filtrete announced a refillable HVAC filter in April 2025 aimed at less waste, while most home pleats still rely on charged melt-blown nonwovens. The National Air Filtration Association noted in its January 2026 guide to ASHRAE Standard 52.2-2025 that some charged media lose efficiency in use, which is why the test reports a MERV A value after an optional conditioning step. This shift rewards suppliers whose ratings hold over the full service life, not only on the day of purchase.
Rise of molecular and chemical filtration in fabs
Chemical filtration is rising from a niche to a standard specification in chip plants, because particles are no longer the only yield risk. The AstroSorb range noted above comes in box, canister, panel, tray and V-bank formats for makeup air units, fan filter units and process tools. These filters sit upstream of HEPA and ULPA panels, hold beds of activated carbon or other sorbents, and target amines, acids, siloxanes and ozone. Texas Instruments announced in June 2025 a plan of about $60 billion across seven fabs in Texas and Utah, adding further chemical filtration demand. TI is already ramping LFAB1 in Lehi, Utah, its first 300-millimeter wafer fab there. Molecular filter cassettes follow fab construction with a short lag and then recur as sorbent beds saturate.
Opportunity in data centers and the power plants behind them
Data centers are an opening for both building filters and industrial intake filters. The crossover in construction spending noted in the segment analysis, when data centers passed offices, is now reaching filter orders. These halls run constant airflow through large filter banks, and operators that buy data center cooling systems need MERV-rated media for them. The gas turbines that supply many new campuses add intake filter houses, and GE Vernova expects its gas backlog and reservations to reach at least 130 GW by the end of 2026. Industrial process filters, the fastest-growing application at 7.1% a year, gain most from this build-out.
Opportunity in recurring service and replacement contracts
Recurring change-out contracts are the most attractive opening, because they lock in replacement volume for years. Parker Hannifin agreed on Nov. 11, 2025, to buy Filtration Group for $9.25 billion and said most of the target's sales come from the aftermarket. Parker completed the deal in August 2026, adding about 7,500 employees across industrial, ventilation and life sciences filtration. Donaldson notes that it competes with several large global and many regional rivals, and it lists steel, filter media and petrochemical-based products as its main raw materials, so scale also brings buying leverage. Owners of large service networks can bundle testing, change-outs and disposal, which smaller converters cannot easily match.
Tariffs, rule uncertainty and an HVAC slump weigh in
Steel and aluminum tariffs raise frame and housing costs
Tariffs on metals raise the cost of frames, housings and filter cartridges with steel end caps. The White House doubled Section 232 tariffs on imported steel and aluminum from 25% to 50% in June 2025, Steel Market Update reported. Donaldson expects about $35 million in annual tariff costs, which it plans to offset mainly through price increases. Buyers of industrial cartridges face higher list prices, while makers with domestic metal supply hold an edge.
Legal uncertainty clouds the PM2.5 standard
The tighter particulate standard that supports industrial filter demand is still under legal challenge. On Nov. 24, 2025, the EPA asked the federal appeals court in the District of Columbia to vacate its own 2024 revision, and after the court upheld it, Kentucky and other states petitioned the Supreme Court on Sept. 2, 2026, according to the Harvard Environmental and Energy Law Program. Plant owners may delay control upgrades until the case is settled, which slows new orders for dust collection cartridges.
A slump in new HVAC systems cuts first-fill volume
Fewer new cooling systems mean fewer filters shipped with new equipment and fewer upgrades at install. AHRI data show central air conditioner shipments fell 26.2% in 2025 to 4,104,933 units, while air-source heat pumps fell 11.6% to 3,644,596 units, Contracting Business reported. Replacement filters for installed systems are not affected, but contractors lose a natural moment to sell thicker, higher-MERV cabinets, which slows the premium mix in homes.
Factory construction is easing from its 2024 peak
Manufacturing construction, which drives first-fill orders for cleanroom and process filters, is past its peak. Census Bureau data show private manufacturing construction spending fell to $167.2 billion at a seasonally adjusted annual rate in September 2026, well below its 2024 level. New plant orders may slow even as fabs under construction finish. Suppliers that depend on project orders face more uneven sales than those built on change-outs.
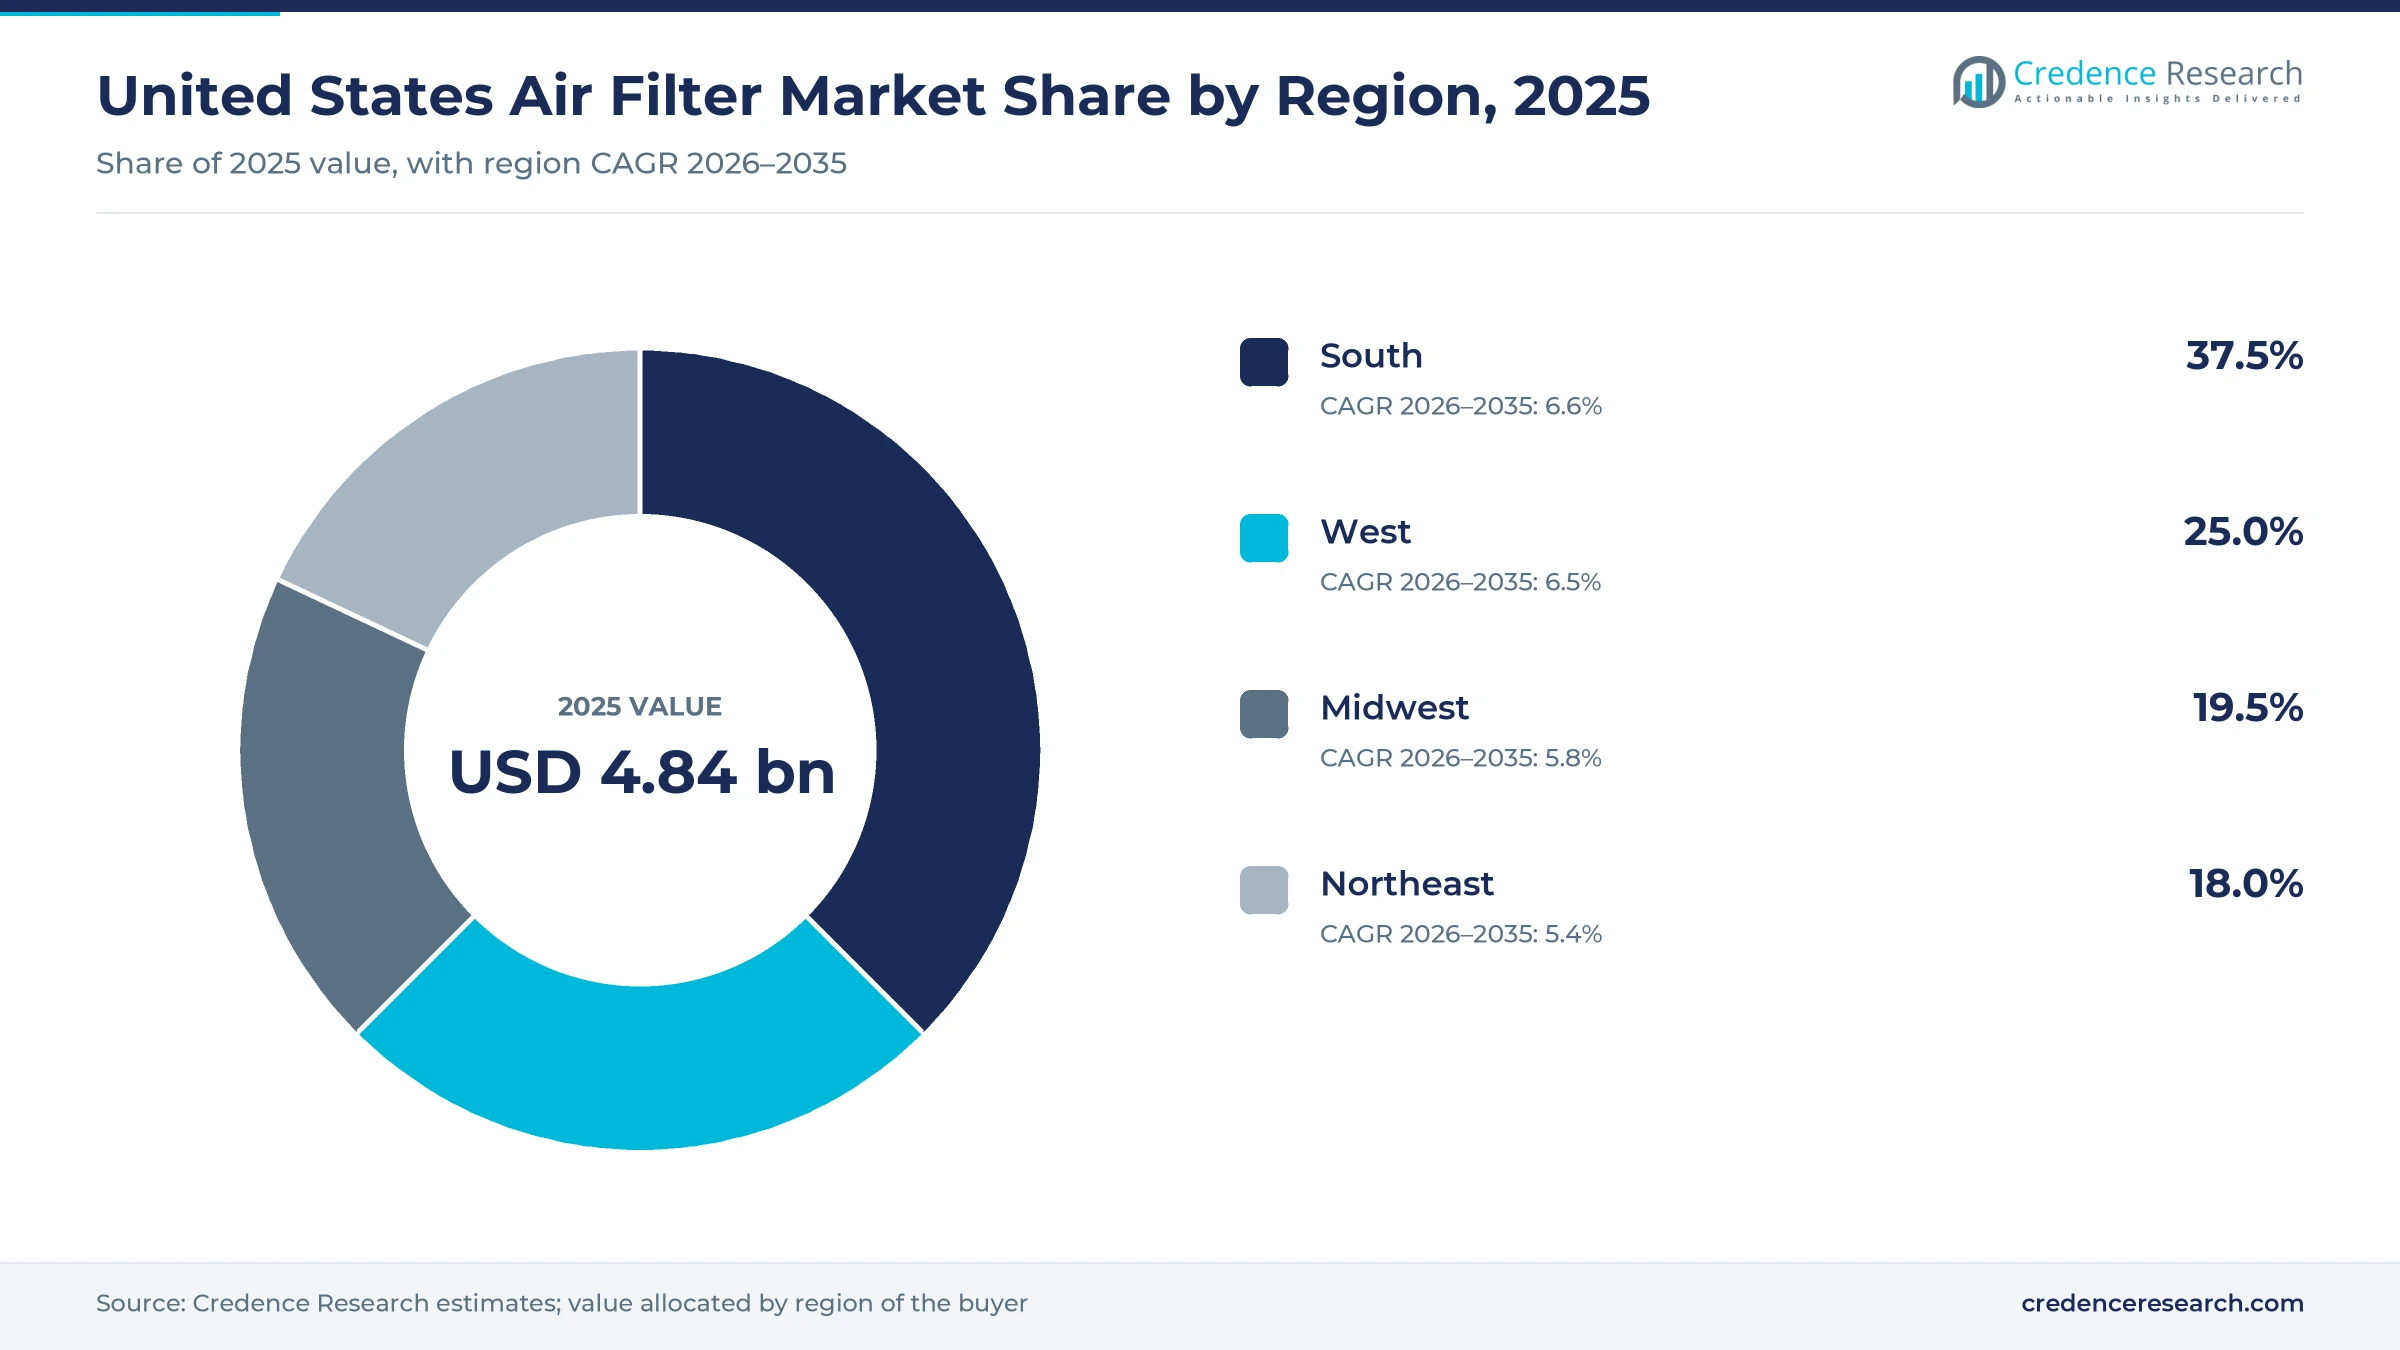
The South holds the largest share on growth and fabs
| Region | Value, 2025 (USD billion) | Share, 2025 | CAGR, 2026–2035 |
|---|---|---|---|
| South | 1.82 | 37.5% | 6.6% |
| West | 1.21 | 25.0% | 6.5% |
| Midwest | 0.94 | 19.5% | 5.8% |
| Northeast | 0.87 | 18.0% | 5.4% |
South leads on population growth and Texas fabs
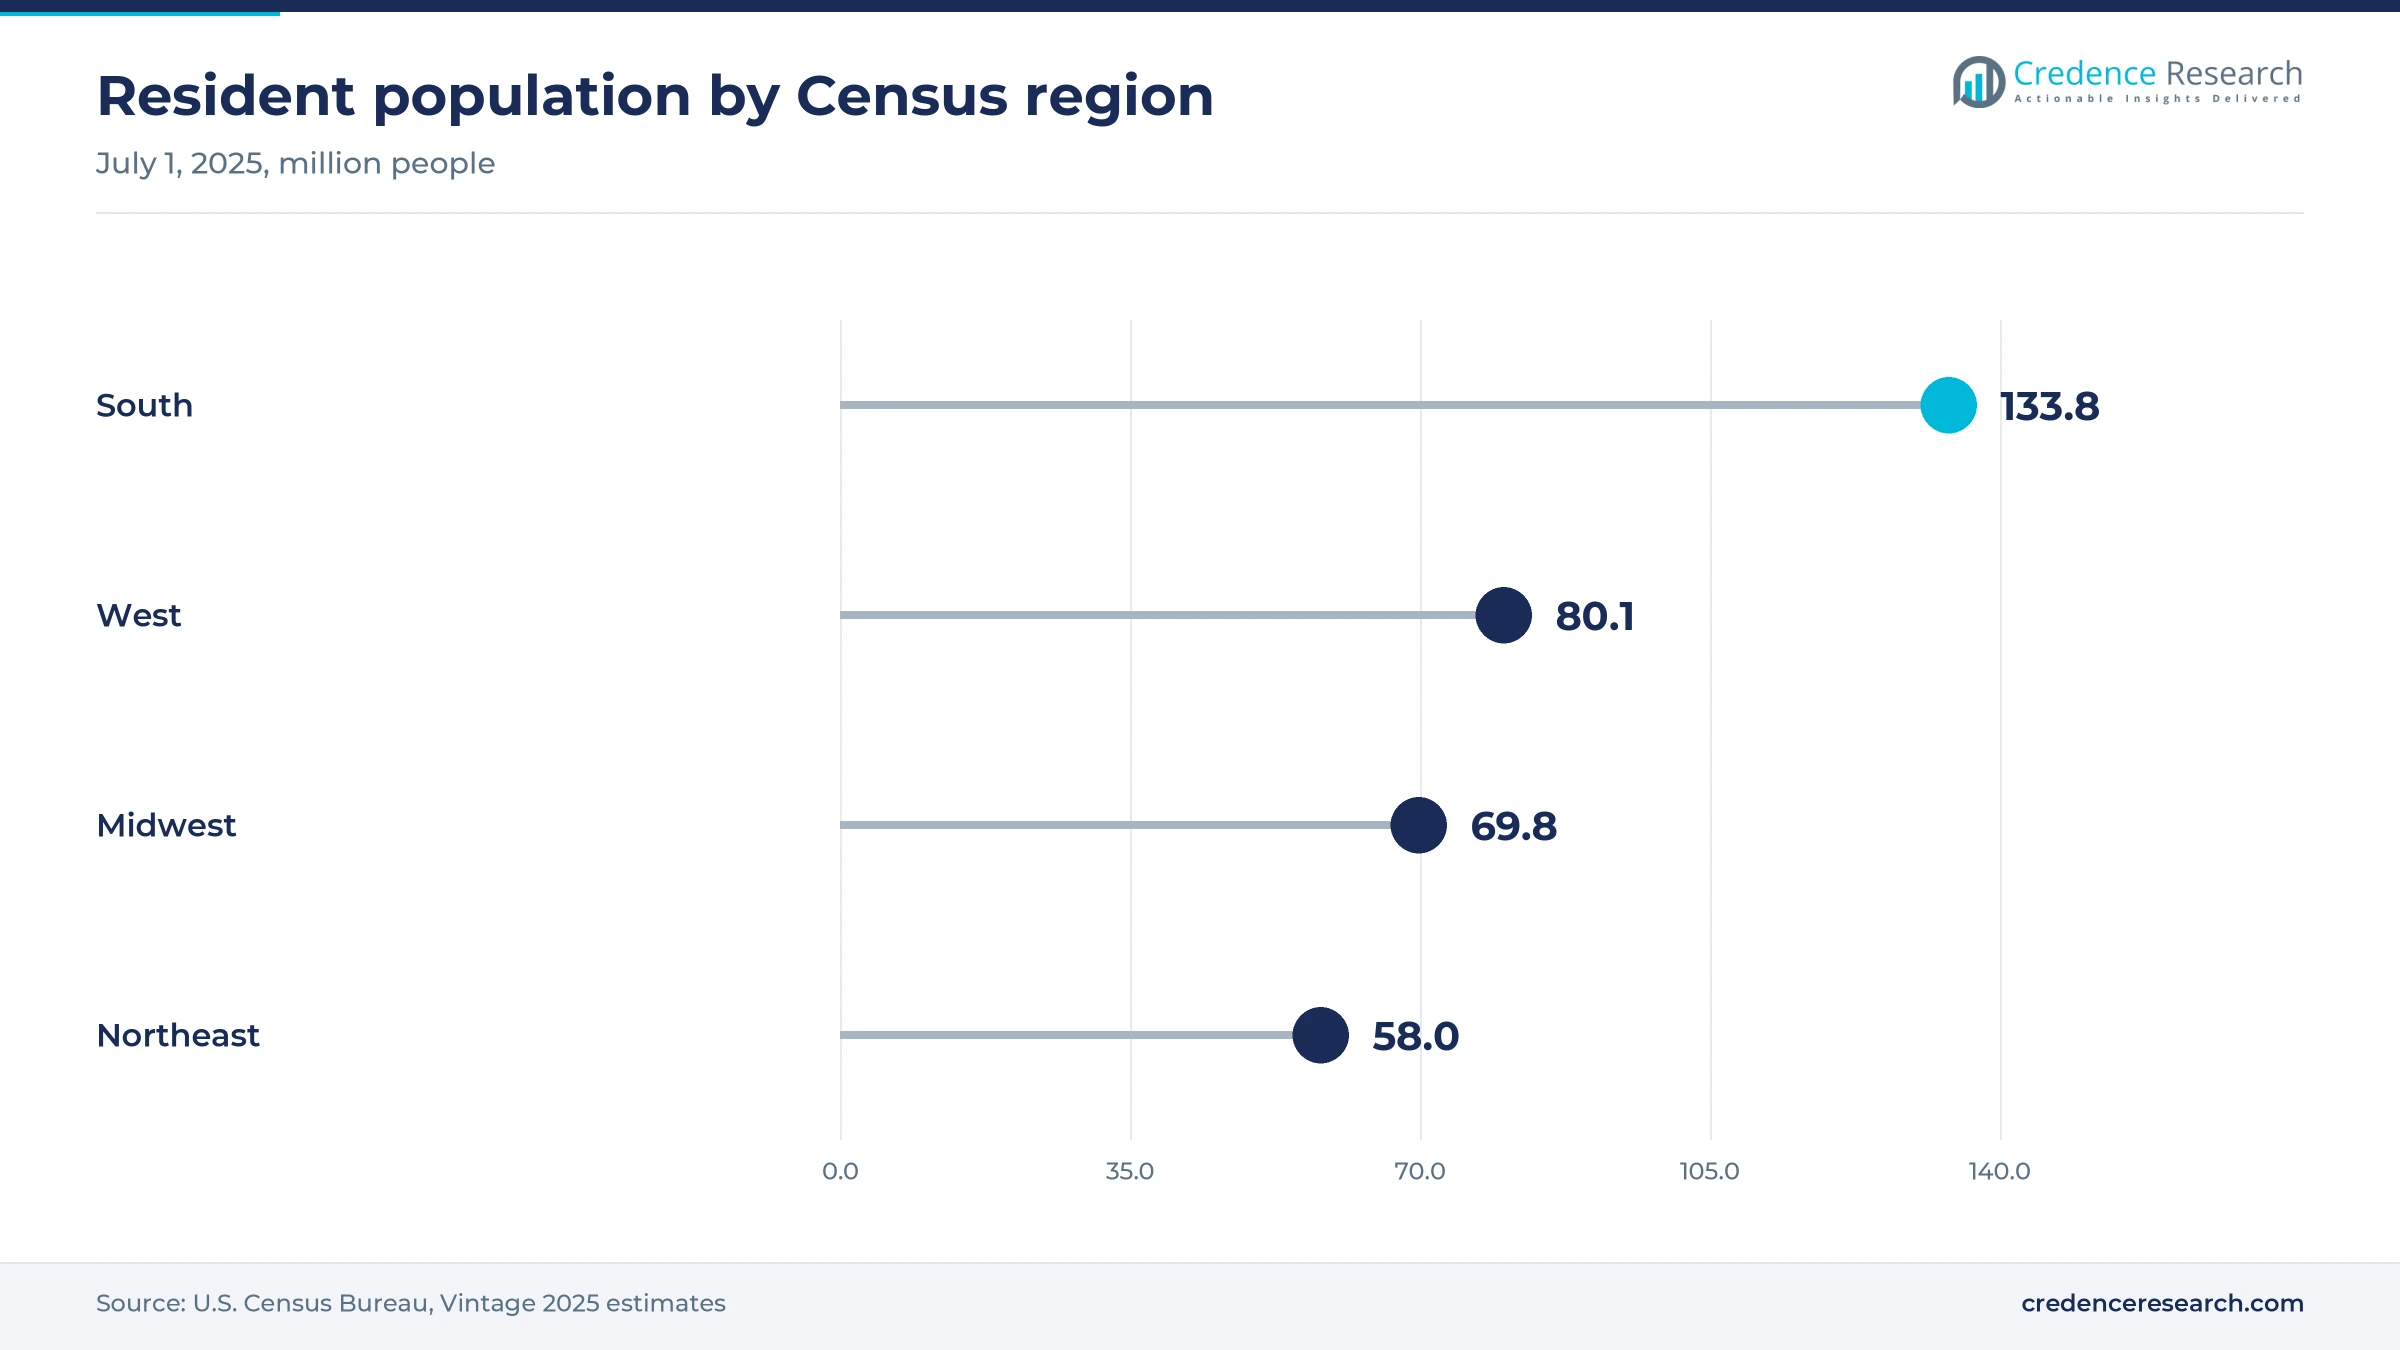
The South held 37.5% of 2025 value and grows at 6.6% a year, the largest base and the fastest pace. The Census Bureau reports that the South reached 133.8 million people in 2025, up 6.0% since 2020, about twice the national rate. Samsung's Taylor fab, picked in July 2025 to make Tesla chips, and the Texas Instruments Sherman site add cleanroom demand. In late September 2024, Camfil broke ground on a Kilgore, Texas, plant with a planned investment of nearly $100 million and about 226 jobs, which will produce all Camfil 5-Star products.
West grows on fabs in Arizona and wildfire smoke
The West held 25.0% of 2025 value and grows at 6.5% a year. The TSMC Phoenix fabs noted above anchor high-purity demand, and Texas Instruments includes its Lehi, Utah, site in the expansion plan. The region gained 1.9% in population between 2020 and 2025, according to the Census Bureau. Smoke events also matter, as Colorado and southern California were under air quality alerts in August 2025, Axios reported. Homes and schools in smoke-prone areas tend to upgrade to MERV 13 media sooner.
Midwest demand rests on factories and smoke alerts
The Midwest held a 19.5% share of 2025 value and grows at 5.8% a year, below the national pace. Population rose only 1.1% between 2020 and 2025, so growth depends on factories and upgrades rather than new buildings. Illinois, Michigan, Minnesota and Wisconsin were under smoke advisories from Canadian wildfires in August 2025, according to Axios. The Census Bureau counts 69.8 million Midwest residents in 2025, and older factories and schools make filter-grade upgrades the main lever for growth.
Northeast stays a commercial and institutional market
The Northeast's share of 2025 value was 18.0%, and the region grows at 5.4% a year, the slowest of the four regions. The Census Bureau counts 58.0 million residents in 2025 and growth of only 0.7% since 2020, so little new floor space comes on line. Demand comes mainly from hospitals, universities and offices on service contracts. Six northeastern states, including New York and Pennsylvania, were under smoke alerts in August 2025, which pushes campuses toward higher-MERV filters.
Plant upgrades, new media and a major merger in 2024-26
| Development | Status and market relevance |
|---|---|
| In August 2026, Parker Hannifin completed its $9.25 billion acquisition of Filtration Group Corporation. | Combines two large aftermarket filtration portfolios |
| In March 2026, Filterbuy expanded its two-inch air filter line from its base in Talladega, Alabama. | Widens direct online supply of thicker residential filters |
| In October 2025, AAF International launched its AstroSorb chemical filter line in the United States. | Targets airborne molecular contamination in fabs and cleanrooms |
| In October 2024, Camfil USA introduced the Megalam ES ePTFE HEPA filter for life sciences. | Lower resistance media for pharmaceutical and biotech cleanrooms |
| In April 2025, Filtrete announced a refillable residential HVAC air filter designed to cut waste. | Tests a reusable frame format in the largest retail filter category |
Four capture methods trade efficiency against airflow
- Mechanical capture traps particles in glass or synthetic fibers by impaction, interception and diffusion, and HEPA and ULPA panels are the highest grades of it.
- Electrostatically charged media adds a static charge to fibers so that a thinner pack can capture fine particles at a lower pressure drop.
- Sorbent capture uses beds of activated carbon or impregnated media to adsorb gases, acids and organic compounds.
- ePTFE membranes replace glass fiber in some HEPA panels, offering higher strength and lower resistance for cleanroom and life sciences work.
Need a Custom Version of This Report?
Tailor the scope, geography, or segments to your exact requirements.
- Custom geography or segment scope
- Direct access to our analyst team
Scale players compete on service reach and certified media
Competition in the United States turns on service reach, certified high-efficiency media and supply close to large buyers. AAF International and Camfil run national branch and plant networks and sell everything from pleated panels to HEPA and ULPA filters under service contracts. Parker Hannifin describes itself as one of the largest industrial filtration groups after buying Filtration Group, whose sales come mostly from the aftermarket. Donaldson is strongest in dust collection, gas turbine intake and engine filtration, where replacement cartridges follow equipment it has installed. 3M sells Filtrete, which it calls the top trusted residential HVAC filter brand, while online makers such as Filterbuy compete on direct delivery of sized filters. Price matters most in standard panels, where freight and local converting decide many contracts. In cleanrooms, fab qualification and test data decide which suppliers are approved.
A few scale makers and many regional converters
The U.S. supply side combines a handful of large makers with national service networks and many regional converters that cut and pleat standard sizes. AAF International, a Daikin company based in Louisville, Kentucky, Camfil and Parker sell across all filter classes, Donaldson focuses on industrial and engine filtration, and 3M reaches homes through Filtrete at retail. Entry barriers are low for standard panels but high for HEPA, ULPA and chemical filters, which need test rigs, certified media and fab qualification. Margins therefore sit in high-purity products and in service contracts, while standard panels compete on freight and price.
Companies profiled and their roles in this market
| Company | Type | Role in the market |
|---|---|---|
| AAF International | Filter maker and service provider, Louisville, Kentucky | Full range including HEPA, ULPA and AstroSorb chemical filters |
| Camfil | Filter maker, Camfil USA based in Riverdale, New Jersey | Commercial, cleanroom and dust collection filters, Kilgore expansion |
| Parker Hannifin | Industrial filtration group | Owner of Filtration Group since August 2026, strong aftermarket base |
| Donaldson Company | Industrial and engine filtration maker | Dust, fume and mist collection and gas turbine intake systems |
| 3M | Consumer and industrial products maker | Filtrete residential HVAC filters sold through retail |
| Filterbuy | Direct-to-consumer filter maker, Talladega, Alabama | Sized residential and commercial filters sold online |
Replacement volume pays the bills, purity sets growth
Credence Research's view is that the U.S. air filter business rests on replacement volume but grows on purity. Homes, offices and vehicles provide steady change-outs that pay for plants and networks, yet they add little growth unless filter grades rise. The faster gains sit in fabs, drug plants and data centers, where HEPA, ULPA and chemical filters cost many times more per unit and must be replaced on fixed schedules. The main risk is timing, because fab delays and the unsettled particulate standard could push new orders later even as the installed base keeps buying. Pleated and panel filters still hold 46.0% of 2025 value, so replacement demand sets the floor for the market.
Installed base, replacement rates and prices drive the model
The report uses 2025 as the base year and forecasts to 2035 in current U.S. dollars. Market values come from the Credence Research model, which multiplies the installed base of homes, commercial floor space, vehicles and industrial systems by replacement rates and average selling prices, checked against company filings and producer price data. Regional shares follow the Credence Research regional model, informed by Census Bureau population data, plant construction and smoke exposure. Segment splits are Credence Research estimates from product lines, buyer types and channels described in company, regulator and government sources. No primary interviews or surveys were used in building these estimates.
Fab ramp-ups and building rules decide the upper range
Through 2035, the market is likely to grow in two layers, reaching USD 8.91 billion by 2035. Replacement filters for homes, commercial buildings and vehicles will remain the volume base and grow close to building stock and fleet size, with gains coming mainly from higher filter grades. The faster layer is high-purity work, as fabs in Texas, Arizona and Utah and new drug plants come on line and specify HEPA, ULPA and chemical filters. HEPA and ULPA filters, the fastest-growing product type at 7.6% a year, gain the most from that pipeline of cleanroom space. Consolidation is likely to continue, with large owners buying service networks to secure recurring change-out contracts.
Fab ramp-ups and rule outcomes set the range to 2035
The range of outcomes depends on how many announced fabs and drug plants reach full output and whether the 2024 particulate standard survives review. A downside case reflects delayed fabs, weak HVAC equipment sales and lasting tariff costs that push buyers to stretch change-out intervals. The upside requires steady data center construction, wider adoption of MERV 13 media in existing buildings and faster use of chemical filtration in new cleanrooms.
| Scenario | CAGR, 2026–2035 | Value, 2035 | What has to hold |
|---|---|---|---|
| Downside | 4.8% | USD 7.84 billion | Fab and plant delays, a vacated PM2.5 standard and longer change-out intervals |
| Base | 6.25% | USD 8.91 billion | Announced fabs ramp on schedule and building owners keep current filter grades |
| Upside | 7.5% | USD 9.86 billion | MERV 13 becomes standard in commercial buildings and chemical filtration spreads in fabs |
Frequently Asked Questions
How big is the United States air filter market?
Which region leads the U.S. market?
Which product type holds the largest share?
Why do semiconductor plants matter for air filter demand?
What does a typical air filter cost in the United States?
How do vehicles support the market?
What limits growth in the U.S. market?
Which companies lead the U.S. air filter market?
Table of Content
Chapter 1 Market Segmentation
- 1.1 Segmentation Framework
- 1.1.1 Product and Service Classification
- 1.1.2 Application and End-Use Classification
- 1.1.3 Technology and Solution Classification
- 1.1.4 Customer and Distribution Channel Classification
- 1.1.5 Geographic Segmentation
- 1.1.6 Market Segment Definitions and Boundaries
- 1.2 By Product Type
- 1.2.1 Pleated and Panel Filters
- 1.2.2 Bag and Cartridge Filters
- 1.2.3 HEPA and ULPA Filters
- 1.2.4 Molecular Filter Cassettes
- 1.3 By Application
- 1.3.1 Commercial Building HVAC Filters
- 1.3.2 Residential HVAC Filters
- 1.3.3 Industrial Process Filters
- 1.3.4 Automotive Air Filters
- 1.4 By Technology
- 1.4.1 Mechanical Capture
- 1.4.2 Electrostatically Charged Media
- 1.4.3 Sorbent Capture
Chapter 2 Introduction
- 2.1 Report Objectives and Scope
- 2.2 Product Definition and Industry Terminology
- 2.3 Market Inclusions and Exclusions
- 2.4 Research Process
- 2.4.1 Primary Research and Expert Interviews
- 2.4.2 Secondary Research and Source Review
- 2.4.3 Top-Down and Bottom-Up Estimation
- 2.4.4 Data Triangulation and Verification
- 2.5 Market Size Measurement Basis
- 2.5.1 2025: USD 4.84 billion → 2035: USD 8.91 billion
- 2.6 Historical and Forecast Reference Periods
- 2.6.1 Historical Period: 2018-2025
- 2.6.2 Base Year: 2025
- 2.6.3 Forecast Period: 2025-2035
- 2.7 Research Assumptions and Limitations
Chapter 3 Executive Summary
- 3.1 Market Snapshot and Key Findings
- 3.2 Base-Year Market Size, 2025
- 3.3 Forecast Market Size, 2035
- 3.4 Revenue and Volume Growth Outlook
- 3.5 Key Demand and Supply Indicators
- 3.6 Leading Market Segments
- 3.7 Fastest-Growing Market Opportunities
- 3.8 Regional Performance Highlights
- 3.9 Technology and Industry Transformation
- 3.10 Competitive Landscape Summary
- 3.11 Analyst View and Strategic Implications
Chapter 4 United States Air Filter Market Trends and Developments
- 4.1 Historical Industry Development, 2018-2025
- 4.2 Recent Market Trends and Developments
- 4.3 Demand and Customer Behavior Trends
- 4.4 Technology and Product Innovation
- 4.5 Artificial Intelligence, Automation and Digitalization
- 4.6 Local Manufacturing and Supply Chain Realignment
- 4.7 Industry Partnerships, Mergers and Acquisitions
- 4.8 Sustainability and Circular Economy Developments
- 4.9 Government and Private Sector Investment Trends
- 4.10 Emerging Business Models and Commercialization
- 4.11 Industry Developments and Announcements
Chapter 5 United States Air Filter Market Production, Supply and Demand Analysis
- 5.1 Demand Trend and Consumption Analysis, 2018-2025
- 5.2 Demand Forecast, 2025-2035
- 5.3 Production and Output Trend, 2018-2025
- 5.4 Production and Output Forecast, 2025-2035
- 5.5 Installed Capacity and Capacity Utilization
- 5.6 Company-Wise Production Plants and Statistics
- 5.6.1 Installed Production Capacity
- 5.6.2 Actual Production
- 5.6.3 Planned Capacity and Expansion Targets
- 5.7 Supply Chain Structure and Procurement Trends
- 5.8 Supply-Demand Gap and Bottlenecks
- 5.9 Import Dependence and Sourcing Structure
- 5.10 Contract Manufacturing and Outsourcing
- 5.11 Regional Supply and Demand Concentration
Chapter 6 United States Air Filter Market Pricing Analysis
- 6.1 Pricing Structure and Measurement
- 6.2 Historical Pricing Trends, 2018-2025
- 6.3 Pricing Outlook, 2025-2035
- 6.4 Average Selling Price and Unit Economics
- 6.5 Pricing by Product and Market Segment
- 6.6 Geographic Pricing Differences
- 6.7 Key Input, Energy, Labor and Logistics Costs
- 6.8 Contract Pricing and Purchasing Models
- 6.9 Pricing Sensitivity and Competitive Positioning
- 6.10 Price, Margin and Profitability Implications
Chapter 7 United States Air Filter Market Dynamics
- 7.1 Market Growth Drivers
- 7.1.1 Demand-Side Drivers
- 7.1.2 Technology and Innovation Drivers
- 7.1.3 Infrastructure and Investment Drivers
- 7.1.4 Regulatory and Policy Drivers
- 7.2 Market Restraints
- 7.2.1 Cost and Affordability Constraints
- 7.2.2 Technology and Adoption Barriers
- 7.2.3 Supply Chain and Operational Constraints
- 7.3 Market Challenges
- 7.3.1 Competitive Pressure and Margin Erosion
- 7.3.2 Skills, Infrastructure and Implementation Gaps
- 7.4 Emerging Market Opportunities
- 7.5 Market Dynamics Impact and Time-Horizon Assessment
Chapter 8 United States Air Filter Value Chain Analysis
- 8.1 Industry Value Chain Overview
- 8.2 Upstream Suppliers and Critical Inputs
- 8.3 Technology and Component Providers
- 8.4 Manufacturing or Service Delivery
- 8.5 Distribution, Channel Partners and Integrators
- 8.6 Downstream Applications and End Users
- 8.7 Value Addition and Profit Pools
- 8.8 Vertical Integration and Outsourcing
- 8.9 Supplier Concentration and Risk
- 8.10 Supply Chain Localization and Resilience
Chapter 9 United States Air Filter Market Regulations and Policies
- 9.1 Relevant Laws, Standards and Compliance Frameworks
- 9.2 Product, Service, Safety and Quality Requirements
- 9.3 Government Policies, Incentives and Subsidies
- 9.4 Imports, Exports and Trade Barriers
- 9.5 Public Procurement and Local Content Requirements
- 9.6 Environmental and Sustainability Compliance
- 9.7 Upcoming Policy Changes and Market Implications
Chapter 10 United States Air Filter Market Hotspots and Opportunities
- 10.1 Market Opportunity Mapping and Growth Hotspots
- 10.2 High-Growth Applications and Customer Groups
- 10.3 Underserved Markets and White-Space Opportunities
- 10.4 Emerging Technology and Product Opportunities
- 10.5 New Capacity and Investment Hotspots
- 10.6 Market Entry and Expansion Opportunities
- 10.7 Distribution and Partnership Opportunities
- 10.8 Near-Term and Long-Term Commercial Potential
- 10.9 Opportunity Attractiveness and Execution Risks
Chapter 11 United States Air Filter Market Outlook, 2025-2035
- 11.1 Market Size and Analysis
- 11.1.1 Revenue (Market Measurement: 2025: USD 4.84 billion → 2035: USD 8.91 billion)
- 11.1.2 Market Volume and Quantity Sold
- 11.1.3 Historical Market Size, 2018-2025
- 11.1.4 Base-Year Market Size, 2025
- 11.2 Market Forecast, 2025-2035
- 11.2.1 Revenue Forecast to 2035
- 11.2.2 Volume Forecast to 2035
- 11.2.3 CAGR and Year-on-Year Growth
- 11.2.4 Incremental Revenue Opportunity
- 11.3 Forecast Assumptions and Scenario Analysis
- 11.3.1 Base-Case Forecast
- 11.3.2 Optimistic and Conservative Scenarios
- 11.3.3 Technology, Pricing and Policy Sensitivities
- 11.4 Market Attractiveness and Growth Outlook
Chapter 12 United States Air Filter Market Segmentation and Outlook
- 12.1 Segmentation Summary and Market Shares, 2025
- 12.2 Largest and Fastest-Growing Segments
- 12.3 By Product Type - Market Size and Forecast, 2025-2035
- 12.3.1 Segment Definition and Scope
- 12.3.2 Historical Market Size, 2018-2025
- 12.3.3 Revenue Forecast, 2025-2035
- 12.3.4 Volume Forecast, 2025-2035
- 12.3.5 Base-Year Market Share, 2025
- 12.3.6 Segment CAGR and Growth Drivers
- 12.3.7 Subsegment Market Size and Forecast
- 12.3.7.1 Pleated and Panel Filters
- 12.3.7.2 Bag and Cartridge Filters
- 12.3.7.3 HEPA and ULPA Filters
- 12.3.7.4 Molecular Filter Cassettes
- 12.3.8 Subsegment Pricing and Adoption Trends
- 12.3.9 Leading Suppliers and Competition
- 12.3.10 Regional Demand and Opportunities
- 12.4 By Application - Market Size and Forecast, 2025-2035
- 12.4.1 Segment Definition and Scope
- 12.4.2 Historical Market Size, 2018-2025
- 12.4.3 Revenue Forecast, 2025-2035
- 12.4.4 Volume Forecast, 2025-2035
- 12.4.5 Base-Year Market Share, 2025
- 12.4.6 Segment CAGR and Growth Drivers
- 12.4.7 Subsegment Market Size and Forecast
- 12.4.7.1 Commercial Building HVAC Filters
- 12.4.7.2 Residential HVAC Filters
- 12.4.7.3 Industrial Process Filters
- 12.4.7.4 Automotive Air Filters
- 12.4.8 Subsegment Pricing and Adoption Trends
- 12.4.9 Leading Suppliers and Competition
- 12.4.10 Regional Demand and Opportunities
- 12.5 By Technology - Market Size and Forecast, 2025-2035
- 12.5.1 Segment Definition and Scope
- 12.5.2 Historical Market Size, 2018-2025
- 12.5.3 Revenue Forecast, 2025-2035
- 12.5.4 Volume Forecast, 2025-2035
- 12.5.5 Base-Year Market Share, 2025
- 12.5.6 Segment CAGR and Growth Drivers
- 12.5.7 Subsegment Market Size and Forecast
- 12.5.7.1 Mechanical Capture
- 12.5.7.2 Electrostatically Charged Media
- 12.5.7.3 Sorbent Capture
- 12.5.8 Subsegment Pricing and Adoption Trends
- 12.5.9 Leading Suppliers and Competition
- 12.5.10 Regional Demand and Opportunities
- 12.6 Segment Growth Comparison
- 12.7 Segment Attractiveness and Priority Matrix
Chapter 13 United States Air Filter End-Use and Application Market Outlook
- 13.1 End-Use Industry and Customer Demand Structure
- 13.2 Leading Applications and Customer Groups
- 13.3 End-Use Market Size, Share and Forecast
- 13.4 Major End-Use Industry Deep Dives
- 13.4.1 Customer Requirements and Use Cases
- 13.4.2 Demand and Replacement Cycles
- 13.4.3 Technical and Regulatory Considerations
- 13.4.4 Purchasing and Procurement Models
- 13.4.5 Leading Vendors and Distribution Channels
- 13.4.6 Forecast and Commercial Opportunities
- 13.5 Emerging Applications and Cross-Segment Demand
- 13.6 End-Use Industry Investment Priorities
Chapter 14 United States Air Filter Geographic Market Outlook, 2025-2035
- 14.1 Domestic Market Distribution and Demand Clusters
- 14.2 State- or Province-Wise Market Size and Forecast, 2025-2035
- 14.3 City and Metropolitan Market Outlook
- 14.4 Industrial, Manufacturing and Commercial Clusters
- 14.5 Geographic Concentration of Key End Users
- 14.6 Local Pricing and Purchasing Differences
- 14.7 Domestic Production Facilities and Capacity Map
- 14.8 Local Infrastructure and Project Pipeline
- 14.9 State-Level Policy and Incentive Differences
- 14.10 Subnational Investment Hotspots and Opportunities
- 14.11 Distribution and Logistics Networks
- 14.12 Domestic Competitive Footprint
Chapter 15 United States Air Filter Technology, Innovation and Sustainability Outlook
- 15.1 Technology Landscape and Maturity
- 15.2 Product, Process and Service Innovation
- 15.3 AI, Automation and Digital Tools in the Industry
- 15.4 Technology Adoption and Performance Benchmarking
- 15.5 Innovation Pipeline and R&D Investment
- 15.6 Patent and Intellectual Property Trends
- 15.7 Energy Efficiency and Resource Management
- 15.8 Sustainability, Recycling and Circularity
- 15.9 Technology Roadmap, 2025-2035
- 15.10 Risks of Obsolescence and Technology Substitution
Chapter 16 United States Air Filter Market Key Strategic Imperatives
- 16.1 Growth and Market Entry Priorities
- 16.2 High-Return Products and Segments
- 16.3 Pricing, Profitability and Cost Optimization
- 16.4 Technology Investment and Product Differentiation
- 16.5 Supply Chain Localization and Resilience
- 16.6 Distribution and Customer Acquisition
- 16.7 Partnership, Acquisition and Capacity Strategy
- 16.8 Regional Expansion Priorities
- 16.9 Short-, Medium- and Long-Term Actions
Chapter 17 Competition Outlook
- 17.1 Industry Competition Characteristics
- 17.2 Market Structure and Concentration
- 17.3 Market Share and Competitive Positioning, 2025
- 17.4 Company-Wise Revenue and Product Benchmarking
- 17.5 Production and Service Capacity Benchmarking
- 17.6 Technology, Pricing and Differentiation
- 17.7 Regional Footprint and Distribution Strength
- 17.8 Mergers, Acquisitions and Strategic Alliances
- 17.9 New Entrants and Competitive Threats
- 17.10 Porter's Five Forces and Industry Attractiveness
- 17.11 Competitive Outlook, 2025-2035
Chapter 18 Company Profiles
- 18.1 Company Coverage and Selection Criteria
- 18.2 AAF International
- 18.2.1 Business Description
- 18.2.2 Company Ownership and Geographic Presence
- 18.2.3 Product and Service Portfolio
- 18.2.4 Manufacturing and Operating Footprint
- 18.2.5 Production Capacity and Expansion Plans
- 18.2.6 Financial Performance and Investment
- 18.2.7 Market Share and Competitive Position
- 18.2.8 Technology and Innovation Capabilities
- 18.2.9 Strategic Alliances or Partnerships
- 18.2.10 Recent Developments
- 18.2.11 Growth Strategy and Outlook
- 18.3 Parker Hannifin
- 18.4 Donaldson Company
- 18.5 3M
- 18.6 Camfil
- 18.7 Other Relevant Market Participants
Note: Every listed company is profiled on the structure shown under the first company. The company list is preliminary and may change based on research findings, market developments, data availability and client requirements.
Chapter 19 Disclaimer
- 19.1 Research and Forecast Disclaimer
- 19.2 Data Source and Estimation Limitations
Note: The depth of individual sections depends on data availability for this market. Volume, capacity, trade and other unit-based metrics are included where applicable.