
USA electric arc furnace demand rests on a minimill base
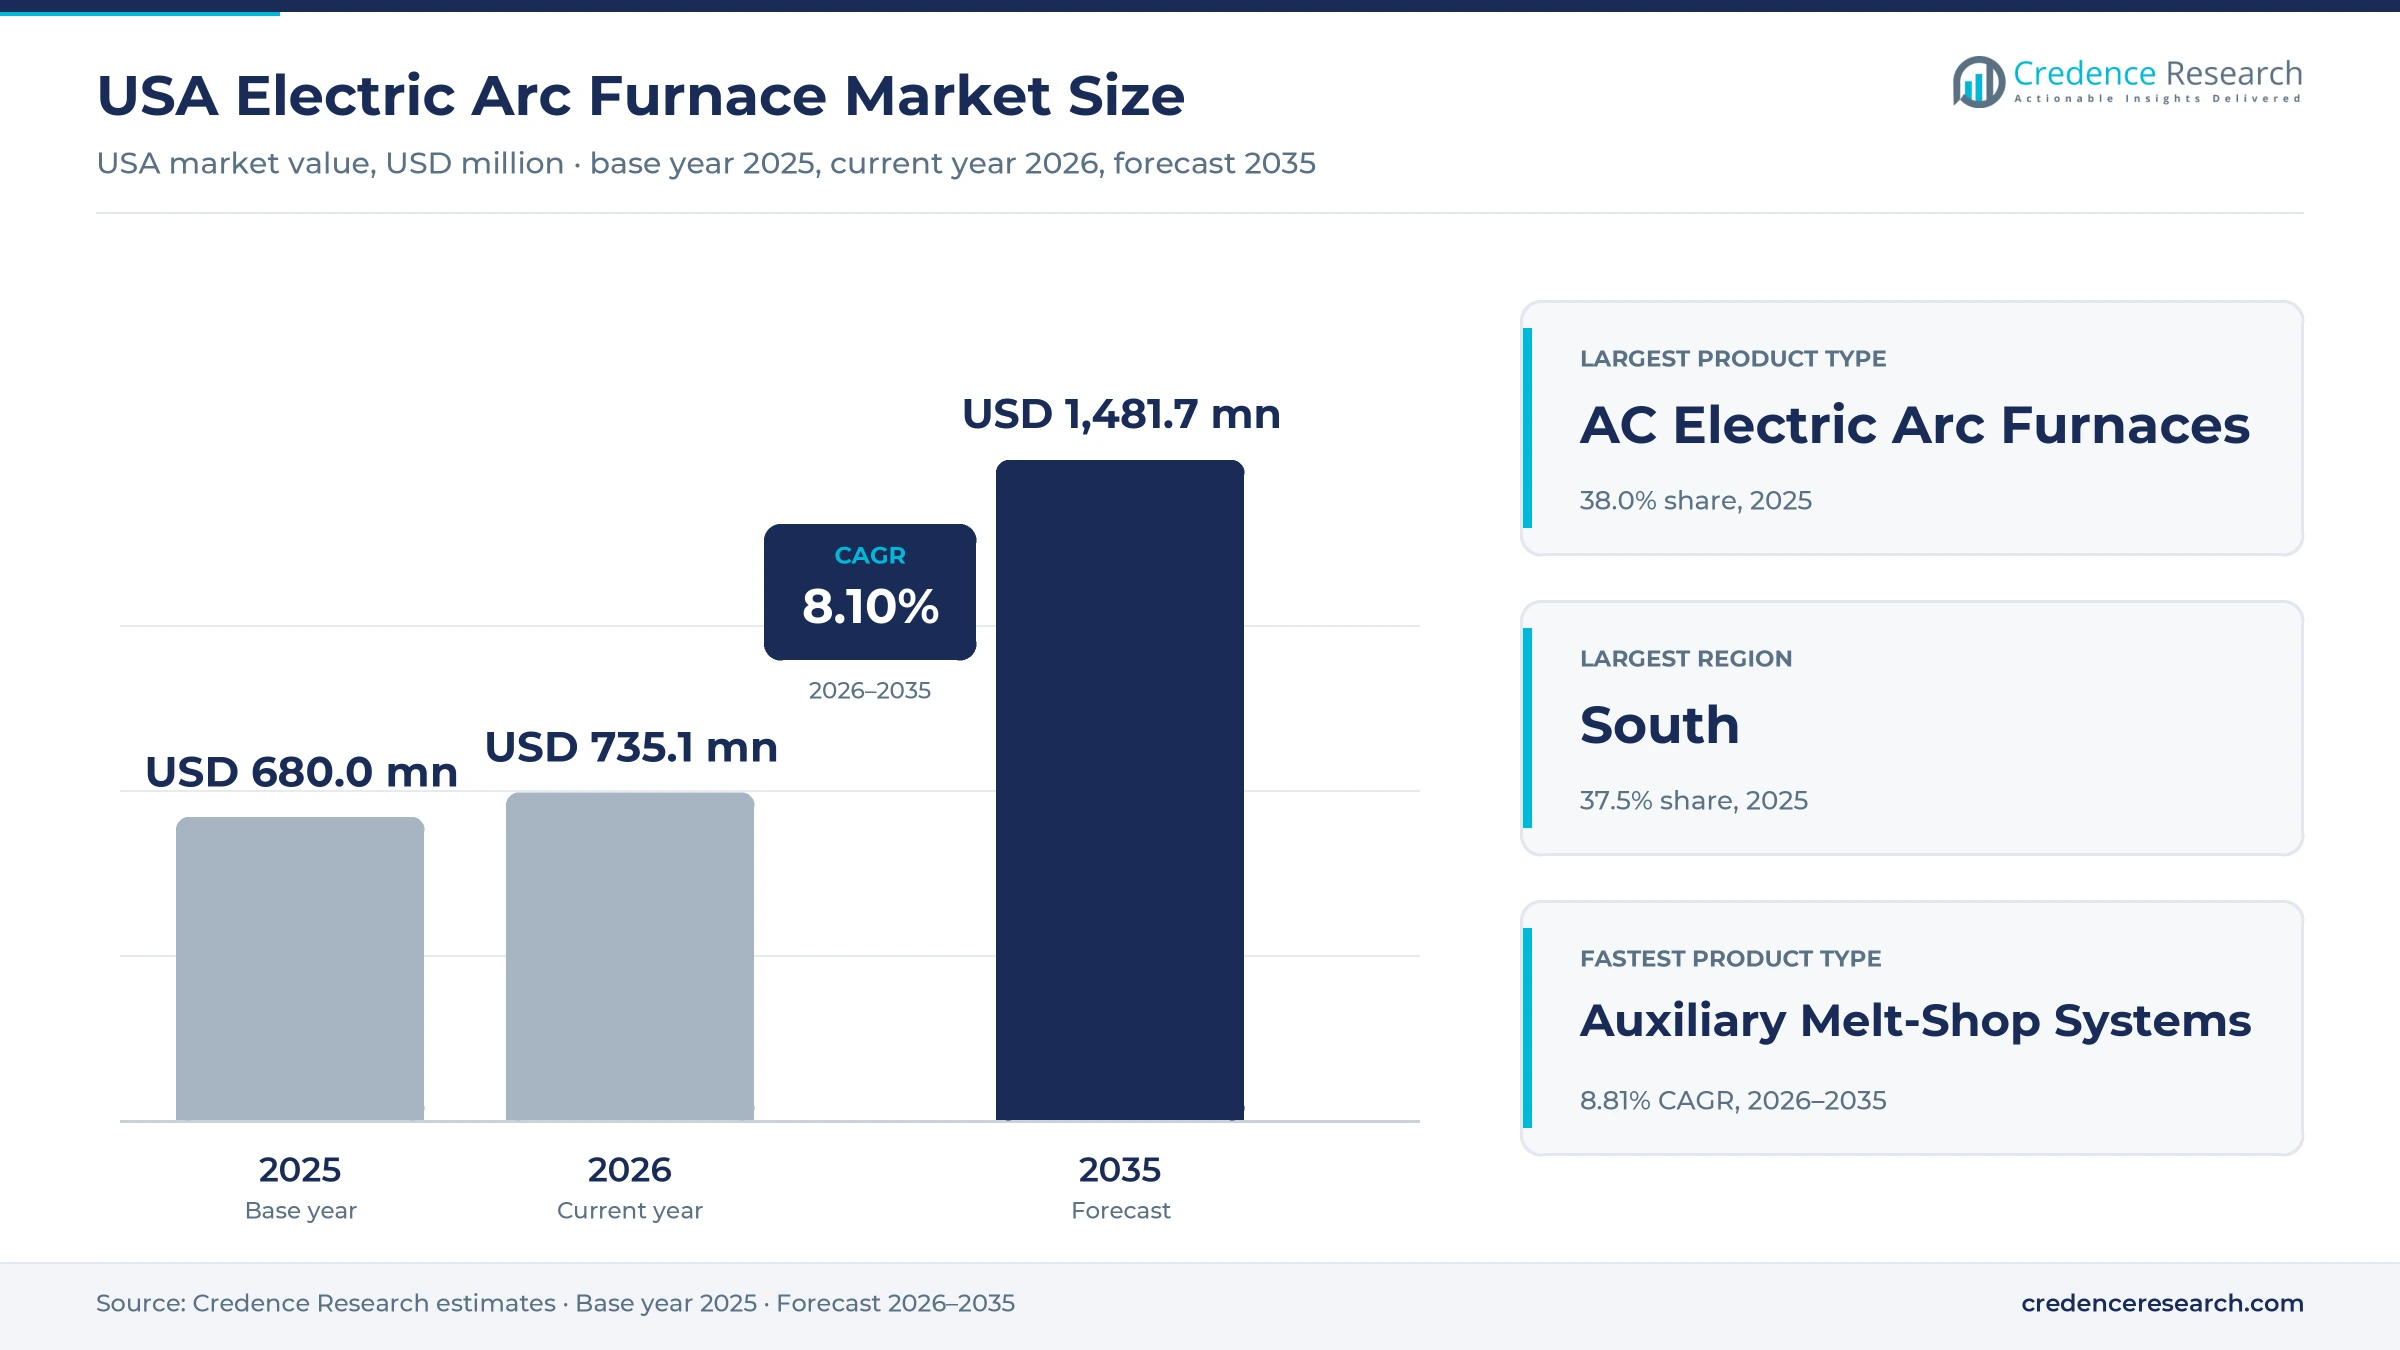
The USA electric arc furnace market was valued at USD 680.0 million in 2025 and is projected to increase from USD 735.1 million in 2026 to USD 1.48 billion by 2035, registering a CAGR of 8.10% during 2026–2035. Demand rests on a steel industry in which electric furnaces already dominate output, since the U.S. Geological Survey counts 47 companies running 102 minimills against two integrated producers. New melt shops for Nucor, Hyundai Steel and POSCO, and Commercial Metals anchor the order book, while Environmental Protection Agency rules raise capture standards for furnaces built or modified after May 16, 2022. The South held the largest regional share, 37.5% in 2025, and it is also the fastest-growing zone at 8.63% a year because most announced greenfield tonnage sits there. A 50% Section 232 tariff in force since June 4, 2025, has strengthened the case for domestic capacity. As a result, buyers are specifying power electronics that limit grid disturbance in several new furnace contracts.
What does this melt-shop equipment market count?
The market counts furnace vessels, transformers and power feeders, electrode regulation, fume and off-gas systems, scrap charging and preheating lines, process automation, engineering, rebuilds and service agreements sold to plants in the United States. Buyers usually purchase these items through a direct contract with an equipment maker, an engineering package or a multi-year service agreement.
The market excludes consumables such as graphite electrodes and refractories, as well as scrap, electricity, buildings, casters and rolling mills. This boundary matters because a published mill budget covers far more than the melt shop, so project headlines overstate what furnace suppliers actually sell.
USA Electric Arc Furnace Market Insights
- The market grows from USD 680.0 million in 2025 to USD 1.48 billion by 2035, an 8.10% CAGR over 2026–2035, as new melt shops and retrofit work overlap.
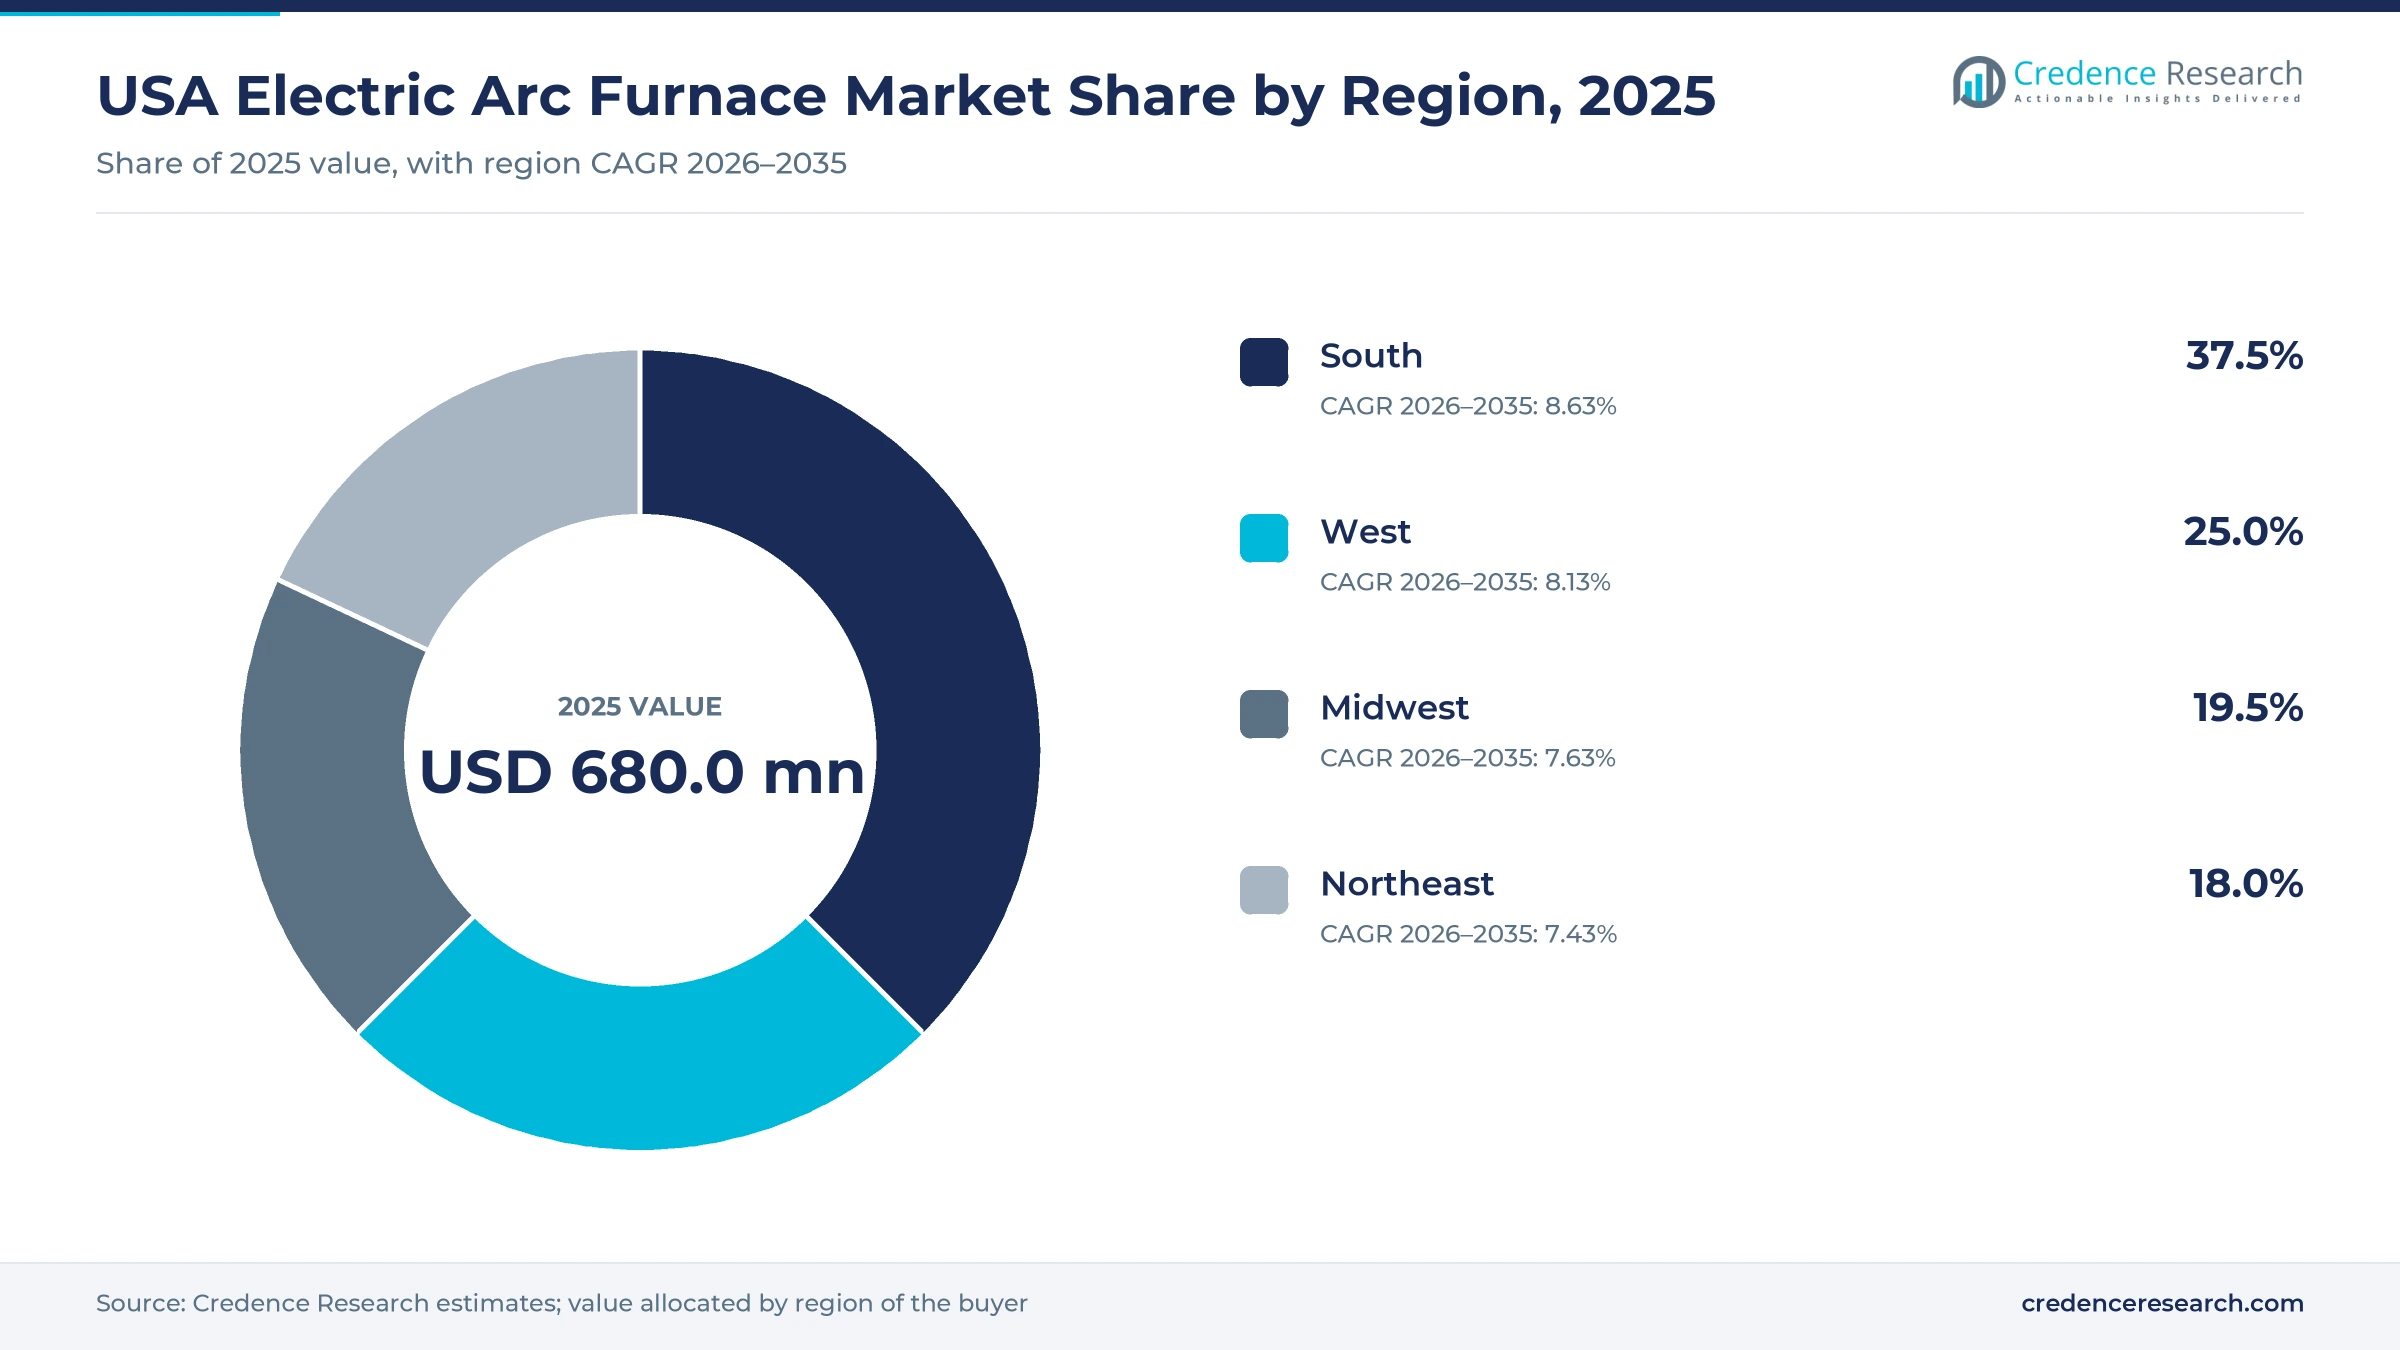
- The South held 37.5% of 2025 value, supported by projects in Louisiana, Alabama, Texas and West Virginia that lift its order book.
- AC Electric Arc Furnaces led product demand with 38.0% of 2025 value in the Credence Research model, with replacement orders such as the 68-ton Primetals award sustaining it.
- The Environmental Protection Agency set a 0.16 pound per ton particulate limit in August 2023, which raised fume capture costs for furnaces built or modified after May 16, 2022.
- SMS group, Danieli, Tenova and Primetals won the named American furnace awards reviewed here, so overseas technology owners hold the large contracts while local service capacity becomes a selling point.
AC units lead while auxiliary systems and service gain share
Why do AC furnaces still lead product demand?
Based on product type, the market is categorized into AC electric arc furnaces, DC electric arc furnaces, submerged arc furnaces and auxiliary melt-shop systems. AC Electric Arc Furnaces led with 38.0% of 2025 value because replacement work favors the design already installed, as with the 68-ton furnace Primetals Technologies won in November 2024 to replace two spout-tapping units. Auxiliary Melt-Shop Systems grow fastest at 8.81% a year, as packages widen and the Tenova order for Vinton Steel in February 2025 bundled fume treatment, water treatment and electrical distribution with the furnace.
How much of the demand comes from carbon steel mills?
Based on end-use industry, the market is categorized into carbon steel, specialty steel, stainless steel and foundry and ferroalloy. Carbon Steel led with 68.0% of 2025 value because the largest projects make sheet and long products, including the 3-million-ton Nucor sheet mill in Apple Grove, West Virginia. Specialty Steel grows fastest at 8.99% a year, as ArcelorMittal plans a nongrain-oriented electrical steel unit at Calvert for the first half of 2027. Smaller ferroalloy buyers remain trade-sensitive, since the U.S. International Trade Commission found on April 30, 2025, that ferrosilicon imports from Brazil, Kazakhstan and Malaysia materially injured the domestic industry.
Which projects carry the most furnace value?
Based on application, the market is categorized into new melt shops, capacity expansion, furnace replacement and modernization and compliance. New Melt Shops led with 45.0% of 2025 value because a single greenfield award can cover several furnaces, as the two 210-ton DC units SMS group supplies to Nucor in West Virginia show. Modernization and Compliance grows fastest at 8.77% a year, as Tenaris plans over $90 million of upgrades at its Koppel and Ambridge sites in Pennsylvania, including a furnace revamp ordered in June 2026.
How do steelmakers buy furnaces and service?
Based on sales channel, the market is categorized into direct OEM contracts, EPC packages, system integrators and aftermarket service agreements. Direct OEM Contracts led with 52.0% of 2025 value because mills buy core technology straight from its owner, as Hyundai and POSCO did when they chose Danieli in May 2026 for two furnaces and two thick slab casters. Aftermarket Service Agreements grow fastest at 8.74% a year, as software support extends beyond hardware, with a May 2025 AISTech paper describing AMI Automation machine learning at Nucor Steel-Arkansas, after a 2019 deal gave Gerdau Long Steel North America AMI monitoring across its furnace fleet.
| Segment Group | Leading Sub-segment | Share, 2025 | Fastest-growing Sub-segment | CAGR, 2026–2035 |
|---|---|---|---|---|
| By Product Type | AC Electric Arc Furnaces | 38.0% | Auxiliary Melt-Shop Systems | 8.81% |
| By End-Use Industry | Carbon Steel | 68.0% | Specialty Steel | 8.99% |
| By Application | New Melt Shops | 45.0% | Modernization and Compliance | 8.77% |
| By Sales Channel | Direct OEM Contracts | 52.0% | Aftermarket Service Agreements | 8.74% |
Request a Free Sample
Fill in your details and we'll send you a free sample report.
- Sample data tables & charts
- Research methodology
Fleet size, tariffs and rules keep melt-shop orders moving
How large is the domestic electric furnace base?
The installed base creates recurring work that continues whether or not new mills are announced. The U.S. Geological Survey reports that 47 companies made raw steel in electric furnaces at 102 minimills in 2025, while two companies ran integrated mills at eight locations. Integrated plants produced about 28% of domestic steel in the same survey, which leaves electric routes with the clear majority of about 82 million tons of output. The Environmental Protection Agency separately counted about 88 furnaces across 31 states in its 2023 rulemaking. Each of these furnaces needs shells, electrode arms, transformers and controls on a repeating cycle, so New Melt Shops sit on top of a steady base of replacement demand.
What is the scale of melt-shop capital spending?
Capital commitments are large enough to fill supplier order books for several years ahead. The Steel Manufacturers Association told Congress in February 2026 that its industry is investing about $25 billion in American facilities. Nucor alone has invested nearly $20 billion since 2020, according to executive Dan Needham at the Fastmarkets summit on Jan. 29, 2026. An analysis in Recycling Today counted 19.6 million net tons of new capacity announced since 2020, although not every project is certain to proceed. A Japan-based steel company is also expected to generate $11 billion in domestic steelmaking investment through 2028, the U.S. Geological Survey noted. In turn, the South captures the largest regional share because much of this tonnage lands there.
Why are digital and environmental upgrades rising?
Federal rules and process software now shape spending whenever a furnace is built, rebuilt or modified. The August 2023 federal rule set a facility-wide limit of 0.16 pound of particulate per ton of steel and 0% melt shop opacity during melting and refining for furnaces built or modified after May 16, 2022. Agency cost modeling put baghouse capital costs for its model plants between about $0.8 million and $21.9 million, depending on size. Software adds a second reason to spend, because a May 6, 2025, AISTech paper described AMI Automation machine learning at Nucor Steel-Arkansas improving furnace performance and refractory life. As a result, Modernization and Compliance grows at 8.77% a year, which is faster than any other application in the Credence Research model.
How have tariffs changed the domestic investment case?
Trade protection has raised confidence that new American furnace capacity can find customers. The White House raised Section 232 steel tariffs from 25% to 50% effective June 4, 2025, citing capacity utilization of 75.3% in 2023. Nucor executive Dan Needham said imports fell from about 25% of the finished steel market in early 2025 to 16% by October. The American Iron and Steel Institute then recorded 2025 output of about 89.3 million tons through Dec. 27, up 3.4%, with utilization averaging 76.7% against 75.4% in 2024. This protection supports furnace orders directly, because mills can plan new tonnage with less import risk, and it helps explain the forecast growth.
Power feeders and scrap preheating reshape furnace contracts
The rise of power feeders that limit grid disturbance
Furnace power supplies are shifting from a background item to a headline specification in new contracts. Danieli said its Q-One feeder for Nucor Kingman in Arizona, ordered in November 2022, reduces network disturbances and can use renewable energy generated on site. Primetals Technologies supplied an Active Power Feeder with the 68-ton American furnace it won in November 2024, converting power directly from AC to AC at medium voltage. Commercial Metals states in its fiscal 2026 annual filing that its West Virginia micro mill uses the latest furnace power supply technology, which lowers overall power consumption. These choices reflect a real constraint, since furnace demand on the grid typically reaches 40 to 200 megawatts per mill, the Steel Manufacturers Association says.
A shift toward continuous charging and smaller furnaces
Several recent American orders favor compact, continuously charged furnaces over large batch units serving long-product plants. Tenova will supply Vinton Steel in El Paso, Texas, with a 45-ton Consteel furnace that preheats scrap, lifting annual capacity to 400,000 metric tons, according to SteelOrbis in February 2025. Danieli equipped the Commercial Metals micro mill near Martinsburg, West Virginia, with a Digimelter and an endless scrap charging system for a 500,000-ton melt shop. Its Kingman order for Nucor described over 630,000 short tons of liquid steel a year. This approach suits regional rebar supply, because a smaller mill sits close to customers and needs less capital, so it widens the buyer pool beyond the largest steelmakers.
An opening in melt shops built around direct reduced iron
Suppliers that can tune furnaces for iron units beyond scrap have a clear opening over the next decade. Hyundai Steel held a ceremonial event on Sept. 5, 2026, for its $5.8 billion, 2.7-million-metric-ton mill in Ascension Parish, Louisiana, which pairs direct reduction with electric furnaces and targets commercial production in 2029. U.S. Steel announced on Nov. 12, 2025, that it will add a plant for direct reduced iron at Big River Steel Works in Osceola, Arkansas, using pellets from its Minnesota operations. The 2025 AISTech paper from AMI Automation and Nucor Steel-Arkansas already reports tuning feed rates of these iron units along with chemical energy and power input. Consequently, furnace makers and software vendors can sell recipes and controls as well as hardware to these producers.
An opening in specialty and stainless melt-shop upgrades
Specialty producers offer a smaller but more technical opening for furnace and ladle suppliers. Primetals Technologies won a 180-metric-ton twin ladle furnace order from Outokumpu at Calvert, Alabama, in July 2026, replacing a stand commissioned in 2012, with startup planned for March 2028. At the same site, Jefferson Shredding and Recycling plans a $22.4 million shredder feeding about 9,000 tons a month of scrap to the furnace, according to Steel Market Update in May 2026. ArcelorMittal targets the first half of 2027 for a unit making nongrain-oriented electrical steel nearby. These projects explain why Specialty Steel grows at 8.99% a year, because such grades need tighter melt control.
Power, metallics and utilization limit melt-shop spending
Can the grid serve new furnace load at a workable price?
Power access is the largest operating risk, because a furnace mill typically draws 40 to 200 megawatts, according to a February 2026 Steel Manufacturers Association statement to Congress. The group warned that its planned investments depend heavily on cost-competitive and reliable supply. Mills in constrained grids therefore face slower connections and higher bills, which can delay a furnace order. Buyers are responding by specifying feeders that reduce network disturbance, although this adds to the cost of each electrical package.
How exposed are mills to scrap and consumable costs?
Metallic costs squeeze the budgets that fund furnace upgrades, particularly at mills without captive iron units. Argus Media reported on Dec. 24, 2025, that No. 1 busheling averaged $390 a gross ton in December, up 4%, while shredded scrap averaged $378. Consumables such as graphite electrodes compete for the same maintenance money at each plant. Shops respond by favoring software and scrap preheating that cut energy use, while deferring larger rebuilds when margins tighten.
What happens when decarbonization projects are abandoned?
Federal funding is no longer a dependable source of new electric melting demand at integrated plants. Cleveland-Cliffs announced on Aug. 21, 2026, that its $1 billion Middletown Works project would refurbish the blast furnace, dropping an earlier plan for hydrogen-based electric furnaces while keeping a $500 million Energy Department grant, according to Ideastream Public Media. Equipment suppliers therefore lost a marquee conversion, and similar blast furnace replacements now look less certain. Suppliers are consequently leaning on minimill work, where the economics do not rely on grants.
Could excess capacity delay the next round of orders?
New capacity is arriving while the industry still runs well below full rates, which could slow later awards. The American Iron and Steel Institute put the capability rate at 74.4% in the first week of 2026, and Recycling Today suggested added furnace capacity may be a factor. The U.S. Geological Survey also noted that one company halted a 2.7-million-ton Illinois mill in 2025 while keeping it ready for restart. A 2.7-million-ton mill kept ready for restart could meet demand without a new furnace order, so suppliers are leaning on replacement and compliance work.
The South holds the largest pipeline of new melt shops
| Region | Value, 2025 (USD million) | Share, 2025 | CAGR, 2026–2035 |
|---|---|---|---|
| South | 255.0 | 37.5% | 8.63% |
| West | 170.0 | 25.0% | 8.13% |
| Midwest | 132.6 | 19.5% | 7.63% |
| Northeast | 122.4 | 18.0% | 7.43% |
The South leads on greenfield tonnage
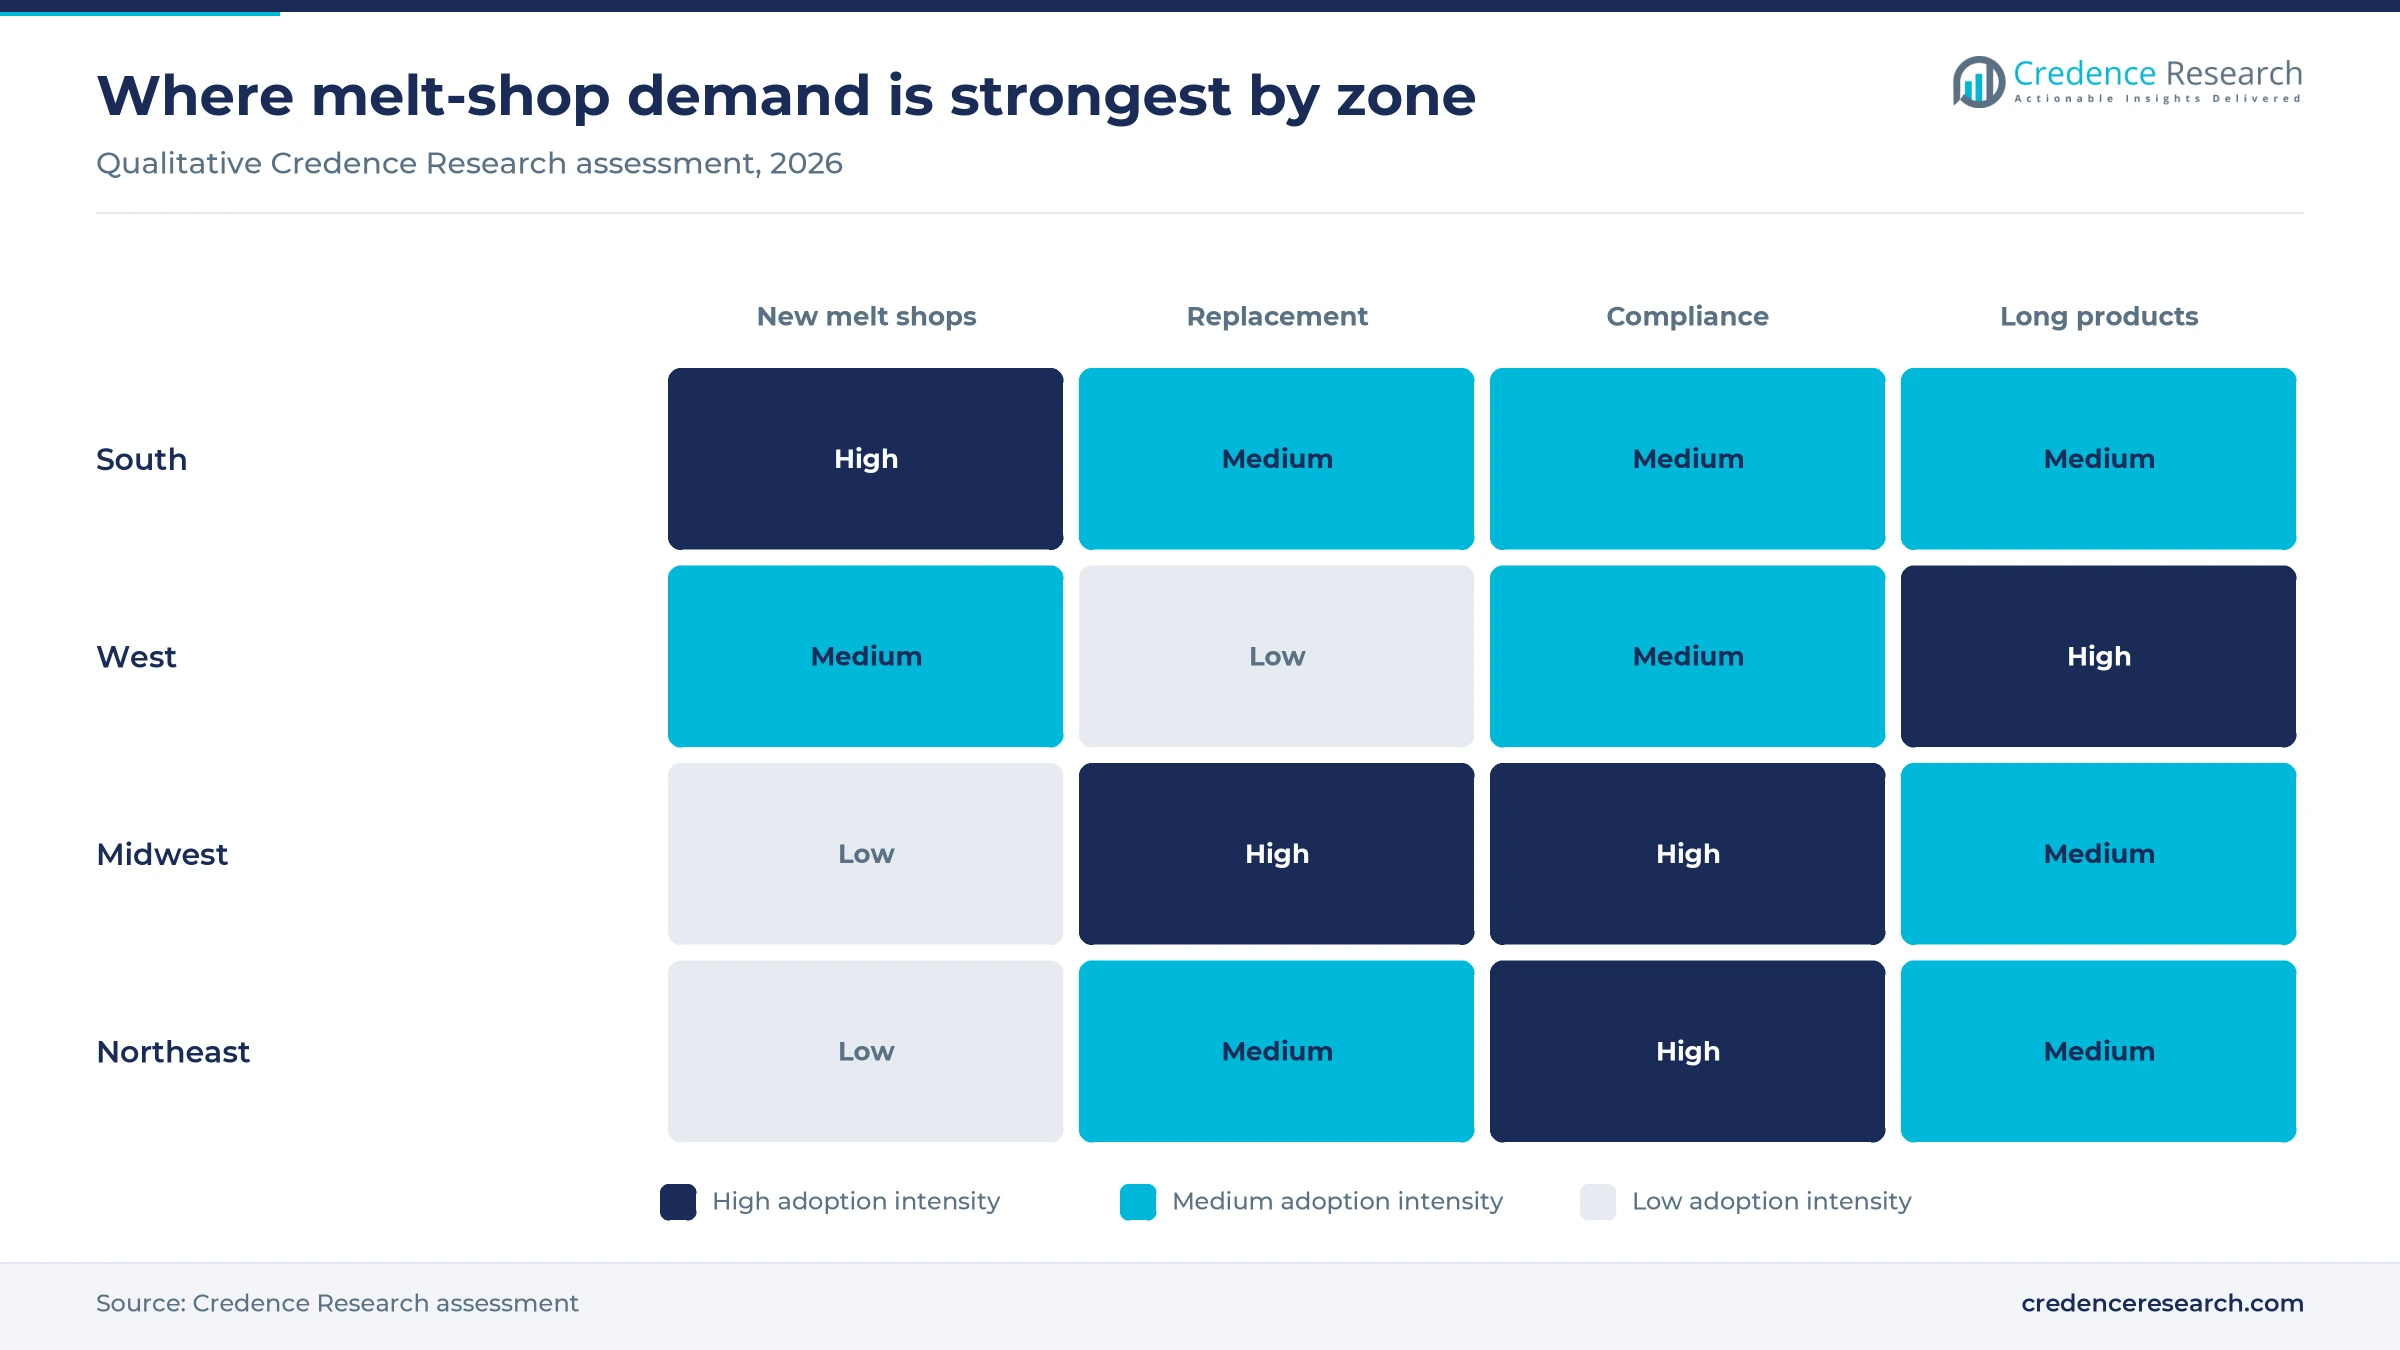
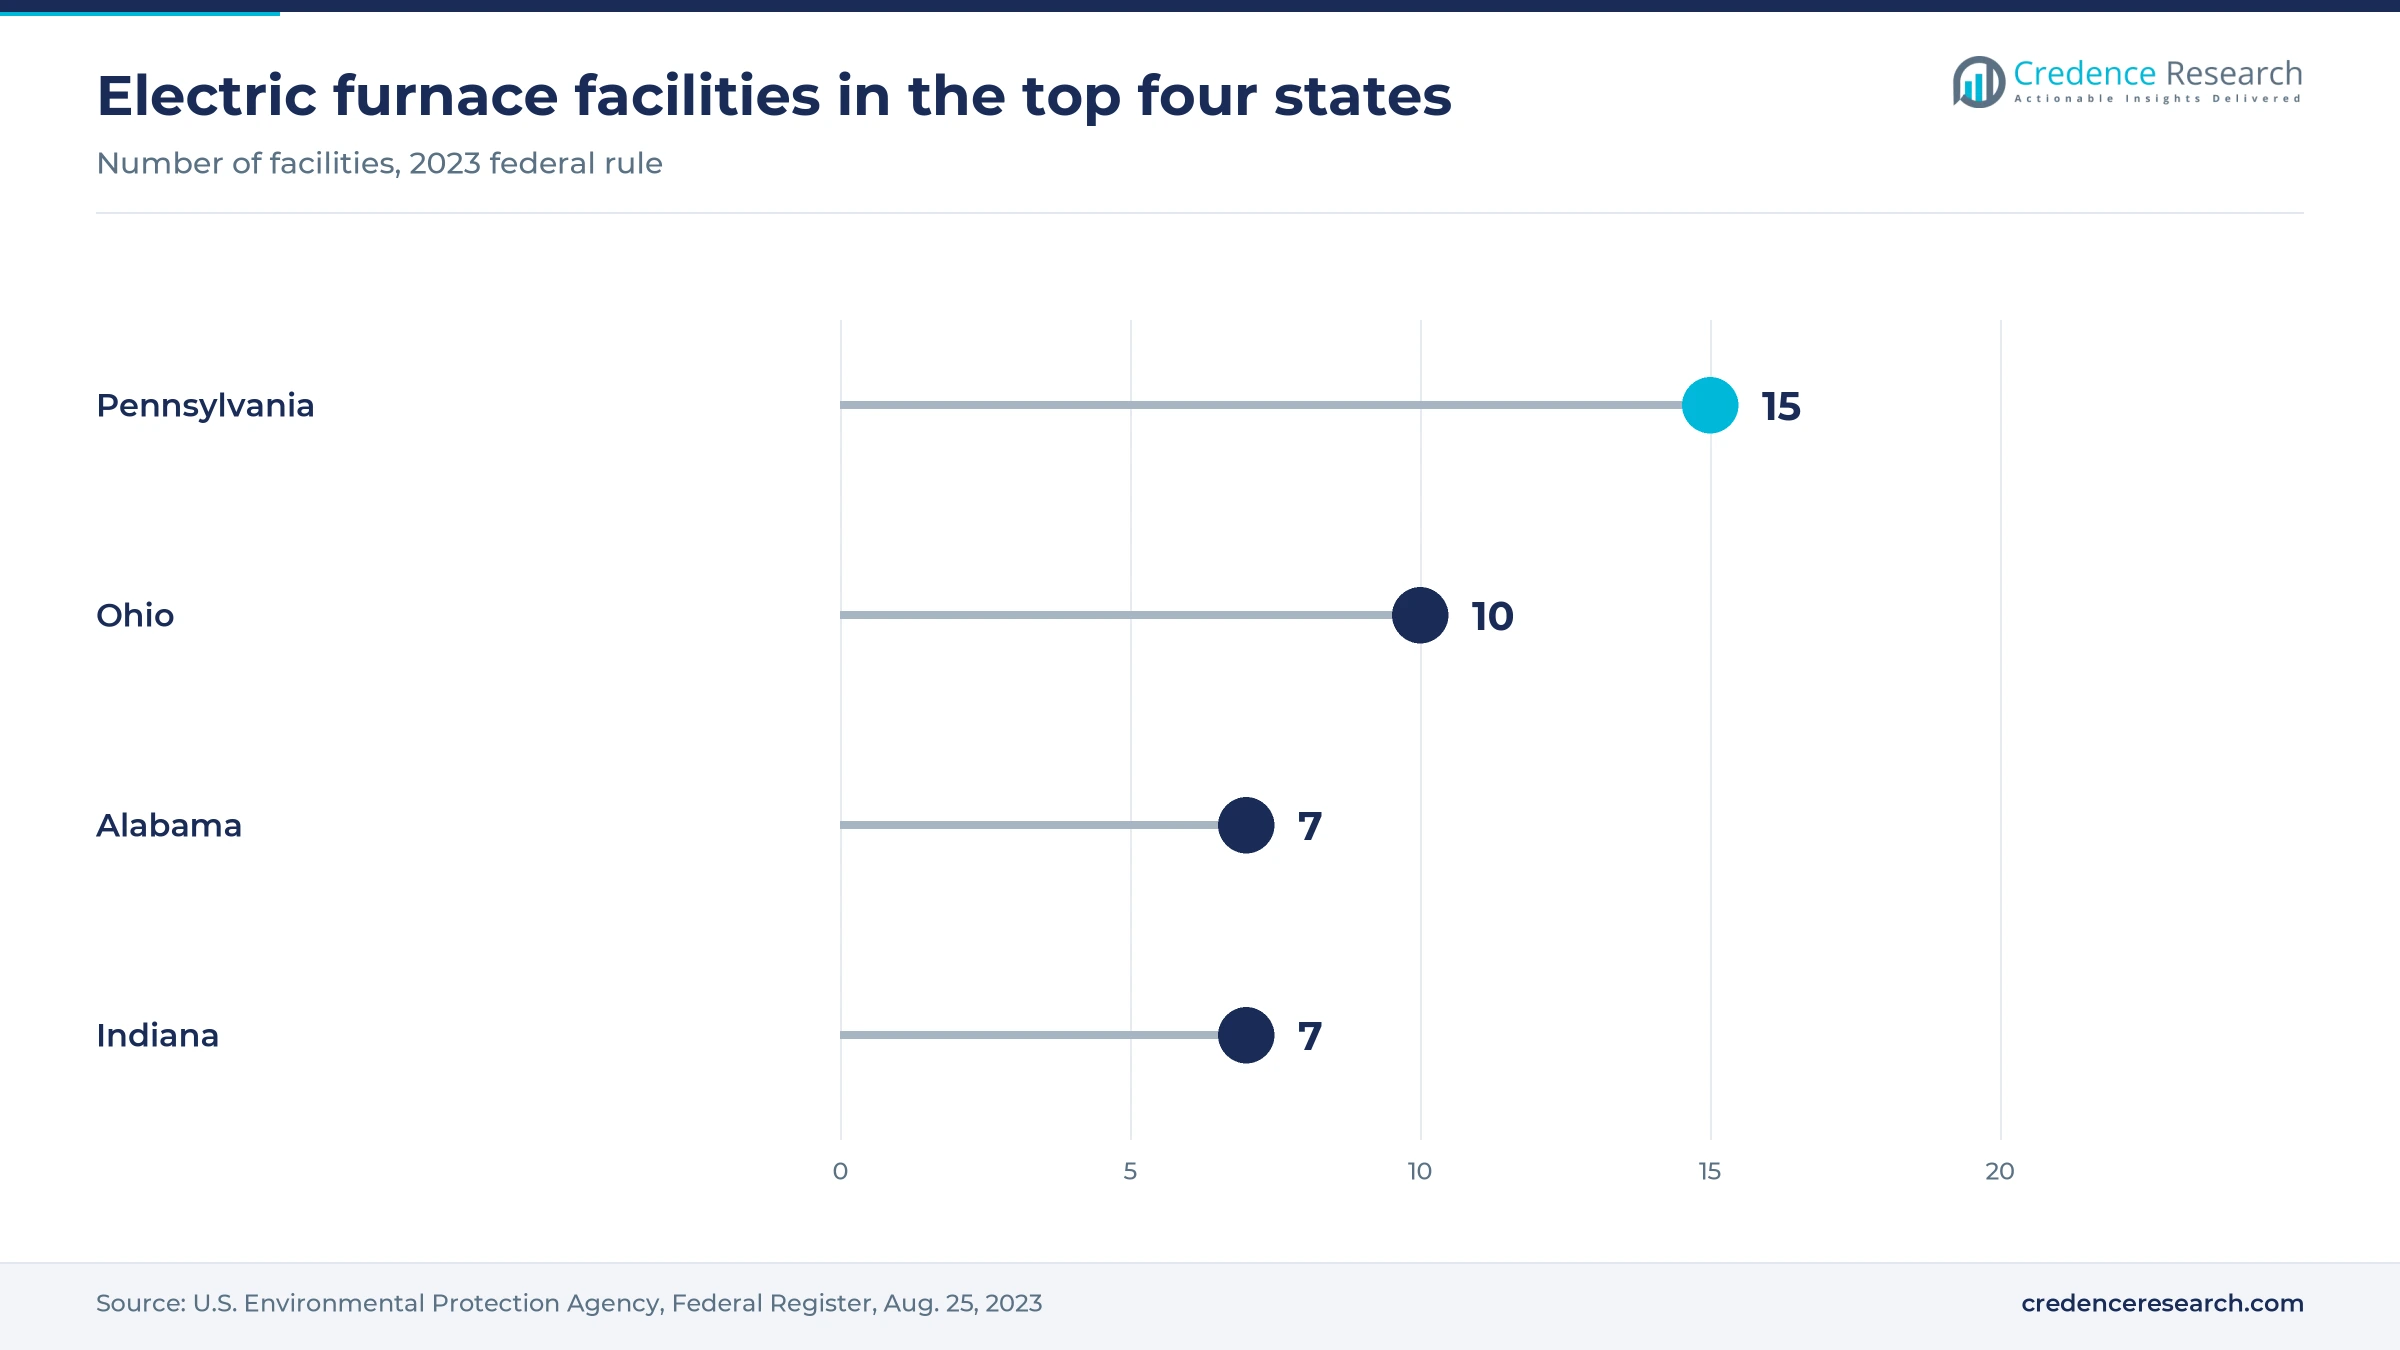
The South held 37.5% of 2025 value and grows at 8.63% a year, the fastest of the four zones. The two Danieli furnaces for the Hyundai and POSCO project in Louisiana, the SMS group units at Apple Grove in West Virginia and the 1.5-million-ton ArcelorMittal furnace at Calvert, Alabama, all sit here. Gerdau also plans a $51.5 million expansion at Midlothian, Texas, for the second half of 2026. The Environmental Protection Agency counted seven furnace facilities in Alabama alone in its 2023 rule.
The West grows on rebar micro mills
The West held 25.0% of 2025 value and grows at 8.13% a year, with long products rather than sheet setting the pace. Nucor ordered Digimelter equipment for Kingman, Arizona, to supply over 630,000 short tons of liquid steel a year, replacing an old shaft-type DC furnace. The U.S. Geological Survey also reports that a 450,000-ton rebar minimill began construction in southern California in 2025. Long distances from eastern mills favor these smaller regional plants, which is why the zone keeps a meaningful share of equipment orders.
The Midwest spends on existing plants
The Midwest held 19.5% of 2025 value and grows at 7.63% a year, because replacement and compliance work outweighs new sites. Indiana produced 19% of American raw steel in 2025 and Ohio produced 8%, the U.S. Geological Survey reports, although integrated mills account for part of that output. The Environmental Protection Agency counted 10 furnace facilities in Ohio and seven in Indiana in 2023. However, the August 2026 Middletown decision keeps a large Ohio site on a blast furnace, which limits conversion demand in this zone.
The Northeast relies on modernization work
The Northeast held 18.0% of 2025 value and grows at 7.43% a year, the slowest pace, since few greenfield sites are planned. Pennsylvania has the most furnace facilities of any state, with 15 in the 2023 Environmental Protection Agency count, although it produced only 4% of national raw steel in 2025. The Tenova revamp at Koppel shows what demand looks like here, as older furnaces gain upgraded cooling-circuit monitoring. Commercial Metals also says its West Virginia mill will serve Northeast customers, which adds competition for local rebar producers.
Contracts from 2024 to 2026 show a full project pipeline
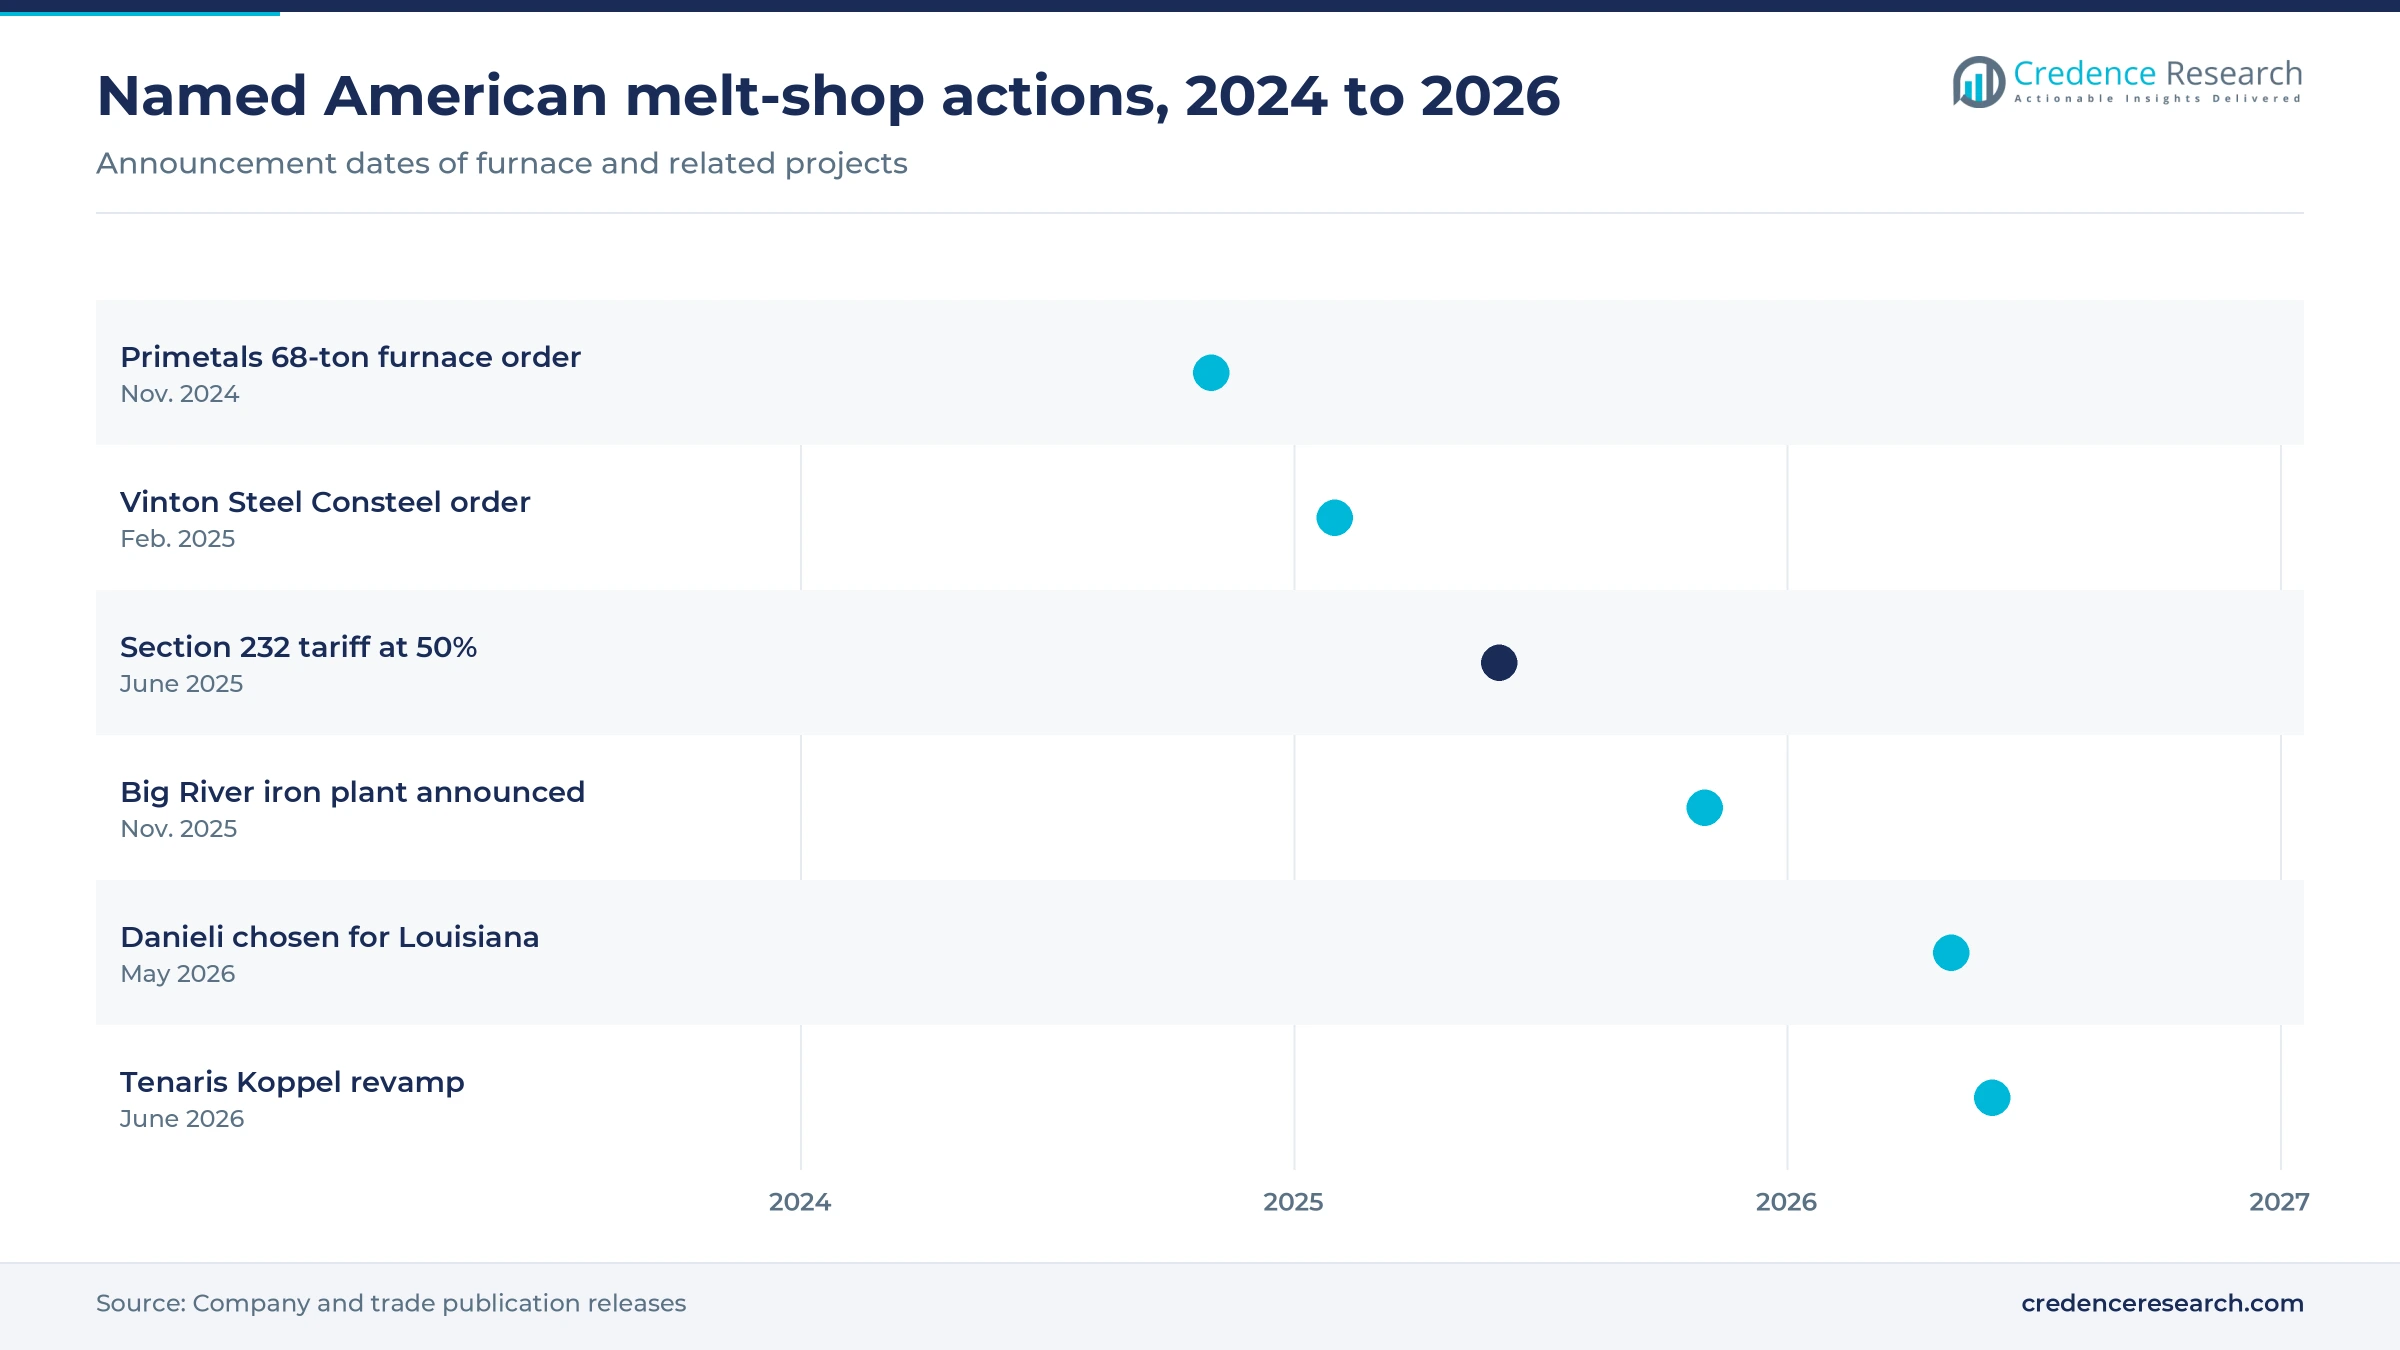
| Development | Status and market relevance |
|---|---|
| In November 2024, Primetals Technologies won a 68-ton furnace order from an unnamed American producer, replacing two spout-tapping furnaces. | Startup is planned for late 2026 |
| In February 2025, SteelOrbis reported that Vinton Steel in El Paso ordered a melt shop from Tenova with a 45-ton Consteel furnace. | Capacity rises to 400,000 metric tons a year |
| In November 2025, U.S. Steel announced a direct reduced iron plant at Big River Steel Works in Arkansas. | No construction timetable has been released |
| In May 2026, Danieli said Hyundai and POSCO chose it for two furnaces, two thick slab casters and two reheating furnaces in Louisiana. | Covers melting, casting and reheating equipment |
| In June 2026, Tenova said it will supply the furnace revamp at the Tenaris mill in Koppel, Pennsylvania. | Part of a program above $90 million |
Power supply and process control decide new furnace value
- Active power feeders convert power directly from AC to AC at medium voltage, a feature of the 68-ton Primetals order for an American producer.
- DC furnaces remain the choice for large sheet projects, as the two 210-ton SMS group units for Nucor in West Virginia demonstrate.
- Continuous scrap charging preheats the charge and appears in the Vinton Steel Consteel order and the Commercial Metals Digimelter line.
- Machine learning models tune feed rates, chemical energy and power input, as the 2025 AMI Automation work at Nucor Steel-Arkansas describes.
Need a Custom Version of This Report?
Tailor the scope, geography, or segments to your exact requirements.
- Custom geography or segment scope
- Direct access to our analyst team
Overseas OEMs win the large American melt-shop awards
Competition splits between full-line melt-shop suppliers and specialists in power and control. SMS group holds the largest named sheet award reviewed here, with two 210-ton DC furnaces, two twin ladle furnaces and two vacuum tank degassers for Nucor in West Virginia. Danieli is strong in both greenfield sheet and micro mills, having won the Hyundai and POSCO furnaces and the Commercial Metals West Virginia melt shop. Tenova competes through its American subsidiary and says the Koppel revamp will be executed entirely in the United States, from engineering through manufacturing. Primetals Technologies wins replacement and ladle work, including the 68-ton furnace and the Outokumpu order at Calvert. AMI Automation sells monitoring and optimization to existing fleets instead of hardware.
Companies profiled and their roles in this market
| Company | Type | Role in the market |
|---|---|---|
| SMS group GmbH | Melt-shop OEM | Two 210-ton DC furnaces and ladle metallurgy for Nucor in West Virginia |
| Danieli & C. Officine Meccaniche S.p.A. | Melt-shop OEM | Hyundai and POSCO furnaces in Louisiana, Nucor Kingman, Commercial Metals West Virginia |
| Tenova S.p.A. | Melt-shop OEM | Vinton Steel Consteel melt shop and Tenaris Koppel revamp |
| Primetals Technologies Limited | Melt-shop OEM | 68-ton American furnace order and Outokumpu ladle furnace at Calvert |
| AMI Automation | Process control | Furnace optimization at Nucor Steel-Arkansas and across the Gerdau North American fleet |
Retrofit work should steady demand after the sheet-mill wave
Credence Research's view is that the market moves from a project-led phase toward a mixed phase in which service and compliance carry more weight. The Nucor sheet mill finishes commissioning in 2026 and the Hyundai and POSCO furnaces follow, so large awards remain visible for several years. However, the abandoned Middletown conversion shows that integrated plants are not a dependable source of new furnaces. Suppliers with field service inside the United States therefore hold an advantage, because demand from the 88 existing furnaces counted by regulators recurs every year regardless of the steel cycle.
How the melt-shop equipment estimate was built
The report uses 2025 as the base year and 2035 as the forecast year, and market values come from the Credence Research model. The 2025 estimate combines a top-down share of worldwide furnace equipment spending with a bottom-up build of announced investment, fleet service, replacement and compliance spending. Segment and regional splits are Credence Research estimates informed by those public records. Sources are public statistics, federal rules, company filings, supplier announcements and named trade publications, and no interviews or surveys were conducted.
Service and compliance gain weight through 2035
The market should more than double by 2035, reaching USD 1.48 billion at an 8.10% CAGR over 2026–2035. Greenfield awards should stay strong through the Louisiana project, then ease as the current wave of sheet mills completes. In turn, replacement of aging furnaces, which brings units under the 2023 particulate rule when they are modified, should take a larger share of spending. Power availability is the main variable, since it decides where new furnaces can connect. Buyers should expect more software and service contracts, while suppliers should expect tighter demands for local engineering.
Frequently Asked Questions
How big is the USA electric arc furnace market?
What does this market include?
Which product type leads the market?
Which region is the largest?
How many electric furnace mills operate in the United States?
Which rule affects melt-shop projects most?
Which companies supply the largest American projects?
What is the main risk to furnace demand?
Table of Content
Chapter 1 Market Segmentation
- 1.1 Segmentation Framework
- 1.1.1 Product and Service Classification
- 1.1.2 Application and End-Use Classification
- 1.1.3 Technology and Solution Classification
- 1.1.4 Customer and Distribution Channel Classification
- 1.1.5 Geographic Segmentation
- 1.1.6 Market Segment Definitions and Boundaries
- 1.2 By Product Type
- 1.2.1 AC Electric Arc Furnaces
- 1.2.2 DC Electric Arc Furnaces
- 1.2.3 Submerged Arc Furnaces
- 1.2.4 Auxiliary Melt-Shop Systems
- 1.3 By End-Use Industry
- 1.3.1 Carbon Steel
- 1.3.2 Specialty Steel
- 1.3.3 Stainless Steel
- 1.3.4 Foundry and Ferroalloy
- 1.4 By Application
- 1.4.1 New Melt Shops
- 1.4.2 Capacity Expansion
- 1.4.3 Furnace Replacement
- 1.4.4 Modernization and Compliance
- 1.5 By Sales Channel
- 1.5.1 Direct OEM Contracts
- 1.5.2 EPC Packages
- 1.5.3 System Integrators
- 1.5.4 Aftermarket Service Agreements
Chapter 2 Introduction
- 2.1 Report Objectives and Scope
- 2.2 Product Definition and Industry Terminology
- 2.3 Market Inclusions and Exclusions
- 2.4 Research Process
- 2.4.1 Primary Research and Expert Interviews
- 2.4.2 Secondary Research and Source Review
- 2.4.3 Top-Down and Bottom-Up Estimation
- 2.4.4 Data Triangulation and Verification
- 2.5 Market Size Measurement Basis
- 2.5.1 2025: USD 680.0 million → 2035: USD 1.48 billion
- 2.6 Historical and Forecast Reference Periods
- 2.6.1 Historical Period: 2018-2025
- 2.6.2 Base Year: 2025
- 2.6.3 Forecast Period: 2025-2035
- 2.7 Research Assumptions and Limitations
Chapter 3 Executive Summary
- 3.1 Market Snapshot and Key Findings
- 3.2 Base-Year Market Size, 2025
- 3.3 Forecast Market Size, 2035
- 3.4 Revenue and Volume Growth Outlook
- 3.5 Key Demand and Supply Indicators
- 3.6 Leading Market Segments
- 3.7 Fastest-Growing Market Opportunities
- 3.8 Regional Performance Highlights
- 3.9 Technology and Industry Transformation
- 3.10 Competitive Landscape Summary
- 3.11 Analyst View and Strategic Implications
Chapter 4 USA Electric Arc Furnace Market Trends and Developments
- 4.1 Historical Industry Development, 2018-2025
- 4.2 Recent Market Trends and Developments
- 4.3 Demand and Customer Behavior Trends
- 4.4 Technology and Product Innovation
- 4.5 Artificial Intelligence, Automation and Digitalization
- 4.6 Local Manufacturing and Supply Chain Realignment
- 4.7 Industry Partnerships, Mergers and Acquisitions
- 4.8 Sustainability and Circular Economy Developments
- 4.9 Government and Private Sector Investment Trends
- 4.10 Emerging Business Models and Commercialization
- 4.11 Industry Developments and Announcements
Chapter 5 USA Electric Arc Furnace Market Production, Supply and Demand Analysis
- 5.1 Demand Trend and Consumption Analysis, 2018-2025
- 5.2 Demand Forecast, 2025-2035
- 5.3 Production and Output Trend, 2018-2025
- 5.4 Production and Output Forecast, 2025-2035
- 5.5 Installed Capacity and Capacity Utilization
- 5.6 Company-Wise Production Plants and Statistics
- 5.6.1 Installed Production Capacity
- 5.6.2 Actual Production
- 5.6.3 Planned Capacity and Expansion Targets
- 5.7 Supply Chain Structure and Procurement Trends
- 5.8 Supply-Demand Gap and Bottlenecks
- 5.9 Import Dependence and Sourcing Structure
- 5.10 Contract Manufacturing and Outsourcing
- 5.11 Regional Supply and Demand Concentration
Chapter 6 USA Electric Arc Furnace Market Pricing Analysis
- 6.1 Pricing Structure and Measurement
- 6.2 Historical Pricing Trends, 2018-2025
- 6.3 Pricing Outlook, 2025-2035
- 6.4 Average Selling Price and Unit Economics
- 6.5 Pricing by Product and Market Segment
- 6.6 Geographic Pricing Differences
- 6.7 Key Input, Energy, Labor and Logistics Costs
- 6.8 Contract Pricing and Purchasing Models
- 6.9 Pricing Sensitivity and Competitive Positioning
- 6.10 Price, Margin and Profitability Implications
Chapter 7 USA Electric Arc Furnace Market Dynamics
- 7.1 Market Growth Drivers
- 7.1.1 Demand-Side Drivers
- 7.1.2 Technology and Innovation Drivers
- 7.1.3 Infrastructure and Investment Drivers
- 7.1.4 Regulatory and Policy Drivers
- 7.2 Market Restraints
- 7.2.1 Cost and Affordability Constraints
- 7.2.2 Technology and Adoption Barriers
- 7.2.3 Supply Chain and Operational Constraints
- 7.3 Market Challenges
- 7.3.1 Competitive Pressure and Margin Erosion
- 7.3.2 Skills, Infrastructure and Implementation Gaps
- 7.4 Emerging Market Opportunities
- 7.5 Market Dynamics Impact and Time-Horizon Assessment
Chapter 8 USA Electric Arc Furnace Value Chain Analysis
- 8.1 Industry Value Chain Overview
- 8.2 Upstream Suppliers and Critical Inputs
- 8.3 Technology and Component Providers
- 8.4 Manufacturing or Service Delivery
- 8.5 Distribution, Channel Partners and Integrators
- 8.6 Downstream Applications and End Users
- 8.7 Value Addition and Profit Pools
- 8.8 Vertical Integration and Outsourcing
- 8.9 Supplier Concentration and Risk
- 8.10 Supply Chain Localization and Resilience
Chapter 9 USA Electric Arc Furnace Market Regulations and Policies
- 9.1 Relevant Laws, Standards and Compliance Frameworks
- 9.2 Product, Service, Safety and Quality Requirements
- 9.3 Government Policies, Incentives and Subsidies
- 9.4 Imports, Exports and Trade Barriers
- 9.5 Public Procurement and Local Content Requirements
- 9.6 Environmental and Sustainability Compliance
- 9.7 Upcoming Policy Changes and Market Implications
Chapter 10 USA Electric Arc Furnace Market Hotspots and Opportunities
- 10.1 Market Opportunity Mapping and Growth Hotspots
- 10.2 High-Growth Applications and Customer Groups
- 10.3 Underserved Markets and White-Space Opportunities
- 10.4 Emerging Technology and Product Opportunities
- 10.5 New Capacity and Investment Hotspots
- 10.6 Market Entry and Expansion Opportunities
- 10.7 Distribution and Partnership Opportunities
- 10.8 Near-Term and Long-Term Commercial Potential
- 10.9 Opportunity Attractiveness and Execution Risks
Chapter 11 USA Electric Arc Furnace Market Outlook, 2025-2035
- 11.1 Market Size and Analysis
- 11.1.1 Revenue (Market Measurement: 2025: USD 680.0 million → 2035: USD 1.48 billion)
- 11.1.2 Market Volume and Quantity Sold
- 11.1.3 Historical Market Size, 2018-2025
- 11.1.4 Base-Year Market Size, 2025
- 11.2 Market Forecast, 2025-2035
- 11.2.1 Revenue Forecast to 2035
- 11.2.2 Volume Forecast to 2035
- 11.2.3 CAGR and Year-on-Year Growth
- 11.2.4 Incremental Revenue Opportunity
- 11.3 Forecast Assumptions and Scenario Analysis
- 11.3.1 Base-Case Forecast
- 11.3.2 Optimistic and Conservative Scenarios
- 11.3.3 Technology, Pricing and Policy Sensitivities
- 11.4 Market Attractiveness and Growth Outlook
Chapter 12 USA Electric Arc Furnace Market Segmentation and Outlook
- 12.1 Segmentation Summary and Market Shares, 2025
- 12.2 Largest and Fastest-Growing Segments
- 12.3 By Product Type - Market Size and Forecast, 2025-2035
- 12.3.1 Segment Definition and Scope
- 12.3.2 Historical Market Size, 2018-2025
- 12.3.3 Revenue Forecast, 2025-2035
- 12.3.4 Volume Forecast, 2025-2035
- 12.3.5 Base-Year Market Share, 2025
- 12.3.6 Segment CAGR and Growth Drivers
- 12.3.7 Subsegment Market Size and Forecast
- 12.3.7.1 AC Electric Arc Furnaces
- 12.3.7.2 DC Electric Arc Furnaces
- 12.3.7.3 Submerged Arc Furnaces
- 12.3.7.4 Auxiliary Melt-Shop Systems
- 12.3.8 Subsegment Pricing and Adoption Trends
- 12.3.9 Leading Suppliers and Competition
- 12.3.10 Regional Demand and Opportunities
- 12.4 By End-Use Industry - Market Size and Forecast, 2025-2035
- 12.4.1 Segment Definition and Scope
- 12.4.2 Historical Market Size, 2018-2025
- 12.4.3 Revenue Forecast, 2025-2035
- 12.4.4 Volume Forecast, 2025-2035
- 12.4.5 Base-Year Market Share, 2025
- 12.4.6 Segment CAGR and Growth Drivers
- 12.4.7 Subsegment Market Size and Forecast
- 12.4.7.1 Carbon Steel
- 12.4.7.2 Specialty Steel
- 12.4.7.3 Stainless Steel
- 12.4.7.4 Foundry and Ferroalloy
- 12.4.8 Subsegment Pricing and Adoption Trends
- 12.4.9 Leading Suppliers and Competition
- 12.4.10 Regional Demand and Opportunities
- 12.5 By Application - Market Size and Forecast, 2025-2035
- 12.5.1 Segment Definition and Scope
- 12.5.2 Historical Market Size, 2018-2025
- 12.5.3 Revenue Forecast, 2025-2035
- 12.5.4 Volume Forecast, 2025-2035
- 12.5.5 Base-Year Market Share, 2025
- 12.5.6 Segment CAGR and Growth Drivers
- 12.5.7 Subsegment Market Size and Forecast
- 12.5.7.1 New Melt Shops
- 12.5.7.2 Capacity Expansion
- 12.5.7.3 Furnace Replacement
- 12.5.7.4 Modernization and Compliance
- 12.5.8 Subsegment Pricing and Adoption Trends
- 12.5.9 Leading Suppliers and Competition
- 12.5.10 Regional Demand and Opportunities
- 12.6 By Sales Channel - Market Size and Forecast, 2025-2035
- 12.6.1 Segment Definition and Scope
- 12.6.2 Historical Market Size, 2018-2025
- 12.6.3 Revenue Forecast, 2025-2035
- 12.6.4 Volume Forecast, 2025-2035
- 12.6.5 Base-Year Market Share, 2025
- 12.6.6 Segment CAGR and Growth Drivers
- 12.6.7 Subsegment Market Size and Forecast
- 12.6.7.1 Direct OEM Contracts
- 12.6.7.2 EPC Packages
- 12.6.7.3 System Integrators
- 12.6.7.4 Aftermarket Service Agreements
- 12.6.8 Subsegment Pricing and Adoption Trends
- 12.6.9 Leading Suppliers and Competition
- 12.6.10 Regional Demand and Opportunities
- 12.7 Segment Growth Comparison
- 12.8 Segment Attractiveness and Priority Matrix
Chapter 13 USA Electric Arc Furnace End-Use and Application Market Outlook
- 13.1 End-Use Industry and Customer Demand Structure
- 13.2 Leading Applications and Customer Groups
- 13.3 End-Use Market Size, Share and Forecast
- 13.4 Major End-Use Industry Deep Dives
- 13.4.1 Customer Requirements and Use Cases
- 13.4.2 Demand and Replacement Cycles
- 13.4.3 Technical and Regulatory Considerations
- 13.4.4 Purchasing and Procurement Models
- 13.4.5 Leading Vendors and Distribution Channels
- 13.4.6 Forecast and Commercial Opportunities
- 13.5 Emerging Applications and Cross-Segment Demand
- 13.6 End-Use Industry Investment Priorities
Chapter 14 USA Electric Arc Furnace Geographic Market Outlook, 2025-2035
- 14.1 Domestic Market Distribution and Demand Clusters
- 14.2 State- or Province-Wise Market Size and Forecast, 2025-2035
- 14.3 City and Metropolitan Market Outlook
- 14.4 Industrial, Manufacturing and Commercial Clusters
- 14.5 Geographic Concentration of Key End Users
- 14.6 Local Pricing and Purchasing Differences
- 14.7 Domestic Production Facilities and Capacity Map
- 14.8 Local Infrastructure and Project Pipeline
- 14.9 State-Level Policy and Incentive Differences
- 14.10 Subnational Investment Hotspots and Opportunities
- 14.11 Distribution and Logistics Networks
- 14.12 Domestic Competitive Footprint
Chapter 15 USA Electric Arc Furnace Technology, Innovation and Sustainability Outlook
- 15.1 Technology Landscape and Maturity
- 15.2 Product, Process and Service Innovation
- 15.3 AI, Automation and Digital Tools in the Industry
- 15.4 Technology Adoption and Performance Benchmarking
- 15.5 Innovation Pipeline and R&D Investment
- 15.6 Patent and Intellectual Property Trends
- 15.7 Energy Efficiency and Resource Management
- 15.8 Sustainability, Recycling and Circularity
- 15.9 Technology Roadmap, 2025-2035
- 15.10 Risks of Obsolescence and Technology Substitution
Chapter 16 USA Electric Arc Furnace Market Key Strategic Imperatives
- 16.1 Growth and Market Entry Priorities
- 16.2 High-Return Products and Segments
- 16.3 Pricing, Profitability and Cost Optimization
- 16.4 Technology Investment and Product Differentiation
- 16.5 Supply Chain Localization and Resilience
- 16.6 Distribution and Customer Acquisition
- 16.7 Partnership, Acquisition and Capacity Strategy
- 16.8 Regional Expansion Priorities
- 16.9 Short-, Medium- and Long-Term Actions
Chapter 17 Competition Outlook
- 17.1 Industry Competition Characteristics
- 17.2 Market Structure and Concentration
- 17.3 Market Share and Competitive Positioning, 2025
- 17.4 Company-Wise Revenue and Product Benchmarking
- 17.5 Production and Service Capacity Benchmarking
- 17.6 Technology, Pricing and Differentiation
- 17.7 Regional Footprint and Distribution Strength
- 17.8 Mergers, Acquisitions and Strategic Alliances
- 17.9 New Entrants and Competitive Threats
- 17.10 Porter's Five Forces and Industry Attractiveness
- 17.11 Competitive Outlook, 2025-2035
Chapter 18 Company Profiles
- 18.1 Company Coverage and Selection Criteria
- 18.2 Danieli & C. Officine Meccaniche S.p.A.
- 18.2.1 Business Description
- 18.2.2 Company Ownership and Geographic Presence
- 18.2.3 Product and Service Portfolio
- 18.2.4 Manufacturing and Operating Footprint
- 18.2.5 Production Capacity and Expansion Plans
- 18.2.6 Financial Performance and Investment
- 18.2.7 Market Share and Competitive Position
- 18.2.8 Technology and Innovation Capabilities
- 18.2.9 Strategic Alliances or Partnerships
- 18.2.10 Recent Developments
- 18.2.11 Growth Strategy and Outlook
- 18.3 SMS group GmbH
- 18.4 Tenova S.p.A.
- 18.5 Primetals Technologies Limited
- 18.6 ABB Ltd.
- 18.7 Siemens AG
- 18.8 Fives Group
- 18.9 Sarralle
- 18.10 TMEIC Corporation
- 18.11 AMI Automation
- 18.12 Other Relevant Market Participants
Note: Every listed company is profiled on the structure shown under the first company. The company list is preliminary and may change based on research findings, market developments, data availability and client requirements.
Chapter 19 Disclaimer
- 19.1 Research and Forecast Disclaimer
- 19.2 Data Source and Estimation Limitations
Note: The depth of individual sections depends on data availability for this market. Volume, capacity, trade and other unit-based metrics are included where applicable.

