Fabricated and specialty glass now carry U.S. growth
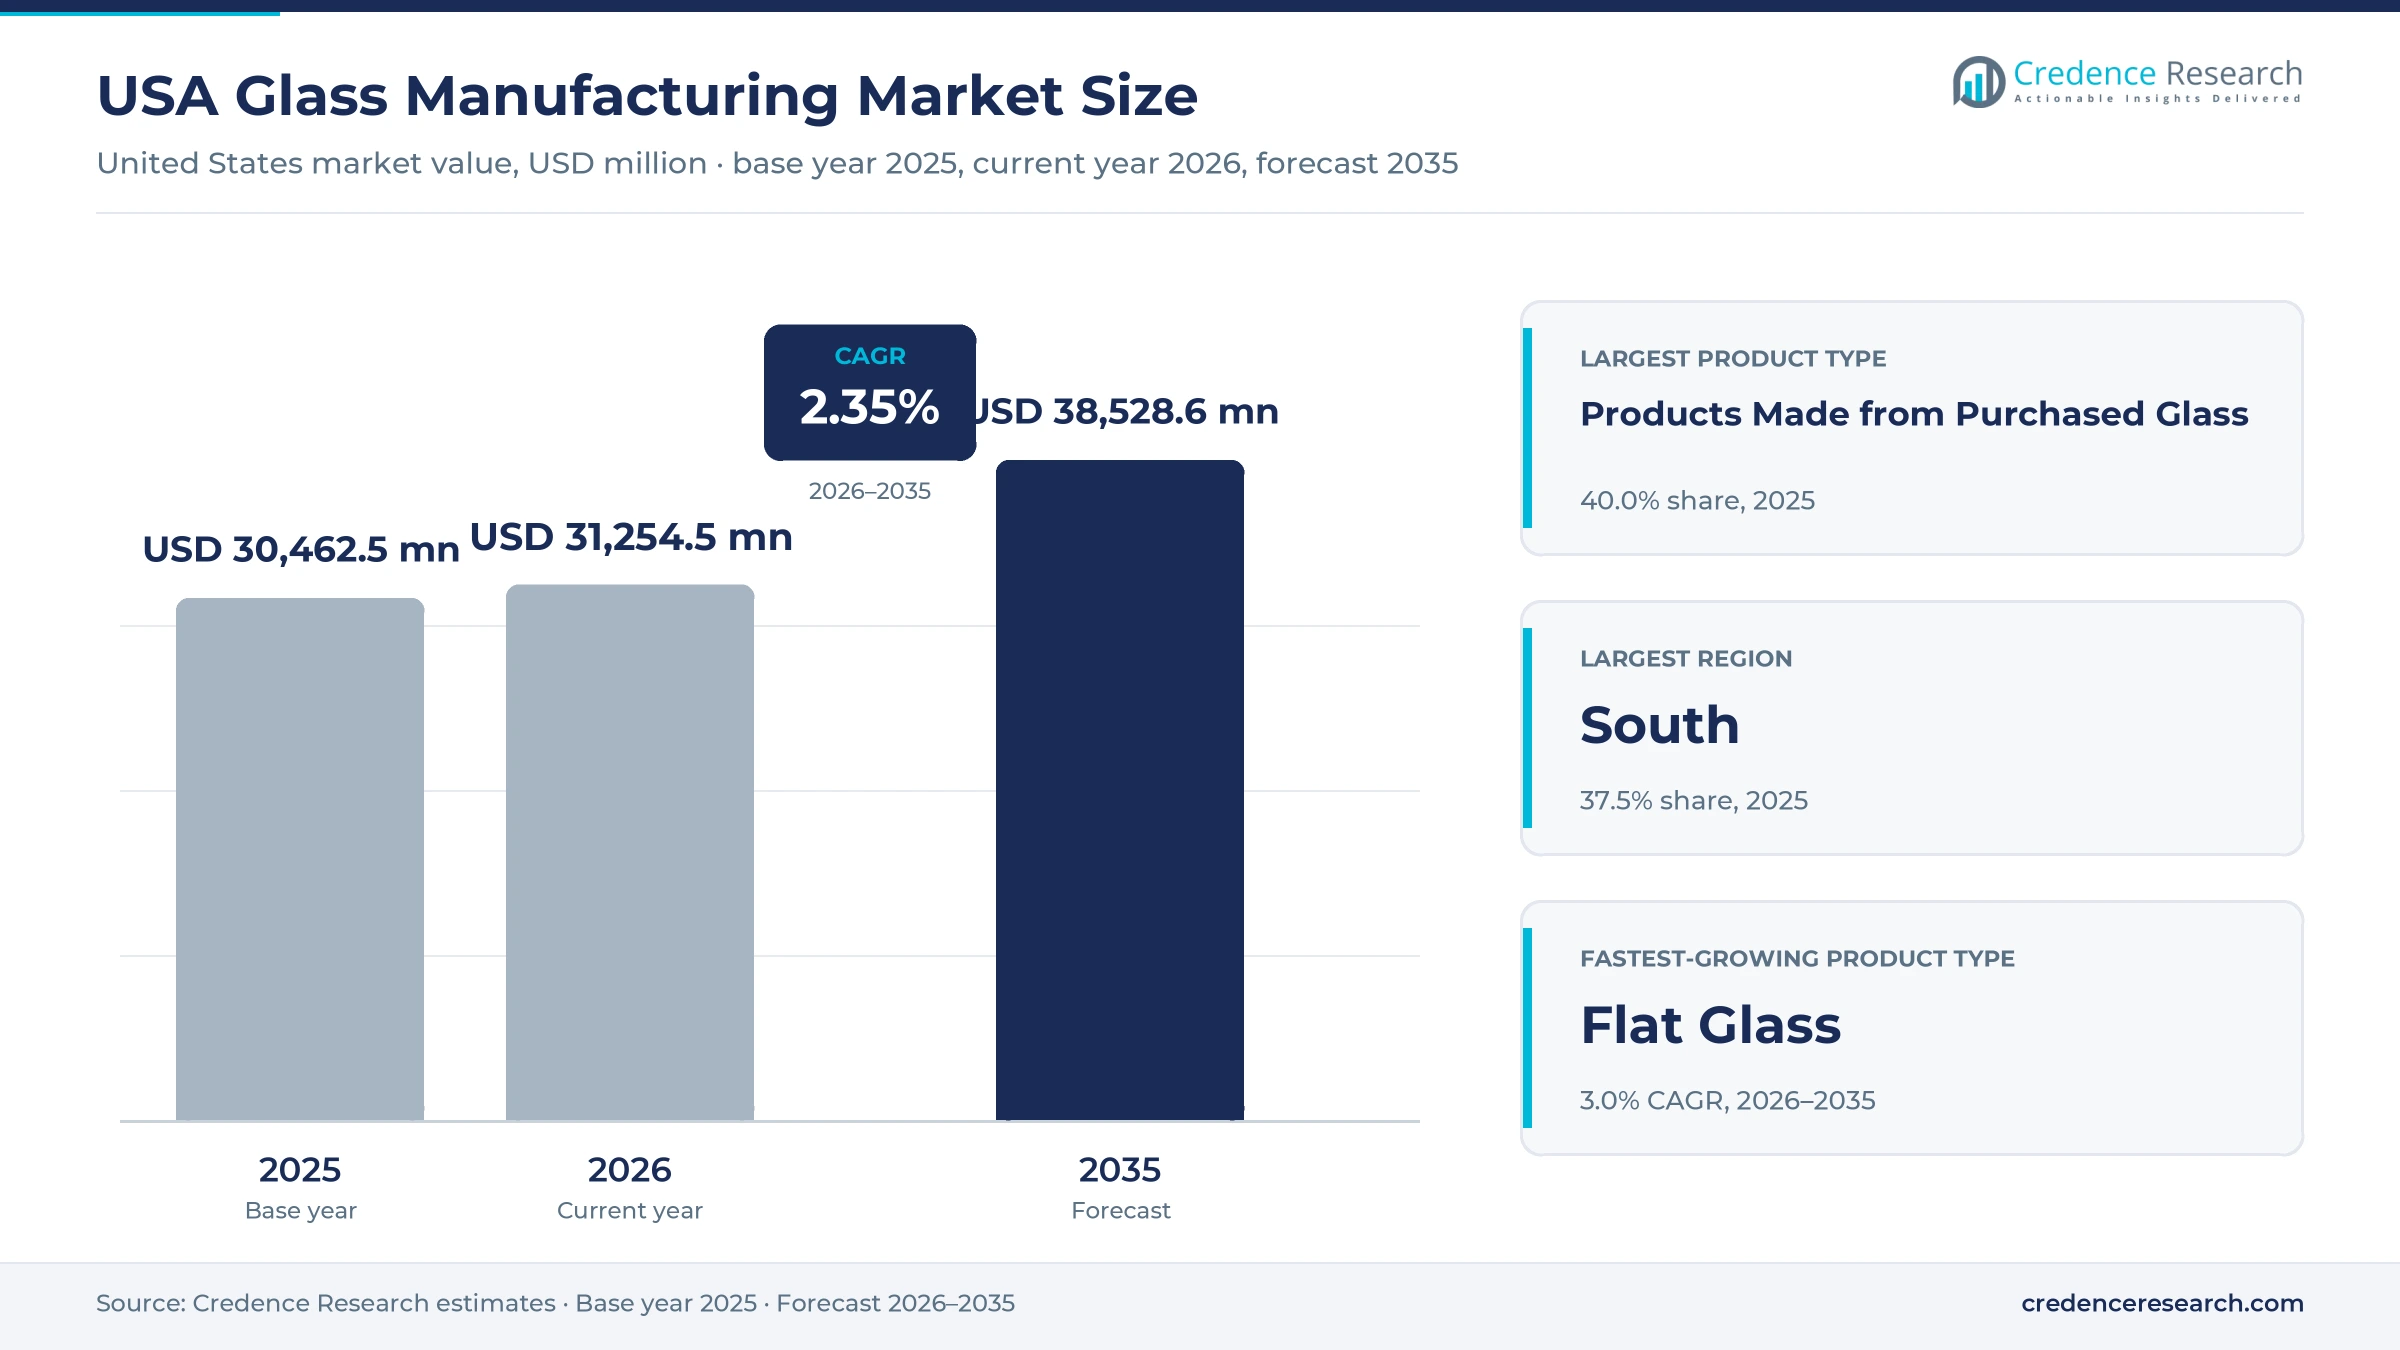
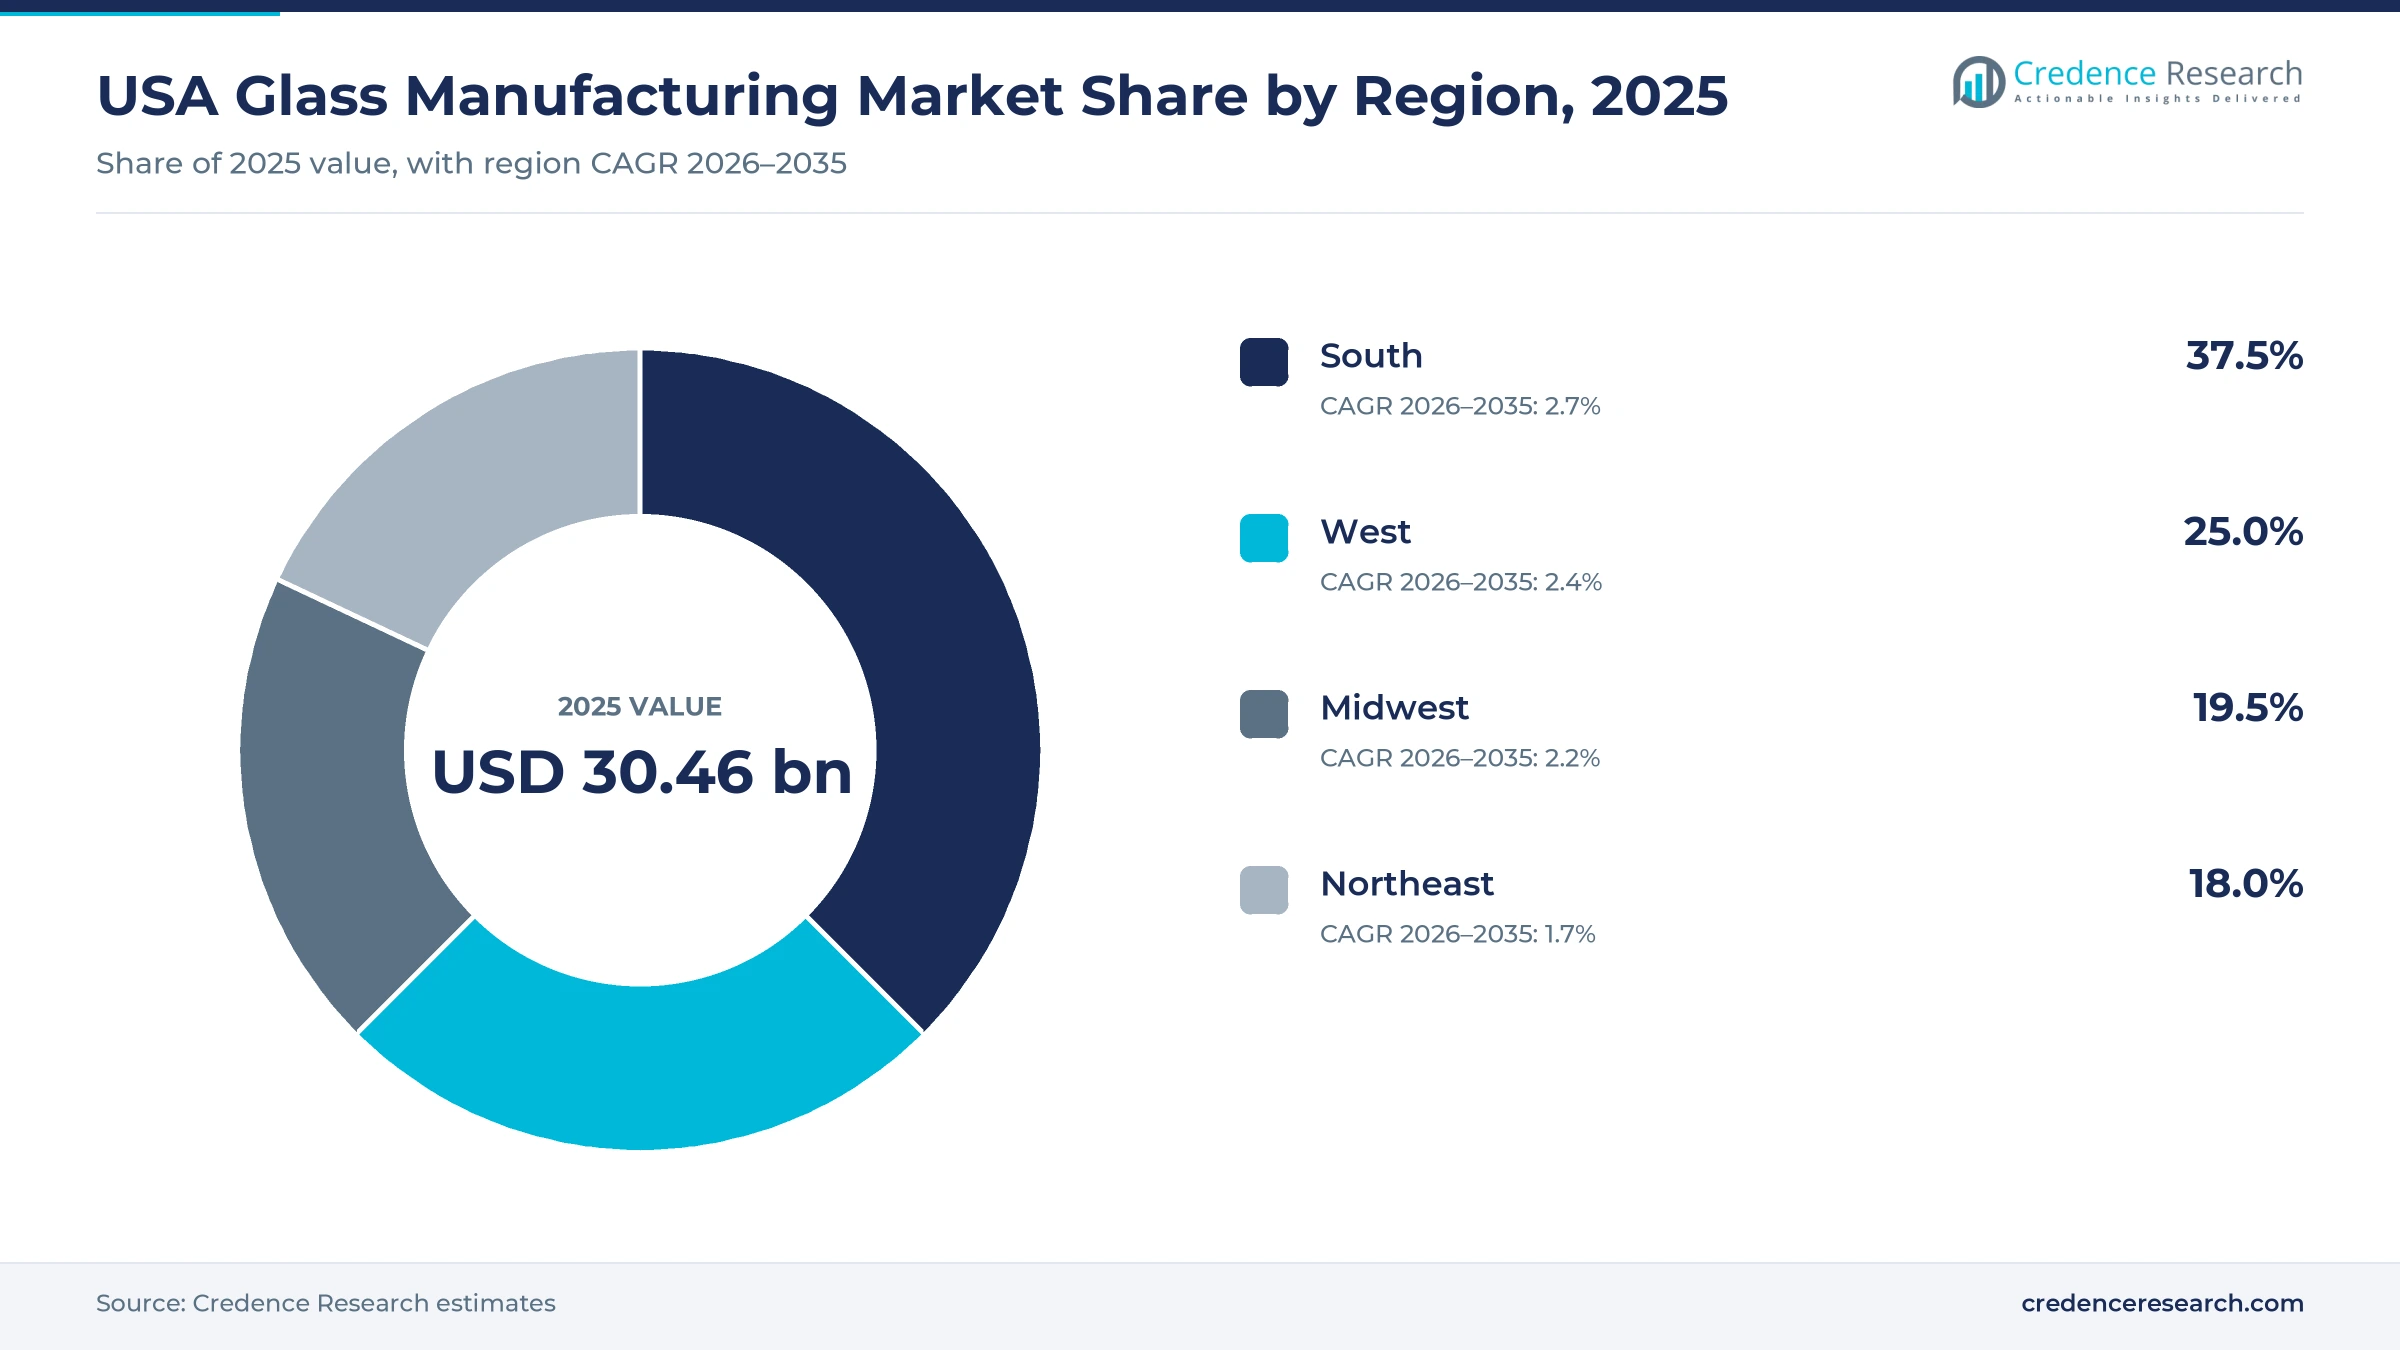
The USA glass manufacturing market was valued at USD 30.46 billion in 2025 and is projected to increase from USD 31.25 billion in 2026 to USD 38.53 billion by 2035, registering a CAGR of 2.35% during 2026–2035. Demand rests on four buyer groups, building owners that replace and upgrade windows and facades, automakers that need laminated and coated glazing, beverage and food brands that fill bottles and jars, and makers of electronics, solar modules and drug packaging that buy technical glass. The South held the largest regional share, 37.5% in 2025, and it is also the fastest-growing region at 2.7% a year because new housing, factories and solar module plants cluster there. Fabricated products made from purchased float glass account for the largest product share, while flat glass grows fastest. The most important commercial change is a shift of float capacity toward coated solar front sheets and of container capacity toward fewer, larger plants, which moves value from commodity tonnage to specified, contract glass.
Melting and fabrication plants turn sand and cullet into four product families
The market counts the value of glass made and processed in the United States, from float lines that produce flat glass, container plants that form bottles and jars, pressing and blowing plants that make tableware, lighting and technical glass, and fabricators that temper, laminate, coat or assemble purchased glass into finished products such as insulating units, mirrors and vehicle glazing. Regional values are allocated by where the glass is bought.
The count excludes glass fiber insulation, optical fiber and imported finished glass that is resold without further processing. Value sits first with the few companies that run furnaces, then with fabricators and brand owners that add coatings, shapes and assembly before the glass reaches builders, automakers and fillers.
USA Glass Manufacturing Market Insights
- The USA glass manufacturing market rises from USD 30.46 billion in 2025 to USD 38.53 billion by 2035, growing at 2.35% a year on specialty and solar glass.
- The South held 37.5% of 2025 value, the largest share of the four regions, and grows fastest at 2.7% a year.
- Products made from purchased glass held 40.0% of 2025 value because fabricators turn float glass into windows and vehicle parts.
- Commerce issued final antidumping margins on float glass from China and Malaysia on Feb. 4, 2026, which shields domestic float producers.
- Apple committed USD 2.5 billion in August 2025 to make all iPhone and Apple Watch cover glass at Corning in Kentucky.
Purchased-glass products lead as flat glass grows fastest
Fabricators lead value while new float lines grow fastest
Based on product type, the market is categorized into flat glass, glass containers, pressed and blown glass and products made from purchased glass. Products Made from Purchased Glass led with 40.0% of 2025 value because tempering, laminating and coating add most of the value, and the city of Moraine reported in October 2023 that Fuyao Glass America was investing USD 300 million in a coated automotive glass expansion on top of more than 2,000 local jobs. Flat Glass grows fastest at 3.0% a year as Pilkington North America lit a converted float furnace in Rossford, Ohio, on Jan. 14, 2025, to supply coated glass to First Solar.
Construction buys most glass as technical uses grow fastest
Based on end-use industry, the market is categorized into construction, automotive, food and beverage packaging and healthcare and technical industries. Construction led with 42.0% of 2025 value because float glass goes mostly into windows, doors and facades, and Guardian Glass alone lists seven U.S. manufacturing and fabrication locations serving that trade. Healthcare and Technical Industries grow fastest at 3.3% a year as Apple committed USD 2.5 billion on Aug. 6, 2025, to make all iPhone and Apple Watch cover glass at Corning's Harrodsburg, Kentucky, plant, where Corning's workforce will grow by 50%.
Direct contracts dominate while project sales grow fastest
Based on sales channel, the market is categorized into direct contract sales, fabricator supply sales, distributor-mediated sales and manufacturer project and spot sales. Direct Contract Sales led with 46.0% of 2025 value because furnaces need steady loads, and Glass International reported in October 2023 that Vitro was spending about USD 180 million at Meadville, Pennsylvania, under a long-term contract to supply First Solar. Manufacturer Project and Spot Sales grow fastest at 3.2% a year as federally funded projects must use domestic construction materials under Build America, Buy America rules, which Guardian says its U.S.-made float glass meets.
| Segment Group | Leading Sub-segment | Share, 2025 | Fastest-growing Sub-segment | CAGR, 2026–2035 |
|---|---|---|---|---|
| By Product Type | Products Made from Purchased Glass | 40.0% | Flat Glass | 3.0% |
| By End-Use Industry | Construction | 42.0% | Healthcare and Technical Industries | 3.3% |
| By Sales Channel | Direct Contract Sales | 46.0% | Manufacturer Project and Spot Sales | 3.2% |
Soda ash, energy and coatings set U.S. glass prices
Glass is priced per ton for containers, per square foot for flat glass and per piece for technical items, and coated, tempered or certified products sell at a premium to clear float glass. Melting cost moves with natural gas and soda ash, and the USGS estimates that glass took 45% of U.S. soda ash consumption in 2025 at an average of USD 150 per metric ton. Container makers pass these costs through annual contract escalators, visible in a 2.65% January 2026 step in the BLS glass container price index, while flat glass prices follow construction cycles and import competition. The widest margins sit with coated, tempered and pharmaceutical glass, where certification limits the number of qualified suppliers.
| Product or input | Typical price or fee | Basis |
|---|---|---|
| Soda ash, average U.S. price | USD 150 per metric ton, f.o.b. mine or plant | USGS Mineral Commodity Summaries, January 2026 |
| Flat glass, producer price index | 162.5 in September 2026, +2.7% from a year earlier | BLS via FRED series PCU327211327211, October 2026 |
| Glass containers, producer price index | 306.7 in September 2026, +3.3% from a year earlier | BLS via FRED series PCU327213327213, October 2026 |
| Products of purchased glass, producer price index | 231.3 in September 2026, +3.8% from a year earlier | BLS via FRED series PCU327215327215, October 2026 |
Request a Free Sample
Fill in your details and we'll send you a free sample report.
- Sample data tables & charts
- Research methodology
Codes, vehicles, solar and duties support U.S. melting
Building performance rules push replacement glazing
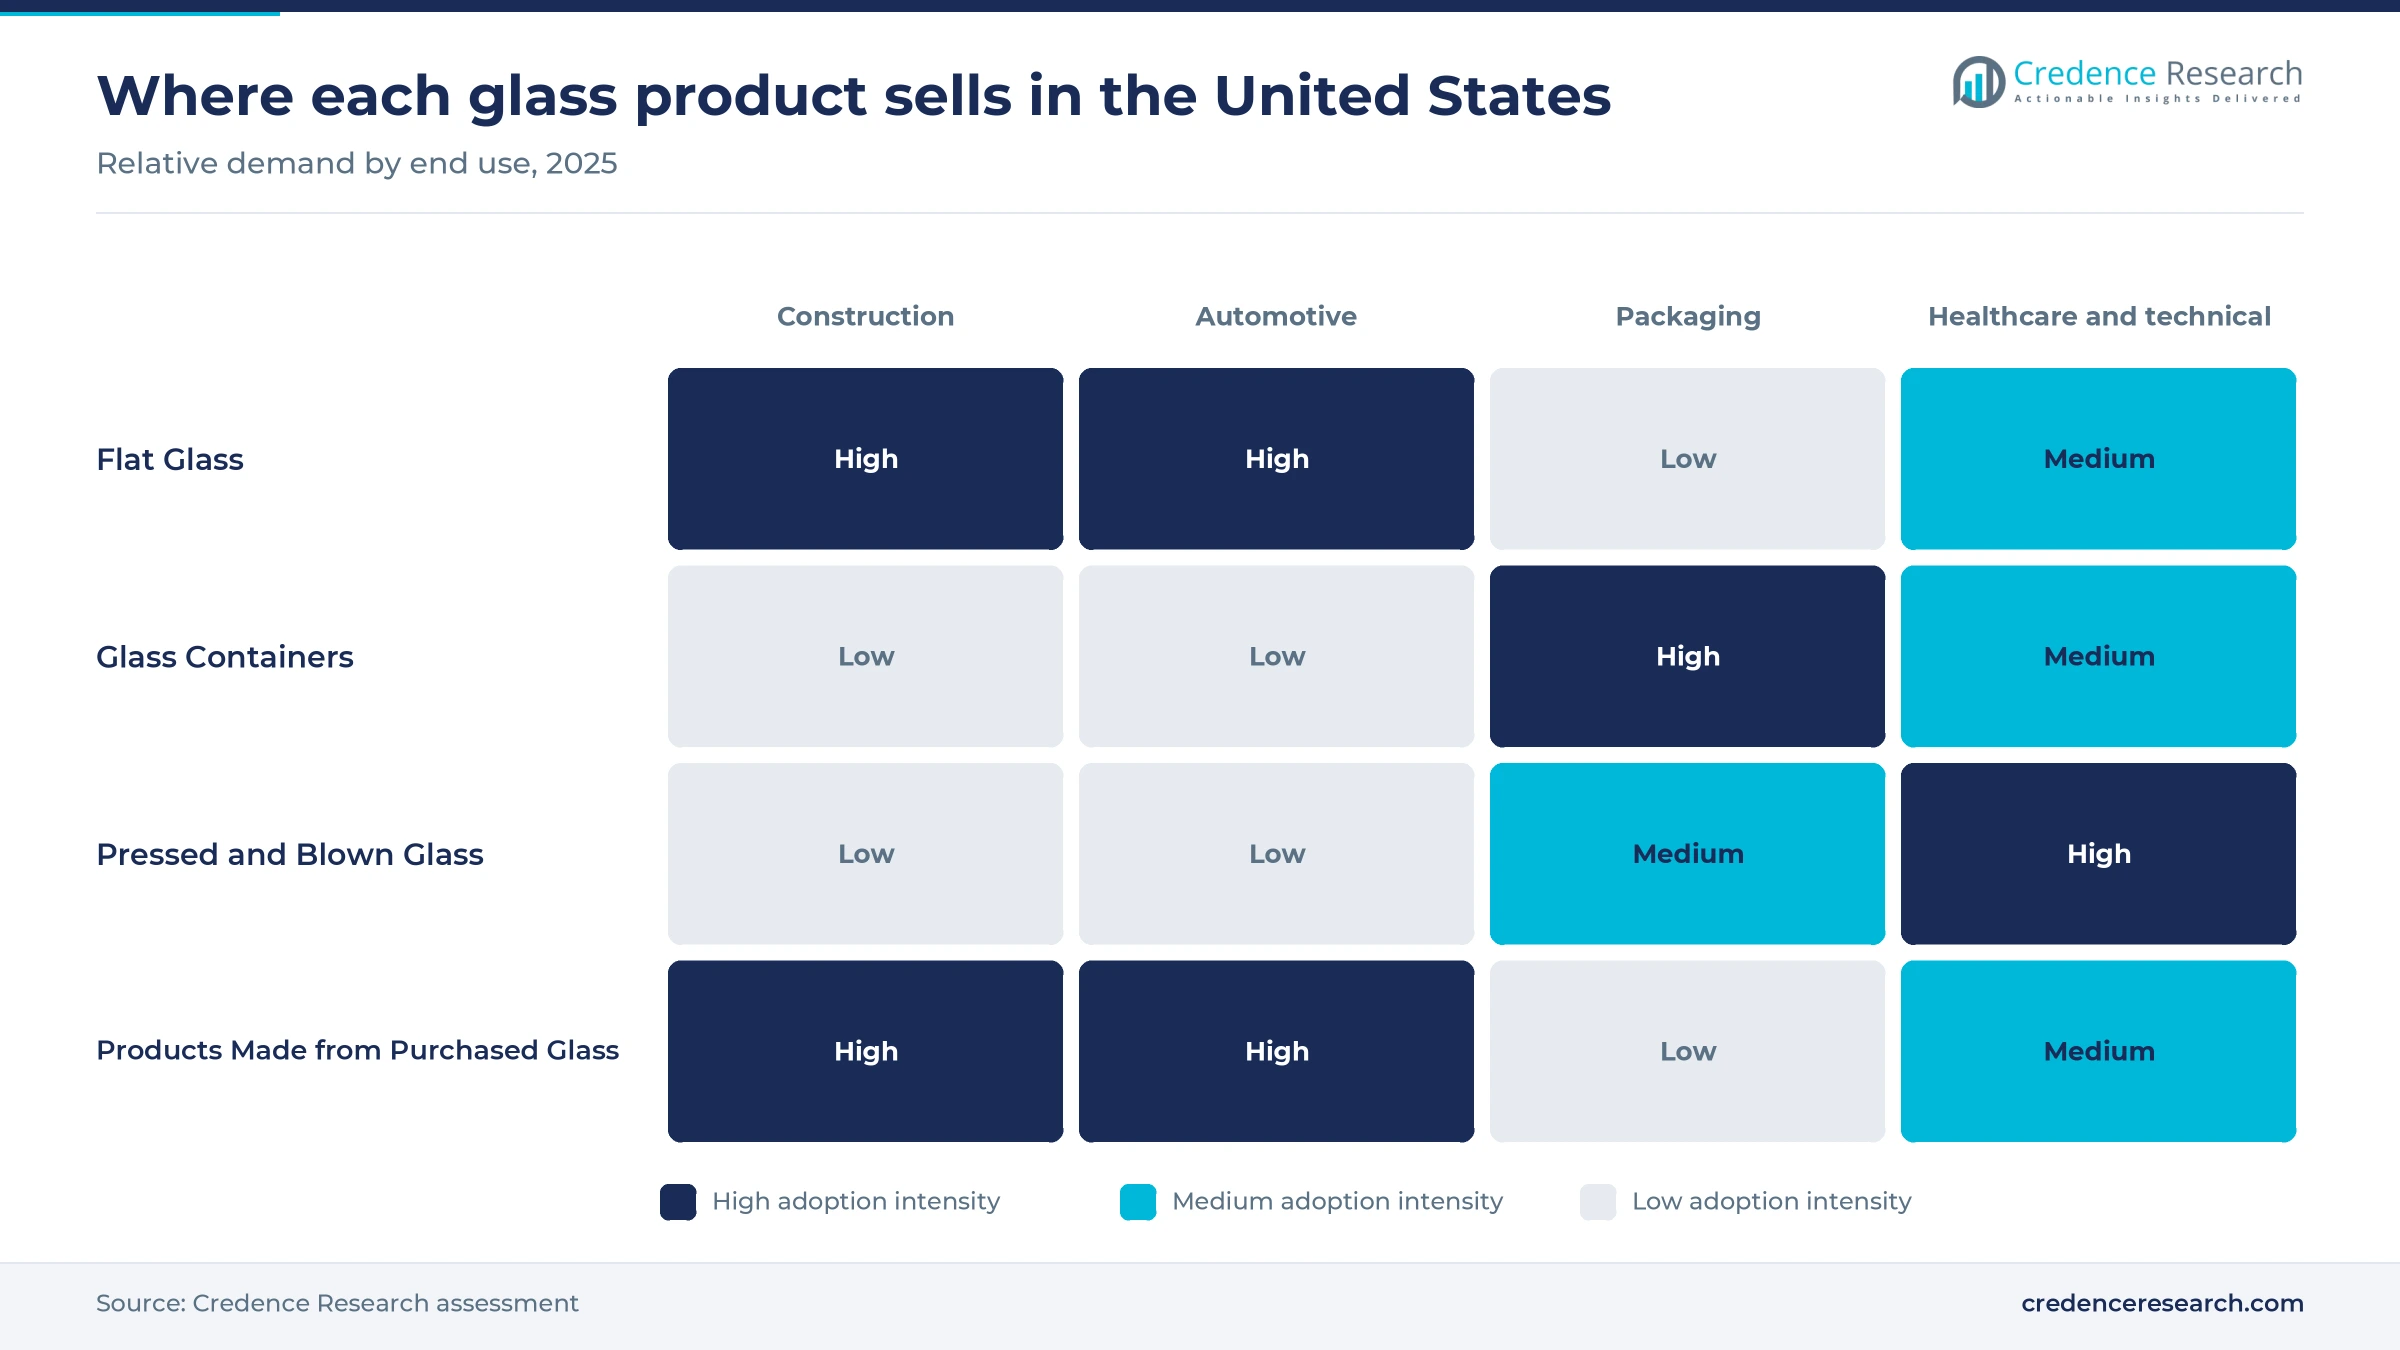
Stricter window efficiency rules raise the amount of coated and multi-pane glass in each window, which supports value even when construction volume is flat. ENERGY STAR 7.0 took effect on Oct. 23, 2023, and Cardinal Glass guidance shows that the Northern zone limit of a 0.22 U-factor often requires triple-pane units. The Census Bureau put 2025 construction spending at USD 2,164.4 billion, slightly below 2024, and residential work fell faster than nonresidential, so replacement rather than new homes carries demand. Construction buyers held 42.0% of 2025 value, and window and door makers that upgrade lines to the new rules buy more low-emissivity glass per opening.
Automotive glazing qualification and features add value per vehicle
Vehicle glazing gains value as automakers specify acoustic, coated and camera-ready windshields, even though unit output is flat. The Federal Reserve's G.17 release puts 2025 U.S. assemblies of autos and light trucks at 9.93 million units at an annual rate. Light trucks accounted for 8.64 million of those units against 1.28 million cars, and their larger windshields, roofs and side glass raise glass area per vehicle. Fuyao's coated-glass expansion in Moraine, noted above, targets this demand for optical clarity and UV protection. Supplying windshields and side windows requires long qualification with each automaker, so awarded programs lock in local fabrication for a model's life.
Specialty and energy-related manufacturing adds new melting demand
Solar, electronics and drug packaging buyers are adding glass demand that does not depend on housing or beverage volumes. Vitro Architectural Glass said on Jan. 21, 2025, that it would invest USD 67.6 million at Wichita Falls, Texas, funded by an IRS investment tax credit allocation, to make up to 25 million patterned solar lites a year. Its Meadville contract with First Solar, noted above, adds coated front sheets for thin-film modules. Apple's cover-glass commitment in Kentucky brings electronics glass in the same direction. Suppliers of photovoltaic module front sheets therefore gain the steadiest new float demand in the country.
Trade remedies on float glass imports support domestic producers
Duties on low-priced float glass give U.S. melters room to fill furnaces and hold prices. The Commerce Department announced final antidumping and countervailing duty determinations on Feb. 4, 2026, with a 151.29% dumping margin for most Chinese exporters and an 8.78% all-others rate for Malaysia. Commerce data show U.S. imports of the covered glass from China at USD 140.4 million in 2023, and the U.S. International Trade Commission's final injury determinations took effect on April 6, 2026. Flat glass grows at 3.0% a year in the forecast, helped by this protection for float lines in Ohio, Pennsylvania and Texas.
Hybrid furnaces, carbon capture and cullet reshape supply
A shift from gas-fired regenerators to hybrid electric furnaces
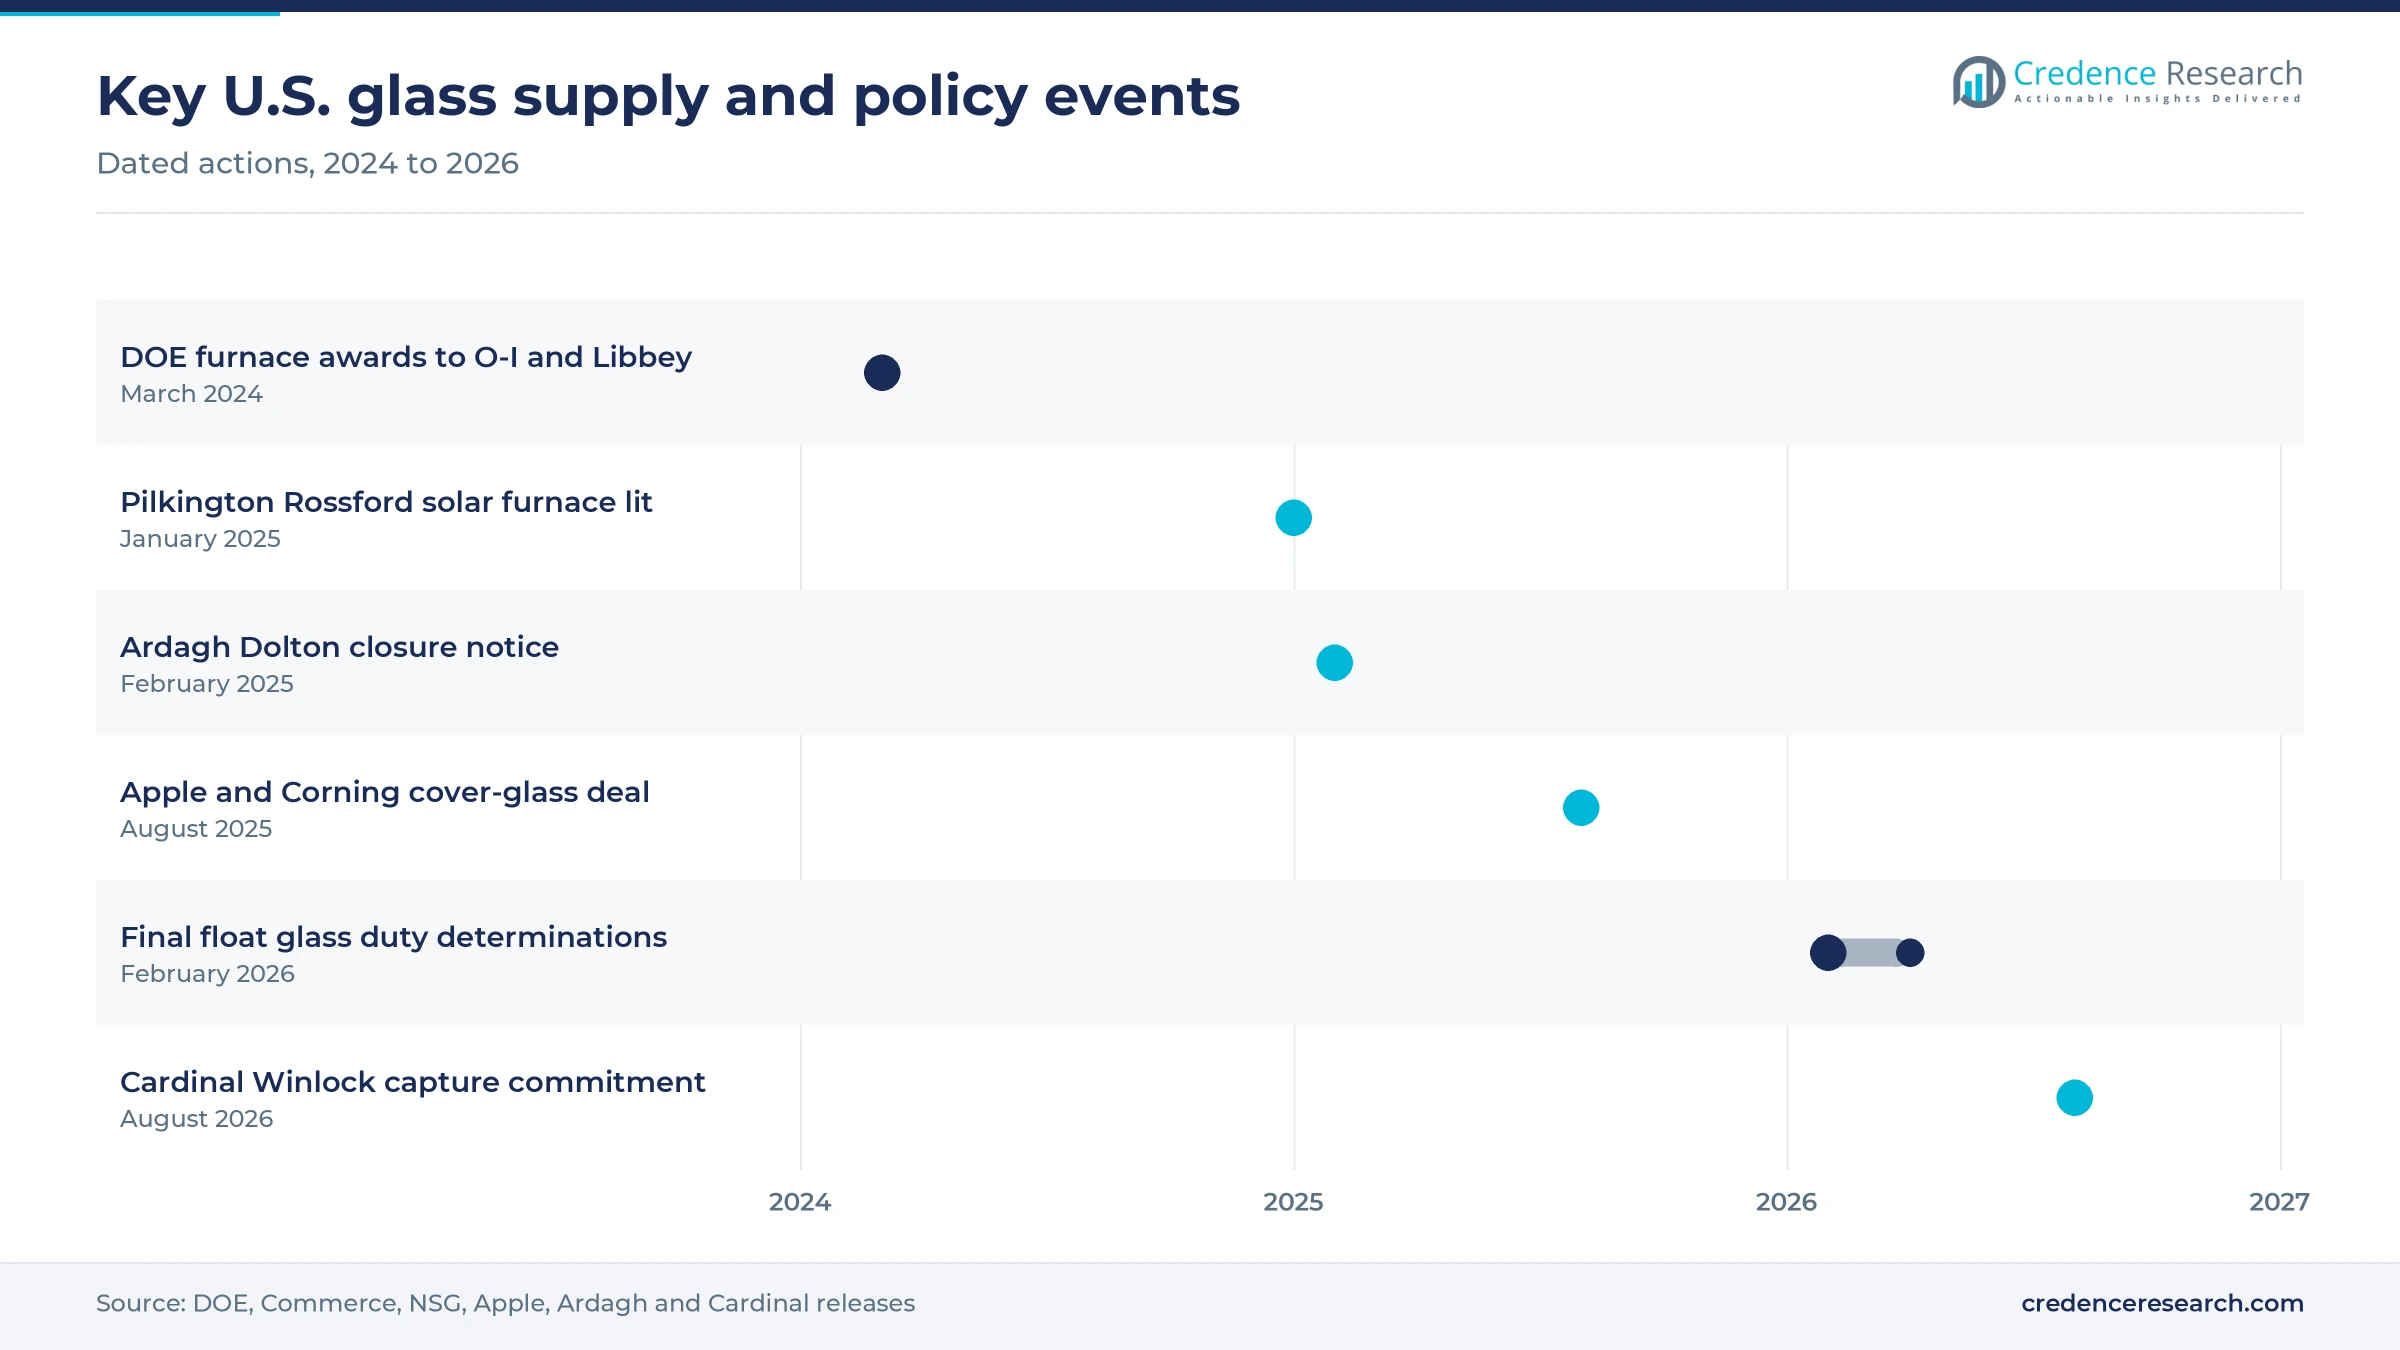
Glassmakers are rebuilding furnaces around electric boosting and heat recovery to cut fuel use and emissions. On March 25, 2024, the Department of Energy selected O-I Glass for up to USD 125 million to rebuild four furnaces at three plants in California, Ohio and Virginia, cutting about 48,000 metric tons of carbon dioxide a year. In the same round, Libbey was selected for USD 45.1 million to replace four regenerative furnaces in Toledo with two larger hybrid electric units, cutting related emissions by an estimated 60%. Rebuild timing matters because a furnace runs for well over a decade, so these choices fix the cost base of container and tableware supply into the 2030s.
Rising use of carbon capture at float glass plants
Float glass makers are testing capture because melting releases process carbon dioxide that electricity alone cannot remove. Cardinal said on Aug. 10, 2026, that it had committed to a carbon capture system at its Winlock, Washington, float plant, designed to capture about 130,000 metric tons a year and to begin operating in the first quarter of 2029. Cardinal has paid deposits on long-lead equipment and uses no government funding, and it plans to apply the design at other float plants. Architects and developers that report embodied carbon can then specify lower-carbon float glass, which adds a premium tier to the West's supply.
Recovered cullet supply is an opening for container makers
More recycled glass would lower melting energy and raw material costs, and U.S. recovery rates leave a large gap to close. The EPA put the recycling rate for glass containers at 31.3% in 2018, or about 3.1 million tons. Spotlight PA reported on Oct. 26, 2026, that the United States recycles about 30% of its glass against about 80% for food and beverage containers in the EU. A 2025 Maryland assessment cited there estimated that a bottle bill and producer responsibility could lift recovery from 24% to 74%. Container plants near new collection systems would gain cheaper cullet, which helps them defend share against cans.
Domestic drug packaging is an opening for technical glass
Injectable drugs need glass vials and syringes made under tight quality rules, and drugmakers want more of that supply at home. Glass Online reported in December 2021 that Corning's Durham, North Carolina, plant could make up to 500 million vials a year after a federally funded expansion. Manufacturing Dive reported that SCHOTT Pharma plans a USD 371 million plant in Wilson, North Carolina, with 401 jobs from 2027, making prefillable polymer and glass syringes for GLP-1 therapies. Healthcare and technical industries grow at 3.3% a year, the fastest end use, as these lines ramp up.
Bottle closures, imports and labor strain domestic plants
Falling beverage volumes close container plants
Weaker beer and wine volumes have left container makers with idle furnaces, and the closures are spreading. Packaging Dive reported in February 2025 that Ardagh Glass Packaging would close its Dolton, Illinois, plant, affecting 316 workers, after earlier closures in Seattle and Houston that affected 245 and 220 people. Customers move to the remaining plants, and freight distances to fillers grow. Glass containers therefore grow slowest of the product types, and makers respond by idling furnaces instead of building them.
Consolidation cuts local container supply
Container makers are trimming capacity to restore margins, which reduces local supply for regional brewers and recyclers. O-I told Oregon regulators on July 30, 2025, that it would close its Portland plant, the only bottle plant in the state, laying off 90 workers. Anchor Glass Container filed notice on Aug. 18, 2026, to close its Warner Robins, Georgia, plant, affecting 168 workers. Smaller fillers then face longer lead times, so some switch to cans or imported bottles.
Import competition presses tableware and pressed glass
Pressed and blown tableware competes with lower-cost imports, and domestic makers are consolidating sites. Manufacturing Dive reported on Oct. 7, 2024, that Anchor Hocking would close its 132-year-old Charleroi, Pennsylvania, plant, which made Pyrex products, with more than 300 layoffs and production moving to Lancaster, Ohio. Fewer plants mean less spare capacity for retail promotions, and producers focus on foodservice and branded lines.
A shrinking workforce strains furnace operations
Glass plants run around the clock and need skilled furnace, forming and maintenance staff, and the labor pool is shrinking. BLS data show employment in glass and glass product manufacturing falling from 86,900 in 2023 to 81,500 in 2025, a 6.2% decline. Fewer experienced workers raise overtime costs and the risk of quality losses, so makers invest in automation and inspection systems.
The South leads value while the Midwest leads output
| Region | Value, 2025 (USD billion) | Share, 2025 | CAGR, 2026–2035 |
|---|---|---|---|
| South | 11.42 | 37.5% | 2.7% |
| West | 7.62 | 25.0% | 2.4% |
| Midwest | 5.94 | 19.5% | 2.2% |
| Northeast | 5.48 | 18.0% | 1.7% |
The South leads on construction and plant count
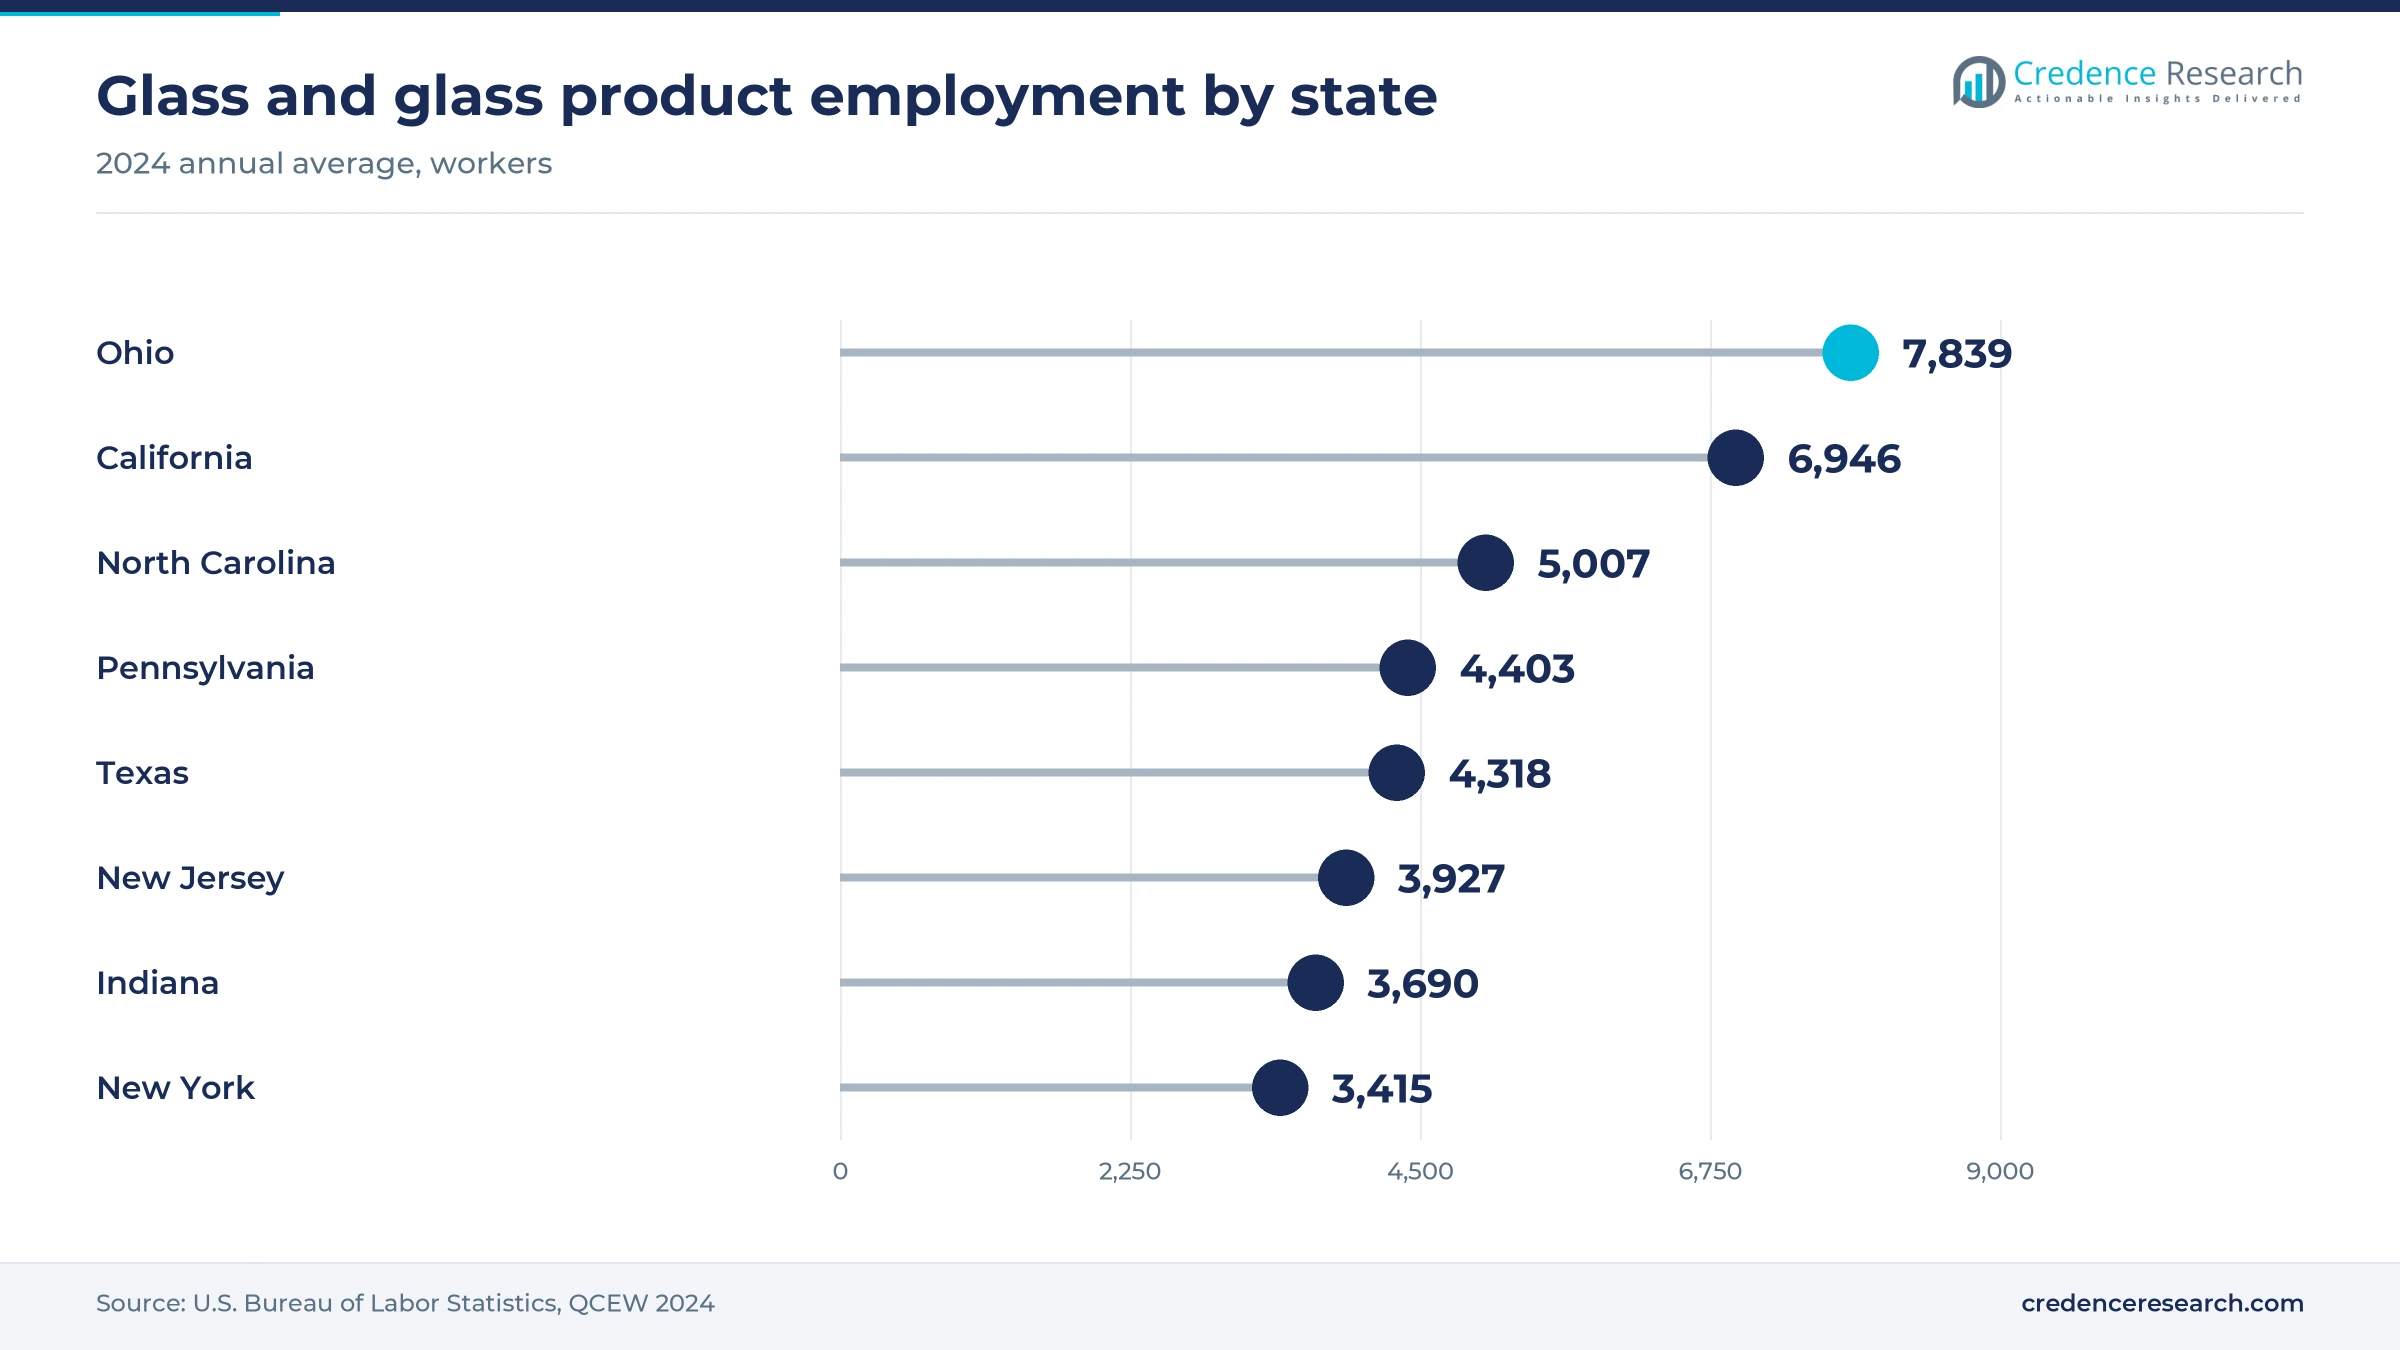
The South held 37.5% of 2025 value and grows at 2.7% a year, the highest of the four regions. BLS QCEW data for 2024 count 730 glass establishments in the South, the most of any region, with 26,499 workers. North Carolina employed 5,007 people in the industry and Texas 4,318, and both states are adding solar, drug packaging and housing demand, so fabricators there gain the most new orders. Vitro's solar glass expansion in Wichita Falls and new drug packaging lines in North Carolina keep that pipeline full.
The West grows on solar, coated glass and large fabricators
The West held 25.0% of 2025 value and grows at 2.4% a year. California employed 6,946 people in the industry in 2024, the second-largest state total, and the region counted 471 establishments with 11,578 workers. Cardinal's capture project in Washington and strict state energy codes favor coated and low-carbon glass, and that mix lifts value per square foot in the region. Guardian's float location in Kingsburg, California, also gives West Coast fabricators a local source of float glass.
The Midwest holds the largest furnaces and output
The Midwest held 19.5% of 2025 value and grows at 2.2% a year. Ohio employed 7,839 people in the industry in 2024, the most of any state, and the region's 402 establishments employed 23,812 workers, the largest plants on average. Regional values follow where glass is bought and installed, not where it is melted, and plants in Toledo, Rossford and Moraine ship nationwide, so the Midwest's value share sits below its share of the industry's jobs. Growth there tracks national vehicle assembly and solar glass programs.
The Northeast grows slowest from an older plant base
The Northeast held 18.0% of 2025 value and grows at 1.7% a year, the slowest pace of the four regions. Pennsylvania employed 4,403 people in the industry in 2024, New Jersey 3,927 and New York 3,415. Older container and tableware plants face closures, while technical glass in upstate New York holds steady, so growth depends on specialty rather than volume.
Solar lines, trade orders and capture plans, 2025 to 2026
| Development | Status and market relevance |
|---|---|
| In January 2025, Pilkington North America lit a converted float furnace in Rossford, Ohio, to make coated glass for First Solar. | Operating; adds domestic solar glass supply |
| In February 2026, Commerce issued final antidumping and countervailing duty determinations on float glass from China and Malaysia. | Orders effective April 2026; supports domestic float |
| In August 2026, Cardinal committed to a carbon capture system at its Winlock, Washington, float plant. | Planned for early 2029; first capture at a float plant |
Four forming routes decide cost, energy and product mix
- Float forming pours molten glass onto a bath of tin to make flat sheets, which suits windows, solar sheets and vehicle glass.
- Container forming presses or blows gobs of glass into bottle and jar molds at high speed, which keeps cost per unit low.
- Pressing and blowing shapes tableware, lighting, cover and laboratory glass in smaller runs, which favors specialty compositions.
- Purchased-glass processing tempers, laminates, coats and assembles float glass into finished parts, which adds most of the value.
Need a Custom Version of This Report?
Tailor the scope, geography, or segments to your exact requirements.
- Custom geography or segment scope
- Direct access to our analyst team
A few melters supply many fabricators and brand owners
U.S. glass manufacturing competition differs sharply from one product family to the next. In flat glass, Guardian, Cardinal, Vitro and Pilkington North America compete on coating range, delivery distance and domestic content, and each pairs float lines with fabrication. In containers, O-I, Ardagh and Anchor Glass compete for long-term contracts with brewers, wine makers and food brands, and plant closures are concentrating supply. Corning leads technical glass through cover glass and pharmaceutical vials, while Fuyao Glass America and AGC Automotive Americas serve automakers from Ohio and Kentucky. Libbey and Anchor Hocking make pressed and blown tableware for foodservice and retail. Rivals increasingly compete on lower-carbon melting and recycled content as large buyers ask for carbon data, and the ability to prove domestic origin matters for public projects.
Few melters, many fabricators and high entry barriers
Supply in U.S. glass manufacturing is concentrated at the melting stage and fragmented at the fabrication stage. A handful of companies, among them Guardian, Cardinal, Vitro and Pilkington North America, run the country's float lines, while O-I, Ardagh and Anchor Glass make most glass containers. Anchor now runs four U.S. plants after its Georgia closure. BLS counts 1,992 establishments in the wider industry, most of them tempering, laminating and assembly shops. A float line or container furnace costs hundreds of millions of dollars and runs for over a decade, so margins sit with melters that keep furnaces full and with fabricators that add coatings and certification.
Companies profiled and their roles in this market
| Company | Type | Role in the market |
|---|---|---|
| O-I Glass | Container manufacturer | Makes glass bottles and jars for beer, wine, spirits and food brands |
| Guardian Glass (Koch Industries) | Float and coated glass maker | Makes float and coated architectural glass at seven U.S. locations |
| Cardinal Glass Industries | Float and fabricated glass maker | Makes float, low-emissivity coated and insulating glass for window makers |
| Vitro Architectural Glass (Vitro) | Float and coated glass maker | Makes architectural float glass and solar front sheets in Pennsylvania and Texas |
| Ardagh Glass Packaging North America (Ardagh Group) | Container manufacturer | Makes glass bottles and jars for beverage and food fillers |
| Corning Incorporated | Technical glass specialist | Makes cover glass, pharmaceutical vials and other technical glass |
| Pilkington North America (NSG Group) | Float and coated glass maker | Makes architectural, automotive and coated solar glass in Ohio |
| Fuyao Glass America (Fuyao Glass Industry Group) | Vehicle glazing manufacturer | Makes laminated and coated automotive glass in Moraine, Ohio |
| AGC Automotive Americas (AGC Inc.) | Vehicle glazing manufacturer | Makes float and fabricated automotive glass at plants in Kentucky and Ohio |
| Anchor Glass Container | Container manufacturer | Makes glass bottles for beer, spirits and food at four U.S. plants |
| Libbey | Pressed and blown glass maker | Makes glass tableware and drinkware for foodservice and retail in Toledo |
| Anchor Hocking | Pressed and blown glass maker | Makes glass bakeware, storage and tableware in Lancaster, Ohio |
Specialty demand offsets a shrinking container base
Credence Research's view is that U.S. glass manufacturing is moving from a volume business toward a specification business. Container tonnage is shrinking as beverage brands switch formats, but solar front sheets, cover glass, drug packaging and multi-pane windows carry more value per ton and need certified domestic suppliers. Trade duties give float producers a window to fill new lines, while furnace rebuilds over the next decade decide which plants stay competitive on energy and carbon. Buyers should expect tighter container supply in some regions and longer qualification for coated and technical glass.
Values anchored to federal output and plant data
The report uses 2025 as the base year and forecasts to 2035. Market values come from the Credence Research model, anchored to BLS sectoral output for glass and glass product manufacturing, which reached about USD 29.6 billion in 2025, and cross-checked with BLS QCEW plant and employment counts, Census construction spending, Federal Reserve vehicle assembly data and USGS soda ash data. Segment and regional splits are Credence Research estimates built from these sources, company releases and trade press. The glass manufacturing estimates use no interviews or surveys of any kind.
Value-added glass gains share through 2035
Through 2035 U.S. glass manufacturing grows slowly but changes in mix. Flat glass and technical glass gain share as solar sheet, cover glass and pharmaceutical lines ramp up and as window codes require more coated and multi-pane glass. Containers keep losing share unless recycling laws cut melting costs and brands return to glass. The South gains the most value from new factories and housing, while the Midwest remains the main producing region. Furnace rebuild choices made before 2030 will decide which plants supply the market in 2035.
Solar demand and container closures set the 2035 range
The range of outcomes depends mostly on how fast solar and specialty glass lines fill and on how many more container furnaces close. Firm trade duties and steady solar module output would keep float lines full, while lower beverage volumes would remove more container capacity. Construction spending matters less than codes, because replacement glazing carries value per opening.
| Scenario | CAGR, 2026–2035 | Value, 2035 | What has to hold |
|---|---|---|---|
| Downside | 1.2% | USD 34.95 billion | Solar module output stalls and more container furnaces close after beverage volumes fall |
| Base | 2.35% | USD 38.53 billion | Solar and drug packaging lines ramp up while containers shrink slowly |
| Upside | 3.4% | USD 42.04 billion | Duties hold, solar glass lines run full and recycling laws cut melting costs |
Frequently Asked Questions
How big is the USA glass manufacturing market?
Which product type leads the market?
Which product type grows fastest?
Which region leads the market?
How do trade duties affect U.S. glass?
Why are glass container plants closing?
How are glassmakers cutting emissions?
Who are the leading companies?
Table of Content
Chapter 1 Market Segmentation
- 1.1 Segmentation Framework
- 1.1.1 Product and Service Classification
- 1.1.2 Application and End-Use Classification
- 1.1.3 Technology and Solution Classification
- 1.1.4 Customer and Distribution Channel Classification
- 1.1.5 Geographic Segmentation
- 1.1.6 Market Segment Definitions and Boundaries
- 1.2 By Product Type
- 1.2.1 Products Made from Purchased Glass
- 1.2.2 Pressed and Blown Glass
- 1.2.3 Glass Containers
- 1.2.4 Flat Glass
- 1.3 By End-Use Industry
- 1.3.1 Construction
- 1.3.2 Food and Beverage Packaging
- 1.3.3 Automotive
- 1.3.4 Healthcare and Technical Industries
- 1.4 By Sales Channel
- 1.4.1 Direct Contract Sales
- 1.4.2 Fabricator Supply Sales
- 1.4.3 Distributor-Mediated Sales
- 1.4.4 Manufacturer Project and Spot Sales
Chapter 2 Introduction
- 2.1 Report Objectives and Scope
- 2.2 Product Definition and Industry Terminology
- 2.3 Market Inclusions and Exclusions
- 2.4 Research Process
- 2.4.1 Primary Research and Expert Interviews
- 2.4.2 Secondary Research and Source Review
- 2.4.3 Top-Down and Bottom-Up Estimation
- 2.4.4 Data Triangulation and Verification
- 2.5 Market Size Measurement Basis
- 2.5.1 2025: USD 30.46 billion → 2035: USD 38.53 billion
- 2.6 Historical and Forecast Reference Periods
- 2.6.1 Historical Period: 2018-2025
- 2.6.2 Base Year: 2025
- 2.6.3 Forecast Period: 2025-2035
- 2.7 Research Assumptions and Limitations
Chapter 3 Executive Summary
- 3.1 Market Snapshot and Key Findings
- 3.2 Base-Year Market Size, 2025
- 3.3 Forecast Market Size, 2035
- 3.4 Revenue and Volume Growth Outlook
- 3.5 Key Demand and Supply Indicators
- 3.6 Leading Market Segments
- 3.7 Fastest-Growing Market Opportunities
- 3.8 Regional Performance Highlights
- 3.9 Technology and Industry Transformation
- 3.10 Competitive Landscape Summary
- 3.11 Analyst View and Strategic Implications
Chapter 4 USA Glass Manufacturing Market Trends and Developments
- 4.1 Historical Industry Development, 2018-2025
- 4.2 Recent Market Trends and Developments
- 4.3 Demand and Customer Behavior Trends
- 4.4 Technology and Product Innovation
- 4.5 Artificial Intelligence, Automation and Digitalization
- 4.6 Local Manufacturing and Supply Chain Realignment
- 4.7 Industry Partnerships, Mergers and Acquisitions
- 4.8 Sustainability and Circular Economy Developments
- 4.9 Government and Private Sector Investment Trends
- 4.10 Emerging Business Models and Commercialization
- 4.11 Industry Developments and Announcements
Chapter 5 USA Glass Manufacturing Market Production, Supply and Demand Analysis
- 5.1 Demand Trend and Consumption Analysis, 2018-2025
- 5.2 Demand Forecast, 2025-2035
- 5.3 Production and Output Trend, 2018-2025
- 5.4 Production and Output Forecast, 2025-2035
- 5.5 Installed Capacity and Capacity Utilization
- 5.6 Company-Wise Production Plants and Statistics
- 5.6.1 Installed Production Capacity
- 5.6.2 Actual Production
- 5.6.3 Planned Capacity and Expansion Targets
- 5.7 Supply Chain Structure and Procurement Trends
- 5.8 Supply-Demand Gap and Bottlenecks
- 5.9 Import Dependence and Sourcing Structure
- 5.10 Contract Manufacturing and Outsourcing
- 5.11 Regional Supply and Demand Concentration
Chapter 6 USA Glass Manufacturing Market Pricing Analysis
- 6.1 Pricing Structure and Measurement
- 6.2 Historical Pricing Trends, 2018-2025
- 6.3 Pricing Outlook, 2025-2035
- 6.4 Average Selling Price and Unit Economics
- 6.5 Pricing by Product and Market Segment
- 6.6 Geographic Pricing Differences
- 6.7 Key Input, Energy, Labor and Logistics Costs
- 6.8 Contract Pricing and Purchasing Models
- 6.9 Pricing Sensitivity and Competitive Positioning
- 6.10 Price, Margin and Profitability Implications
Chapter 7 USA Glass Manufacturing Market Dynamics
- 7.1 Market Growth Drivers
- 7.1.1 Demand-Side Drivers
- 7.1.2 Technology and Innovation Drivers
- 7.1.3 Infrastructure and Investment Drivers
- 7.1.4 Regulatory and Policy Drivers
- 7.2 Market Restraints
- 7.2.1 Cost and Affordability Constraints
- 7.2.2 Technology and Adoption Barriers
- 7.2.3 Supply Chain and Operational Constraints
- 7.3 Market Challenges
- 7.3.1 Competitive Pressure and Margin Erosion
- 7.3.2 Skills, Infrastructure and Implementation Gaps
- 7.4 Emerging Market Opportunities
- 7.5 Market Dynamics Impact and Time-Horizon Assessment
Chapter 8 USA Glass Manufacturing Value Chain Analysis
- 8.1 Industry Value Chain Overview
- 8.2 Upstream Suppliers and Critical Inputs
- 8.3 Technology and Component Providers
- 8.4 Manufacturing or Service Delivery
- 8.5 Distribution, Channel Partners and Integrators
- 8.6 Downstream Applications and End Users
- 8.7 Value Addition and Profit Pools
- 8.8 Vertical Integration and Outsourcing
- 8.9 Supplier Concentration and Risk
- 8.10 Supply Chain Localization and Resilience
Chapter 9 USA Glass Manufacturing Market Regulations and Policies
- 9.1 Relevant Laws, Standards and Compliance Frameworks
- 9.2 Product, Service, Safety and Quality Requirements
- 9.3 Government Policies, Incentives and Subsidies
- 9.4 Imports, Exports and Trade Barriers
- 9.5 Public Procurement and Local Content Requirements
- 9.6 Environmental and Sustainability Compliance
- 9.7 Upcoming Policy Changes and Market Implications
Chapter 10 USA Glass Manufacturing Market Hotspots and Opportunities
- 10.1 Market Opportunity Mapping and Growth Hotspots
- 10.2 High-Growth Applications and Customer Groups
- 10.3 Underserved Markets and White-Space Opportunities
- 10.4 Emerging Technology and Product Opportunities
- 10.5 New Capacity and Investment Hotspots
- 10.6 Market Entry and Expansion Opportunities
- 10.7 Distribution and Partnership Opportunities
- 10.8 Near-Term and Long-Term Commercial Potential
- 10.9 Opportunity Attractiveness and Execution Risks
Chapter 11 USA Glass Manufacturing Market Outlook, 2025-2035
- 11.1 Market Size and Analysis
- 11.1.1 Revenue (Market Measurement: 2025: USD 30.46 billion → 2035: USD 38.53 billion)
- 11.1.2 Market Volume and Quantity Sold
- 11.1.3 Historical Market Size, 2018-2025
- 11.1.4 Base-Year Market Size, 2025
- 11.2 Market Forecast, 2025-2035
- 11.2.1 Revenue Forecast to 2035
- 11.2.2 Volume Forecast to 2035
- 11.2.3 CAGR and Year-on-Year Growth
- 11.2.4 Incremental Revenue Opportunity
- 11.3 Forecast Assumptions and Scenario Analysis
- 11.3.1 Base-Case Forecast
- 11.3.2 Optimistic and Conservative Scenarios
- 11.3.3 Technology, Pricing and Policy Sensitivities
- 11.4 Market Attractiveness and Growth Outlook
Chapter 12 USA Glass Manufacturing Market Segmentation and Outlook
- 12.1 Segmentation Summary and Market Shares, 2025
- 12.2 Largest and Fastest-Growing Segments
- 12.3 By Product Type - Market Size and Forecast, 2025-2035
- 12.3.1 Segment Definition and Scope
- 12.3.2 Historical Market Size, 2018-2025
- 12.3.3 Revenue Forecast, 2025-2035
- 12.3.4 Volume Forecast, 2025-2035
- 12.3.5 Base-Year Market Share, 2025
- 12.3.6 Segment CAGR and Growth Drivers
- 12.3.7 Subsegment Market Size and Forecast
- 12.3.7.1 Products Made from Purchased Glass
- 12.3.7.2 Pressed and Blown Glass
- 12.3.7.3 Glass Containers
- 12.3.7.4 Flat Glass
- 12.3.8 Subsegment Pricing and Adoption Trends
- 12.3.9 Leading Suppliers and Competition
- 12.3.10 Regional Demand and Opportunities
- 12.4 By End-Use Industry - Market Size and Forecast, 2025-2035
- 12.4.1 Segment Definition and Scope
- 12.4.2 Historical Market Size, 2018-2025
- 12.4.3 Revenue Forecast, 2025-2035
- 12.4.4 Volume Forecast, 2025-2035
- 12.4.5 Base-Year Market Share, 2025
- 12.4.6 Segment CAGR and Growth Drivers
- 12.4.7 Subsegment Market Size and Forecast
- 12.4.7.1 Construction
- 12.4.7.2 Food and Beverage Packaging
- 12.4.7.3 Automotive
- 12.4.7.4 Healthcare and Technical Industries
- 12.4.8 Subsegment Pricing and Adoption Trends
- 12.4.9 Leading Suppliers and Competition
- 12.4.10 Regional Demand and Opportunities
- 12.5 By Sales Channel - Market Size and Forecast, 2025-2035
- 12.5.1 Segment Definition and Scope
- 12.5.2 Historical Market Size, 2018-2025
- 12.5.3 Revenue Forecast, 2025-2035
- 12.5.4 Volume Forecast, 2025-2035
- 12.5.5 Base-Year Market Share, 2025
- 12.5.6 Segment CAGR and Growth Drivers
- 12.5.7 Subsegment Market Size and Forecast
- 12.5.7.1 Direct Contract Sales
- 12.5.7.2 Fabricator Supply Sales
- 12.5.7.3 Distributor-Mediated Sales
- 12.5.7.4 Manufacturer Project and Spot Sales
- 12.5.8 Subsegment Pricing and Adoption Trends
- 12.5.9 Leading Suppliers and Competition
- 12.5.10 Regional Demand and Opportunities
- 12.6 Segment Growth Comparison
- 12.7 Segment Attractiveness and Priority Matrix
Chapter 13 USA Glass Manufacturing End-Use and Application Market Outlook
- 13.1 End-Use Industry and Customer Demand Structure
- 13.2 Leading Applications and Customer Groups
- 13.3 End-Use Market Size, Share and Forecast
- 13.4 Major End-Use Industry Deep Dives
- 13.4.1 Customer Requirements and Use Cases
- 13.4.2 Demand and Replacement Cycles
- 13.4.3 Technical and Regulatory Considerations
- 13.4.4 Purchasing and Procurement Models
- 13.4.5 Leading Vendors and Distribution Channels
- 13.4.6 Forecast and Commercial Opportunities
- 13.5 Emerging Applications and Cross-Segment Demand
- 13.6 End-Use Industry Investment Priorities
Chapter 14 USA Glass Manufacturing Geographic Market Outlook, 2025-2035
- 14.1 Domestic Market Distribution and Demand Clusters
- 14.2 State- or Province-Wise Market Size and Forecast, 2025-2035
- 14.3 City and Metropolitan Market Outlook
- 14.4 Industrial, Manufacturing and Commercial Clusters
- 14.5 Geographic Concentration of Key End Users
- 14.6 Local Pricing and Purchasing Differences
- 14.7 Domestic Production Facilities and Capacity Map
- 14.8 Local Infrastructure and Project Pipeline
- 14.9 State-Level Policy and Incentive Differences
- 14.10 Subnational Investment Hotspots and Opportunities
- 14.11 Distribution and Logistics Networks
- 14.12 Domestic Competitive Footprint
Chapter 15 USA Glass Manufacturing Technology, Innovation and Sustainability Outlook
- 15.1 Technology Landscape and Maturity
- 15.2 Product, Process and Service Innovation
- 15.3 AI, Automation and Digital Tools in the Industry
- 15.4 Technology Adoption and Performance Benchmarking
- 15.5 Innovation Pipeline and R&D Investment
- 15.6 Patent and Intellectual Property Trends
- 15.7 Energy Efficiency and Resource Management
- 15.8 Sustainability, Recycling and Circularity
- 15.9 Technology Roadmap, 2025-2035
- 15.10 Risks of Obsolescence and Technology Substitution
Chapter 16 USA Glass Manufacturing Market Key Strategic Imperatives
- 16.1 Growth and Market Entry Priorities
- 16.2 High-Return Products and Segments
- 16.3 Pricing, Profitability and Cost Optimization
- 16.4 Technology Investment and Product Differentiation
- 16.5 Supply Chain Localization and Resilience
- 16.6 Distribution and Customer Acquisition
- 16.7 Partnership, Acquisition and Capacity Strategy
- 16.8 Regional Expansion Priorities
- 16.9 Short-, Medium- and Long-Term Actions
Chapter 17 Competition Outlook
- 17.1 Industry Competition Characteristics
- 17.2 Market Structure and Concentration
- 17.3 Market Share and Competitive Positioning, 2025
- 17.4 Company-Wise Revenue and Product Benchmarking
- 17.5 Production and Service Capacity Benchmarking
- 17.6 Technology, Pricing and Differentiation
- 17.7 Regional Footprint and Distribution Strength
- 17.8 Mergers, Acquisitions and Strategic Alliances
- 17.9 New Entrants and Competitive Threats
- 17.10 Porter's Five Forces and Industry Attractiveness
- 17.11 Competitive Outlook, 2025-2035
Chapter 18 Company Profiles
- 18.1 Company Coverage and Selection Criteria
- 18.2 O-I Glass
- 18.2.1 Business Description
- 18.2.2 Company Ownership and Geographic Presence
- 18.2.3 Product and Service Portfolio
- 18.2.4 Manufacturing and Operating Footprint
- 18.2.5 Production Capacity and Expansion Plans
- 18.2.6 Financial Performance and Investment
- 18.2.7 Market Share and Competitive Position
- 18.2.8 Technology and Innovation Capabilities
- 18.2.9 Strategic Alliances or Partnerships
- 18.2.10 Recent Developments
- 18.2.11 Growth Strategy and Outlook
- 18.3 Guardian Glass (Koch Industries)
- 18.4 Cardinal Glass Industries
- 18.5 Vitro Architectural Glass (Vitro)
- 18.6 Ardagh Glass Packaging North America (Ardagh Group)
- 18.7 Corning Incorporated
- 18.8 Pilkington North America (NSG Group)
- 18.9 Fuyao Glass America (Fuyao Glass Industry Group)
- 18.10 AGC Automotive Americas (AGC Inc.)
- 18.11 Anchor Glass Container
- 18.12 Libbey
- 18.13 Anchor Hocking
- 18.14 Other Relevant Market Participants
Note: Every listed company is profiled on the structure shown under the first company. The company list is preliminary and may change based on research findings, market developments, data availability and client requirements.
Chapter 19 Disclaimer
- 19.1 Research and Forecast Disclaimer
- 19.2 Data Source and Estimation Limitations
Note: The depth of individual sections depends on data availability for this market. Volume, capacity, trade and other unit-based metrics are included where applicable.