
Asia Pacific mobile crane demand follows energy and fab work
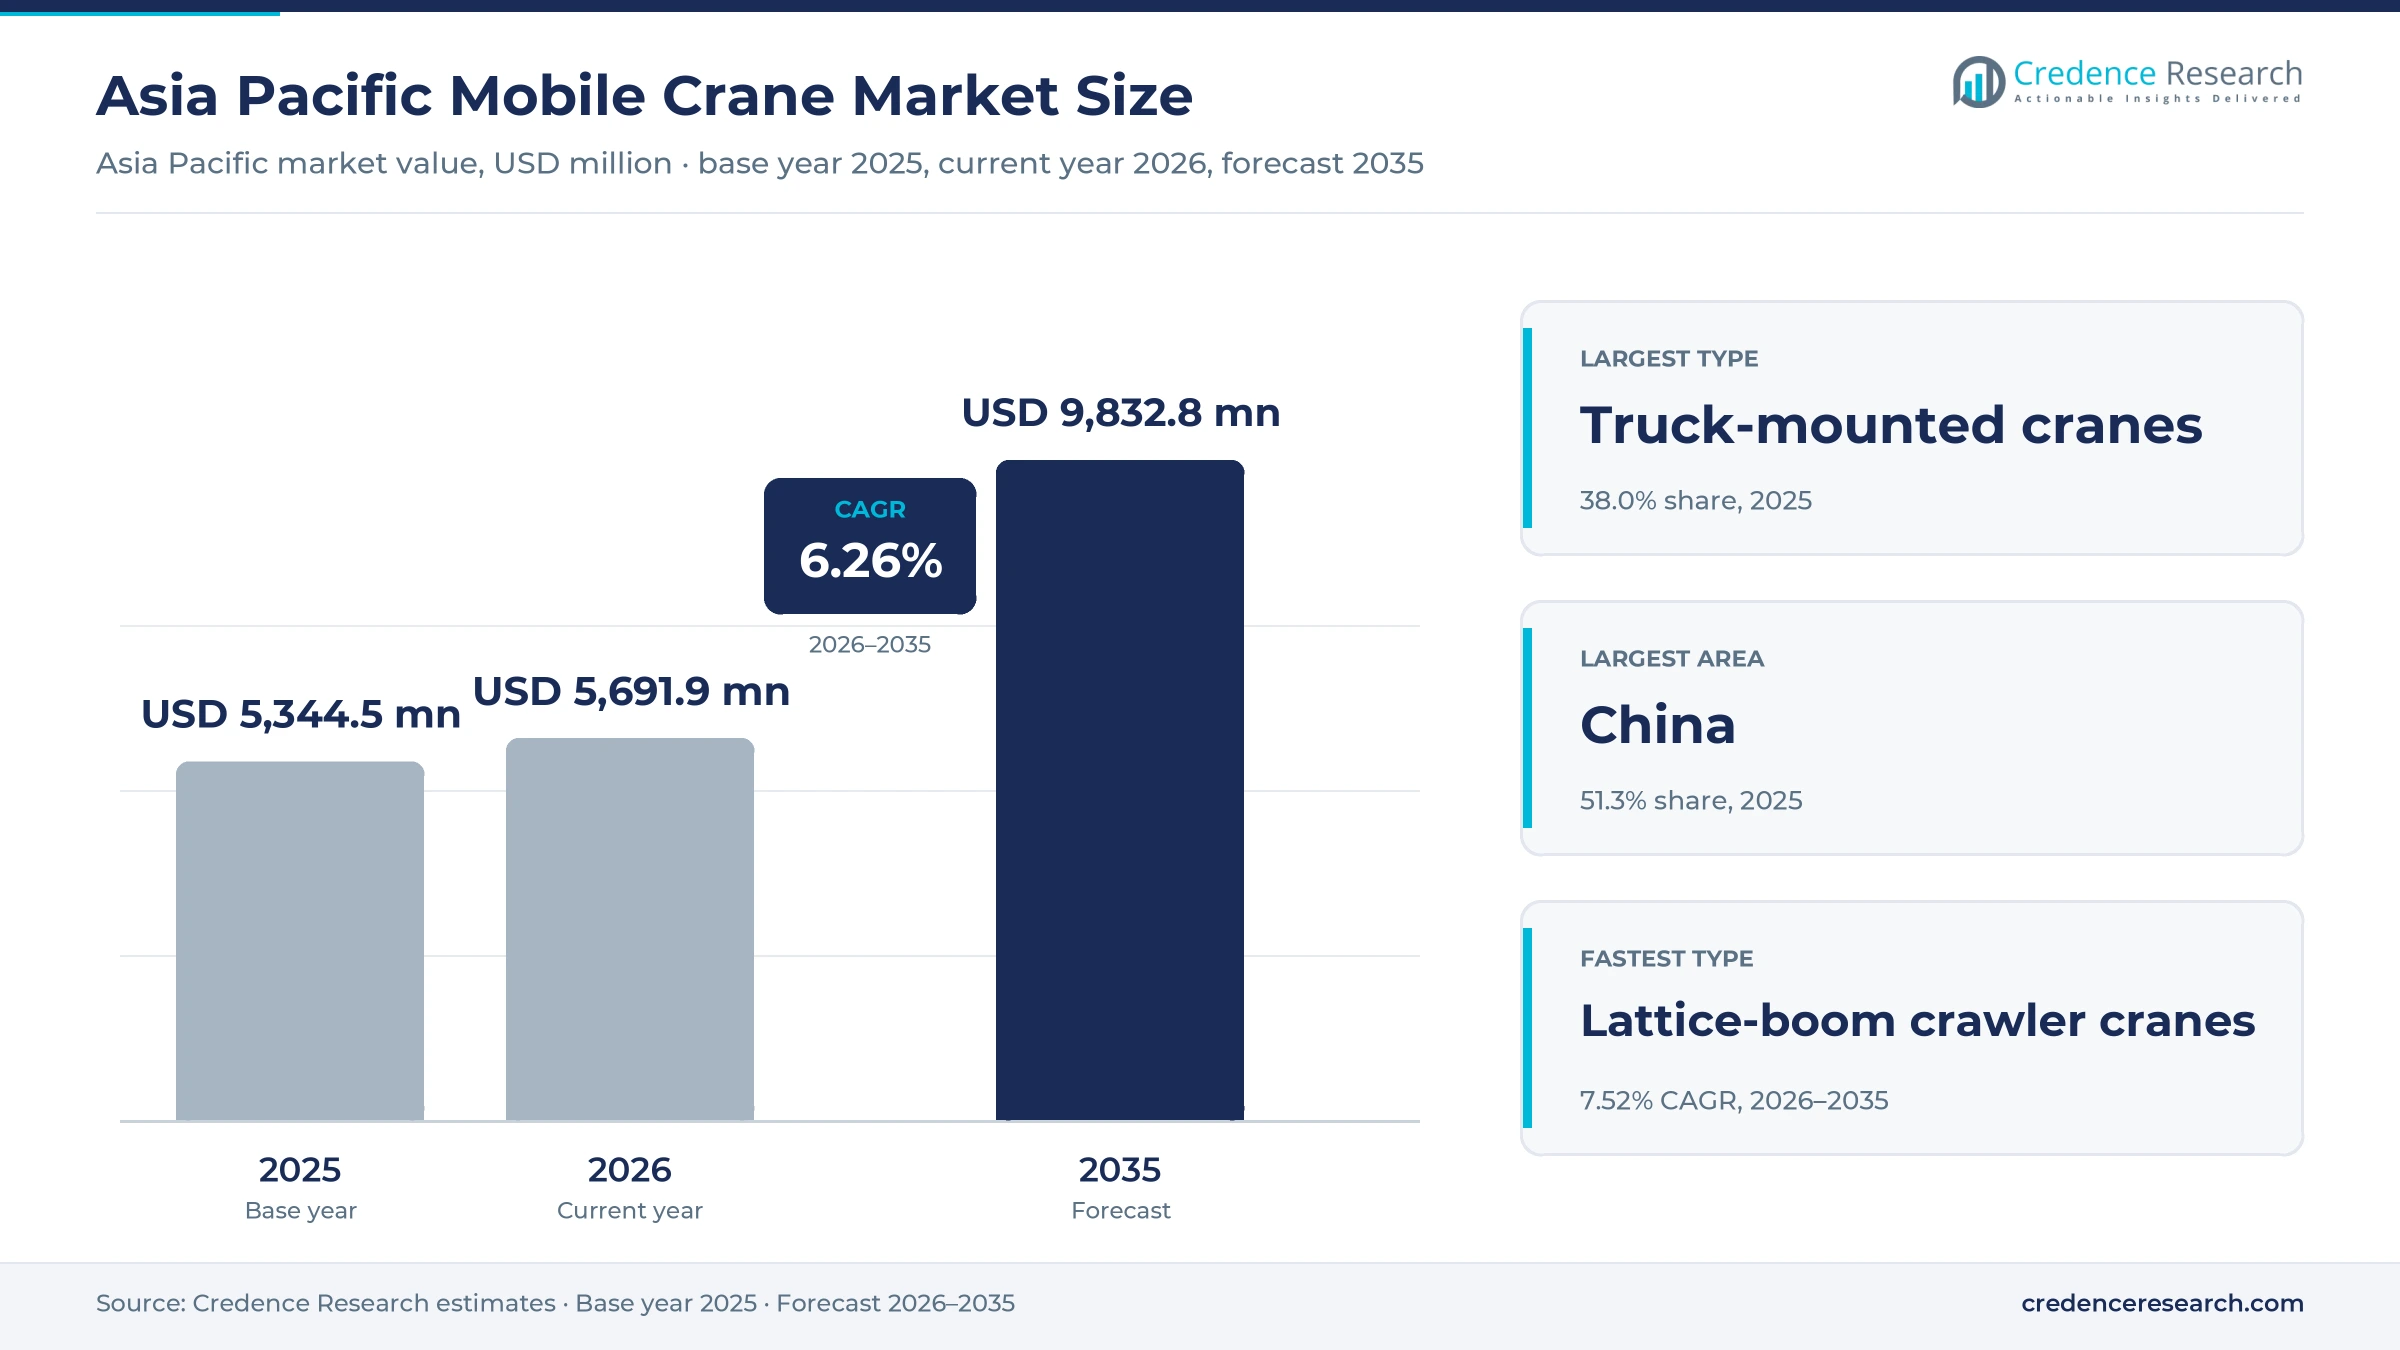
The Asia Pacific mobile crane market was valued at USD 5.34 billion in 2025 and is projected to increase from USD 5.69 billion in 2026 to USD 9.83 billion by 2035, registering a CAGR of 6.26% during 2026–2035. Demand comes from wind farms, transmission work, transport megaprojects, chip plants and shipyards, and rental fleets place most of the orders. China held the largest share, 51.3% in 2025, because domestic buyers took 9,773 truck cranes in the first 11 months of that year. India and residual South Asia is the fastest-growing area at 8.57% a year, supported by record wind installation and a new local heavy crane venture. The clearest commercial change is the move of Chinese suppliers into export markets, which has already drawn an Indian trade remedy recommendation against some imported units. Battery machines remain a small part of the fleet, although Japanese and Chinese builders now offer production models for urban and plant sites.
What counts as a mobile crane in this Asia Pacific estimate?
The estimate counts new all-terrain, rough-terrain, truck-mounted, lattice-boom crawler and pick-and-carry cranes sold to fleets, contractors, asset owners and public agencies across the region. Buyers purchase through builder sales teams, authorized dealers and independent distributors, and large rental groups often negotiate multi-unit supply agreements directly with the factory.
The value excludes tower cranes, overhead and gantry cranes, port-only harbor cranes, lorry loaders, rental income and used machine resale. The value chain runs from steel, boom and hydraulic suppliers through crane builders, then to rental fleets that supply operators and lift planning for each project.
Asia Pacific Mobile Crane Market Insights
- Regional crane sales grow from USD 5.34 billion in 2025 to USD 9.83 billion by 2035, a 6.26% CAGR, as energy, transport and chip projects require larger lifts.
- China held 51.3% of Asia Pacific value in 2025, reflecting its truck crane volume, domestic wind installation pace and strong factory base.
- Truck-mounted cranes led with 38.0% of 2025 value, while lattice-boom crawler cranes expand fastest at 7.52% a year on heavy project work.
- Crawler crane sales by Chinese builders rose 26.5% to 3,030 units between January and November 2025, according to the China Construction Machinery Association.
- XCMG reported nearly 300 crawler cranes delivered to Southeast Asia in August 2026, describing the batch as the largest single crawler crane order there.
Truck units set volume while crawlers gain the most
Why do truck-mounted cranes lead and crawlers grow fastest?
Based on product type, the market is categorized into all-terrain, rough-terrain, truck-mounted, lattice-boom crawler and pick-and-carry cranes. Truck-mounted cranes led with 38.0% of 2025 value, because Chinese builders sold 18,063 truck cranes between January and November 2025, according to the China Construction Machinery Association. Lattice-boom crawler cranes grow fastest at 7.52% a year, as the same association counted 3,030 crawler units, up 26.5%. In Vietnam, HeavyLift PFI reported that Sarens used 1,250-ton and 750-ton crawlers at Long Thanh for steel loads of up to 80 tons.
Which end-use industry buys the most lifting capacity?
Based on end-use industry, the market is categorized into civil infrastructure and buildings, power and utilities, mining and hydrocarbons, manufacturing and semiconductor facilities, and ports and shipbuilding. Civil infrastructure and buildings led with 44.0% of 2025 value, because single projects absorb large fleets, as shown by the US$4.1 billion first phase at Long Thanh International Airport reported by KHL in July 2024. Power and utilities grow fastest at 7.56% a year, as the International Energy Agency counted 117 GW of Chinese wind additions in 2025, up 48% from 2024.
Why do rental fleet owners place the largest orders?
Based on customer type, the market is categorized into crane rental fleet owners, construction and EPC contractors, industrial asset owners and public infrastructure agencies. Crane rental fleet owners led with 49.0% of 2025 value, because contractors usually hire heavy capacity by project, as Denzai Vietnam did when leasing two 800-ton crawlers to ATAD Steel Structure in 2024. Crane rental fleet owners also grow fastest at 6.69% a year. India shows why, since Autocar Professional reported in December 2025 that ACE and Sanghvi Movers, which runs more than 450 cranes, signed an agreement covering locally built heavy machines.
How quickly can battery machines displace diesel lifting?
Based on technology, the market is categorized into diesel-only, hybrid and plug-in lifting, and battery-electric cranes. Diesel-only cranes led with 88.0% of 2025 value, because remote sites still lack charging, and a 25-ton Tadano EVOLT eGR-250N needs about 2.5 hours of quick charging for roughly five hours of work. Battery-electric cranes grow fastest at 14.90% a year, as buyers trial them on urban and plant sites, such as the 160-ton Liebherr crawler that Gammon Construction deployed at Hong Kong International Airport in 2023. The same logic supports hybrid construction machinery on sites with partial grid access.
| Segment Group | Leading Sub-segment | Share, 2025 | Fastest-growing Sub-segment | CAGR, 2026–2035 |
|---|---|---|---|---|
| By Product Type | Truck-mounted cranes | 38.0% | Lattice-boom crawler cranes | 7.52% |
| By End-Use Industry | Civil infrastructure and buildings | 44.0% | Power and utilities | 7.56% |
| By Customer Type | Crane rental fleet owners | 49.0% | Crane rental fleet owners | 6.69% |
| By Technology | Diesel-only cranes | 88.0% | Battery-electric cranes | 14.90% |
Request a Free Sample
Fill in your details and we'll send you a free sample report.
- Sample data tables & charts
- Research methodology
Wind, chip plants and local supply lift heavy lifting orders
Energy infrastructure lifting requirements favor larger cranes
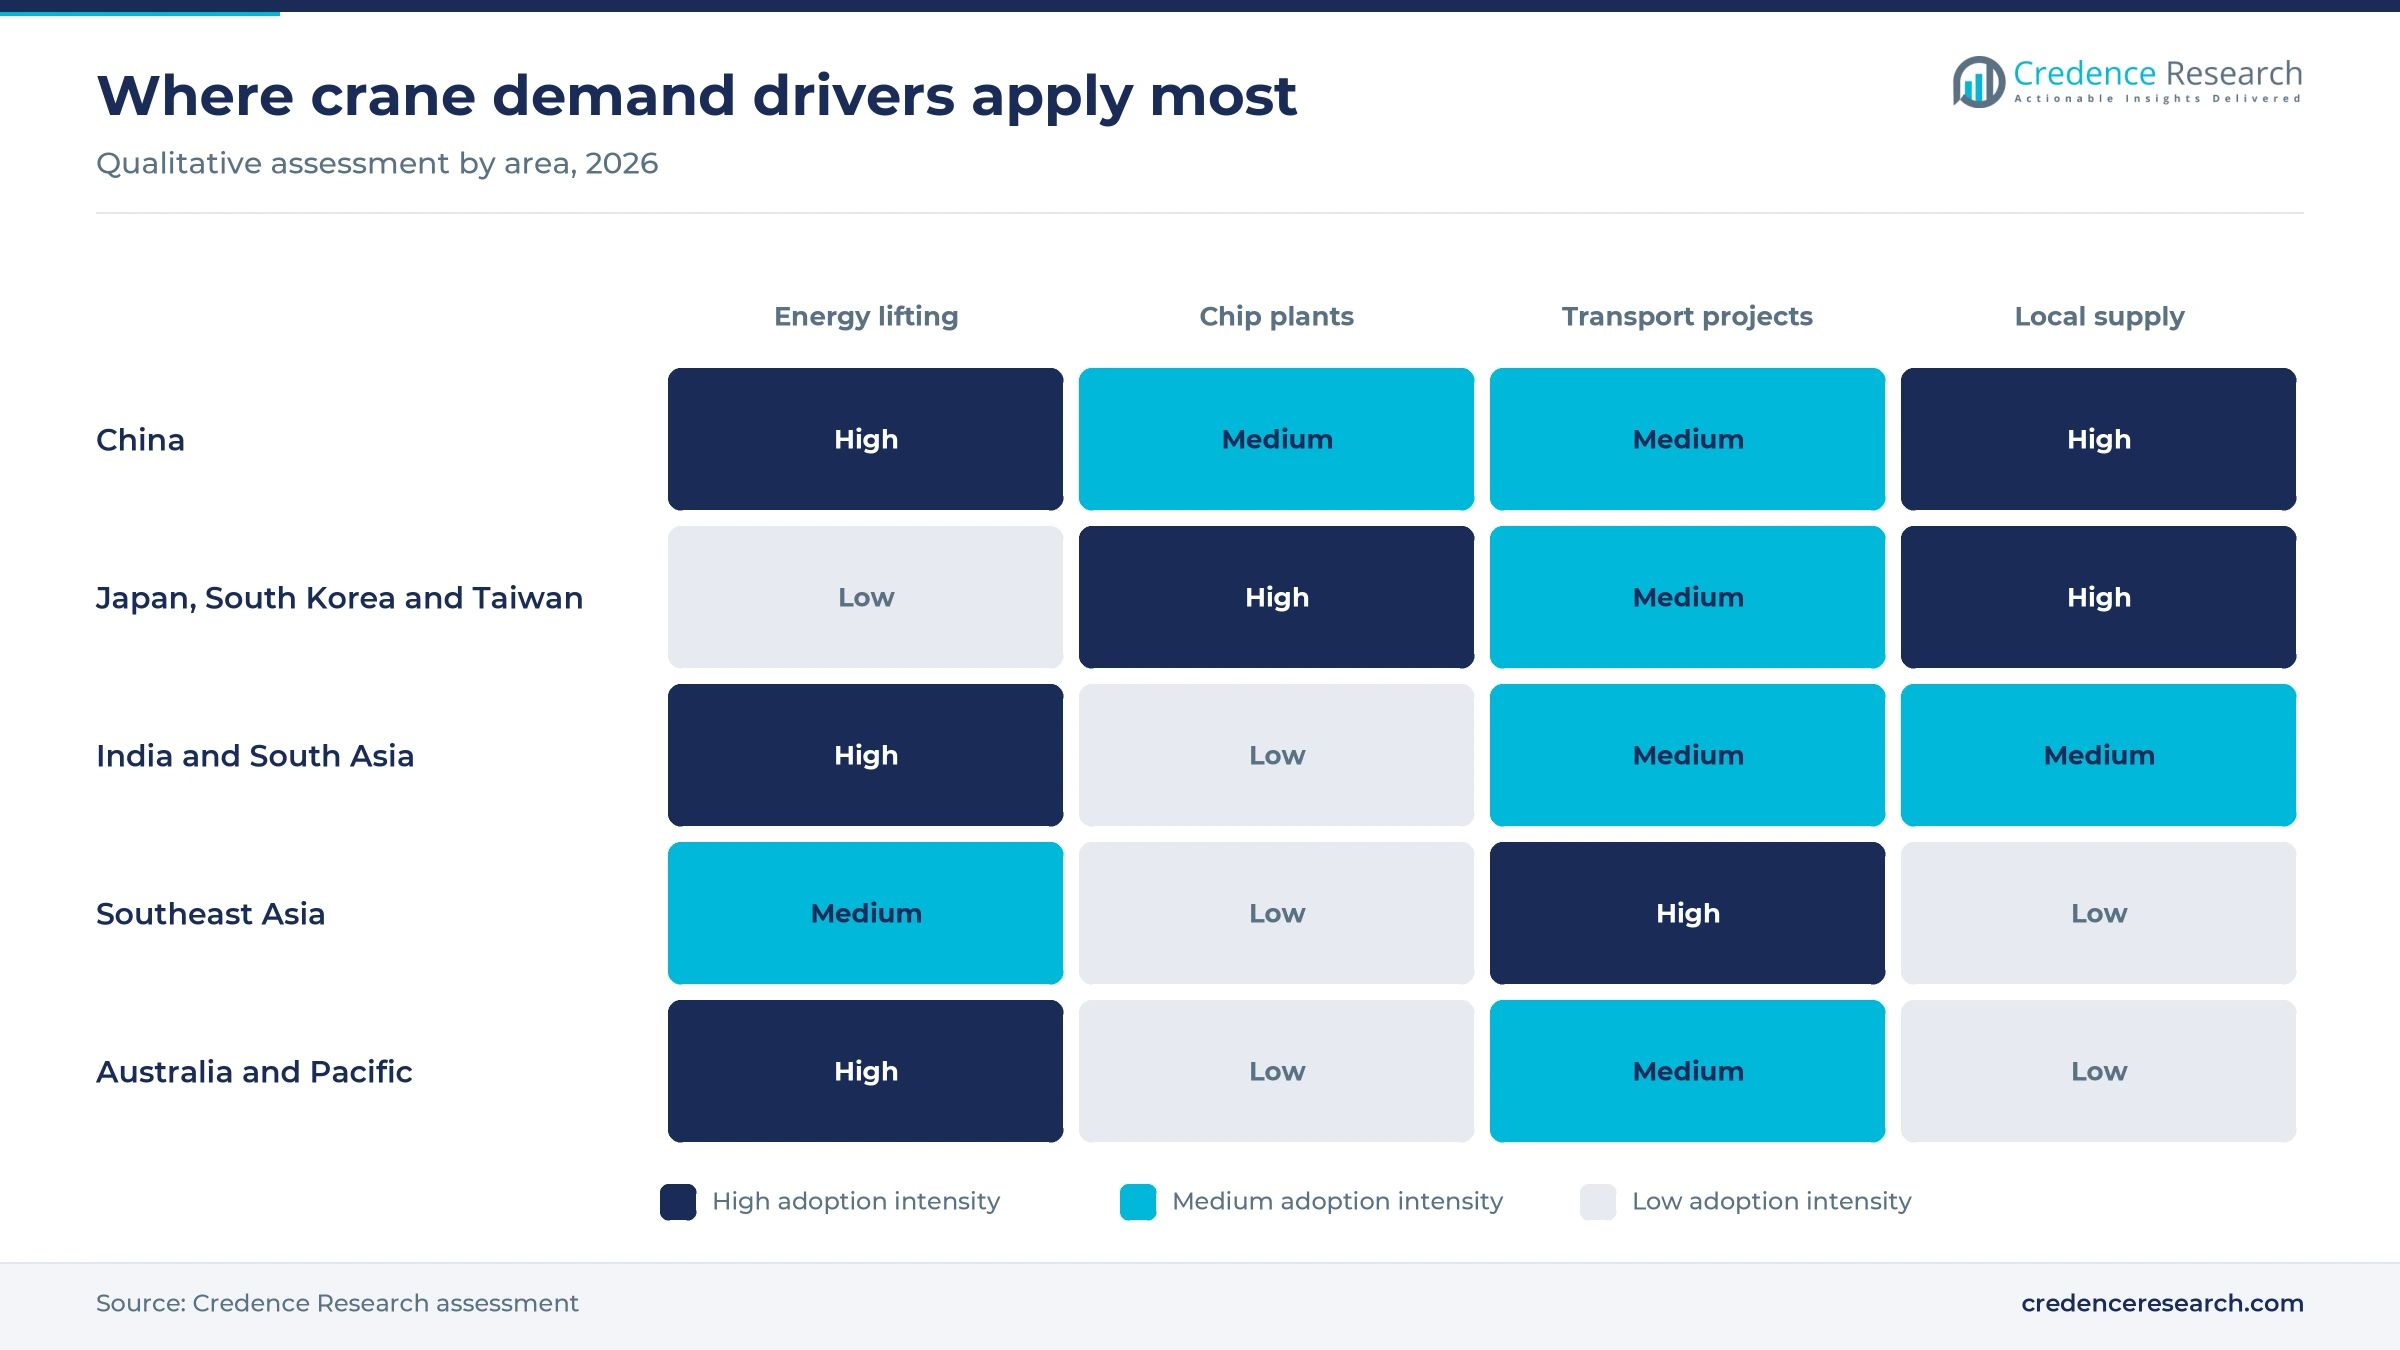
Power projects are the strongest source of new lifting demand, because taller towers and heavier nacelles push buyers toward high-capacity machines. The International Energy Agency reported 117 GW of wind additions in China in 2025, while India added more than 6 GW after doubling its 2024 pace. China's National Energy Administration also said investment in key energy projects passed 3.5 trillion yuan in 2025, up nearly 11%, according to a China Daily report. As a result, wind turbine installations now shape crane specifications. Zoomlion designed its ZAT24000H to set turbines at 160 meters, and that requirement supports the 7.56% growth rate of the power and utilities segment.
Semiconductor facility construction adds precise plant lifts
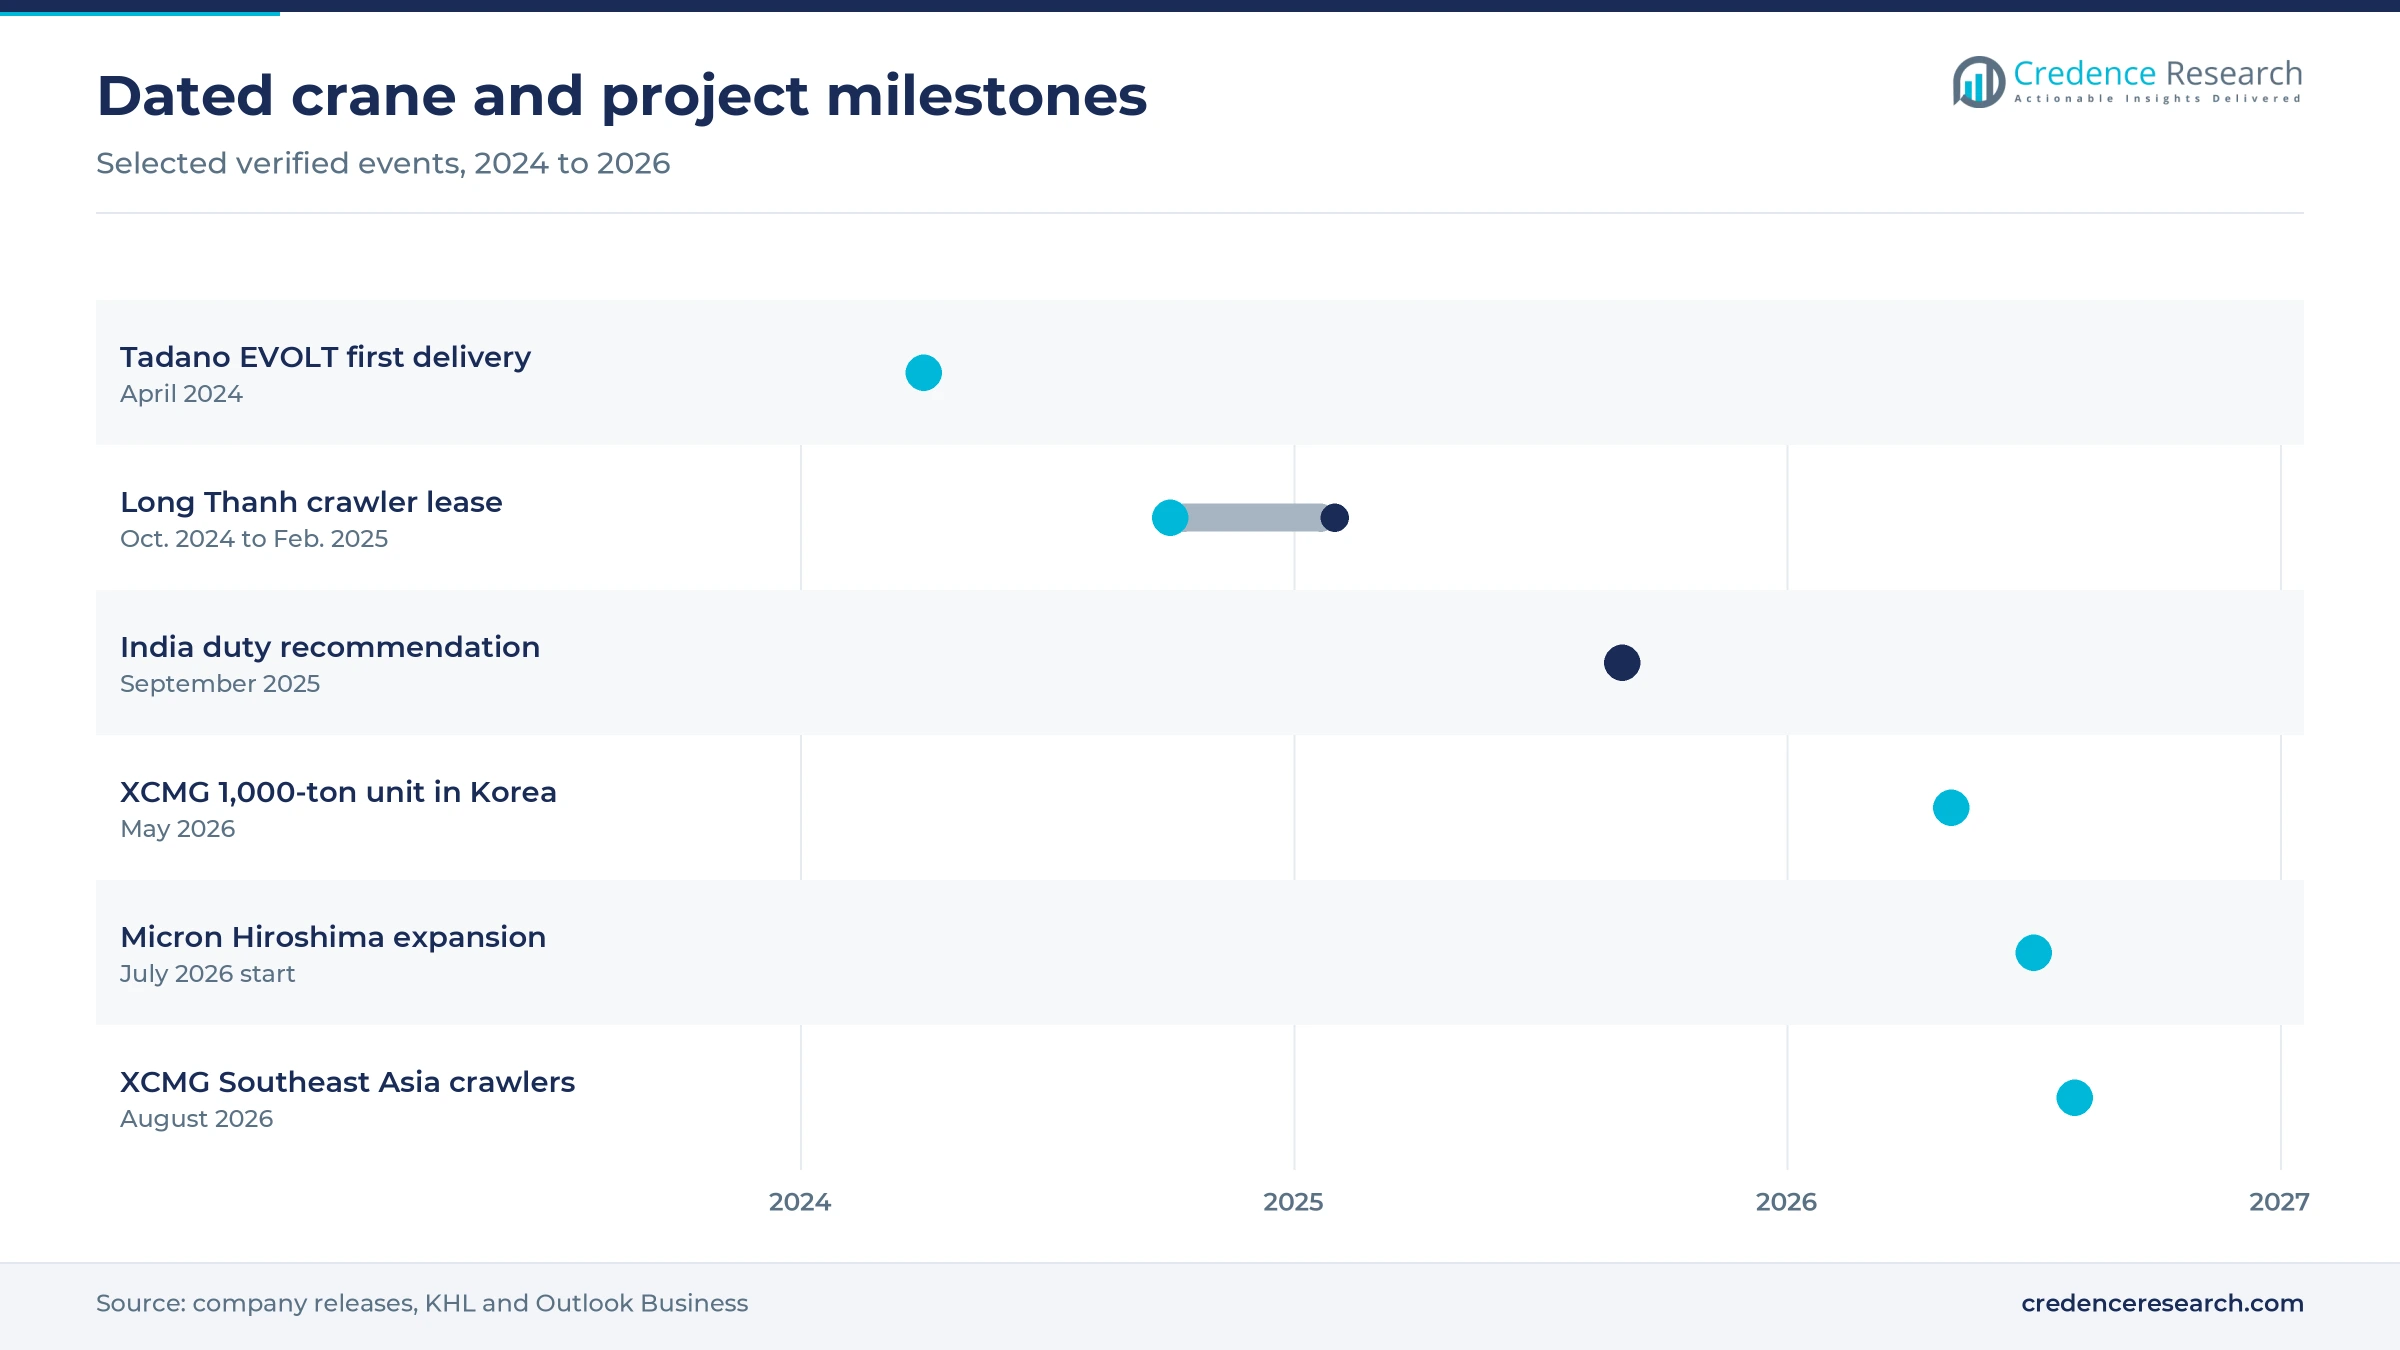
Chip plants add a smaller but demanding stream of work, because each fab requires heavy equipment, utilities and steel placed on tight schedules. Reuters, relaying a Yomiuri report, said on Feb. 4, 2026, that TSMC would raise its second Kumamoto investment to about US$17 billion for 3-nanometer output. Cleanroom Technology reported on July 10, 2026, that Micron had broken ground on a US$9.3 billion Hiroshima expansion, with commercial production expected in 2028. Tower cranes often handle the main frame, as more than 50 Potain units did for Samsung in Korea, so mobile fleets usually take equipment and support lifts.
Domestic manufacturing and fleet availability widen supply
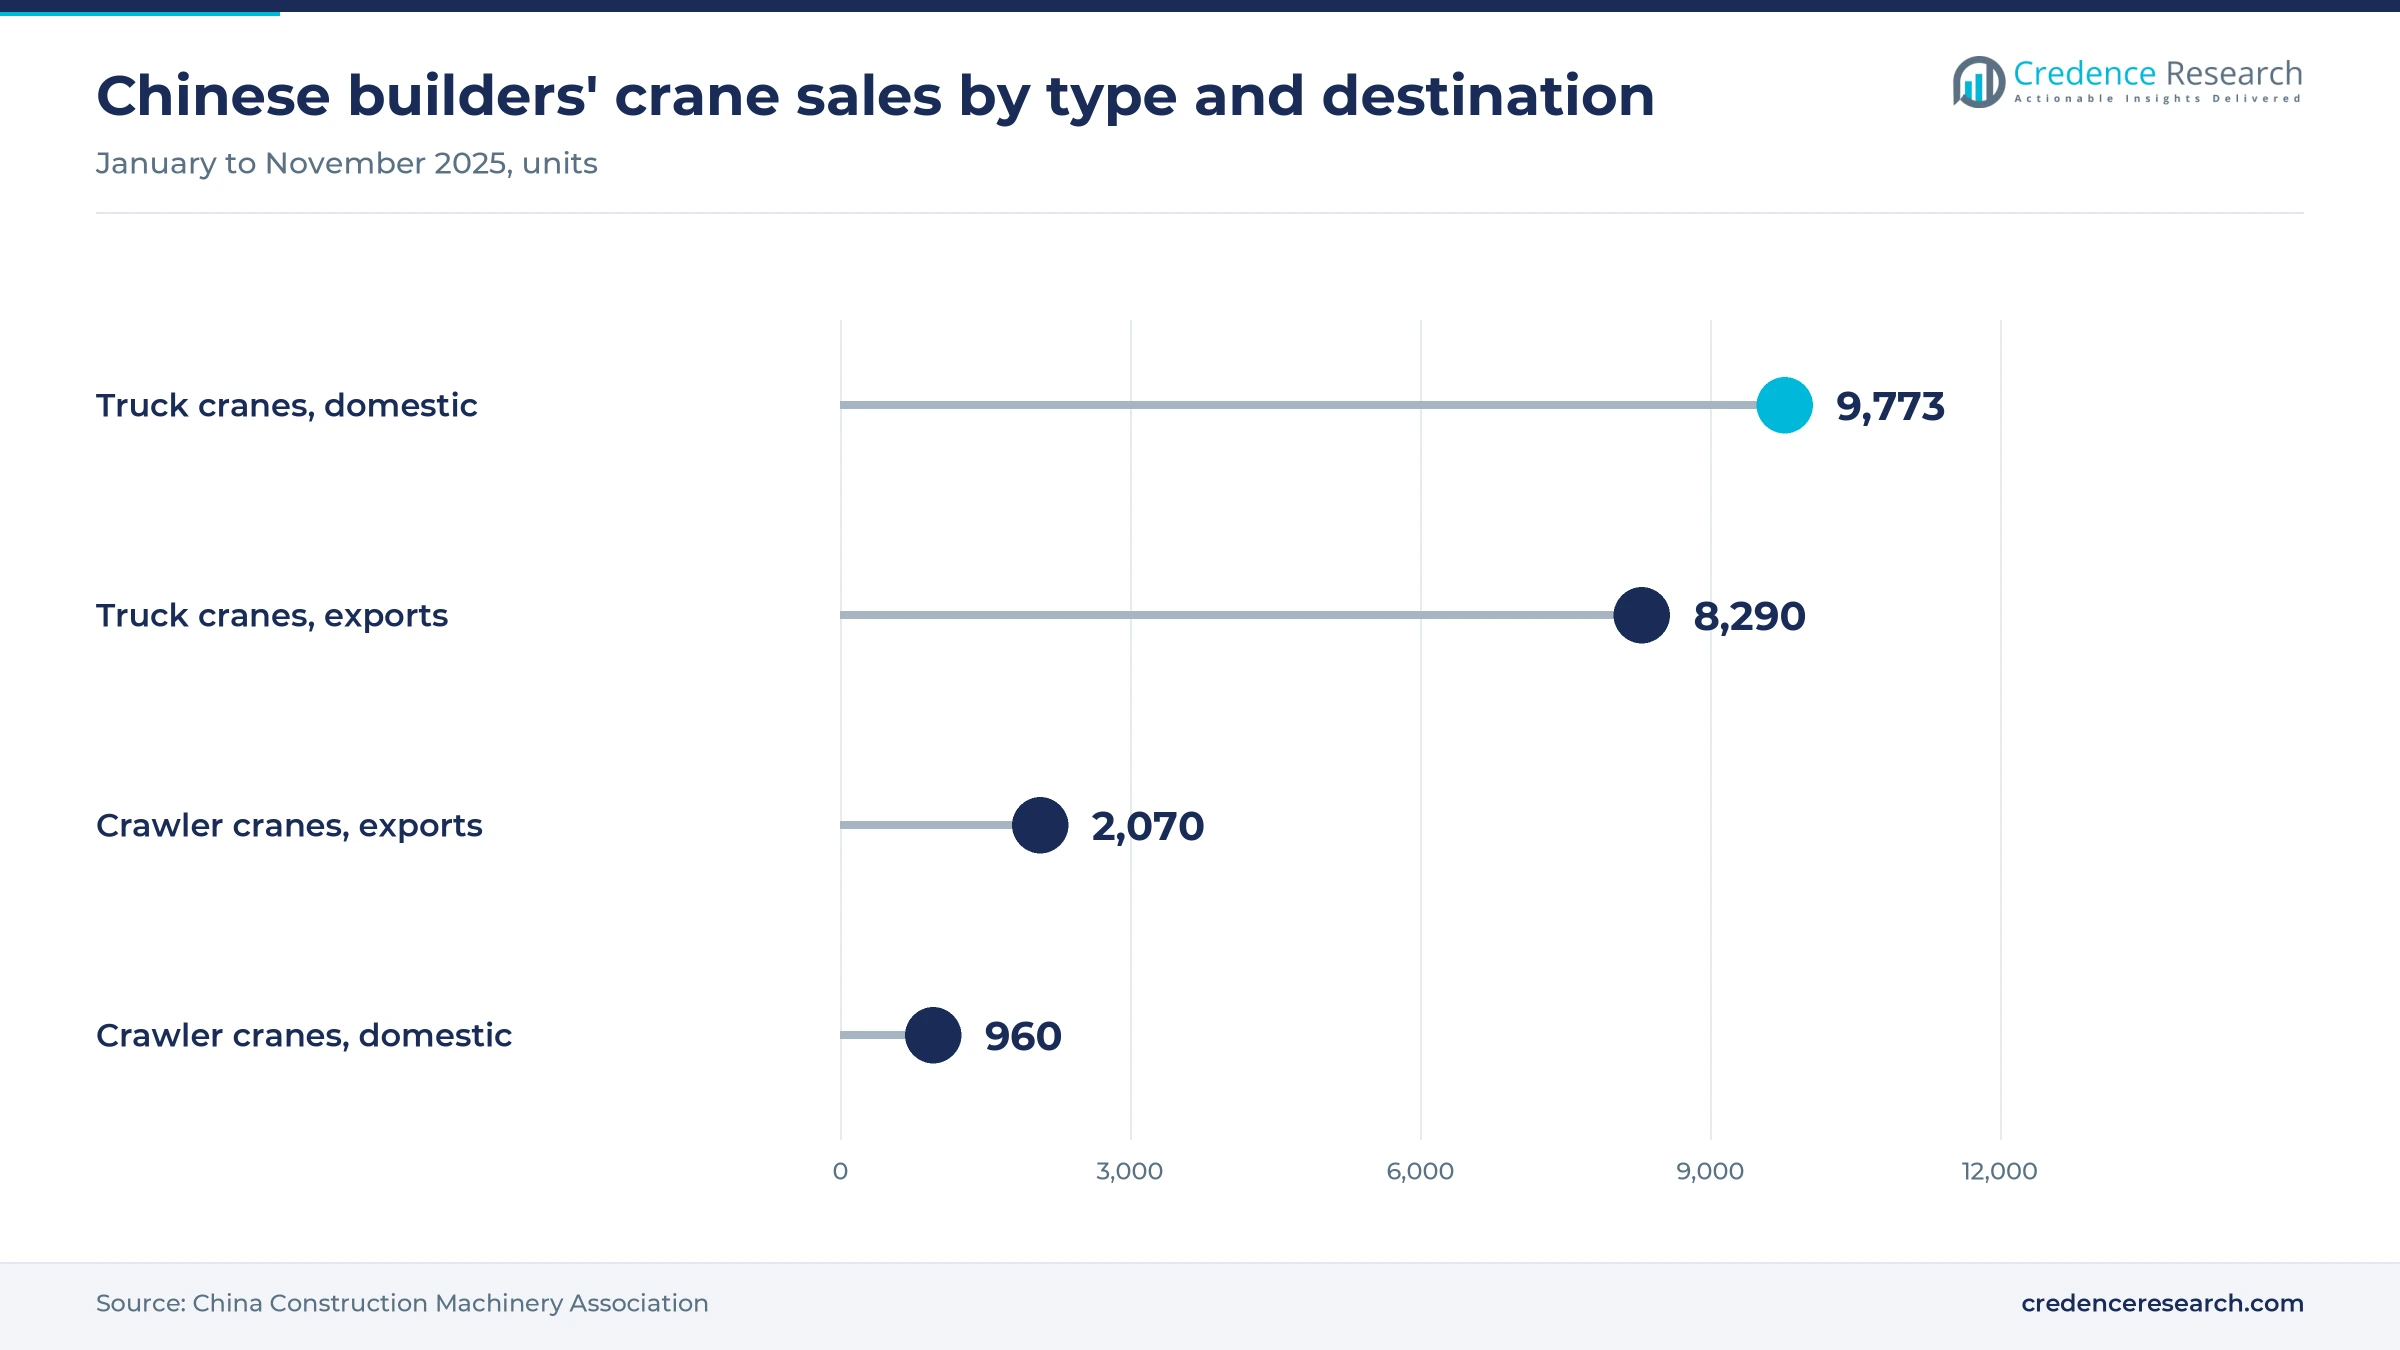
Local factories and larger rental fleets are shortening the wait for heavy capacity, particularly in India. ACE and Kato Works formed a 50:50 venture with investment of about Rs 2 billion to build truck, crawler and rough-terrain cranes in Haryana, according to Indian Infrastructure in March 2026. Sanghvi Movers runs cranes from 40 to 1,600 tons across 130 active project sites and 15 depots, which gives equipment rental buyers a deep regional pool. China supplies the other side of the balance, because its builders exported 8,290 truck cranes and 2,070 crawler cranes between January and November 2025. Together these sources are expanding the choice available to Asian contractors.
Transport megaprojects keep heavy crawlers on long hires
Airport, bridge and rail programs keep large machines on site for months, which supports fleet utilization and replacement decisions. KHL reported in July 2024 that two 800-ton crawlers would work at Long Thanh from October 2024 to February 2025, and Sarens then added, according to HeavyLift PFI, larger machines expected to stay at least five months. XCMG said its 1,000-ton XCA1000G8-1K completed a bridge lift at Pyeongtaek, South Korea, according to a May 8, 2026, release. Vietnam's 1,541-kilometer North-South high-speed railway is the next test, because its construction minister has asked agencies to break ground by the end of 2026, The Investor reported in December 2025.
Batteries and larger booms reshape what fleets buy
Battery-electric cranes shift from pilots to production units
Electric lifting is moving from demonstrations to paid project work, although volumes remain low against the diesel fleet. KHL reported on April 30, 2024, that Tadano delivered the first production EVOLT eGR-250N in Japan to Taihei Dengyo for a two-year power plant job. The crane carries a 226 kWh lithium-ion pack that supports about five hours of work and 42 kilometers of road travel. XCMG followed by showing the XCT50G6-1EV, an all-electric unmanned crane, at its customer festival held May 18-22, 2026, according to Equipment India. This progress fits the wider market for electric construction machinery, where Battery-electric cranes remain the fastest technology at 14.90% a year.
Rising boom capacity moves all-terrain models into crawler work
Larger all-terrain cranes are taking some jobs that once required a crawler, because they travel between sites without long assembly periods. Zoomlion said in a Feb. 27, 2026, release that its first shipments of the year included more than 1,500 construction cranes and a 4,000-ton all-terrain model. XCMG described a batch led by its XCA4000 on the same date, naming wind, municipal and chemical plant work. In South Korea, the XCA1000G8-1K offers a 102.5-meter main boom and can travel on public roads with its boom attached, according to XCMG. These launches give rental fleets a faster mobilization option for turbine and bridge contracts across the region.
Southeast Asia offers an opening for crawler supply and service
Southeast Asia gives suppliers an opening because airport, rail and shipyard programs need heavy capacity that buyers often source from abroad. XCMG said on Aug. 17, 2026, that it delivered nearly 300 crawler cranes to the region, calling the batch the largest single crawler crane order in the region. The company also set a target of 70 certified pre-owned crawler sales for 2025, offering XGC85 and XGC55 units with an estimated five to seven years of remaining life. These two offers suit different buyers, since larger contractors want new capacity while smaller fleets seek lower entry prices. Suppliers that add parts, training and lift planning can therefore defend margins as the area grows at 7.97% a year.
Shipyard revival and refinery outages open steady service work
Shipyards and refineries offer an opportunity outside the construction cycle, because maintenance and steady output require recurring lifting capacity. HD Hyundai launched the 115,000-dwt Orion Jade at Subic Bay on July 29, 2026, and the yard plans up to 10 ships a year within three to five years, Maritime Executive reported. The Philippine maritime agency credited the project with more than 4,000 jobs, which points to a sustained workload around the yard. In India, Hydrocarbon Processing reported on May 7, 2026, that Reliance would shut some units at its 660,000-bpd refinery for three to four weeks. Fleets that hold standing contracts for such outages can smooth earnings between large capital projects.
Pricing, duties and labor limits test fleet returns
Low Chinese pricing squeezes builders in protected markets
Price competition is the sharpest risk for builders outside China, because import offers undercut local factories by a wide margin. Autocar Professional reported in December 2025 that Chinese cranes sold 30% to 40% below Indian rivals. Indian manufacturers argued that they had to suspend production as a result, according to Outlook Business. Non-Chinese suppliers therefore need differentiated service and heavier models, while buyers gain cheaper fleets that may later face lower resale values.
Unresolved trade remedies cloud Indian purchasing plans
Trade uncertainty complicates fleet planning in India, because a recommended duty has not yet become law. India's trade remedies directorate proposed duties of 24% to 52% on Sept. 19, 2025, covering Chinese crawlers up to 260 tons and truck cranes up to 160 tons. Outlook Business reported on Aug. 5, 2026 that the measure still awaited a customs notification. Buyers may delay orders or rush imports until the outcome becomes clear, which makes dealer forecasts less reliable.
Aging crews and overtime caps limit crane availability in Japan
Labor limits can idle cranes even when project budgets exist, particularly in Japan. Japan's land ministry counted 4.78 million construction workers in 2025 against 6.85 million in 1997, and 36.6% of them were 55 or older. Overtime caps of 45 hours a month have applied to construction since April 2024, according to KHL. Fleet owners therefore compete for fewer operators and riggers, and they increasingly favor machines with simpler setup and stronger safety controls.
Charging time slows electric fleet investment
Electric cranes demand more capital planning than diesel units because charging takes up working time. KHL reported about eight hours for a normal charge on the Tadano eGR-250N, which complicates double-shift work on remote sites. Quick charging helps only in part, since KHL also reported about 2.5 hours of charging for roughly five hours of crane work on that 25-ton model. Owners of remote-site fleets may therefore defer electric orders until charging improves.
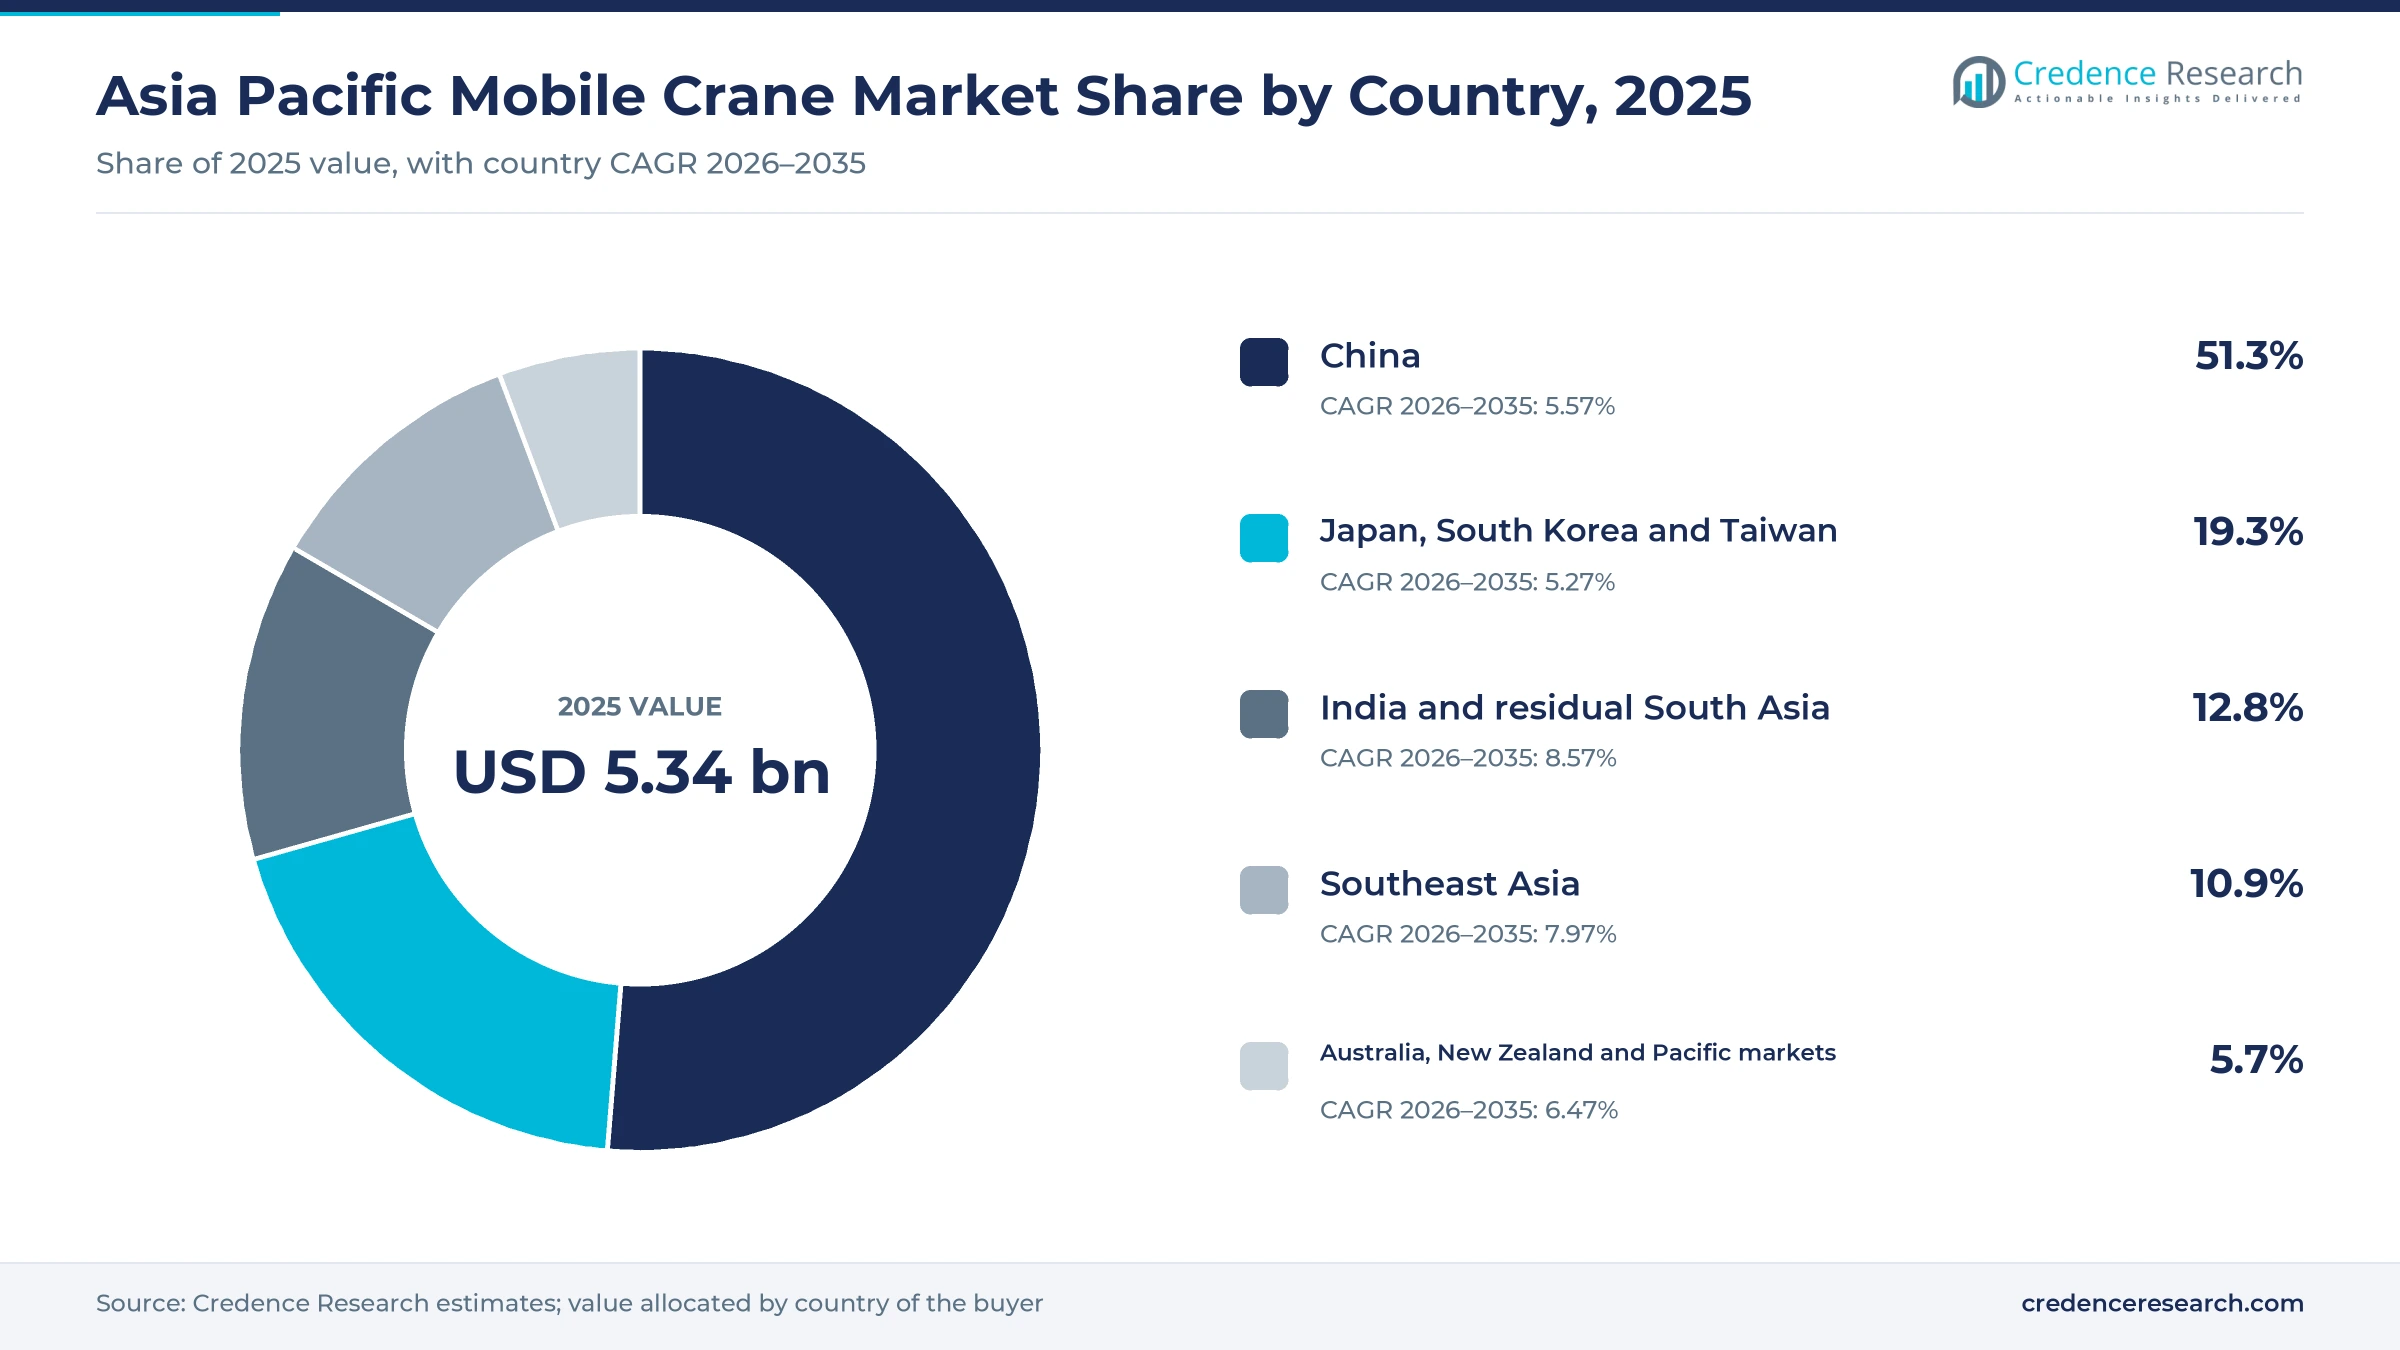
China sets the scale while India and South Asia grow fastest
| Country | Value, 2025 (USD billion) | Share, 2025 | CAGR, 2026–2035 |
|---|---|---|---|
| China | 2.74 | 51.3% | 5.57% |
| Japan, South Korea and Taiwan | 1.03 | 19.3% | 5.27% |
| India and residual South Asia | 0.68 | 12.8% | 8.57% |
| Southeast Asia | 0.58 | 10.9% | 7.97% |
| Australia, New Zealand and Pacific markets | 0.30 | 5.7% | 6.47% |
China sets regional volume and export pricing
China held 51.3% of 2025 value and grows at 5.57% a year, supported by domestic sales of 9,773 truck cranes and 960 crawler cranes between January and November 2025. Growth trails the region because the base is large and truck crane sales slipped 1.02% domestically over that period. Its wider construction machinery base also supplies scale, while energy projects worth more than 3.5 trillion yuan keep high-capacity units working across wind and grid sites.
Japan, South Korea and Taiwan buy for precision and urban work
Japan, South Korea and Taiwan held 19.3% of 2025 value and grow at 5.27% a year, the slowest pace in the region. Replacement buying dominates, and chip projects such as the Kumamoto and Hiroshima plants add demanding work for fleets. Tadano delivered its first production electric crane at home in 2024, although XCMG said its 1,000-ton model was the first Chinese-branded crane of that class used in South Korea. Workforce limits in Japan also favor machines with simpler setup.
India and residual South Asia add capacity fastest
India and residual South Asia held 12.8% of 2025 value and grow at 8.57% a year, the fastest rate among these areas. India added more than 6 GW of wind in 2025, and ACE claimed a share above 63% of mobile cranes, according to Autocar Professional. The ACE and Kato Works venture in Haryana targets high-capacity machines for Indian and international buyers. Pick-and-carry models such as the ACE NX 230 also remain important.
Southeast Asia draws crawler fleets to transport projects
Southeast Asia held 10.9% of 2025 value and grows at 7.97% a year, helped by large airport, rail and shipyard work. Long Thanh in Vietnam has already drawn crawlers of 800 tons and more, while the planned 1,541-kilometer high-speed railway could keep such machines busy for years. Subic Bay adds marine lifting in the Philippines, and XCMG reported nearly 300 crawler deliveries to the area in 2026. Chinese supply is therefore especially visible across this part of the region.
Australia, New Zealand and Pacific markets follow wind pipelines
Australia, New Zealand and Pacific markets held 5.7% of 2025 value and grow at 6.47% a year, led by Australian wind work. PV Tech reported on May 25, 2026, that Capacity Investment Scheme Tender 7 awarded 4.8 GW of wind, including the 1,498-MW Yanco Delta project. The Clean Energy Finance Corporation said the second stage of the 1,333-MW Golden Plains farm should reach full output in 2027. Dealers such as TRT, which has distributed Kobelco cranes in Oceania since 2020, support this fleet.
Dated deliveries and rulings that moved the market
| Development | Status and market relevance |
|---|---|
| In February 2026, Zoomlion reported shipping more than 1,500 construction cranes in a global batch that included a 4,000-ton all-terrain model. | Completed shipment; shows large-capacity supply reaching export markets, including Singapore |
| In March 2026, ACE and Kato Works announced a 50:50 venture to build truck, crawler and rough-terrain cranes in Haryana. | Operations expected in 2026; adds local heavy crane supply in India |
| In May 2026, XCMG said its 1,000-ton XCA1000G8-1K all-terrain crane completed a bridge lift at Pyeongtaek in South Korea. | In service; first Chinese-branded crane of its class used in South Korea, according to XCMG |
| In July 2026, Micron began its US$9.3 billion fab expansion in Hiroshima Prefecture, with commercial production expected in 2028. | Under construction; adds plant equipment and support lifting demand in Japan |
| In August 2026, XCMG reported delivering nearly 300 crawler cranes to Southeast Asia, including XGC110A and XLC450 models. | Delivered; company describes it as the largest single crawler order in the area |
Booms, batteries and controls change the lifting duty
- Long telescopic booms reduce assembly time, as the 102.5-meter eight-section boom on the XCA1000G8-1K can reach 100 meters without a separate lattice section.
- Wind boom systems combine a long main boom with a short wind boom, which allows the ZAT24000H to serve turbines reaching 160 meters.
- Battery packs bring zero-emission duty to confined sites, and the 226 kWh pack on the EVOLT eGR-250N supports about five hours of crane work.
- Stability and load controls lower the risk on pick-and-carry models, since the ACE F250 Ultra adds three safety systems for crane operation, load sensing and articulation stability.
Need a Custom Version of This Report?
Tailor the scope, geography, or segments to your exact requirements.
- Custom geography or segment scope
- Direct access to our analyst team
Chinese scale meets Japanese and European specialists
Competition divides between Chinese volume builders, Japanese and European specialists, and Indian producers defending a home market. XCMG and Zoomlion compete on tonnage, delivery scale and export reach, shown by the XCA4000, the 4,000-ton Zoomlion model and XCMG's large crawler order in Southeast Asia. Tadano and Liebherr compete on engineering and early electric models, including the EVOLT eGR-250N in Japan and a 160-ton battery crawler in Hong Kong. ACE holds a strong position in Indian cranes, and its Kato Works venture targets heavier machines. Rental groups also influence product plans, as the ACE agreement with Sanghvi Movers demonstrates. Buyers usually compare price, resale value, parts availability and lift engineering support, so service coverage increasingly decides contracts in markets where machine specifications look similar. Sany also competes in heavy lifting, and KHL reported that it handed over a 4,000-ton SAC40000T all-terrain crane built for wind work to a Chinese crane company in October 2024.
Companies profiled and their roles in this market
| Company | Type | Role in the market |
|---|---|---|
| XCMG | Chinese full-line builder | XCA4000 and XCA1000G8-1K all-terrain cranes, Southeast Asian crawler deliveries and certified pre-owned units |
| Zoomlion | Chinese full-line builder | ZAT24000H wind crane and a 4,000-ton all-terrain model shipped in 2026 |
| Tadano | Japanese specialist | EVOLT eGR-250N battery rough-terrain crane delivered to Taihei Dengyo in Japan |
| Liebherr | European specialist | 160-ton battery crawler deployed by Gammon Construction in Hong Kong |
| Action Construction Equipment | Indian builder | Pick-and-carry range and a Haryana heavy crane venture with Kato Works |
| Sanghvi Movers | Indian rental fleet | More than 450 cranes from 40 to 1,600 tons serving energy and industrial projects |
Where lifting value moves next in the region
Credence Research's view is that crane value will shift toward heavier machines faster than unit counts suggest. Truck cranes will keep the largest base, yet crawler and all-terrain models capture more of each added dollar because wind, rail and bridge lifts are getting larger. Chinese builders will likely stay the price setters across most export markets, so non-Chinese suppliers should concentrate on service, financing and specialist lifts. India deserves particular attention, because its pending duty decision could change sourcing decisions for several years. The battery segment grows quickly from a small base and depends on site charging.
How the market estimate was built
The report uses 2025 as the base year and 2035 as the forecast year, with market values from the Credence Research model. Segment and country splits are Credence Research estimates, informed by public unit data and project disclosures rather than any single dataset. Sources include industry association statistics, government and energy agency publications, company releases and named trade journals. No interviews or surveys were conducted for this edition of the report. Estimates of price per unit and fleet replacement are assumptions, so the country split and technology split carry the most uncertainty.
Energy and transport programs carry growth to 2035
Through 2035, the market should reach USD 9.83 billion as energy, transport and chip programs add larger lifts to the regular civil work served by truck cranes. India and residual South Asia and Southeast Asia will contribute a rising share of growth, while China remains the largest buyer and the main export base. Crawler and high-capacity all-terrain cranes should outpace smaller models, and battery units should spread first on urban, airport and plant sites. Fleet owners that secure operators, finance and charging access will be best placed to capture the larger lifts ahead.
Frequently Asked Questions
How big is the Asia Pacific mobile crane market?
Which area leads the market?
Which area grows fastest?
Which crane type holds the largest share?
Why are lattice-boom crawler cranes growing fastest?
How does wind power affect crane demand?
What is the status of Indian duties on Chinese cranes?
Who are the main companies in this market?
Table of Content
Chapter 1 Market Segmentation
- 1.1 Segmentation Framework
- 1.1.1 Product and Service Classification
- 1.1.2 Application and End-Use Classification
- 1.1.3 Technology and Solution Classification
- 1.1.4 Customer and Distribution Channel Classification
- 1.1.5 Geographic Segmentation
- 1.1.6 Market Segment Definitions and Boundaries
- 1.2 By Product Type
- 1.2.1 Truck-mounted cranes
- 1.2.2 All-terrain cranes
- 1.2.3 Lattice-boom crawler cranes
- 1.2.4 Rough-terrain cranes
- 1.2.5 Pick-and-carry cranes
- 1.3 By End-Use Industry
- 1.3.1 Civil infrastructure and buildings
- 1.3.2 Power and utilities
- 1.3.3 Mining and hydrocarbons
- 1.3.4 Manufacturing and semiconductor facilities
- 1.3.5 Ports and shipbuilding
- 1.4 By Customer Type
- 1.4.1 Crane rental fleet owners
- 1.4.2 Construction and EPC contractors
- 1.4.3 Industrial asset owners
- 1.4.4 Public infrastructure agencies
- 1.5 By Technology
- 1.5.1 Diesel-only cranes
- 1.5.2 Hybrid and plug-in lifting cranes
- 1.5.3 Battery-electric cranes
- 1.6 By Country
- 1.6.1 China
- 1.6.2 Japan, South Korea and Taiwan
- 1.6.3 India and residual South Asia
- 1.6.4 Southeast Asia
- 1.6.5 Australia, New Zealand and Pacific markets
Chapter 2 Introduction
- 2.1 Report Objectives and Scope
- 2.2 Product Definition and Industry Terminology
- 2.3 Market Inclusions and Exclusions
- 2.4 Research Process
- 2.4.1 Primary Research and Expert Interviews
- 2.4.2 Secondary Research and Source Review
- 2.4.3 Top-Down and Bottom-Up Estimation
- 2.4.4 Data Triangulation and Verification
- 2.5 Market Size Measurement Basis
- 2.5.1 2025: USD 5.34 billion → 2035: USD 9.83 billion
- 2.6 Historical and Forecast Reference Periods
- 2.6.1 Historical Period: 2018-2025
- 2.6.2 Base Year: 2025
- 2.6.3 Forecast Period: 2025-2035
- 2.7 Research Assumptions and Limitations
Chapter 3 Executive Summary
- 3.1 Market Snapshot and Key Findings
- 3.2 Base-Year Market Size, 2025
- 3.3 Forecast Market Size, 2035
- 3.4 Revenue and Volume Growth Outlook
- 3.5 Key Demand and Supply Indicators
- 3.6 Leading Market Segments
- 3.7 Fastest-Growing Market Opportunities
- 3.8 Regional Performance Highlights
- 3.9 Technology and Industry Transformation
- 3.10 Competitive Landscape Summary
- 3.11 Analyst View and Strategic Implications
Chapter 4 Asia Pacific Mobile Crane Market Trends and Developments
- 4.1 Historical Industry Development, 2018-2025
- 4.2 Recent Market Trends and Developments
- 4.3 Demand and Customer Behavior Trends
- 4.4 Technology and Product Innovation
- 4.5 Artificial Intelligence, Automation and Digitalization
- 4.6 Local Manufacturing and Supply Chain Realignment
- 4.7 Industry Partnerships, Mergers and Acquisitions
- 4.8 Sustainability and Circular Economy Developments
- 4.9 Government and Private Sector Investment Trends
- 4.10 Emerging Business Models and Commercialization
- 4.11 Industry Developments and Announcements
Chapter 5 Asia Pacific Mobile Crane Market Production, Supply and Demand Analysis
- 5.1 Demand Trend and Consumption Analysis, 2018-2025
- 5.2 Demand Forecast, 2025-2035
- 5.3 Production and Output Trend, 2018-2025
- 5.4 Production and Output Forecast, 2025-2035
- 5.5 Installed Capacity and Capacity Utilization
- 5.6 Company-Wise Production Plants and Statistics
- 5.6.1 Installed Production Capacity
- 5.6.2 Actual Production
- 5.6.3 Planned Capacity and Expansion Targets
- 5.7 Supply Chain Structure and Procurement Trends
- 5.8 Supply-Demand Gap and Bottlenecks
- 5.9 Import Dependence and Sourcing Structure
- 5.10 Contract Manufacturing and Outsourcing
- 5.11 Regional Supply and Demand Concentration
Chapter 6 Asia Pacific Mobile Crane Market Pricing Analysis
- 6.1 Pricing Structure and Measurement
- 6.2 Historical Pricing Trends, 2018-2025
- 6.3 Pricing Outlook, 2025-2035
- 6.4 Average Selling Price and Unit Economics
- 6.5 Pricing by Product and Market Segment
- 6.6 Geographic Pricing Differences
- 6.7 Key Input, Energy, Labor and Logistics Costs
- 6.8 Contract Pricing and Purchasing Models
- 6.9 Pricing Sensitivity and Competitive Positioning
- 6.10 Price, Margin and Profitability Implications
Chapter 7 Asia Pacific Mobile Crane Market Dynamics
- 7.1 Market Growth Drivers
- 7.1.1 Demand-Side Drivers
- 7.1.2 Technology and Innovation Drivers
- 7.1.3 Infrastructure and Investment Drivers
- 7.1.4 Regulatory and Policy Drivers
- 7.2 Market Restraints
- 7.2.1 Cost and Affordability Constraints
- 7.2.2 Technology and Adoption Barriers
- 7.2.3 Supply Chain and Operational Constraints
- 7.3 Market Challenges
- 7.3.1 Competitive Pressure and Margin Erosion
- 7.3.2 Skills, Infrastructure and Implementation Gaps
- 7.4 Emerging Market Opportunities
- 7.5 Market Dynamics Impact and Time-Horizon Assessment
Chapter 8 Asia Pacific Mobile Crane Value Chain Analysis
- 8.1 Industry Value Chain Overview
- 8.2 Upstream Suppliers and Critical Inputs
- 8.3 Technology and Component Providers
- 8.4 Manufacturing or Service Delivery
- 8.5 Distribution, Channel Partners and Integrators
- 8.6 Downstream Applications and End Users
- 8.7 Value Addition and Profit Pools
- 8.8 Vertical Integration and Outsourcing
- 8.9 Supplier Concentration and Risk
- 8.10 Supply Chain Localization and Resilience
Chapter 9 Asia Pacific Mobile Crane Market Regulations and Policies
- 9.1 Relevant Laws, Standards and Compliance Frameworks
- 9.2 Product, Service, Safety and Quality Requirements
- 9.3 Government Policies, Incentives and Subsidies
- 9.4 Imports, Exports and Trade Barriers
- 9.5 Public Procurement and Local Content Requirements
- 9.6 Environmental and Sustainability Compliance
- 9.7 Upcoming Policy Changes and Market Implications
Chapter 10 Asia Pacific Mobile Crane Market Hotspots and Opportunities
- 10.1 Market Opportunity Mapping and Growth Hotspots
- 10.2 High-Growth Applications and Customer Groups
- 10.3 Underserved Markets and White-Space Opportunities
- 10.4 Emerging Technology and Product Opportunities
- 10.5 New Capacity and Investment Hotspots
- 10.6 Market Entry and Expansion Opportunities
- 10.7 Distribution and Partnership Opportunities
- 10.8 Near-Term and Long-Term Commercial Potential
- 10.9 Opportunity Attractiveness and Execution Risks
Chapter 11 Asia Pacific Mobile Crane Market Outlook, 2025-2035
- 11.1 Market Size and Analysis
- 11.1.1 Revenue (Market Measurement: 2025: USD 5.34 billion → 2035: USD 9.83 billion)
- 11.1.2 Market Volume and Quantity Sold
- 11.1.3 Historical Market Size, 2018-2025
- 11.1.4 Base-Year Market Size, 2025
- 11.2 Market Forecast, 2025-2035
- 11.2.1 Revenue Forecast to 2035
- 11.2.2 Volume Forecast to 2035
- 11.2.3 CAGR and Year-on-Year Growth
- 11.2.4 Incremental Revenue Opportunity
- 11.3 Forecast Assumptions and Scenario Analysis
- 11.3.1 Base-Case Forecast
- 11.3.2 Optimistic and Conservative Scenarios
- 11.3.3 Technology, Pricing and Policy Sensitivities
- 11.4 Market Attractiveness and Growth Outlook
Chapter 12 Asia Pacific Mobile Crane Market Segmentation and Outlook
- 12.1 Segmentation Summary and Market Shares, 2025
- 12.2 Largest and Fastest-Growing Segments
- 12.3 By Product Type - Market Size and Forecast, 2025-2035
- 12.3.1 Segment Definition and Scope
- 12.3.2 Historical Market Size, 2018-2025
- 12.3.3 Revenue Forecast, 2025-2035
- 12.3.4 Volume Forecast, 2025-2035
- 12.3.5 Base-Year Market Share, 2025
- 12.3.6 Segment CAGR and Growth Drivers
- 12.3.7 Subsegment Market Size and Forecast
- 12.3.7.1 Truck-mounted cranes
- 12.3.7.2 All-terrain cranes
- 12.3.7.3 Lattice-boom crawler cranes
- 12.3.7.4 Rough-terrain cranes
- 12.3.7.5 Pick-and-carry cranes
- 12.3.8 Subsegment Pricing and Adoption Trends
- 12.3.9 Leading Suppliers and Competition
- 12.3.10 Regional Demand and Opportunities
- 12.4 By End-Use Industry - Market Size and Forecast, 2025-2035
- 12.4.1 Segment Definition and Scope
- 12.4.2 Historical Market Size, 2018-2025
- 12.4.3 Revenue Forecast, 2025-2035
- 12.4.4 Volume Forecast, 2025-2035
- 12.4.5 Base-Year Market Share, 2025
- 12.4.6 Segment CAGR and Growth Drivers
- 12.4.7 Subsegment Market Size and Forecast
- 12.4.7.1 Civil infrastructure and buildings
- 12.4.7.2 Power and utilities
- 12.4.7.3 Mining and hydrocarbons
- 12.4.7.4 Manufacturing and semiconductor facilities
- 12.4.7.5 Ports and shipbuilding
- 12.4.8 Subsegment Pricing and Adoption Trends
- 12.4.9 Leading Suppliers and Competition
- 12.4.10 Regional Demand and Opportunities
- 12.5 By Customer Type - Market Size and Forecast, 2025-2035
- 12.5.1 Segment Definition and Scope
- 12.5.2 Historical Market Size, 2018-2025
- 12.5.3 Revenue Forecast, 2025-2035
- 12.5.4 Volume Forecast, 2025-2035
- 12.5.5 Base-Year Market Share, 2025
- 12.5.6 Segment CAGR and Growth Drivers
- 12.5.7 Subsegment Market Size and Forecast
- 12.5.7.1 Crane rental fleet owners
- 12.5.7.2 Construction and EPC contractors
- 12.5.7.3 Industrial asset owners
- 12.5.7.4 Public infrastructure agencies
- 12.5.8 Subsegment Pricing and Adoption Trends
- 12.5.9 Leading Suppliers and Competition
- 12.5.10 Regional Demand and Opportunities
- 12.6 By Technology - Market Size and Forecast, 2025-2035
- 12.6.1 Segment Definition and Scope
- 12.6.2 Historical Market Size, 2018-2025
- 12.6.3 Revenue Forecast, 2025-2035
- 12.6.4 Volume Forecast, 2025-2035
- 12.6.5 Base-Year Market Share, 2025
- 12.6.6 Segment CAGR and Growth Drivers
- 12.6.7 Subsegment Market Size and Forecast
- 12.6.7.1 Diesel-only cranes
- 12.6.7.2 Hybrid and plug-in lifting cranes
- 12.6.7.3 Battery-electric cranes
- 12.6.8 Subsegment Pricing and Adoption Trends
- 12.6.9 Leading Suppliers and Competition
- 12.6.10 Regional Demand and Opportunities
- 12.7 By Country - Market Size and Forecast, 2025-2035
- 12.7.1 Segment Definition and Scope
- 12.7.2 Historical Market Size, 2018-2025
- 12.7.3 Revenue Forecast, 2025-2035
- 12.7.4 Volume Forecast, 2025-2035
- 12.7.5 Base-Year Market Share, 2025
- 12.7.6 Segment CAGR and Growth Drivers
- 12.7.7 Subsegment Market Size and Forecast
- 12.7.7.1 China
- 12.7.7.2 Japan, South Korea and Taiwan
- 12.7.7.3 India and residual South Asia
- 12.7.7.4 Southeast Asia
- 12.7.7.5 Australia, New Zealand and Pacific markets
- 12.7.8 Subsegment Pricing and Adoption Trends
- 12.7.9 Leading Suppliers and Competition
- 12.7.10 Regional Demand and Opportunities
- 12.8 Segment Growth Comparison
- 12.9 Segment Attractiveness and Priority Matrix
Chapter 13 Asia Pacific Mobile Crane End-Use and Application Market Outlook
- 13.1 End-Use Industry and Customer Demand Structure
- 13.2 Leading Applications and Customer Groups
- 13.3 End-Use Market Size, Share and Forecast
- 13.4 Major End-Use Industry Deep Dives
- 13.4.1 Customer Requirements and Use Cases
- 13.4.2 Demand and Replacement Cycles
- 13.4.3 Technical and Regulatory Considerations
- 13.4.4 Purchasing and Procurement Models
- 13.4.5 Leading Vendors and Distribution Channels
- 13.4.6 Forecast and Commercial Opportunities
- 13.5 Emerging Applications and Cross-Segment Demand
- 13.6 End-Use Industry Investment Priorities
Chapter 14 Asia Pacific Mobile Crane Geographic Market Outlook, 2025-2035
- 14.1 Regional Market Size and Country-Level Shares, 2025
- 14.2 Country Market Size Comparison, 2025
- 14.3 Country Market Forecasts, 2025-2035
- 14.4 Subregional Industrial and Demand Clusters
- 14.5 Intra-Regional Pricing and Cost Differences
- 14.6 Cross-Border Trade and Supply Networks
- 14.7 Regional Supply and Demand Balances
- 14.8 Country Opportunity Comparison and Prioritization
Note: Every listed country is covered on the structure shown under the first country.
Chapter 15 Asia Pacific Mobile Crane Technology, Innovation and Sustainability Outlook
- 15.1 Technology Landscape and Maturity
- 15.2 Product, Process and Service Innovation
- 15.3 AI, Automation and Digital Tools in the Industry
- 15.4 Technology Adoption and Performance Benchmarking
- 15.5 Innovation Pipeline and R&D Investment
- 15.6 Patent and Intellectual Property Trends
- 15.7 Energy Efficiency and Resource Management
- 15.8 Sustainability, Recycling and Circularity
- 15.9 Technology Roadmap, 2025-2035
- 15.10 Risks of Obsolescence and Technology Substitution
Chapter 16 Asia Pacific Mobile Crane Market Key Strategic Imperatives
- 16.1 Growth and Market Entry Priorities
- 16.2 High-Return Products and Segments
- 16.3 Pricing, Profitability and Cost Optimization
- 16.4 Technology Investment and Product Differentiation
- 16.5 Supply Chain Localization and Resilience
- 16.6 Distribution and Customer Acquisition
- 16.7 Partnership, Acquisition and Capacity Strategy
- 16.8 Regional Expansion Priorities
- 16.9 Short-, Medium- and Long-Term Actions
Chapter 17 Competition Outlook
- 17.1 Industry Competition Characteristics
- 17.2 Market Structure and Concentration
- 17.3 Market Share and Competitive Positioning, 2025
- 17.4 Company-Wise Revenue and Product Benchmarking
- 17.5 Production and Service Capacity Benchmarking
- 17.6 Technology, Pricing and Differentiation
- 17.7 Regional Footprint and Distribution Strength
- 17.8 Mergers, Acquisitions and Strategic Alliances
- 17.9 New Entrants and Competitive Threats
- 17.10 Porter's Five Forces and Industry Attractiveness
- 17.11 Competitive Outlook, 2025-2035
Chapter 18 Company Profiles
- 18.1 Company Coverage and Selection Criteria
- 18.2 XCMG
- 18.2.1 Business Description
- 18.2.2 Company Ownership and Geographic Presence
- 18.2.3 Product and Service Portfolio
- 18.2.4 Manufacturing and Operating Footprint
- 18.2.5 Production Capacity and Expansion Plans
- 18.2.6 Financial Performance and Investment
- 18.2.7 Market Share and Competitive Position
- 18.2.8 Technology and Innovation Capabilities
- 18.2.9 Strategic Alliances or Partnerships
- 18.2.10 Recent Developments
- 18.2.11 Growth Strategy and Outlook
- 18.3 Zoomlion
- 18.4 Sany Group
- 18.5 Tadano
- 18.6 Liebherr
- 18.7 Action Construction Equipment
- 18.8 Other Relevant Market Participants
Note: Every listed company is profiled on the structure shown under the first company. The company list is preliminary and may change based on research findings, market developments, data availability and client requirements.
Chapter 19 Disclaimer
- 19.1 Research and Forecast Disclaimer
- 19.2 Data Source and Estimation Limitations
Note: The depth of individual sections depends on data availability for this market. Volume, capacity, trade and other unit-based metrics are included where applicable.

