
State bans push U.S. bait buyers toward new actives
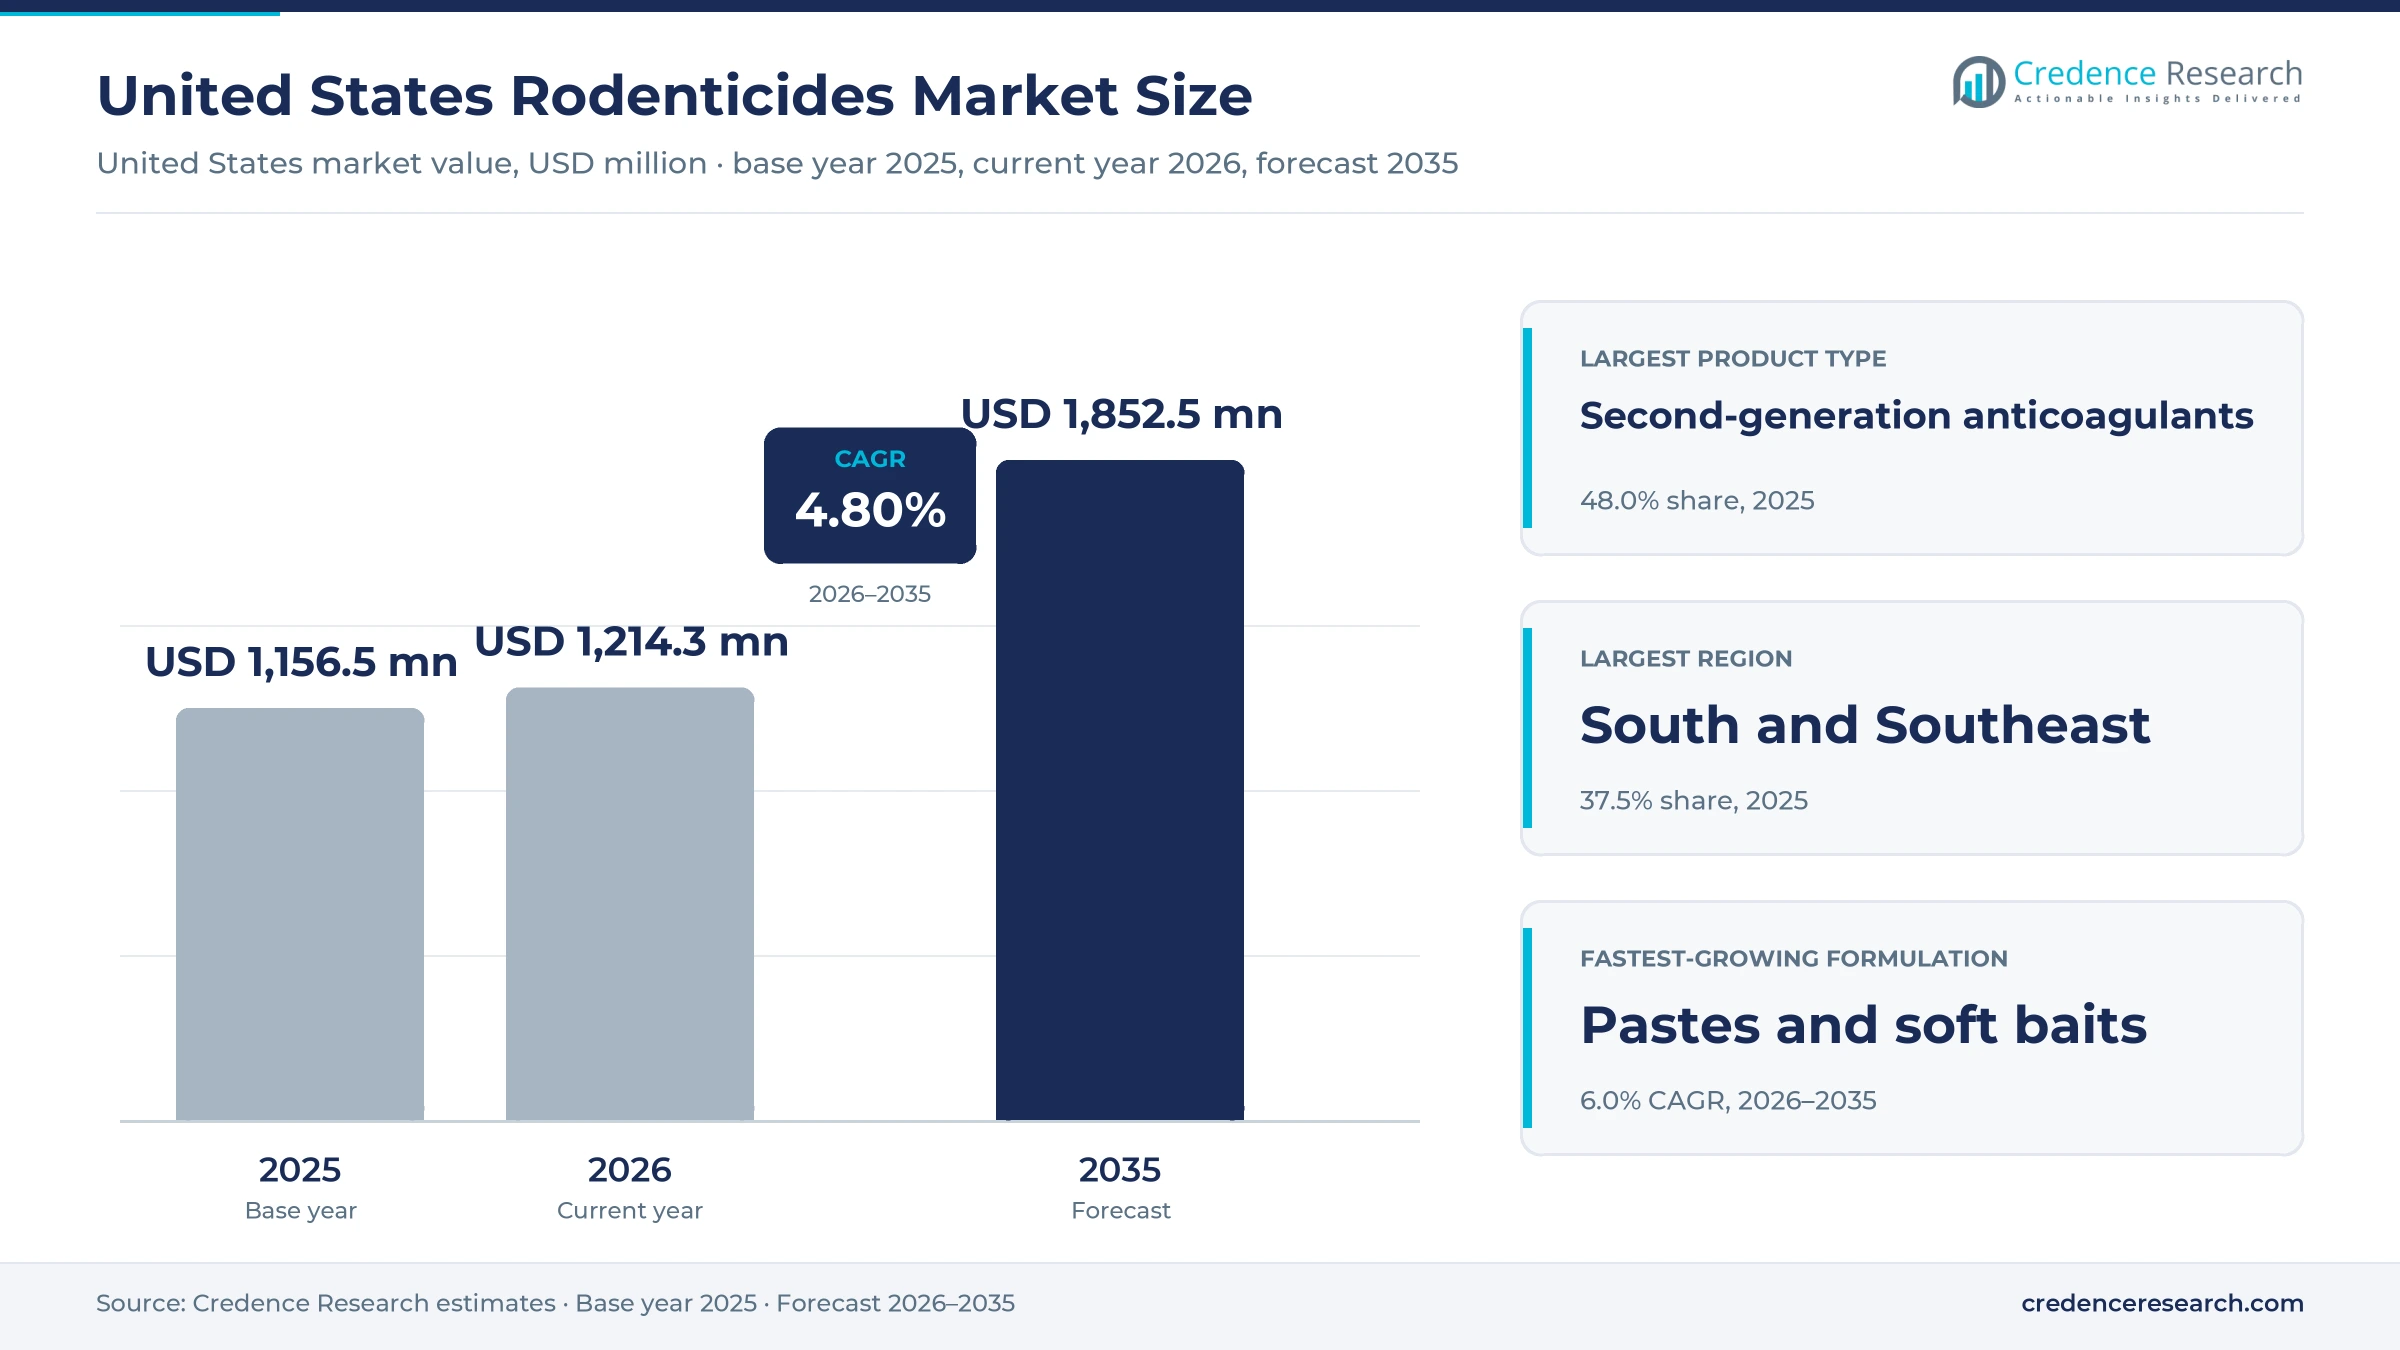
The United States rodenticides market was valued at USD 1.16 billion in 2025 and is projected to increase from USD 1.21 billion in 2026 to USD 1.85 billion by 2035, registering a CAGR of 4.80% during 2026–2035. Demand comes from pest control operators servicing food plants, warehouses and homes, from farms protecting stored grain and livestock housing, and from households buying ready-to-use stations at retail. The South and Southeast held the largest regional share, 37.5% in 2025, and it is also the fastest-growing region at 5.1% a year as population and new commercial sites keep shifting toward the region. Second-generation anticoagulants still carry the largest share of spending, but state restrictions are moving buyers toward first-generation and non-anticoagulant actives such as bromethalin and cholecalciferol. The EPA released its final rodenticide biological evaluation in November 2024, which ties future label limits to areas where listed species are found.
Professional, farm and retail baits make up the market
The market counts spending by pest control operators, farms, households, food and industrial facilities and public agencies on registered rodenticide baits sold as blocks, pellets, soft baits, powders and liquids. Buyers purchase through professional pest control distributors, farm and ranch supply dealers, home improvement and grocery retailers, online stores and direct manufacturer contracts.
Snap traps, glue boards, electronic traps and the service fees charged by pest control companies are outside the scope, although bait stations sold prefilled with bait are included. The value chain runs from active ingredient producers through bait formulators and brand owners to distributors, applicators and end users.
United States Rodenticides Market Insights
- The United States rodenticides market grows from USD 1.16 billion in 2025 to USD 1.85 billion by 2035 at a 4.80% CAGR as buyers trade up to higher-priced non-anticoagulant baits.
- The South and Southeast held the largest regional share at 37.5% in 2025 and grows fastest, helped by population growth of 6.0% since 2020.
- Second-generation anticoagulants led product types with 48.0% in 2025, while non-anticoagulants grow fastest at 6.3% a year to 2035.
- California Governor Gavin Newsom signed AB 2552 on Sept. 25, 2024, extending the state moratorium to first-generation anticoagulants outside agriculture and public health uses.
- Syngenta gave Neogen exclusive U.S. and Canadian rights to its Talon brodifacoum baits in May 2025, a sign that brand owners are consolidating anticoagulant lines.
Second-generation baits lead as non-anticoagulants gain
Second-generation baits lead while non-anticoagulants grow fastest
Based on product type, the market is categorized into first-generation anticoagulants, second-generation anticoagulants and non-anticoagulants. Second-generation anticoagulants led with 48.0% of 2025 value because single-feed actives such as brodifacoum and bromadiolone remain the professional standard for heavy rat pressure at commercial sites. Non-anticoagulants grow fastest at 6.3% a year as suppliers add actives that state rules do not cover, and Bell Laboratories launched CADET, a cholecalciferol block bait, in 2024. BASF sells Selontra as a 0.08% cholecalciferol bait, giving operators a second vitamin D3 option where anticoagulants face limits.
Interior control leads as perimeter baiting grows fastest
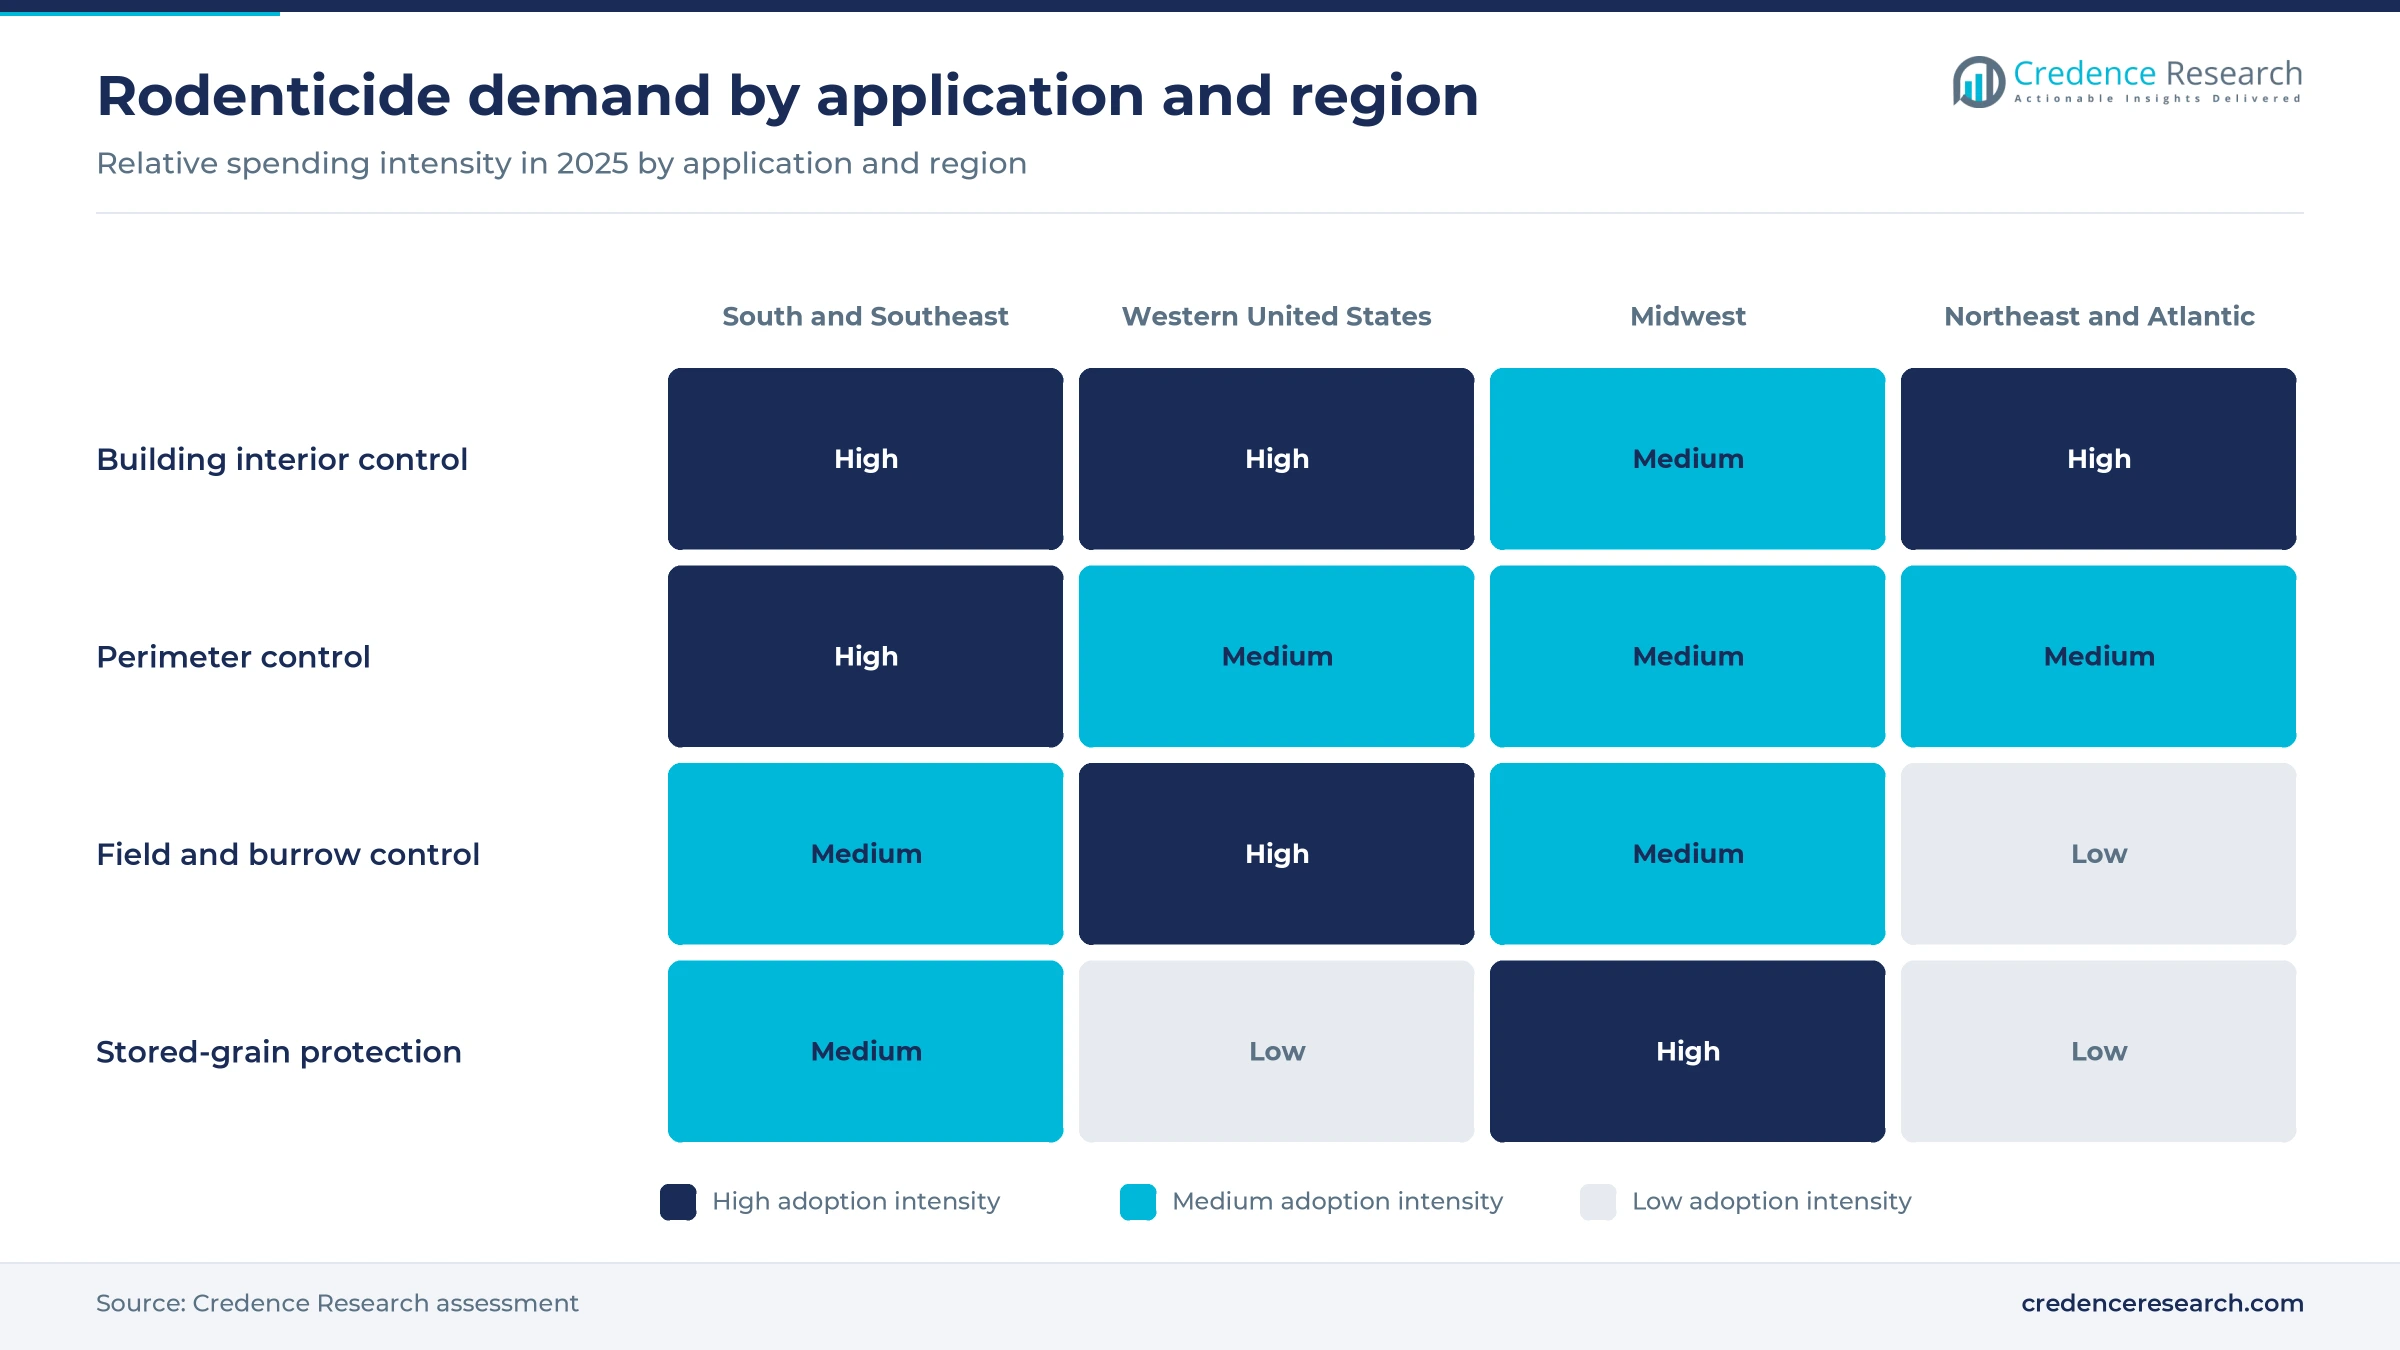
Based on application, the market is categorized into building interior control, perimeter control, field and burrow control, and stored-grain protection. Building interior control led with 38.0% of 2025 value because food plants, warehouses, apartment buildings and stores need year-round baiting inside the structure. Perimeter control grows fastest at 5.4% a year as exterior bait stations form the first barrier around regulated sites, and the EPA revised its proposed five-foot limit on station placement in its November 2024 evaluation, with exemptions for food processing plants, according to PCT. That change keeps the exterior ring of stations open to most commercial accounts.
Pest control operators lead and grow fastest
Based on customer type, the market is categorized into pest control operators, agricultural buyers, household buyers and direct facility and public-sector buyers. Pest control operators led with 46.0% of 2025 value because commercial accounts contract out baiting, and U.S. structural pest control service revenue reached $13.4 billion in 2025, according to NPMA. Pest control operators also grow fastest at 5.2% a year as South Carolina limited second-generation sales to certified applicators from Feb. 1, 2025, according to Clemson University, moving stronger baits out of household hands.
Bait blocks lead while soft baits grow fastest
Based on formulation, the market is categorized into bait blocks, pellets, pastes and soft baits, and powders and liquid baits. Bait blocks led with 52.0% of 2025 value because blocks fit locked stations and resist moisture, and Bell packs its Contrac All-Weather Blox as about 288 one-ounce blocks in an 18-pound pail. Pastes and soft baits grow fastest at 6.0% a year as bait makers chase acceptance where food competes with the bait, and PelGar sells a Brigand soft bait made with lard and flour while Liphatech lists FirstStrike Soft Bait among its nine rodent baits.
| Segment Group | Leading Sub-segment | Share, 2025 | Fastest-growing Sub-segment | CAGR, 2026–2035 |
|---|---|---|---|---|
| By Product Type | Second-generation anticoagulants | 48.0% | Non-anticoagulants | 6.3% |
| By Application | Building interior control | 38.0% | Perimeter control | 5.4% |
| By Customer Type | Pest control operators | 46.0% | Pest control operators | 5.2% |
| By Formulation | Bait blocks | 52.0% | Pastes and soft baits | 6.0% |
Vitamin D3 and natural baits cost twice as much per pound
U.S. rodenticide pricing runs in three tiers that track the active ingredient and the buyer. Economy anticoagulant blocks and disposable stations sell at retail for a few dollars, standard professional blocks sell by the pail through distributors, and premium non-anticoagulant or natural baits carry the highest price per pound. Selontra lists at $97.99 for 8 pounds, about $12.25 a pound, against roughly $6.45 a pound for an 18-pound pail of Contrac blocks. Active ingredient cost, registration expense and state restrictions move these gaps, so each shift away from anticoagulants raises average spending per baited site even when bait volume stays flat.
| Product and pack | Typical price or fee | Basis |
|---|---|---|
| Tomcat refillable mouse station with 8 bromethalin refills | USD 7.44 a pack | Walmart lists, November 2026 |
| RatX throw packs, 12 oz box of 6 | USD 24.99 | Tractor Supply lists, November 2026 |
| Selontra cholecalciferol bait, 8 lb pail | USD 97.99 | Home and Garden Supply lists, November 2026 |
| Contrac All-Weather Blox bromadiolone, 18 lb pail | USD 116.09 | Pest Management Supply lists, November 2026 |
| Zinc phosphide oats, 50 lb unit | USD 90 government, USD 100 others | South Dakota DANR price list, June 2026 |
Request a Free Sample
Fill in your details and we'll send you a free sample report.
- Sample data tables & charts
- Research methodology
Farm biosecurity, food audits and new baits lift demand
Grain storage and farm biosecurity keep bait in steady use
Farms and elevators bait year-round because rodents eat and foul stored crops and carry disease into livestock housing. Old crop corn stocks totaled 1.53 billion bushels on Sept. 1, 2025, with 888 million bushels held off farm, according to USDA NASS. All wheat stored in all positions reached 2.12 billion bushels on the same date, up 6% on the year, so commercial bins hold more grain that needs protection. South Dakota sells zinc phosphide oats in 50-pound units to landowners for prairie dog control, showing how states supply field baits directly. The Midwest, which held 19.5% of 2025 value, carries much of the bin storage, and owners of grain silos and storage systems buy bulk pails and pellets through dealers.
Food-facility audits make rodent failures costly
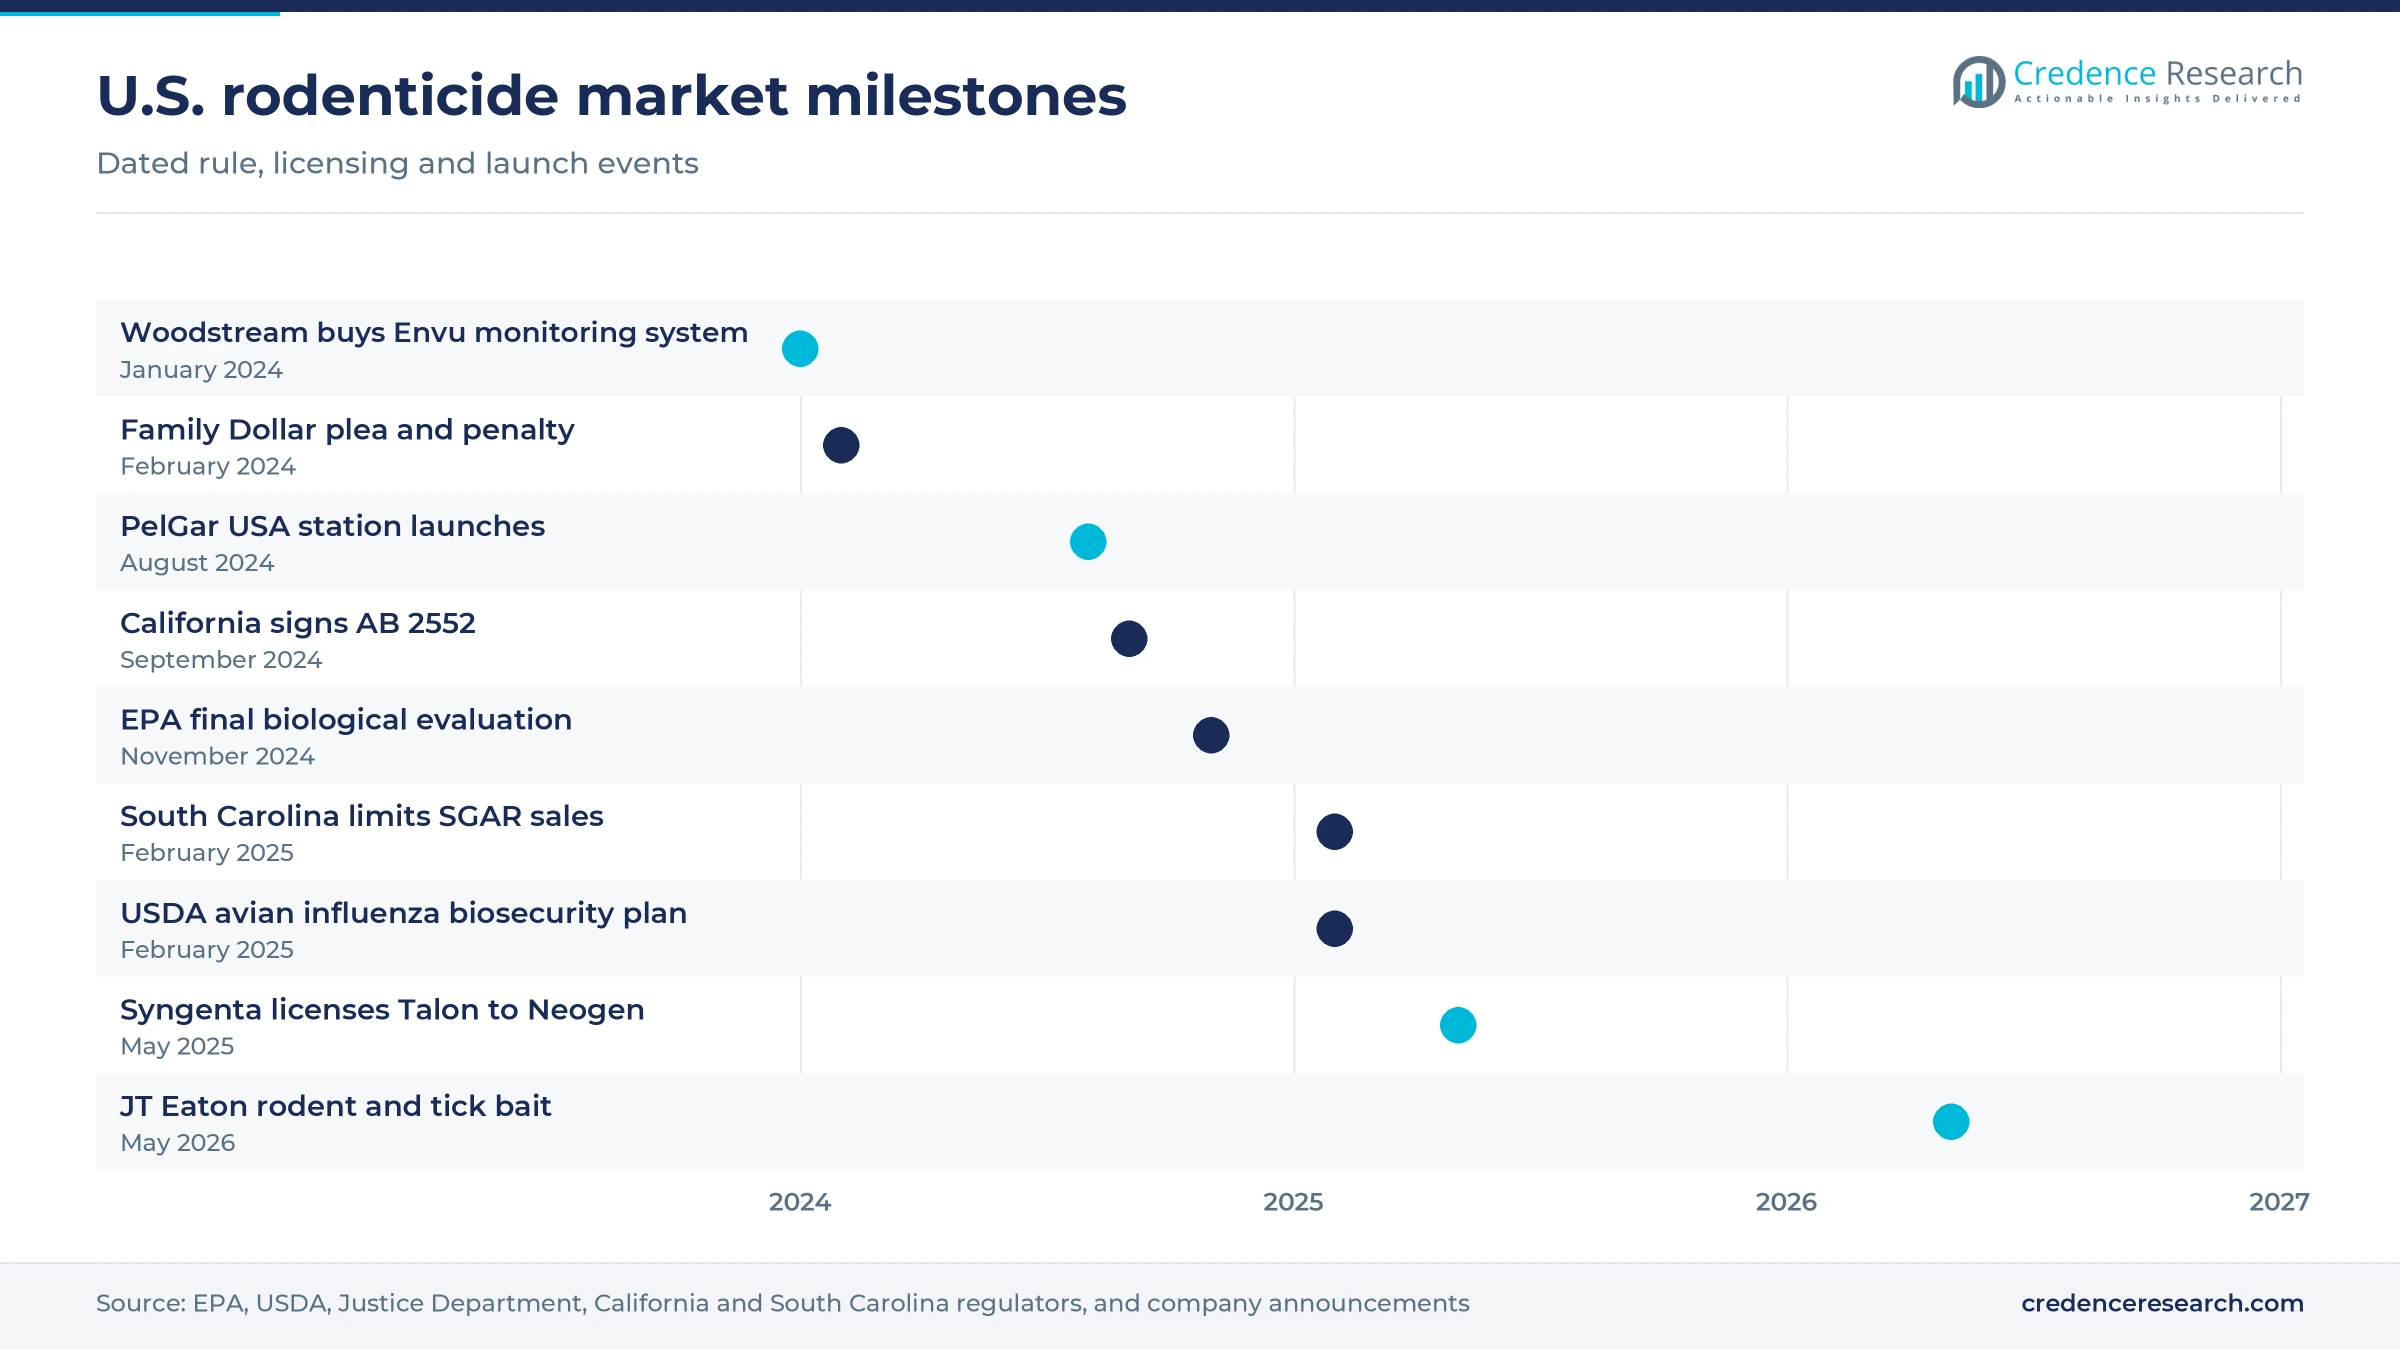
Food and consumer goods facilities treat rodent control as a compliance cost because failures now carry criminal penalties. Family Dollar pleaded guilty and agreed to pay $41.675 million on Feb. 26, 2024, after fumigation of its West Memphis, Arkansas distribution center reportedly killed 1,270 rodents. The recall covered 404 stores supplied from that warehouse, according to the Justice Department. NPMA reported that commercial pest control service revenue grew nearly 7.0% in 2025, faster than the industry total. Building interior control led applications with a 38.0% share of 2025 value, and food plants and distribution centers are its most intensive users. Auditors expect documented station checks, so these accounts rarely cut bait budgets.
New formulations and licensing widen professional portfolios
Bait makers are adding actives, licenses and adjacent lines so that operators can buy a full program from one supplier. Syngenta and Neogen signed a licensing and supply agreement on May 19, 2025 that gives Neogen exclusive U.S. and Canadian rights to Talon-G and Talon Weatherblok XT. Liphatech pairs its rodent baits with 4 Aegis bait stations, so operators can buy bait and housing from one supplier on a single account. PelGar USA introduced its Vanguard Heavy weighted station and Alert tunnel station in August 2024. Non-anticoagulants, the fastest-growing product type at 6.3% a year, gain most as these launches widen choice. Operators gain fewer supplier accounts to manage, while bait makers gain larger orders per customer.
Urban rat pressure keeps metro baiting contracts busy
Large U.S. metros generate the most repeat rodent work, and professional baiting contracts there recur month after month. Orkin's 2025 ranking, released in October 2025, put Los Angeles first for the first time, displacing Chicago, with New York third. Orkin pointed to year-round warm weather and dense neighborhoods in Los Angeles and to Chicago's alleys as shelter for rats. NPMA counted about 13.29 million residential pest control customers in 2025, and recurring contracts made up 85.4% of residential service revenue, up from 85.2% in 2024. Recurring service visits refill stations on a schedule, so bait volumes stay steady through the year even when sightings dip.
Connected stations and anticoagulant limits reshape baiting
Connected bait stations shift baiting toward monitoring
Operators are adding sensors to stations and traps so they can bait where activity is recorded instead of on fixed routes. Bell Laboratories offers an iQ line of 6 bait stations and traps that use Bluetooth and sensors to send rodent data to technicians, according to Pest Management Professional in September 2024. Woodstream bought Envu's Rodent Monitoring System, a wireless network of sensor devices and software, in January 2024, after two years of collaboration between the companies. PelGar USA paired its new stations with Roban Gold Entrap monitoring gels in four flavors in August 2024. Monitoring reduces wasted bait at quiet sites but raises spending at hot spots, so value holds up even as volume per account falls.
Anticoagulant limits shift buyers toward alternative actives
State rules are shifting U.S. buyers from anticoagulants toward bromethalin and cholecalciferol baits. California Governor Gavin Newsom signed AB 2552 on Sept. 25, 2024, adding chlorophacinone and warfarin to the state moratorium, according to the Center for Biological Diversity. The law exempts agriculture, food storage, water infrastructure and public health uses. Bell Laboratories has introduced Contrac California Bromethalin Soft Bait in 8-gram sachets for that market. Clemson University reported in November 2025 that the EPA plans an amended proposed interim decision and a final interim decision on rodenticides in 2026, so other states may follow.
Farm biosecurity funding opens a livestock opening
Livestock biosecurity is an opening for bait suppliers because rodent exclusion is part of keeping disease out of animal housing. USDA announced a plan of up to $1 billion on Feb. 26, 2025 to fight avian influenza, including up to 75% of the cost of fixing the highest-risk biosecurity gaps found by assessments. USDA APHIS has listed rodents or small wild birds inside poultry houses among possible spread routes, according to PCT. Central Garden & Pet sells Rodentex through its Farnam equine line, giving it a channel into barns and stables. Suppliers that pair baits with station audits can win multi-site farm contracts.
Non-toxic and dual-purpose baits open sensitive-site sales
Sites near children, pets or wildlife are an opening for baits that avoid anticoagulants altogether or do two jobs. EcoClear Products sells RatX, which Tractor Supply describes as containing only corn gluten meal and sodium chloride. JT Eaton launched a Bait Block for Rodents and Ticks in May 2026 that combines 0.025% warfarin with 0.005% fipronil to target black-legged ticks on rodents. The Western United States held 25.0% of 2025 value, and California rules there make such products easier to place in parks and homes. Suppliers that register these baits widely can charge premium prices.
Rule patchworks, sanitation gains and costlier actives weigh
Federal species measures add label uncertainty
Federal endangered species reviews leave registrants unsure which labels will change and where. The EPA final biological evaluation of Nov. 22, 2024 found 1% to 8% of listed species likely to be adversely affected by the 11 rodenticides reviewed. Measures will be applied through label language or the EPA online bulletin system in mapped areas only. Registrants and distributors face the risk of holding inventory for several label versions, and that burden adds cost and slows launches.
Sanitation programs cut rat sightings and bait needs
City sanitation programs are lowering rodent activity, which can shrink bait use on municipal and residential accounts. New York City said on Dec. 1, 2025 that rat sightings reported to 311 had fallen for 12 straight months, an overall decline of more than 20%, after containerization rules took effect in November 2024. November 2025 sightings fell to 931 from 1,537 a year earlier. Suppliers serving dense cities must shift toward monitoring and exclusion services to hold revenue.
Alternative actives cost more per pound
Moving away from anticoagulants raises bait costs for operators, which some cannot pass on to fixed-price contracts. Selontra costs about $12.25 a pound against about $6.45 a pound for Contrac blocks, based on the list prices above. Operators that bait hundreds of stations per account face material costs nearly twice as high when they switch, so some delay the change until rules force it, and smaller firms absorb the margin loss.
Lower on-farm grain stocks trim storage baiting
Smaller crop inventories on farms reduce the volume of grain that needs rodent protection during storage. USDA NASS reported that on-farm corn stocks fell 18% to 643 million bushels on Sept. 1, 2025, and on-farm soybean stocks also fell 18% to 91.5 million bushels. Farmers holding less grain bait fewer bins, so suppliers of bulk pellets and blocks see softer orders from farm supply dealers until stocks rebuild.
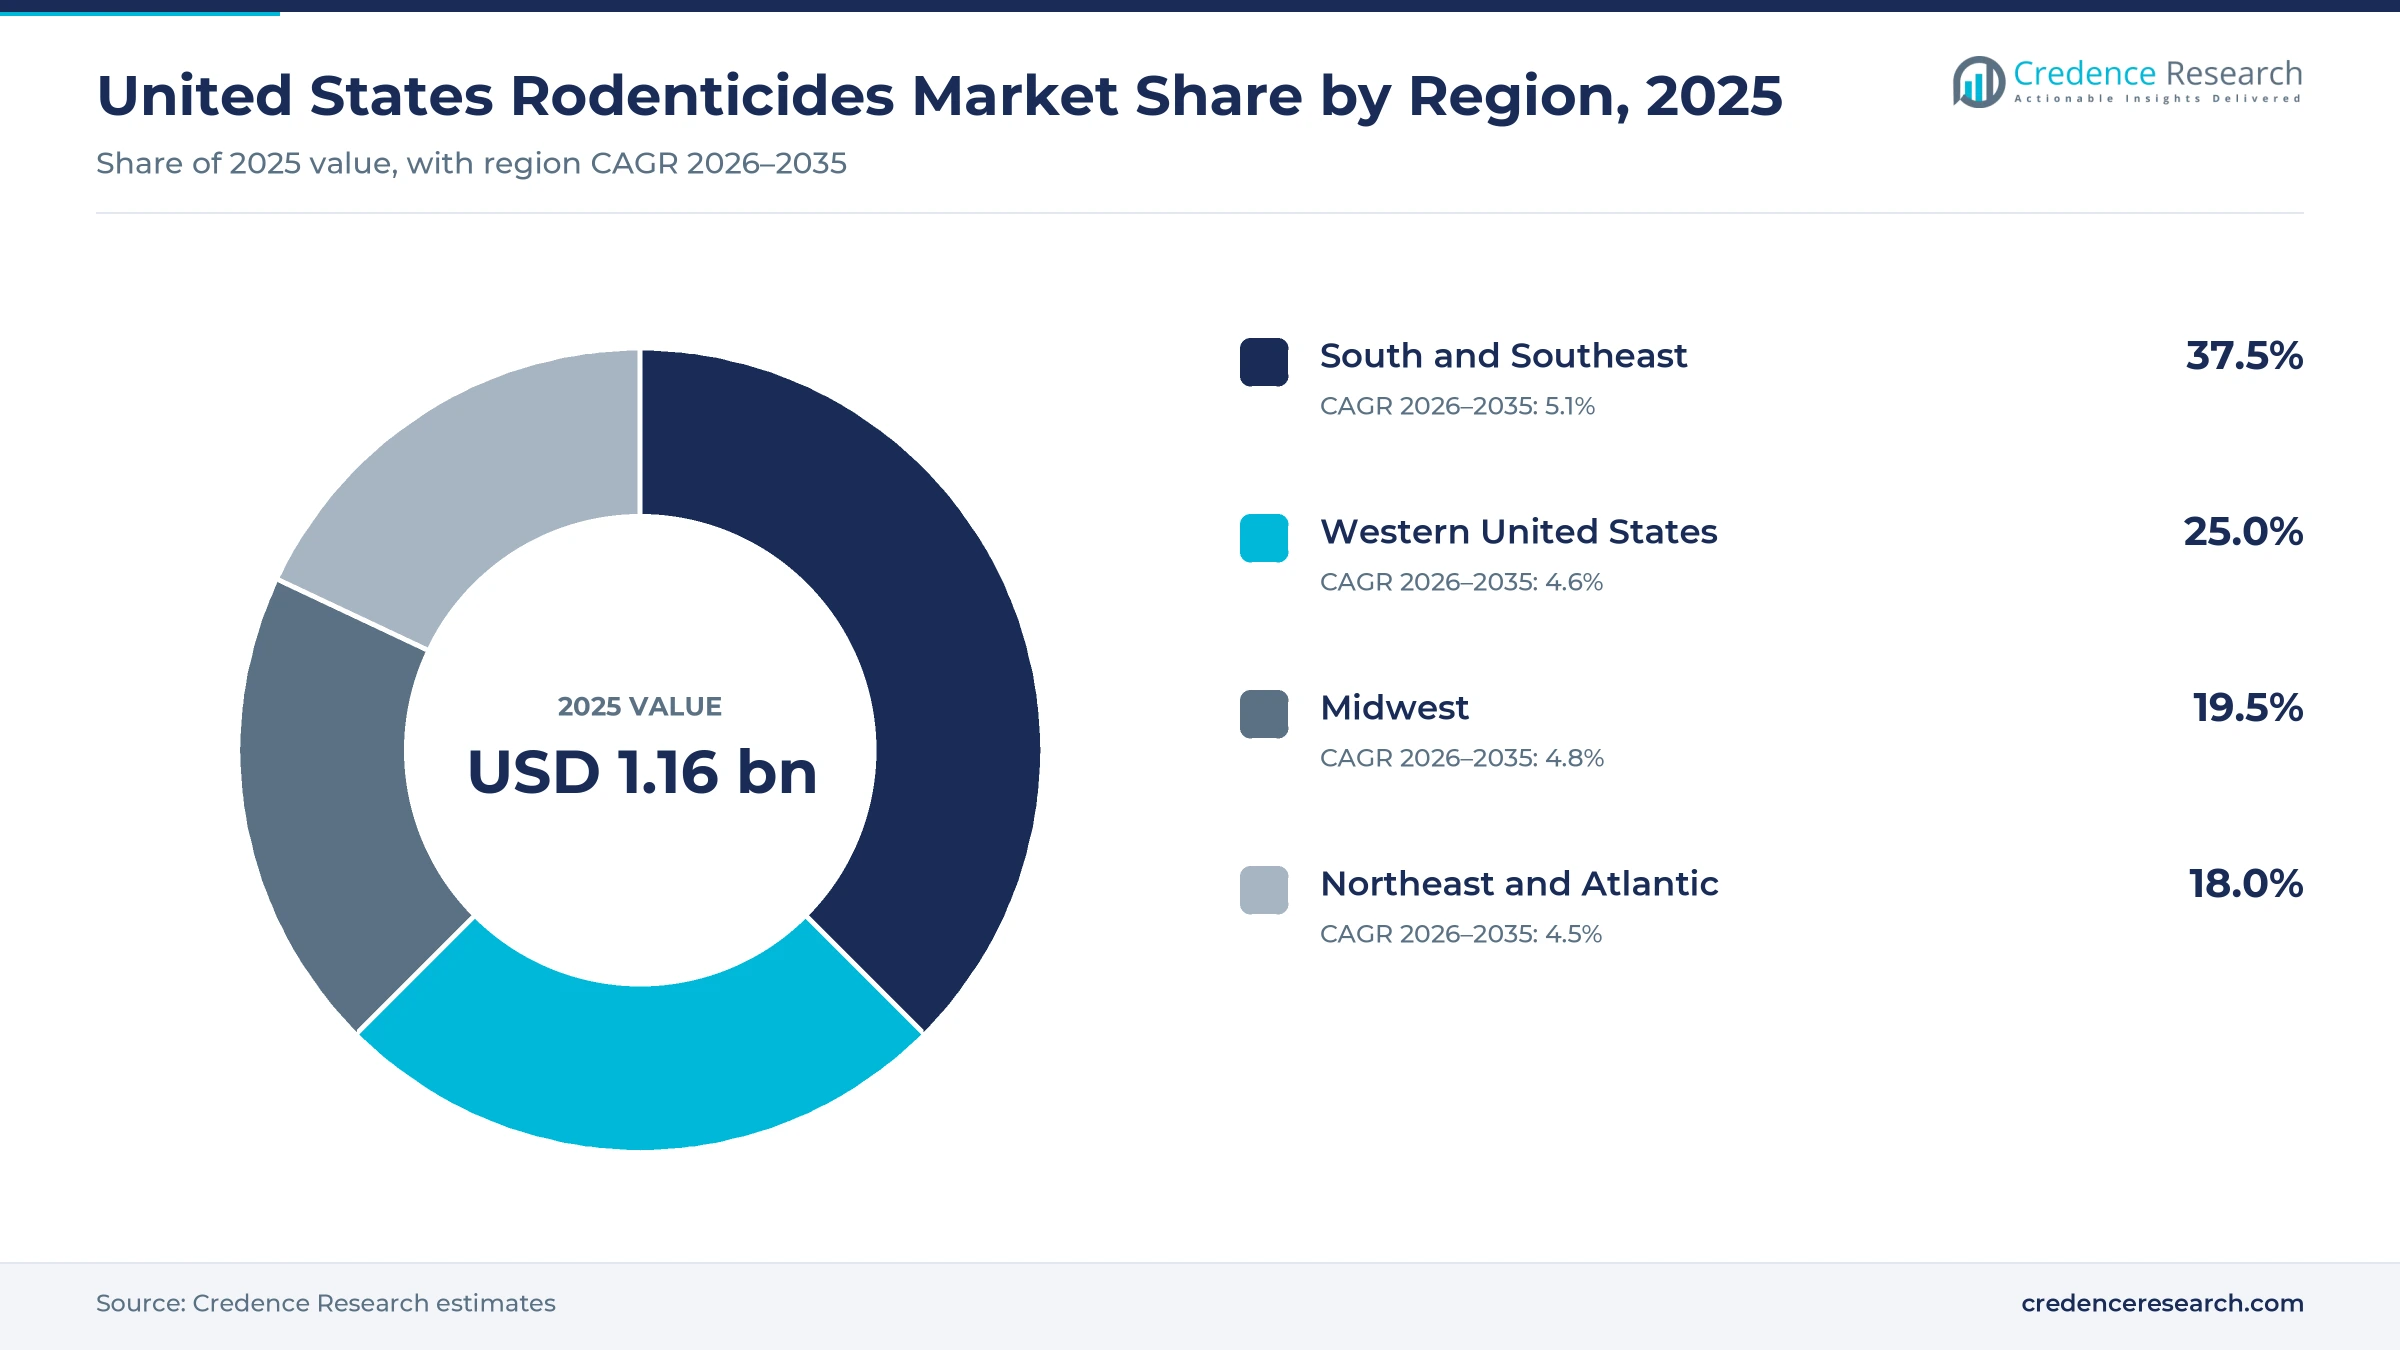
The South and Southeast lead on population and farm output
| Region | Value, 2025 (USD billion) | Share, 2025 | CAGR, 2026–2035 |
|---|---|---|---|
| South and Southeast | 0.43 | 37.5% | 5.1% |
| Western United States | 0.29 | 25.0% | 4.6% |
| Midwest | 0.23 | 19.5% | 4.8% |
| Northeast and Atlantic | 0.21 | 18.0% | 4.5% |
The South and Southeast hold the largest share as population grows
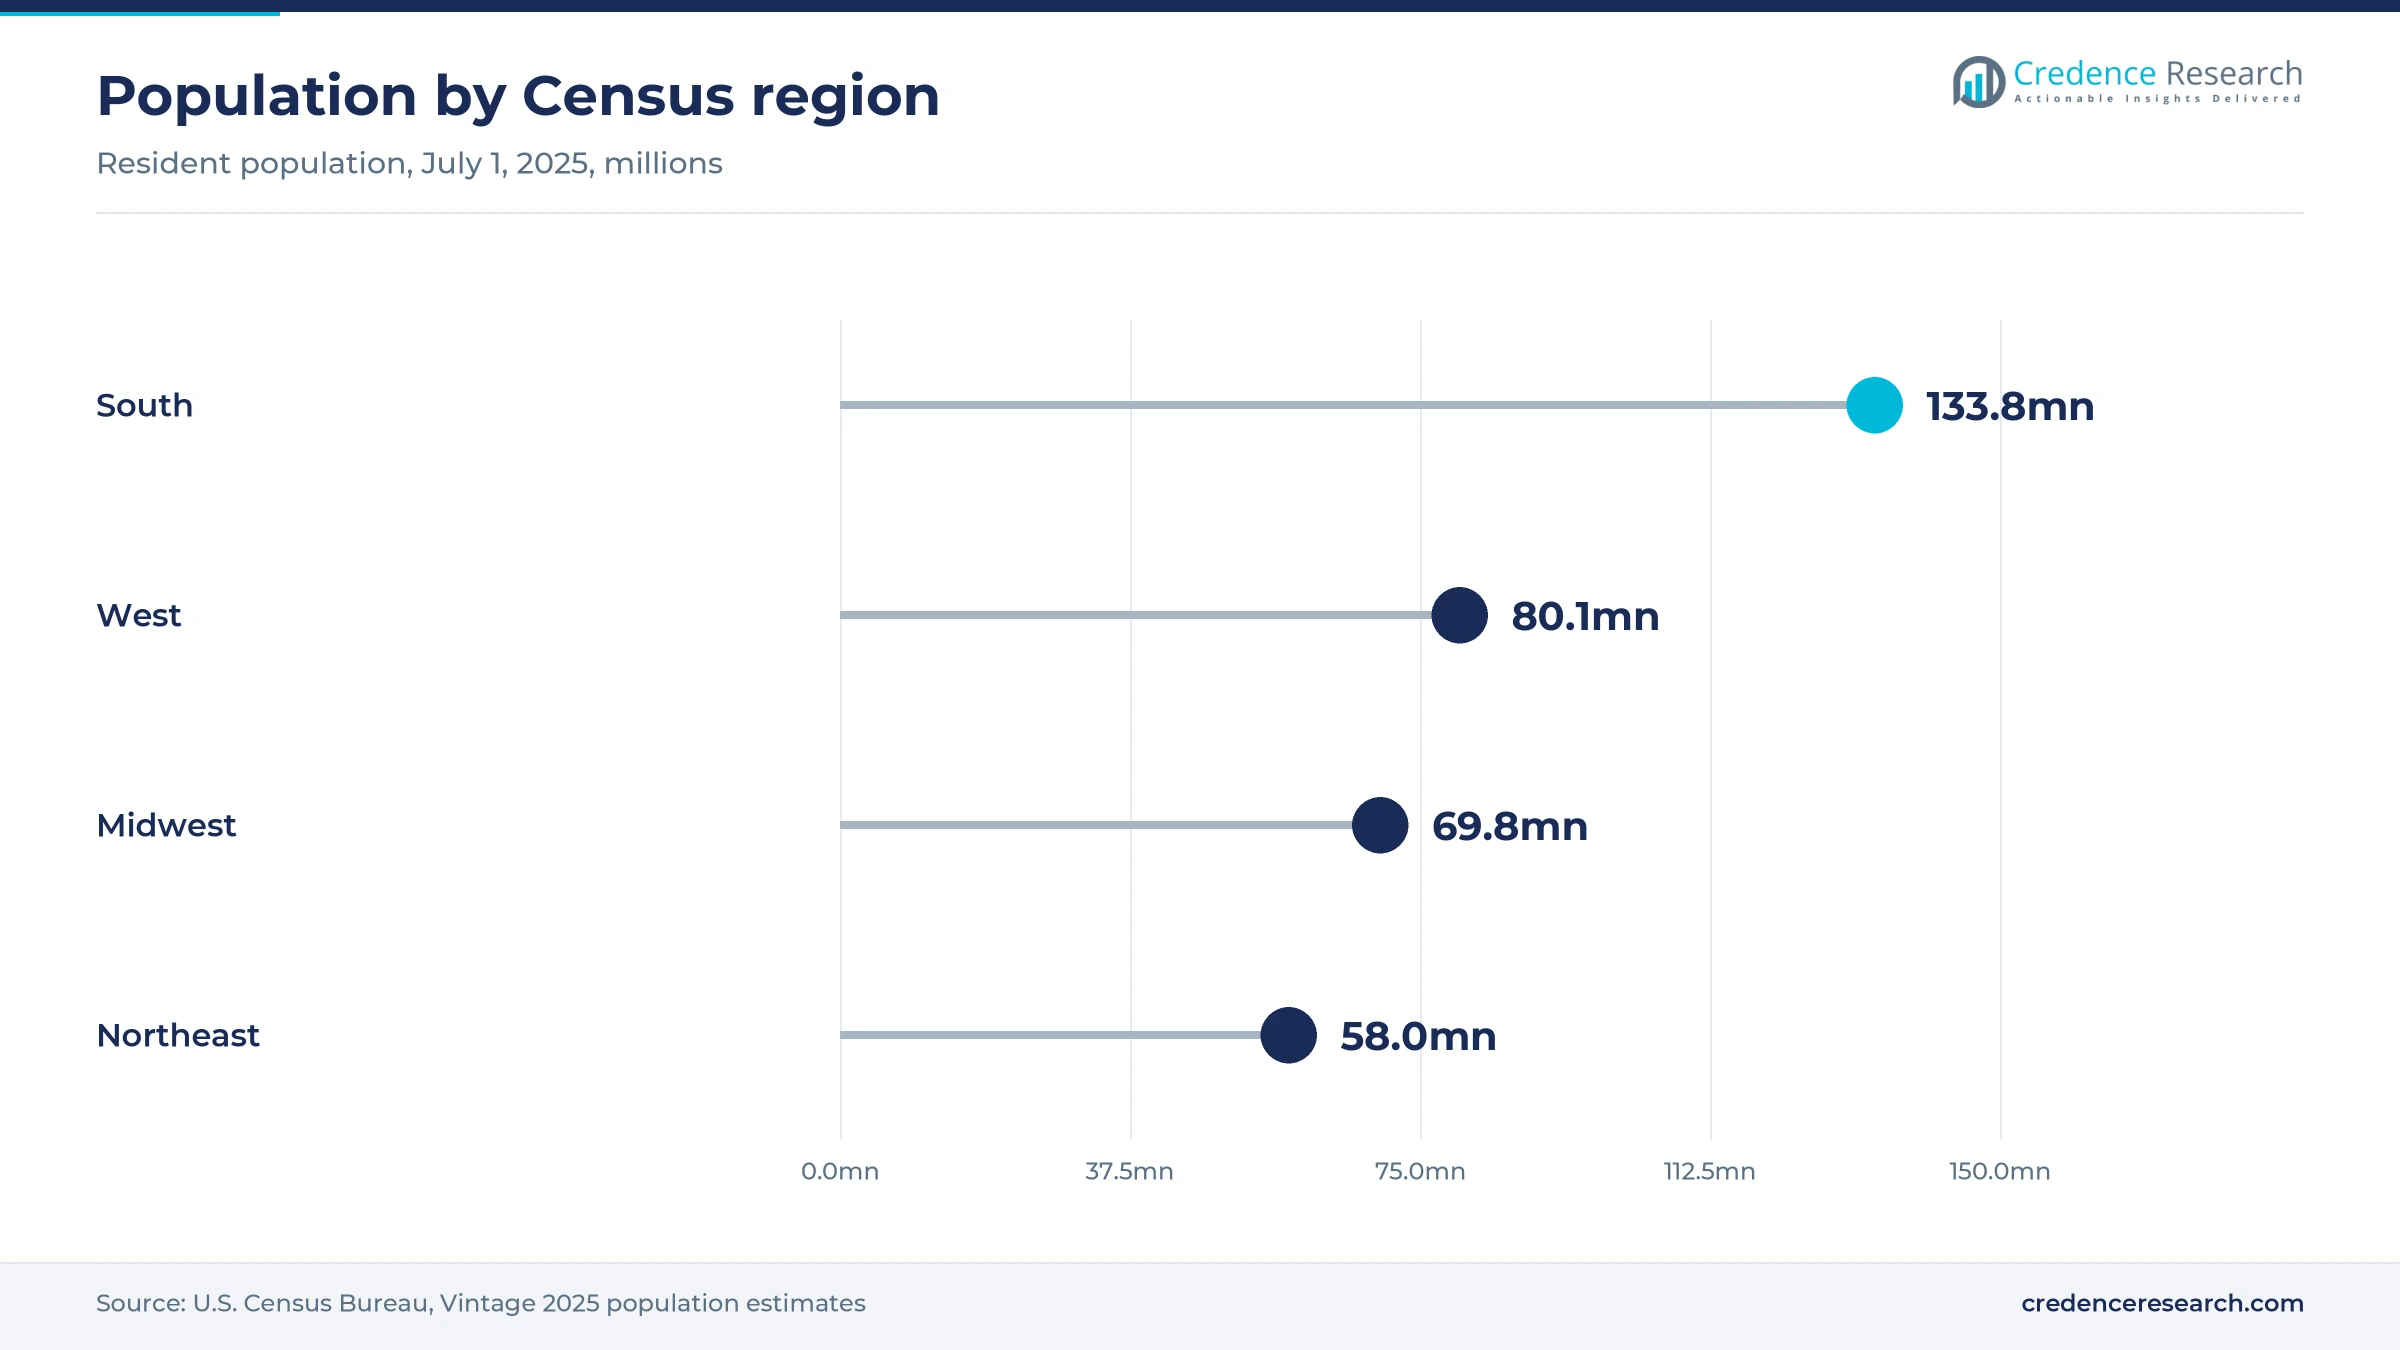
The South and Southeast held a 37.5% share of 2025 market value and grow at 5.1% a year, the fastest of the four regions. Census Bureau estimates put the South's population at 133.8 million on July 1, 2025, up 6.0% since 2020. Warm weather allows rodent breeding year-round, and new homes, warehouses and poultry houses add sites that need stations.
The Western United States leads in rule-driven product switching
The Western United States held a 25.0% share of 2025 market value and grows at 4.6% a year. Its population reached 80.1 million in 2025, up 1.9% since 2020, according to the Census Bureau. California rules noted in the trends push buyers toward bromethalin, cholecalciferol and natural baits, and value per site rises even where volumes fall. San Francisco ranked fourth and Denver tenth in the Orkin list, so urban professional demand stays high.
The Midwest ties demand to grain and livestock sites
The Midwest held a 19.5% share of 2025 market value and grows at 4.8% a year. Its population rose 1.1% from 2020 to 69.8 million in 2025, according to the Census Bureau, so most growth comes from farms, elevators and food plants rather than new homes. City service contracts in Chicago stay steady alongside the farm accounts that buy bulk pails through dealers.
The Northeast and Atlantic grow slowest as cities clean up
The Northeast and Atlantic held an 18.0% share of 2025 market value and grow at 4.5% a year, the slowest of the four regions. Population of the Northeast was 58.0 million in 2025, only 0.7% above 2020, according to the Census Bureau. Older housing keeps city rodent work steady, but the New York City sanitation gains noted in the challenges show how cleaner streets can lower bait use.
Licensing deals and new baits defined 2024 to 2026
| Development | Status and market relevance |
|---|---|
| In January 2024, Woodstream Corporation acquired the Rodent Monitoring System from Envu. | Completed; adds connected trap monitoring to its VLINK devices |
| In August 2024, PelGar USA introduced the Vanguard Heavy and Alert bait stations with Roban Gold Entrap gels. | Launched; widens professional station range |
| In May 2025, Syngenta and Neogen signed an agreement giving Neogen exclusive U.S. and Canadian rights to Talon rodenticides. | Signed; consolidates brodifacoum brands |
| In July 2025, Liphatech announced its entry into insect control alongside its rodent bait range. | Announced; broadens portfolio sold to operators |
| In May 2026, JT Eaton launched a Bait Block for Rodents and Ticks with warfarin and fipronil. | Launched; dual-purpose bait for tick-prone areas |
Sensor stations, vitamin D3 actives and cast baits advance
- Sensor-equipped stations report rodent visits to technicians by Bluetooth or wireless gateways, so operators bait active stations and skip quiet ones on each route.
- Cholecalciferol actives give a non-anticoagulant option that falls outside state anticoagulant bans, although they cost more per pound.
- Cast wax blocks improve palatability and moisture tolerance through special casting processes, a benefit in damp exterior stations and crawl spaces.
- Oil-based soft baits raise acceptance where rodents have other food, which helps in food plants and grain stores where blocks are often ignored.
- Fluorescent and tracking additives mark droppings and runways after feeding, helping technicians find entry points and prove results to auditors.
Need a Custom Version of This Report?
Tailor the scope, geography, or segments to your exact requirements.
- Custom geography or segment scope
- Direct access to our analyst team
Specialist bait makers compete on registrations and channels
Competition turns on registered actives, formulation range and access to operators and farm dealers. Bell Laboratories sells anticoagulant and non-anticoagulant blocks, soft baits and sensor stations, and has built California-specific products. Its range overlaps with rodent control pesticides sold for farms and buildings. Liphatech competes with soft baits, Aegis stations and a new insect line, while Neogen adds the Talon brands to its Ramik and Prozap ranges. BASF supplies cholecalciferol bait, and PelGar USA sells bromadiolone blocks and stations. JT Eaton serves distributors with value-priced blocks and new dual-purpose baits. Woodstream and Central Garden & Pet reach consumers and farms through retail, while EcoClear competes for buyers seeking non-toxic options. Price competition is sharpest in anticoagulant blocks, while non-anticoagulant baits are won on registrations and technical support.
Specialist bait makers, licensees and distributors form the chain
The U.S. supply side is concentrated among a few specialist bait makers. Bell Laboratories and Liphatech hold broad professional and farm ranges, while Neogen now markets Syngenta's Talon line under license. BASF and PelGar add specific actives and stations that fill gaps in those ranges. Most product reaches end users through firms selling pest control services, farm dealers and retailers. Consumer shelves carry retail brands such as Tomcat in ready-to-use stations. EPA registration, reviewed every 15 years, and separate state approvals act as the main entry barriers. Margins sit with registrants that own active ingredient data and labels, while distributors and dealers earn on volume and service.
Companies profiled and their roles in this market
| Company | Type | Role in the market |
|---|---|---|
| Bell Laboratories, Inc. | Bait and station manufacturer | Launched CADET cholecalciferol bait and the iQ sensor line in 2024 |
| Liphatech, Inc. | Bait manufacturer | Announced entry into insect control in July 2025 |
| Neogen Corporation | Bait marketer | Gained exclusive U.S. rights to Talon baits in May 2025 |
| Syngenta AG | Brand owner and licensor | Licensed Talon-G and Talon Weatherblok XT to Neogen in May 2025 |
| BASF SE | Active and bait supplier | Sells Selontra cholecalciferol bait in 8-pound pails |
| PelGar International Ltd. | Bait and station manufacturer | Launched Vanguard Heavy and Alert stations in August 2024 |
| J.T. Eaton & Co., Inc. | Bait manufacturer | Launched a rodent and tick bait block in May 2026 |
| Woodstream Corporation | Consumer and connected device maker | Acquired the Rodent Monitoring System from Envu in January 2024 |
| Central Garden & Pet Company | Consumer and farm brand owner | Sells Rodentex through its Farnam line |
| EcoClear Products, Inc. | Natural bait maker | Sells RatX corn gluten and salt baits through farm retailers |
Registrations, not volume, decide who gains ground
Credence Research's view is that U.S. rodenticide value will hold up even as anticoagulant volumes shrink, because replacement actives cost more per pound. Second-generation baits keep the largest share at 48.0% of 2025 value, but they are the line most exposed to state bans and federal label changes. The strongest positions belong to registrants with several actives, soft bait and block formats and connected stations that prove results to food-plant auditors. Farm biosecurity and commercial pest control growth give steady demand, while household sales, which share retail aisles with household insecticides, depend more on retail pricing and state rules.
Industry revenue, price lists and rulings anchor the model
The report uses 2025 as the base year and 2026 to 2035 as the forecast period. Market values come from the Credence Research model, which builds spending from professional pest control activity, farm and grain storage sites, household purchases and typical bait prices. Segment and regional splits are Credence Research estimates built from Census Bureau population data, USDA grain stock reports, NPMA industry figures, EPA and state regulatory actions, published retail and distributor price lists, and company announcements and filings. No interviews or primary surveys were conducted for this edition.
Restricted actives give way to monitored, targeted baiting
The United States rodenticides market is expected to grow from USD 1.21 billion in 2026 to USD 1.85 billion by 2035 at a 4.80% CAGR. Non-anticoagulants will gain the most share by 2035 as state and federal reviews tighten anticoagulant use. Professional operators will take a larger part of spending as stronger baits move out of retail, and connected stations will decide where bait is placed. The South and Southeast will add the most new sites. By 2035, most commercial baiting is likely to be monitored and targeted rather than run on fixed routes.
State bans and EPA decisions set the 2035 range
The range of outcomes depends on how far anticoagulant restrictions spread beyond California and South Carolina and on what the EPA decides in its 2026 interim decisions. A downside case assumes broad bans that cut bait volumes faster than higher prices can offset. The base case assumes gradual switching to non-anticoagulants with steady professional demand. An upside case needs stronger farm biosecurity spending and faster adoption of premium actives.
| Scenario | CAGR, 2026–2035 | Value, 2035 | What has to hold |
|---|---|---|---|
| Downside | 3.3% | USD 1.63 billion | Several states ban anticoagulants and the EPA narrows labels sharply |
| Base | 4.80% | USD 1.85 billion | Restrictions spread slowly and operators switch actives on a steady schedule |
| Upside | 6.1% | USD 2.07 billion | Farm biosecurity spending rises and premium actives gain share quickly |
Frequently Asked Questions
How big is the United States rodenticides market?
Which product type leads U.S. rodenticide spending?
Which U.S. region leads the market?
How has California changed rodenticide sales?
Which formulation grows fastest?
How do food-safety cases affect rodent control demand?
Who are the key companies in the United States rodenticides market?
What does professional rodent bait cost in the United States?
Table of Content
Chapter 1 Market Segmentation
- 1.1 Segmentation Framework
- 1.1.1 Product and Service Classification
- 1.1.2 Application and End-Use Classification
- 1.1.3 Technology and Solution Classification
- 1.1.4 Customer and Distribution Channel Classification
- 1.1.5 Geographic Segmentation
- 1.1.6 Market Segment Definitions and Boundaries
- 1.2 By Product Type
- 1.2.1 Second-generation anticoagulants
- 1.2.2 First-generation anticoagulants
- 1.2.3 Non-anticoagulants
- 1.3 By Application
- 1.3.1 Building interior control
- 1.3.2 Perimeter control
- 1.3.3 Field and burrow control
- 1.3.4 Stored-grain protection
- 1.4 By Customer Type
- 1.4.1 Pest control operators
- 1.4.2 Agricultural buyers
- 1.4.3 Household buyers
- 1.4.4 Direct facility and public-sector buyers
- 1.5 By Formulation
- 1.5.1 Bait blocks
- 1.5.2 Pellets
- 1.5.3 Pastes and soft baits
- 1.5.4 Powders and liquid baits
Chapter 2 Introduction
- 2.1 Report Objectives and Scope
- 2.2 Product Definition and Industry Terminology
- 2.3 Market Inclusions and Exclusions
- 2.4 Research Process
- 2.4.1 Primary Research and Expert Interviews
- 2.4.2 Secondary Research and Source Review
- 2.4.3 Top-Down and Bottom-Up Estimation
- 2.4.4 Data Triangulation and Verification
- 2.5 Market Size Measurement Basis
- 2.5.1 2025: USD 1.16 billion → 2035: USD 1.85 billion
- 2.6 Historical and Forecast Reference Periods
- 2.6.1 Historical Period: 2018-2025
- 2.6.2 Base Year: 2025
- 2.6.3 Forecast Period: 2025-2035
- 2.7 Research Assumptions and Limitations
Chapter 3 Executive Summary
- 3.1 Market Snapshot and Key Findings
- 3.2 Base-Year Market Size, 2025
- 3.3 Forecast Market Size, 2035
- 3.4 Revenue and Volume Growth Outlook
- 3.5 Key Demand and Supply Indicators
- 3.6 Leading Market Segments
- 3.7 Fastest-Growing Market Opportunities
- 3.8 Regional Performance Highlights
- 3.9 Technology and Industry Transformation
- 3.10 Competitive Landscape Summary
- 3.11 Analyst View and Strategic Implications
Chapter 4 United States Rodenticides Market Trends and Developments
- 4.1 Historical Industry Development, 2018-2025
- 4.2 Recent Market Trends and Developments
- 4.3 Demand and Customer Behavior Trends
- 4.4 Technology and Product Innovation
- 4.5 Artificial Intelligence, Automation and Digitalization
- 4.6 Local Manufacturing and Supply Chain Realignment
- 4.7 Industry Partnerships, Mergers and Acquisitions
- 4.8 Sustainability and Circular Economy Developments
- 4.9 Government and Private Sector Investment Trends
- 4.10 Emerging Business Models and Commercialization
- 4.11 Industry Developments and Announcements
Chapter 5 United States Rodenticides Market Production, Supply and Demand Analysis
- 5.1 Demand Trend and Consumption Analysis, 2018-2025
- 5.2 Demand Forecast, 2025-2035
- 5.3 Production and Output Trend, 2018-2025
- 5.4 Production and Output Forecast, 2025-2035
- 5.5 Installed Capacity and Capacity Utilization
- 5.6 Company-Wise Production Plants and Statistics
- 5.6.1 Installed Production Capacity
- 5.6.2 Actual Production
- 5.6.3 Planned Capacity and Expansion Targets
- 5.7 Supply Chain Structure and Procurement Trends
- 5.8 Supply-Demand Gap and Bottlenecks
- 5.9 Import Dependence and Sourcing Structure
- 5.10 Contract Manufacturing and Outsourcing
- 5.11 Regional Supply and Demand Concentration
Chapter 6 United States Rodenticides Market Pricing Analysis
- 6.1 Pricing Structure and Measurement
- 6.2 Historical Pricing Trends, 2018-2025
- 6.3 Pricing Outlook, 2025-2035
- 6.4 Average Selling Price and Unit Economics
- 6.5 Pricing by Product and Market Segment
- 6.6 Geographic Pricing Differences
- 6.7 Key Input, Energy, Labor and Logistics Costs
- 6.8 Contract Pricing and Purchasing Models
- 6.9 Pricing Sensitivity and Competitive Positioning
- 6.10 Price, Margin and Profitability Implications
Chapter 7 United States Rodenticides Market Dynamics
- 7.1 Market Growth Drivers
- 7.1.1 Demand-Side Drivers
- 7.1.2 Technology and Innovation Drivers
- 7.1.3 Infrastructure and Investment Drivers
- 7.1.4 Regulatory and Policy Drivers
- 7.2 Market Restraints
- 7.2.1 Cost and Affordability Constraints
- 7.2.2 Technology and Adoption Barriers
- 7.2.3 Supply Chain and Operational Constraints
- 7.3 Market Challenges
- 7.3.1 Competitive Pressure and Margin Erosion
- 7.3.2 Skills, Infrastructure and Implementation Gaps
- 7.4 Emerging Market Opportunities
- 7.5 Market Dynamics Impact and Time-Horizon Assessment
Chapter 8 United States Rodenticides Value Chain Analysis
- 8.1 Industry Value Chain Overview
- 8.2 Upstream Suppliers and Critical Inputs
- 8.3 Technology and Component Providers
- 8.4 Manufacturing or Service Delivery
- 8.5 Distribution, Channel Partners and Integrators
- 8.6 Downstream Applications and End Users
- 8.7 Value Addition and Profit Pools
- 8.8 Vertical Integration and Outsourcing
- 8.9 Supplier Concentration and Risk
- 8.10 Supply Chain Localization and Resilience
Chapter 9 United States Rodenticides Market Regulations and Policies
- 9.1 Relevant Laws, Standards and Compliance Frameworks
- 9.2 Product, Service, Safety and Quality Requirements
- 9.3 Government Policies, Incentives and Subsidies
- 9.4 Imports, Exports and Trade Barriers
- 9.5 Public Procurement and Local Content Requirements
- 9.6 Environmental and Sustainability Compliance
- 9.7 Upcoming Policy Changes and Market Implications
Chapter 10 United States Rodenticides Market Hotspots and Opportunities
- 10.1 Market Opportunity Mapping and Growth Hotspots
- 10.2 High-Growth Applications and Customer Groups
- 10.3 Underserved Markets and White-Space Opportunities
- 10.4 Emerging Technology and Product Opportunities
- 10.5 New Capacity and Investment Hotspots
- 10.6 Market Entry and Expansion Opportunities
- 10.7 Distribution and Partnership Opportunities
- 10.8 Near-Term and Long-Term Commercial Potential
- 10.9 Opportunity Attractiveness and Execution Risks
Chapter 11 United States Rodenticides Market Outlook, 2025-2035
- 11.1 Market Size and Analysis
- 11.1.1 Revenue (Market Measurement: 2025: USD 1.16 billion → 2035: USD 1.85 billion)
- 11.1.2 Market Volume and Quantity Sold
- 11.1.3 Historical Market Size, 2018-2025
- 11.1.4 Base-Year Market Size, 2025
- 11.2 Market Forecast, 2025-2035
- 11.2.1 Revenue Forecast to 2035
- 11.2.2 Volume Forecast to 2035
- 11.2.3 CAGR and Year-on-Year Growth
- 11.2.4 Incremental Revenue Opportunity
- 11.3 Forecast Assumptions and Scenario Analysis
- 11.3.1 Base-Case Forecast
- 11.3.2 Optimistic and Conservative Scenarios
- 11.3.3 Technology, Pricing and Policy Sensitivities
- 11.4 Market Attractiveness and Growth Outlook
Chapter 12 United States Rodenticides Market Segmentation and Outlook
- 12.1 Segmentation Summary and Market Shares, 2025
- 12.2 Largest and Fastest-Growing Segments
- 12.3 By Product Type - Market Size and Forecast, 2025-2035
- 12.3.1 Segment Definition and Scope
- 12.3.2 Historical Market Size, 2018-2025
- 12.3.3 Revenue Forecast, 2025-2035
- 12.3.4 Volume Forecast, 2025-2035
- 12.3.5 Base-Year Market Share, 2025
- 12.3.6 Segment CAGR and Growth Drivers
- 12.3.7 Subsegment Market Size and Forecast
- 12.3.7.1 Second-generation anticoagulants
- 12.3.7.2 First-generation anticoagulants
- 12.3.7.3 Non-anticoagulants
- 12.3.8 Subsegment Pricing and Adoption Trends
- 12.3.9 Leading Suppliers and Competition
- 12.3.10 Regional Demand and Opportunities
- 12.4 By Application - Market Size and Forecast, 2025-2035
- 12.4.1 Segment Definition and Scope
- 12.4.2 Historical Market Size, 2018-2025
- 12.4.3 Revenue Forecast, 2025-2035
- 12.4.4 Volume Forecast, 2025-2035
- 12.4.5 Base-Year Market Share, 2025
- 12.4.6 Segment CAGR and Growth Drivers
- 12.4.7 Subsegment Market Size and Forecast
- 12.4.7.1 Building interior control
- 12.4.7.2 Perimeter control
- 12.4.7.3 Field and burrow control
- 12.4.7.4 Stored-grain protection
- 12.4.8 Subsegment Pricing and Adoption Trends
- 12.4.9 Leading Suppliers and Competition
- 12.4.10 Regional Demand and Opportunities
- 12.5 By Customer Type - Market Size and Forecast, 2025-2035
- 12.5.1 Segment Definition and Scope
- 12.5.2 Historical Market Size, 2018-2025
- 12.5.3 Revenue Forecast, 2025-2035
- 12.5.4 Volume Forecast, 2025-2035
- 12.5.5 Base-Year Market Share, 2025
- 12.5.6 Segment CAGR and Growth Drivers
- 12.5.7 Subsegment Market Size and Forecast
- 12.5.7.1 Pest control operators
- 12.5.7.2 Agricultural buyers
- 12.5.7.3 Household buyers
- 12.5.7.4 Direct facility and public-sector buyers
- 12.5.8 Subsegment Pricing and Adoption Trends
- 12.5.9 Leading Suppliers and Competition
- 12.5.10 Regional Demand and Opportunities
- 12.6 By Formulation - Market Size and Forecast, 2025-2035
- 12.6.1 Segment Definition and Scope
- 12.6.2 Historical Market Size, 2018-2025
- 12.6.3 Revenue Forecast, 2025-2035
- 12.6.4 Volume Forecast, 2025-2035
- 12.6.5 Base-Year Market Share, 2025
- 12.6.6 Segment CAGR and Growth Drivers
- 12.6.7 Subsegment Market Size and Forecast
- 12.6.7.1 Bait blocks
- 12.6.7.2 Pellets
- 12.6.7.3 Pastes and soft baits
- 12.6.7.4 Powders and liquid baits
- 12.6.8 Subsegment Pricing and Adoption Trends
- 12.6.9 Leading Suppliers and Competition
- 12.6.10 Regional Demand and Opportunities
- 12.7 Segment Growth Comparison
- 12.8 Segment Attractiveness and Priority Matrix
Chapter 13 United States Rodenticides End-Use and Application Market Outlook
- 13.1 End-Use Industry and Customer Demand Structure
- 13.2 Leading Applications and Customer Groups
- 13.3 End-Use Market Size, Share and Forecast
- 13.4 Major End-Use Industry Deep Dives
- 13.4.1 Customer Requirements and Use Cases
- 13.4.2 Demand and Replacement Cycles
- 13.4.3 Technical and Regulatory Considerations
- 13.4.4 Purchasing and Procurement Models
- 13.4.5 Leading Vendors and Distribution Channels
- 13.4.6 Forecast and Commercial Opportunities
- 13.5 Emerging Applications and Cross-Segment Demand
- 13.6 End-Use Industry Investment Priorities
Chapter 14 United States Rodenticides Geographic Market Outlook, 2025-2035
- 14.1 Domestic Market Distribution and Demand Clusters
- 14.2 State- or Province-Wise Market Size and Forecast, 2025-2035
- 14.3 City and Metropolitan Market Outlook
- 14.4 Industrial, Manufacturing and Commercial Clusters
- 14.5 Geographic Concentration of Key End Users
- 14.6 Local Pricing and Purchasing Differences
- 14.7 Domestic Production Facilities and Capacity Map
- 14.8 Local Infrastructure and Project Pipeline
- 14.9 State-Level Policy and Incentive Differences
- 14.10 Subnational Investment Hotspots and Opportunities
- 14.11 Distribution and Logistics Networks
- 14.12 Domestic Competitive Footprint
Chapter 15 United States Rodenticides Technology, Innovation and Sustainability Outlook
- 15.1 Technology Landscape and Maturity
- 15.2 Product, Process and Service Innovation
- 15.3 AI, Automation and Digital Tools in the Industry
- 15.4 Technology Adoption and Performance Benchmarking
- 15.5 Innovation Pipeline and R&D Investment
- 15.6 Patent and Intellectual Property Trends
- 15.7 Energy Efficiency and Resource Management
- 15.8 Sustainability, Recycling and Circularity
- 15.9 Technology Roadmap, 2025-2035
- 15.10 Risks of Obsolescence and Technology Substitution
Chapter 16 United States Rodenticides Market Key Strategic Imperatives
- 16.1 Growth and Market Entry Priorities
- 16.2 High-Return Products and Segments
- 16.3 Pricing, Profitability and Cost Optimization
- 16.4 Technology Investment and Product Differentiation
- 16.5 Supply Chain Localization and Resilience
- 16.6 Distribution and Customer Acquisition
- 16.7 Partnership, Acquisition and Capacity Strategy
- 16.8 Regional Expansion Priorities
- 16.9 Short-, Medium- and Long-Term Actions
Chapter 17 Competition Outlook
- 17.1 Industry Competition Characteristics
- 17.2 Market Structure and Concentration
- 17.3 Market Share and Competitive Positioning, 2025
- 17.4 Company-Wise Revenue and Product Benchmarking
- 17.5 Production and Service Capacity Benchmarking
- 17.6 Technology, Pricing and Differentiation
- 17.7 Regional Footprint and Distribution Strength
- 17.8 Mergers, Acquisitions and Strategic Alliances
- 17.9 New Entrants and Competitive Threats
- 17.10 Porter's Five Forces and Industry Attractiveness
- 17.11 Competitive Outlook, 2025-2035
Chapter 18 Company Profiles
- 18.1 Company Coverage and Selection Criteria
- 18.2 Bell Laboratories, Inc.
- 18.2.1 Business Description
- 18.2.2 Company Ownership and Geographic Presence
- 18.2.3 Product and Service Portfolio
- 18.2.4 Manufacturing and Operating Footprint
- 18.2.5 Production Capacity and Expansion Plans
- 18.2.6 Financial Performance and Investment
- 18.2.7 Market Share and Competitive Position
- 18.2.8 Technology and Innovation Capabilities
- 18.2.9 Strategic Alliances or Partnerships
- 18.2.10 Recent Developments
- 18.2.11 Growth Strategy and Outlook
- 18.3 Liphatech, Inc.
- 18.4 Neogen Corporation
- 18.5 Syngenta AG
- 18.6 BASF SE
- 18.7 PelGar International Ltd.
- 18.8 J.T. Eaton & Co., Inc.
- 18.9 Woodstream Corporation
- 18.10 Central Garden & Pet Company
- 18.11 EcoClear Products, Inc.
- 18.12 Other Relevant Market Participants
Note: Every listed company is profiled on the structure shown under the first company. The company list is preliminary and may change based on research findings, market developments, data availability and client requirements.
Chapter 19 Disclaimer
- 19.1 Research and Forecast Disclaimer
- 19.2 Data Source and Estimation Limitations
Note: The depth of individual sections depends on data availability for this market. Volume, capacity, trade and other unit-based metrics are included where applicable.

