
Seasonal rent from potato chambers anchors store income
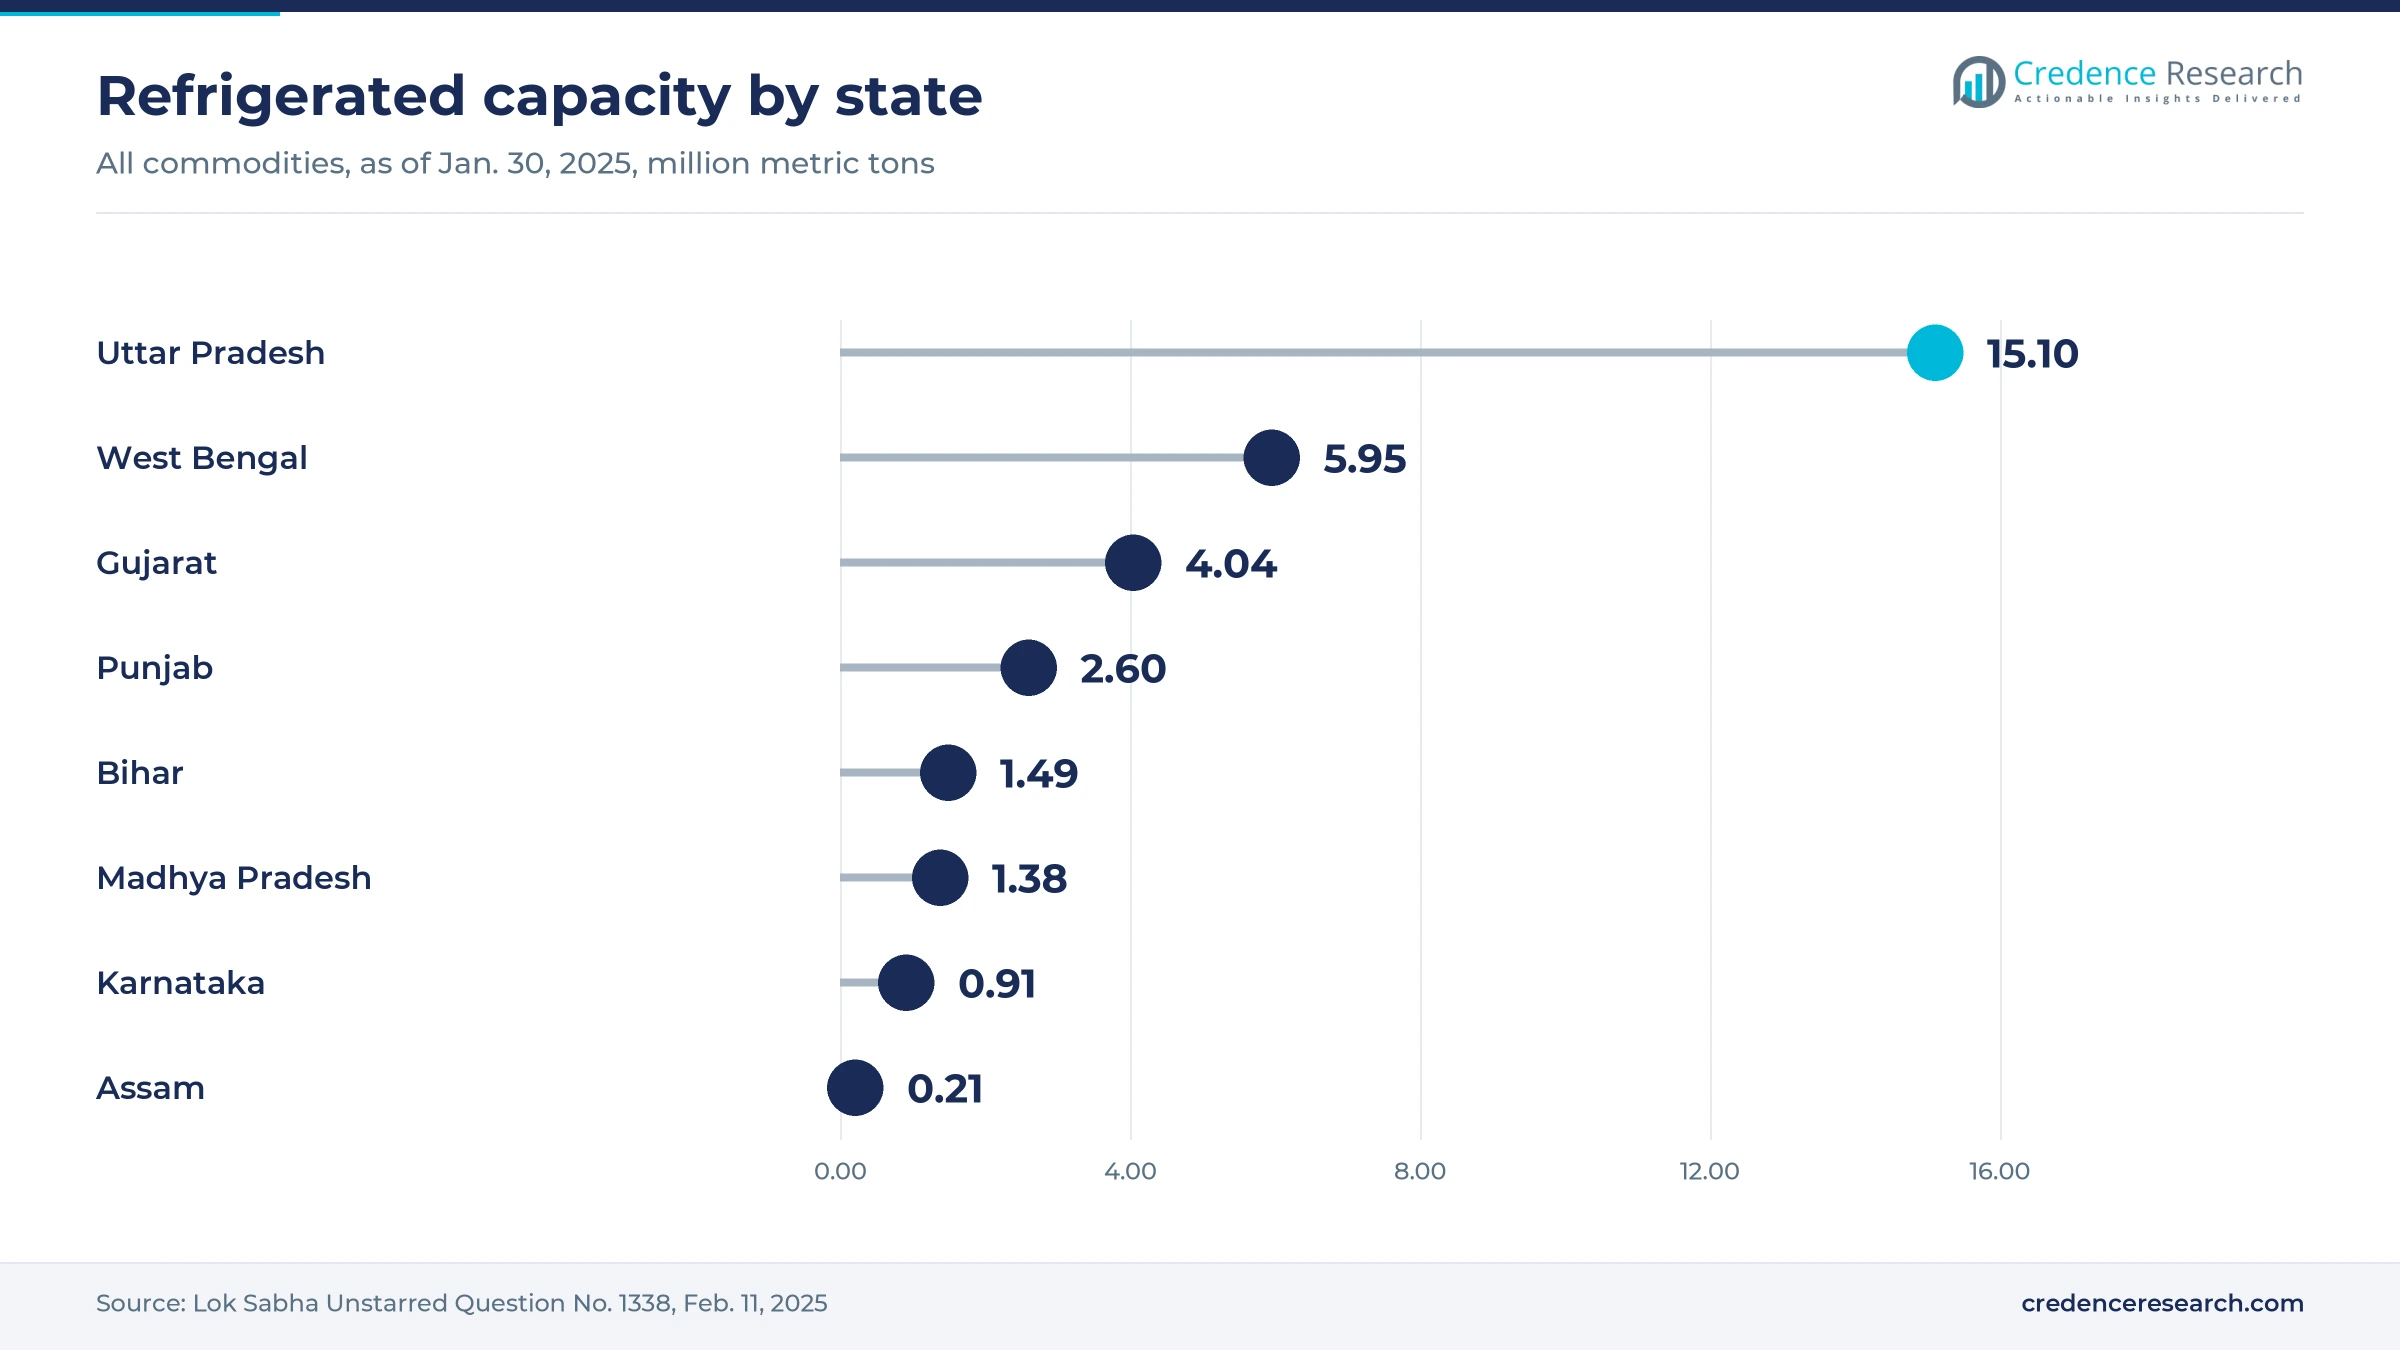
The India potato cold storage market was valued at USD 820.0 million in 2025 and is projected to increase from USD 860.0 million in 2026 to USD 1.33 billion by 2035, registering a CAGR of 5.00% during 2026–2035. Rent from potato chambers makes up most of this revenue, while advances against stored stock add a smaller lending stream. North India held the largest regional share, 49.0% in 2025, because Uttar Pradesh alone reported 2,488 cold stores with 15.1 million metric tons of capacity in a Lok Sabha reply dated Feb. 11, 2025. Northeast India is the fastest-growing region at 5.79% a year, starting from only 43 stores in Assam. India harvested 58.57 million metric tons of potatoes in 2024-25, according to final government estimates approved in March 2026. In August 2026, Uttar Pradesh introduced assistance of Rs 100 per quintal for potatoes placed in private stores, a direct support for occupancy that changes how growers weigh rent against immediate sale.
What does India potato cold storage revenue include?
The market counts the seasonal rent that growers and traders pay to keep potatoes in refrigerated chambers, usually from February to October, plus interest earned on loans made against the stored crop. Rates are quoted per quintal or per 50-kilogram packet, and stores range from small farm-side units to multi-chamber ammonia plants above 10,000 metric tons.
The market excludes the value of the potatoes themselves, refrigerated transport, frozen fry warehousing and the sale of refrigeration equipment. Value flows from depositors to private store owners, who then pay for electricity, labor, bank debt and plant maintenance through the season.
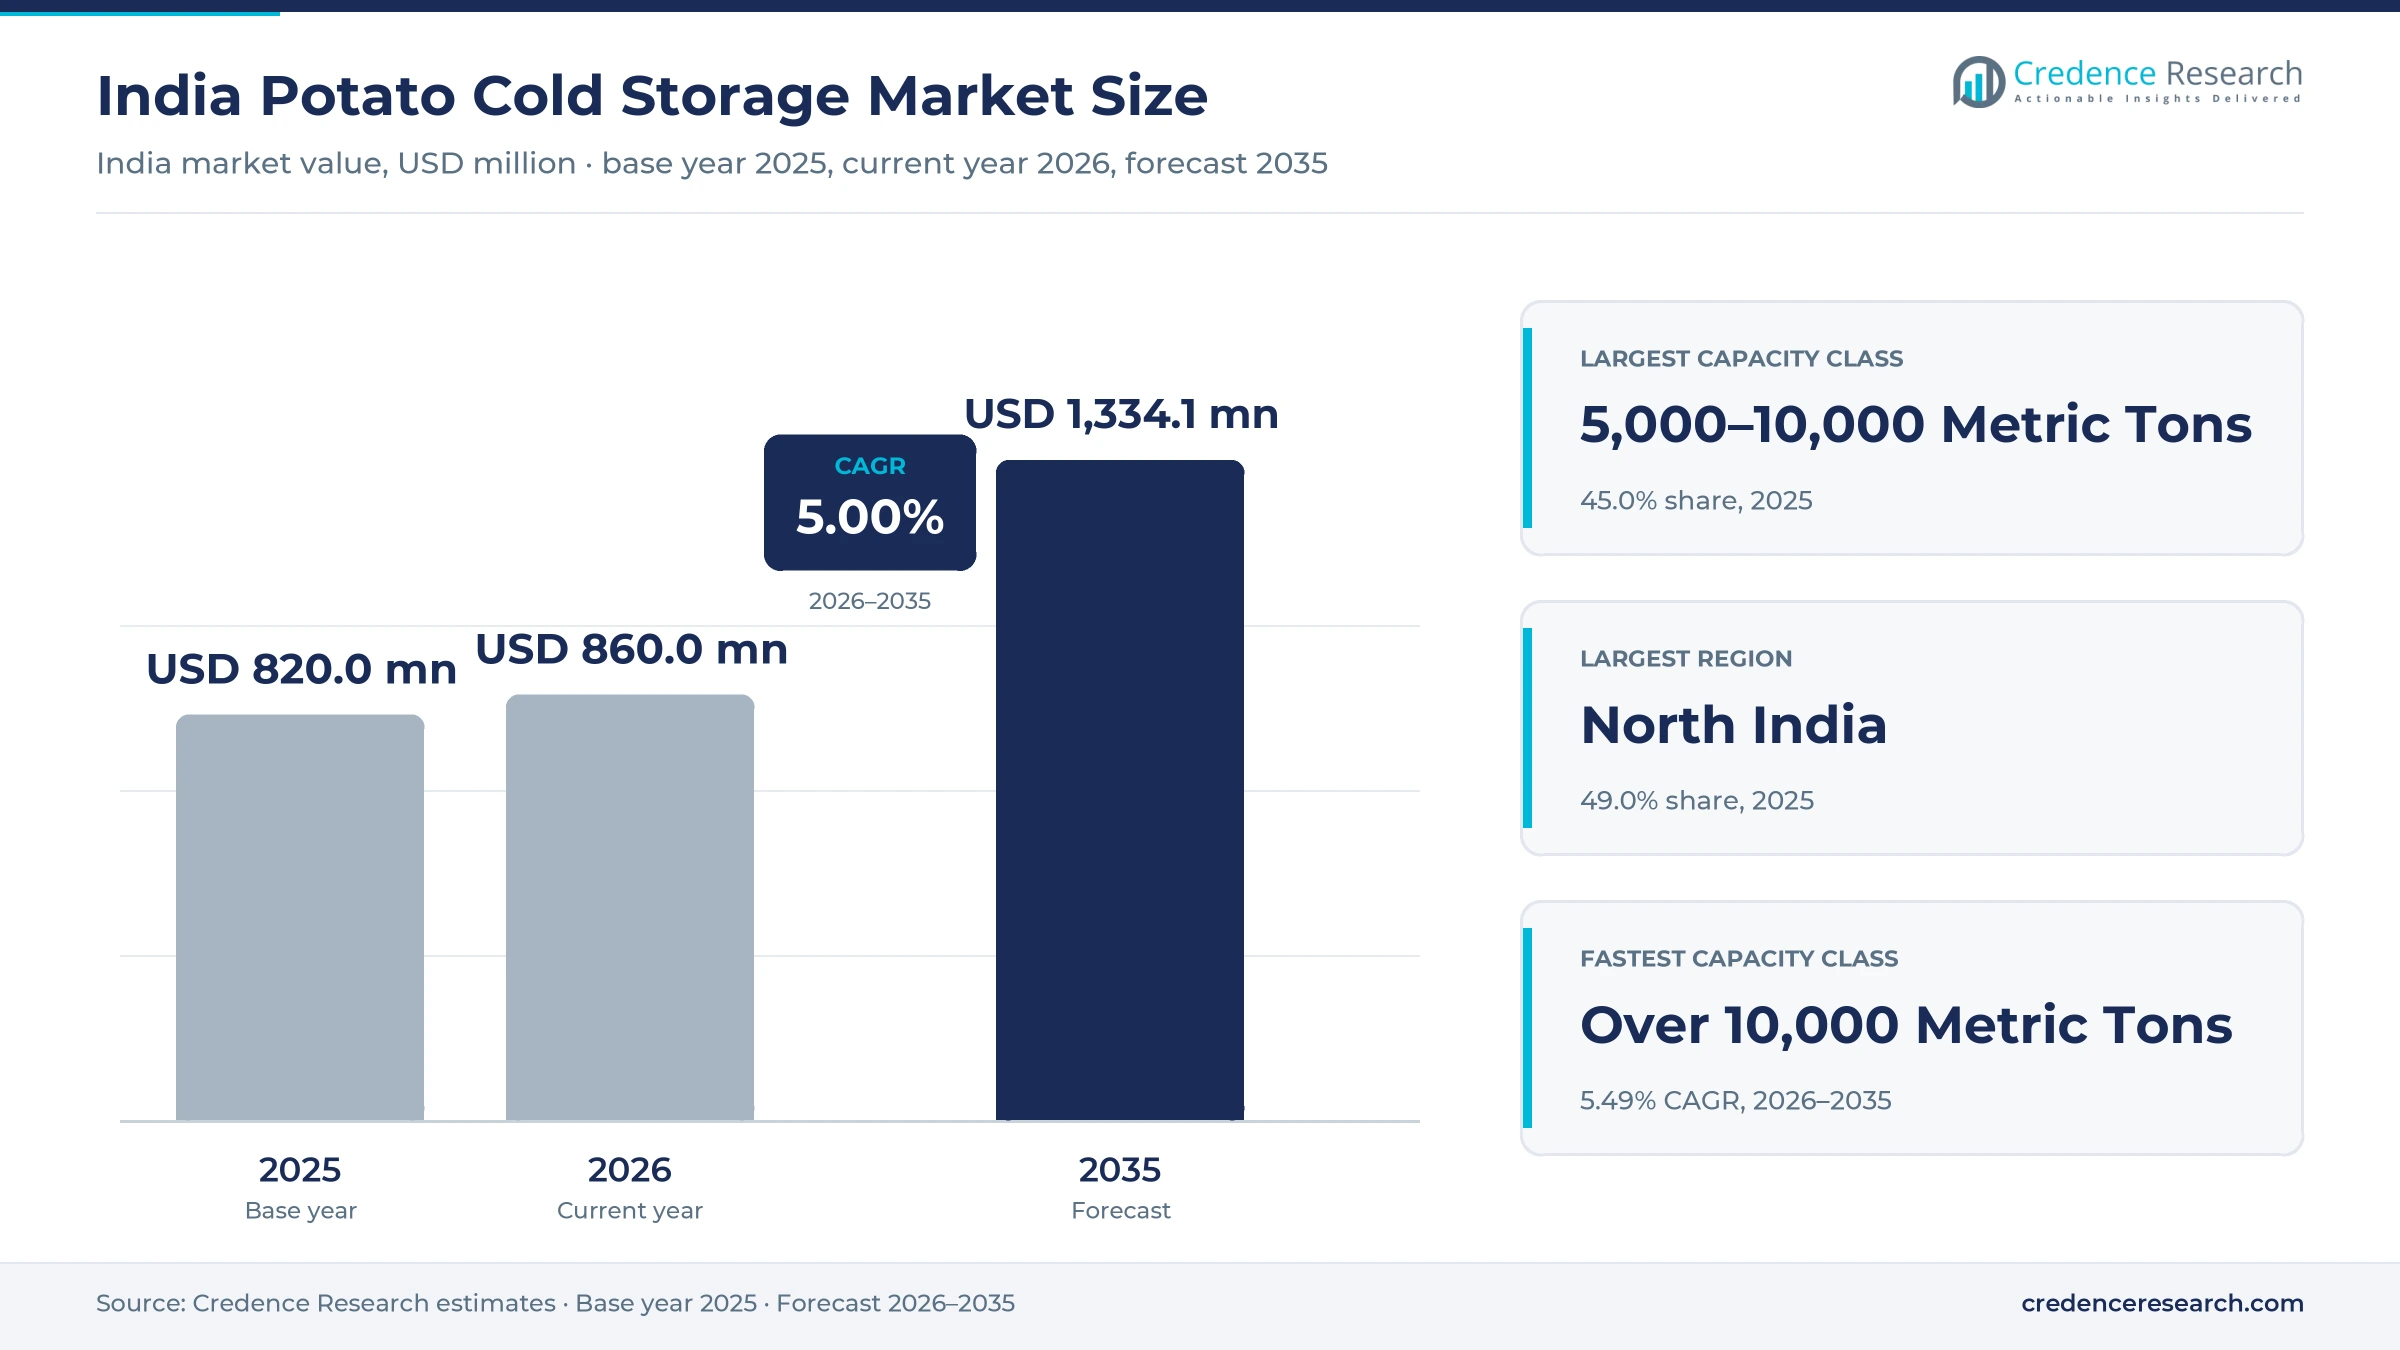
India Potato Cold Storage Market Insights
- Revenue rises from USD 820.0 million in 2025 to USD 1.33 billion by 2035 at a 5.00% CAGR, as rent increases and upgrades add more value than new chambers do.
- North India held 49.0% of 2025 value, because Uttar Pradesh reported 15.1 million metric tons of refrigerated capacity across 2,488 stores in early 2025.
- Storage Rent accounted for 88.0% of 2025 value, while lending against stock remained the smaller line for most private store owners.
- Uttar Pradesh began paying growers Rs 100 per quintal for private storage in August 2026, adding a state subsidy to the rent decision in the largest belt.
- HyFun Foods plans to raise fry capacity to about 245,000 metric tons with a new North Gujarat plant, which should lift demand for processing-grade storage nearby.
Mid-size stores and Uttar Pradesh hold the largest shares
Why mid-size stores hold the largest capacity share
Based on capacity, the market is categorized into under 5,000 metric tons, 5,000–10,000 metric tons and over 10,000 metric tons. 5,000–10,000 Metric Tons led with 45.0% of 2025 value because the average Uttar Pradesh store holds about 6,070 metric tons, as derived from a Lok Sabha reply dated Feb. 11, 2025. Over 10,000 Metric Tons grows fastest at 5.49% a year as scale lowers unit cost, since IndianPotato.com puts a 10,000-metric-ton build at Rs 8,000–15,000 per metric ton against Rs 15,000–20,000 for a 100-metric-ton unit. West Bengal already averages about 11,500 metric tons per store on that official count.
Uttar Pradesh leads while Bihar has the widest storage gap
Based on producing state, the market is categorized into Uttar Pradesh, West Bengal, Punjab, Bihar and other states. Uttar Pradesh led with 40.0% of 2025 value because its Horticulture Department recorded 14.41 million metric tons stored in 2,207 private stores in April 2025, according to IndianPotato.com. Bihar grows fastest at 5.87% a year as its output far exceeds its refrigerated space, with 7.39 million metric tons harvested in 2024-25 against 1.49 million metric tons of capacity in the Lok Sabha count. In West Bengal, about 7.2 million metric tons sat in stores in February 2026, according to Millennium Post.
Rent dominates while pledge lending grows from a small base
Based on revenue, the market is categorized into storage rent and loans against produce. Storage Rent led with 88.0% of 2025 value because seasonal rent is the fee every depositor pays, and Amar Ujala reported Mainpuri rates of Rs 260 per quintal in January 2026 with Rs 280 expected. Loans Against Produce grow fastest at 5.79% a year as formal pledge credit widens, since the Warehousing Development and Regulatory Authority lists Kisan Credit Card pledge loans against electronic receipts at 7% for six months. A Rs 1,000 crore guarantee corpus launched in December 2024, according to Krishi Jagran, lowers lender risk on such receipts.
| Segment Group | Leading Sub-segment | Share, 2025 | Fastest-growing Sub-segment | CAGR, 2026–2035 |
|---|---|---|---|---|
| By Capacity | 5,000–10,000 Metric Tons | 45.0% | Over 10,000 Metric Tons | 5.49% |
| By Producing State | Uttar Pradesh | 40.0% | Bihar | 5.87% |
| By Revenue | Storage Rent | 88.0% | Loans Against Produce | 5.79% |
Request a Free Sample
Fill in your details and we'll send you a free sample report.
- Sample data tables & charts
- Research methodology
Harvest gluts and price gaps keep potato chambers in use
Potato clusters need temperature-controlled capacity
Potato belts need chilled space because the crop comes out within a few weeks and must last until the next harvest. India produced 58.57 million metric tons in 2024-25, up 2.66% on the year, according to final estimates approved on March 17, 2026, as reported by IndianPotato.com. An undated FAO technical paper notes that about 60 percent of Indian output is held in cold stores, which makes the crop the core load for these buildings. A Lok Sabha reply dated Feb. 11, 2025 counted 8,760 stores with 39.7 million metric tons of capacity across all commodities. Because stores cluster near fields, North India remains the largest revenue zone. In the Credence Research model this adds about 2.10 percentage points to annual growth to 2035.
Price seasonality supports paid potato warehousing
Storage earns its fee because potato prices at harvest usually sit well below prices several months later. In Bihar, wholesale prices averaged Rs 944 per quintal in April and Rs 1,772 in July during 2023-24, according to IndianPotato.com. In West Bengal, average market prices fell to about Rs 600 per quintal against a Rs 900 support price in the 2025 season, Millennium Post reported in February 2026, a gap that gives holders reason to wait for better rates. Uttar Pradesh set a market intervention price of Rs 650.09 per quintal in April 2026, according to Devdiscourse, which shows how low harvest rates can fall. In the Credence Research model this seasonality adds about 1.30 percentage points to annual growth to 2035.
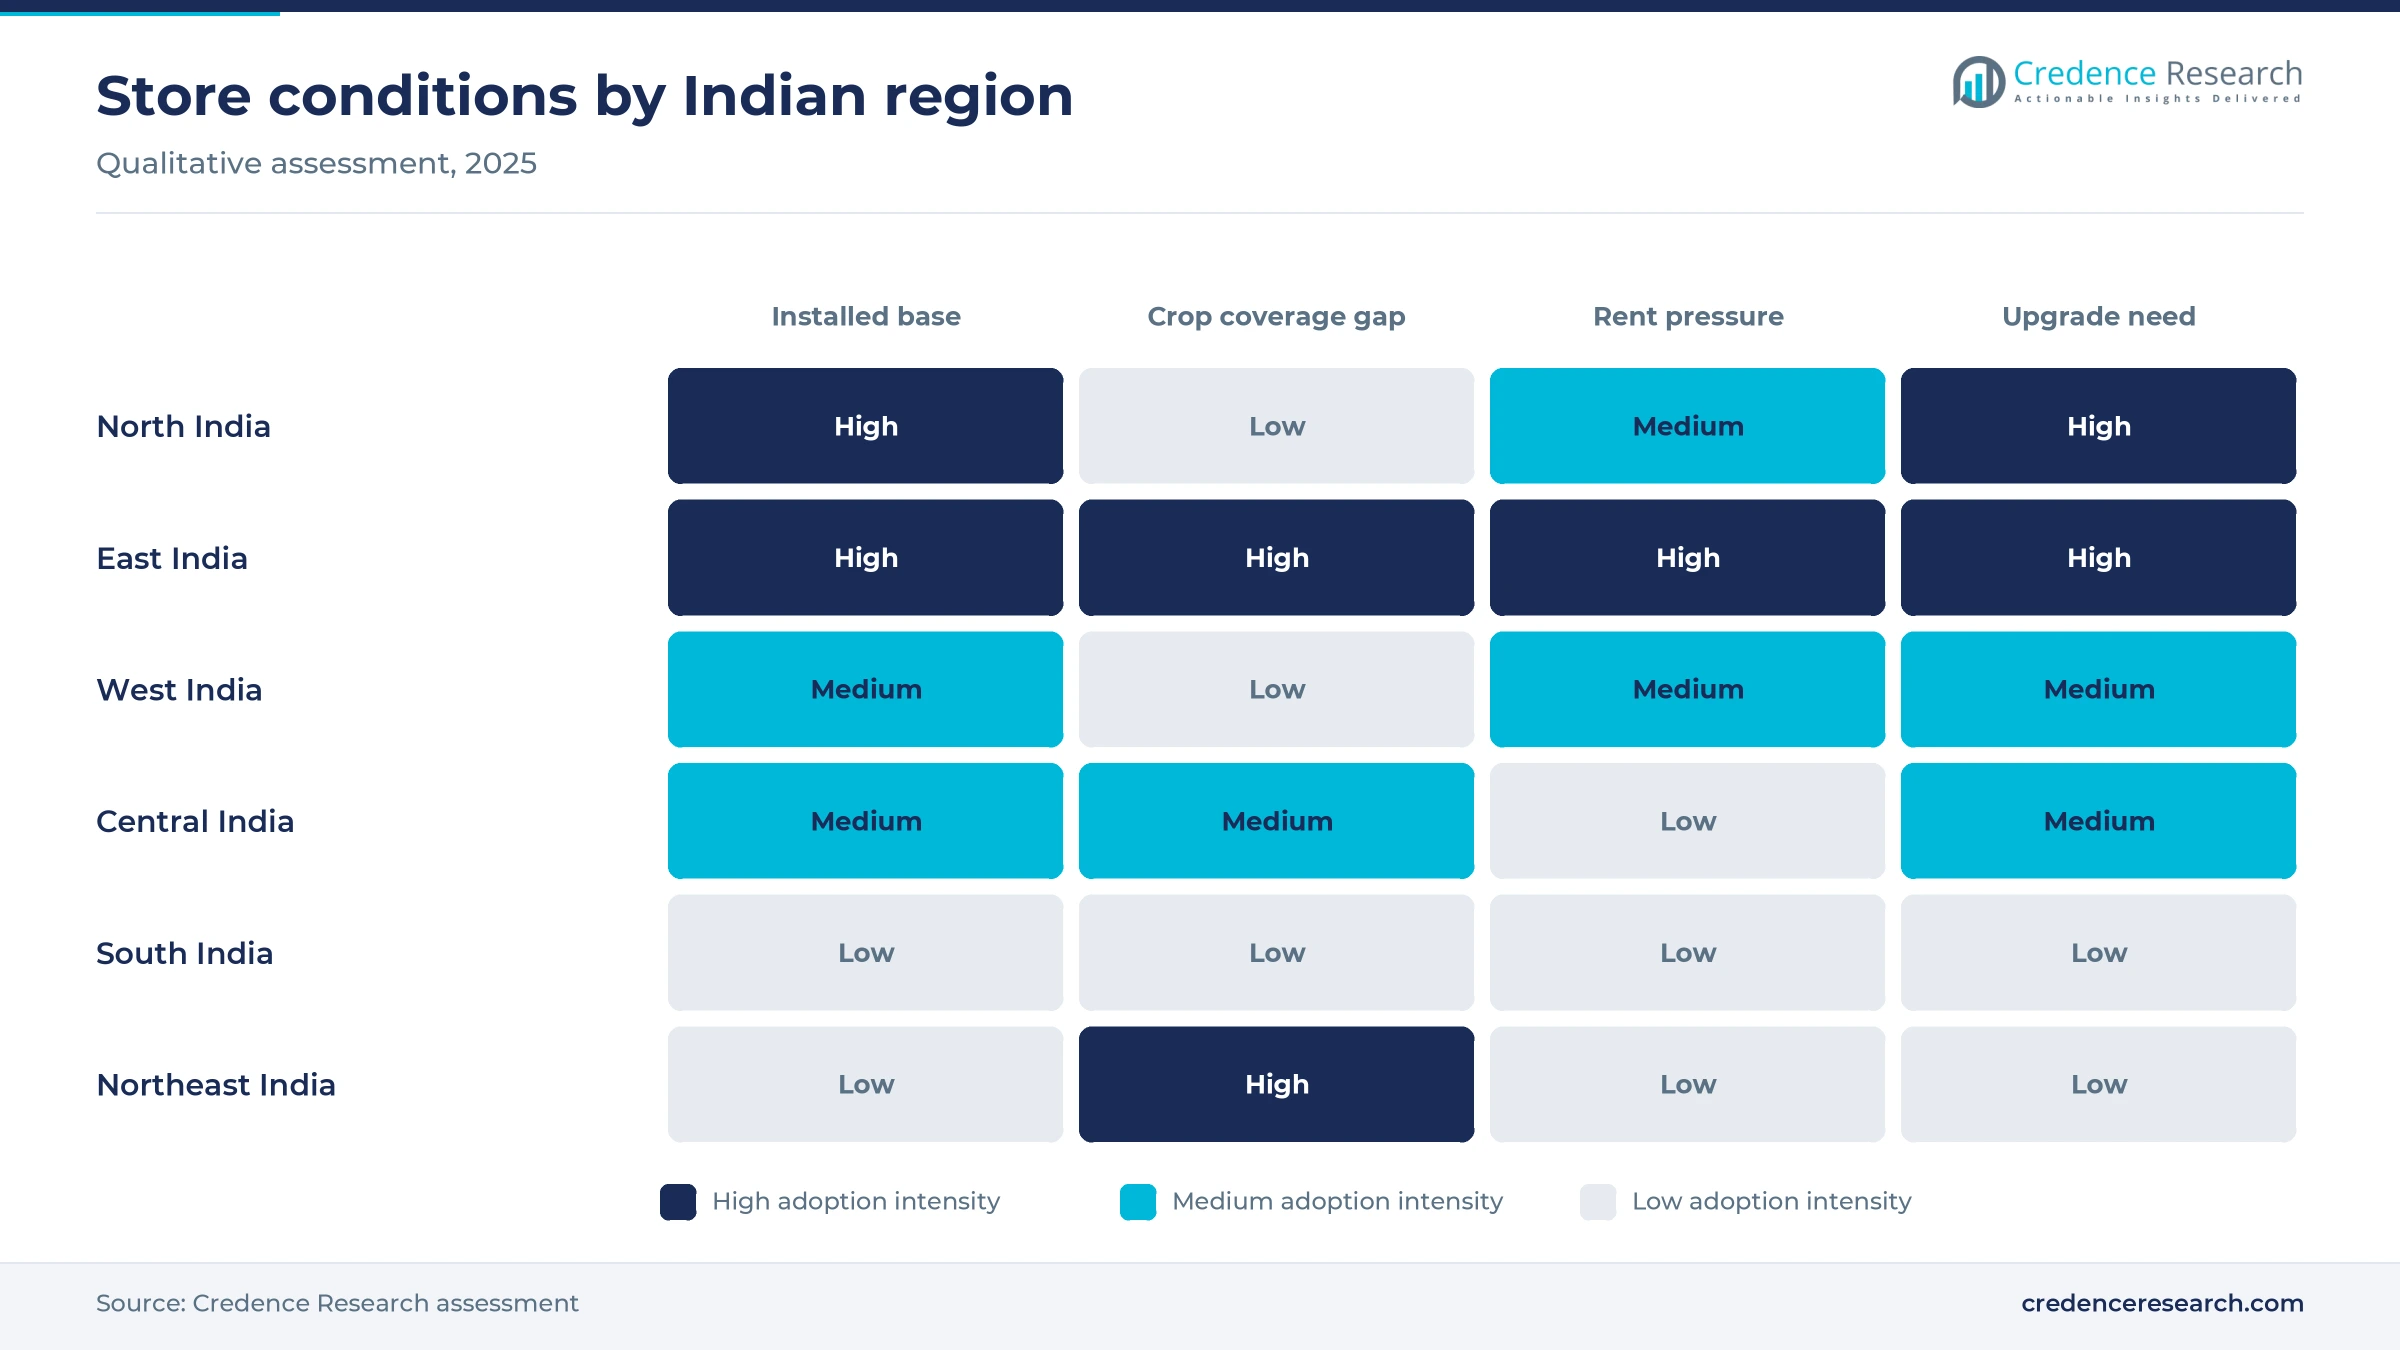
Insulation and energy upgrades cut store operating costs
Retrofits raise store margins because electricity is the largest recurring bill, at about 40–50% of operating expense, according to IndianPotato.com. The same source puts yearly operating cost at Rs 35–50 lakh for a 5,000-metric-ton store and reports savings of 25–30% from combining efficient compressors, fan drives, insulation and solar panels. A paper at the 2021 summer study of the European Council for an Energy Efficient Economy modeled a typical 5,000-metric-ton retrofit at Rs 233 lakh, with a Rs 95 lakh subsidy and a payback of about 1.6 years. Those retrofits rely on refrigeration machinery that owners buy from outside suppliers. In the Credence Research model these upgrades add about 0.85 percentage points to annual growth to 2035.
Central subsidies lower the capital cost of new chambers
Public capital support keeps new building viable even when rents are thin, because subsidies can cover a third or more of project cost. The National Horticulture Board pays 40% of project cost up to 5,000 metric tons and 35% from 5,000 to 10,000 metric tons in general areas, according to IndianPotato.com. The same source reports that the food processing ministry raised the allocation for its cold chain component to Rs 6,520 crore after approving another Rs 1,920 crore in July 2025. Agriculture Infrastructure Fund loans carry a 3% interest subvention for seven years on borrowing up to Rs 2 crore. As a result, stores built up to these subsidy limits stay attractive, and 5,000–10,000 Metric Tons held 45.0% of 2025 value.
State aid, rent disputes and fry plants are reshaping demand
Shift toward state-paid occupancy support in Uttar Pradesh
Uttar Pradesh has moved from occasional procurement toward direct payments tied to storage, which changes the economics for growers in the largest belt. CMV360 reported in August 2026 that the state will pay Rs 100 per quintal for potatoes held in private stores, capped at Rs 20,000 per farmer, with a token Rs 100 crore and about 1.5 million expected beneficiaries. A separate Rs 1,000 crore price stabilization fund covers 25% of production cost or the price gap, whichever is lower. This follows HOFED procurement centers ordered for 10 districts in April 2026, according to Devdiscourse. Because the aid offsets about a third of a Rs 260–280 rent, it should support occupancy in stores across North India.
Rising rent disputes are reshaping store pricing
Rents are rising unevenly, and the gap between regulated and open rates has become a recurring dispute. West Bengal stores charged Rs 168–172 per quintal against Rs 230–270 in neighboring states, according to Outlook Business in February 2024, when owners threatened a strike over the tariff. An expert committee later proposed Rs 190–194, though it awaited state approval in February 2025, IndianPotato.com reported. Madhya Pradesh operators around Indore charged Rs 240 for the February to October 2025 season, about 2% more than a year earlier. Mainpuri rates were expected to climb from Rs 260 to Rs 280 in 2026, Amar Ujala reported, though the Bharatiya Kisan Union said it would oppose any increase in rent there.
Processing-grade storage opening near Gujarat fry plants
Processors create an opening for stores that can hold fry varieties at managed temperatures, because these buyers need supply long after harvest. PotatoBusiness reported in March 2026 that HyFun Foods plans a roughly USD 108 million North Gujarat plant, lifting its capacity for frozen fries from about 110,000 to about 245,000 metric tons a year. Production is due to start with the January 2027 harvest. Gujarat already had 1,023 stores with 4.04 million metric tons of capacity in the Lok Sabha count of early 2025, while IndianPotato.com put utilization there at 45–55% in March 2026. West India grows at 5.44% a year in the Credence Research model, ahead of the national rate.
Opening for solar-backed small stores in Punjab and Assam
Small renewable-powered units offer an opening where grid-linked stores are scarce and growers lack nearby space. The Climate and Clean Air Coalition lists a 2026 project with the Punjab State Council for Science and Technology that plans four pilot units in four districts, operated by farmer groups. Ministry of New and Renewable Energy guidelines reported by KS&K in March 2025 define off-grid solar-powered chambers of 2 to 20 metric tons with 48 hours of thermal backup. In Assam, a reply in the state assembly dated July 15, 2026, offered 50% aid for cold stores under the HMNEH scheme, with only 12,500 metric tons near Barpeta for Mandia growers.
Price crashes and capped rents test store finances
Price crashes leave depositors unable to pay
A glut can turn stored potatoes into a loss, which puts rent collection at risk for store owners. The West Bengal association estimated losses above Rs 2,200 crore on preserved stock in February 2026, according to Millennium Post. FreshPlaza reported in March 2026 that Kannauj growers faced delivered costs of Rs 1,340–1,380 per quintal against mandi rates near Rs 800. Owners respond by pressing the state for support, as the association did in talks that month, although aid rarely covers the whole loss.
Idle chambers weigh on fixed costs in surplus years
Unused capacity hurts because plant, debt and power costs continue whatever the loading level is. Uttar Pradesh stores reached 74.88% utilization in April 2025, leaving 4.83 million metric tons of space empty against 19.24 million metric tons of capacity in that count, according to state horticulture data cited by IndianPotato.com. The Federation of Cold Storage Association warned in January 2019 that 200 to 300 stores in the state could close. Smaller owners are the most exposed, since their fixed costs fall on fewer paying packets in a weak season.
Regulated rents limit recovery of rising costs
State control over rent delays cost recovery, especially in West Bengal, where rates stayed unchanged for four years up to February 2025, according to IndianPotato.com. Licensed stores there also follow a Nov. 30 release deadline under the 1967 rules, and The Statesman reported that an extension to Dec. 31 carried set rent of Rs 20.22 to Rs 20.66 per quintal. Owners therefore absorb wage and power increases between revisions, which leaves less cash for retrofits and maintenance.
Stock-backed lending carries bad-loan risk
Loans against stored potatoes can sour when prices fall below the amount advanced to growers and traders. Krishi Jagran reported in January 2019 that many such loans in Uttar Pradesh, West Bengal, Bihar and Gujarat had become non-performing after prices collapsed. Formal receipts offer a partial answer, since the warehousing regulator describes a usual 25% margin and a 12-month limit. However, informal store lending remains common, so owners still carry credit risk alongside their ordinary rent risk.
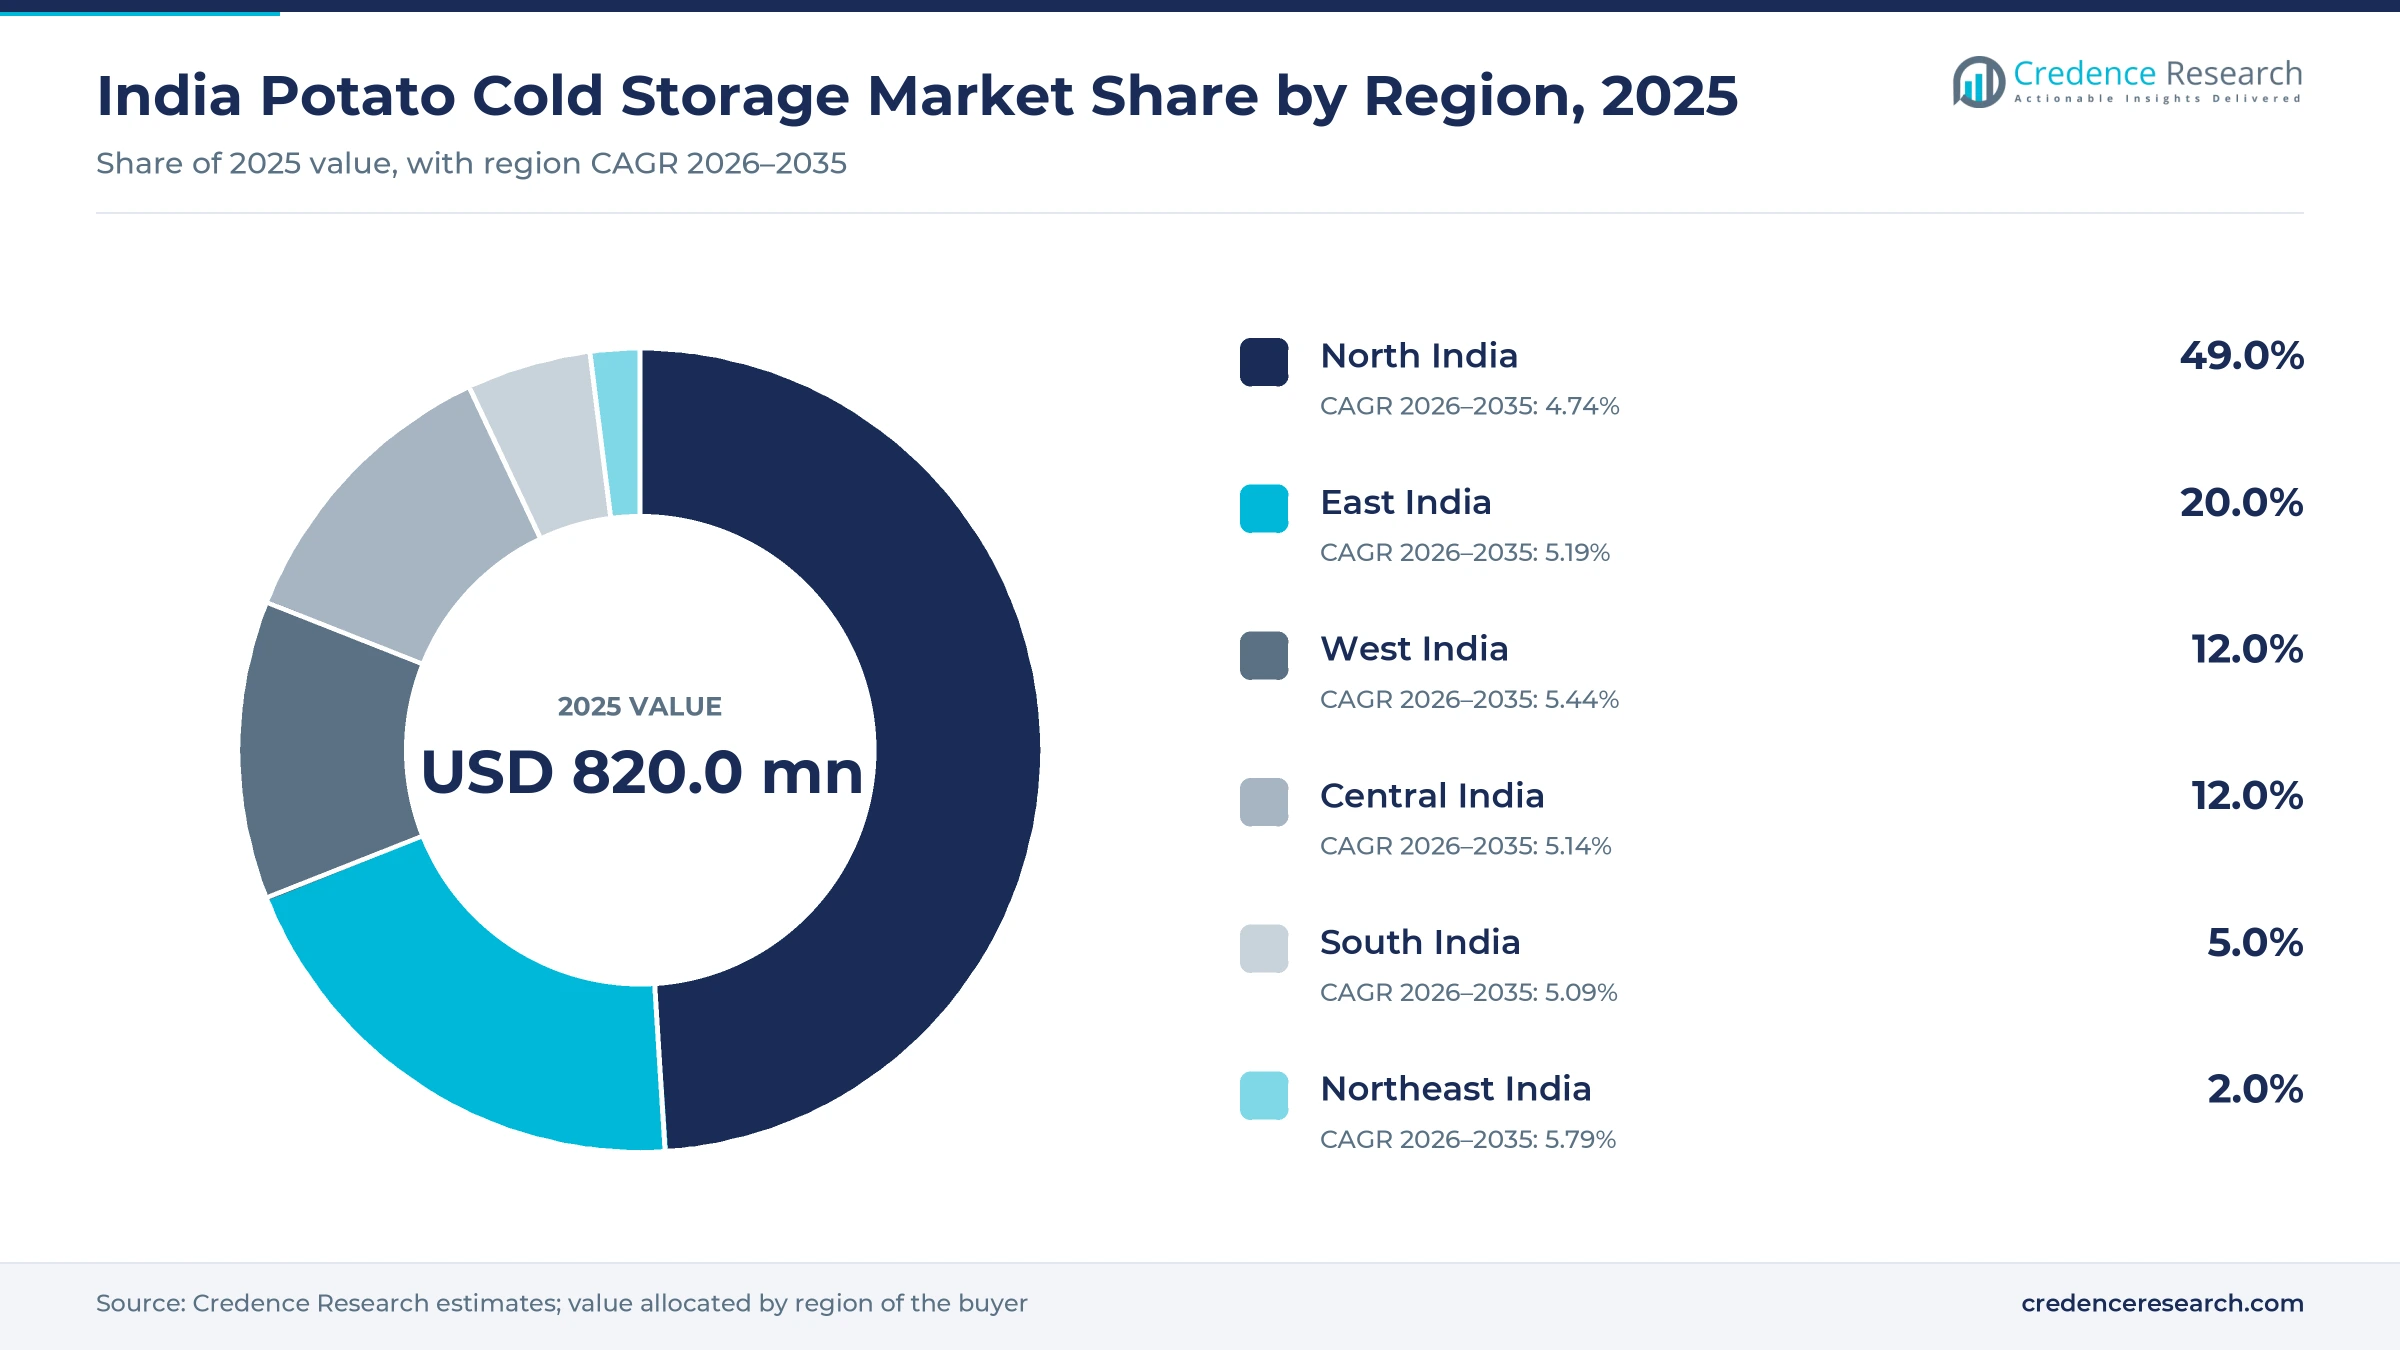
North India leads while Bihar and the Northeast stay short
| Region | Value, 2025 (USD million) | Share, 2025 | CAGR, 2026–2035 |
|---|---|---|---|
| North India | 401.8 | 49.0% | 4.74% |
| East India | 164.0 | 20.0% | 5.19% |
| West India | 98.4 | 12.0% | 5.44% |
| Central India | 98.4 | 12.0% | 5.14% |
| South India | 41.0 | 5.0% | 5.09% |
| Northeast India | 16.4 | 2.0% | 5.79% |
North India holds the deepest store network
North India held 49.0% of 2025 value and grows at 4.74% a year in the India potato cold storage market. Growth runs below the national rate because the base is already large. Uttar Pradesh reported 2,488 stores with 15.1 million metric tons in the Lok Sabha count, while Punjab reported 770 stores with 2.6 million metric tons. Farrukhabad stores were 25–45% loaded in early March 2026, IndianPotato.com reported, and Agra will host the South Asia center of the International Potato Center, approved by the Cabinet on June 25, 2025.
East India pairs large Bengal plants with a Bihar gap
East India held 20.0% of 2025 value and grows at 5.19% a year across its potato store network. West Bengal and Bihar pull in different directions across the zone. West Bengal reported 517 stores with 5.95 million metric tons in the Lok Sabha count, and Millennium Post expected state output near 14 million metric tons in the 2026 season. Bihar reported only 316 stores with 1.49 million metric tons, against a 2024-25 harvest of 7.39 million metric tons, which leaves much of its crop outside refrigeration.
West India gains from processor demand in Gujarat
West India held 12.0% of 2025 value and grows at 5.44% a year, because Gujarat pairs a large store base with new processing investment. The state counted 1,023 stores with 4.04 million metric tons in the Lok Sabha reply, the third-largest figure in the country. HyFun Foods expects its new North Gujarat plant to begin production with the January 2027 harvest, according to PotatoBusiness, which should raise demand for long-season holding nearby.
Central India shows high occupancy around Indore
Central India held 12.0% of 2025 value and grows at 5.14% a year in the potato store market. The Malwa belt around Indore and Ujjain supports that pace. Madhya Pradesh reported 320 stores with 1.38 million metric tons in the Lok Sabha count, a modest base for a state among the top five producers. The Cold Chain Association of Indore reported rent of Rs 240 per quintal and occupancy near 90% in the 2025 season, IndianPotato.com noted, which gives owners firmer pricing than most other belts.
South India remains a small, mixed-use store base
South India held 5.0% of 2025 value and grows at 5.09% a year in the potato store market. The zone sits outside the main potato belts of the country. Karnataka reported 268 stores with 912,417 metric tons in the Lok Sabha count, the largest figure used for this zone in the model. No southern state appears among the top five producers listed by IndianPotato.com, which together account for about 80–85% of output, so local potato storage demand stays limited.
Northeast India grows fastest from a very thin base
Northeast India held 2.0% of 2025 value and grows at the fastest pace in the model, because the region has so little space today. Assam reported 43 stores with 206,742 metric tons and Meghalaya reported four stores with 8,200 metric tons in the Lok Sabha count. A state assembly reply dated July 15, 2026, linked distress sales around Mandia to harvest gluts and pointed to half-cost aid under the HMNEH scheme for new stores.
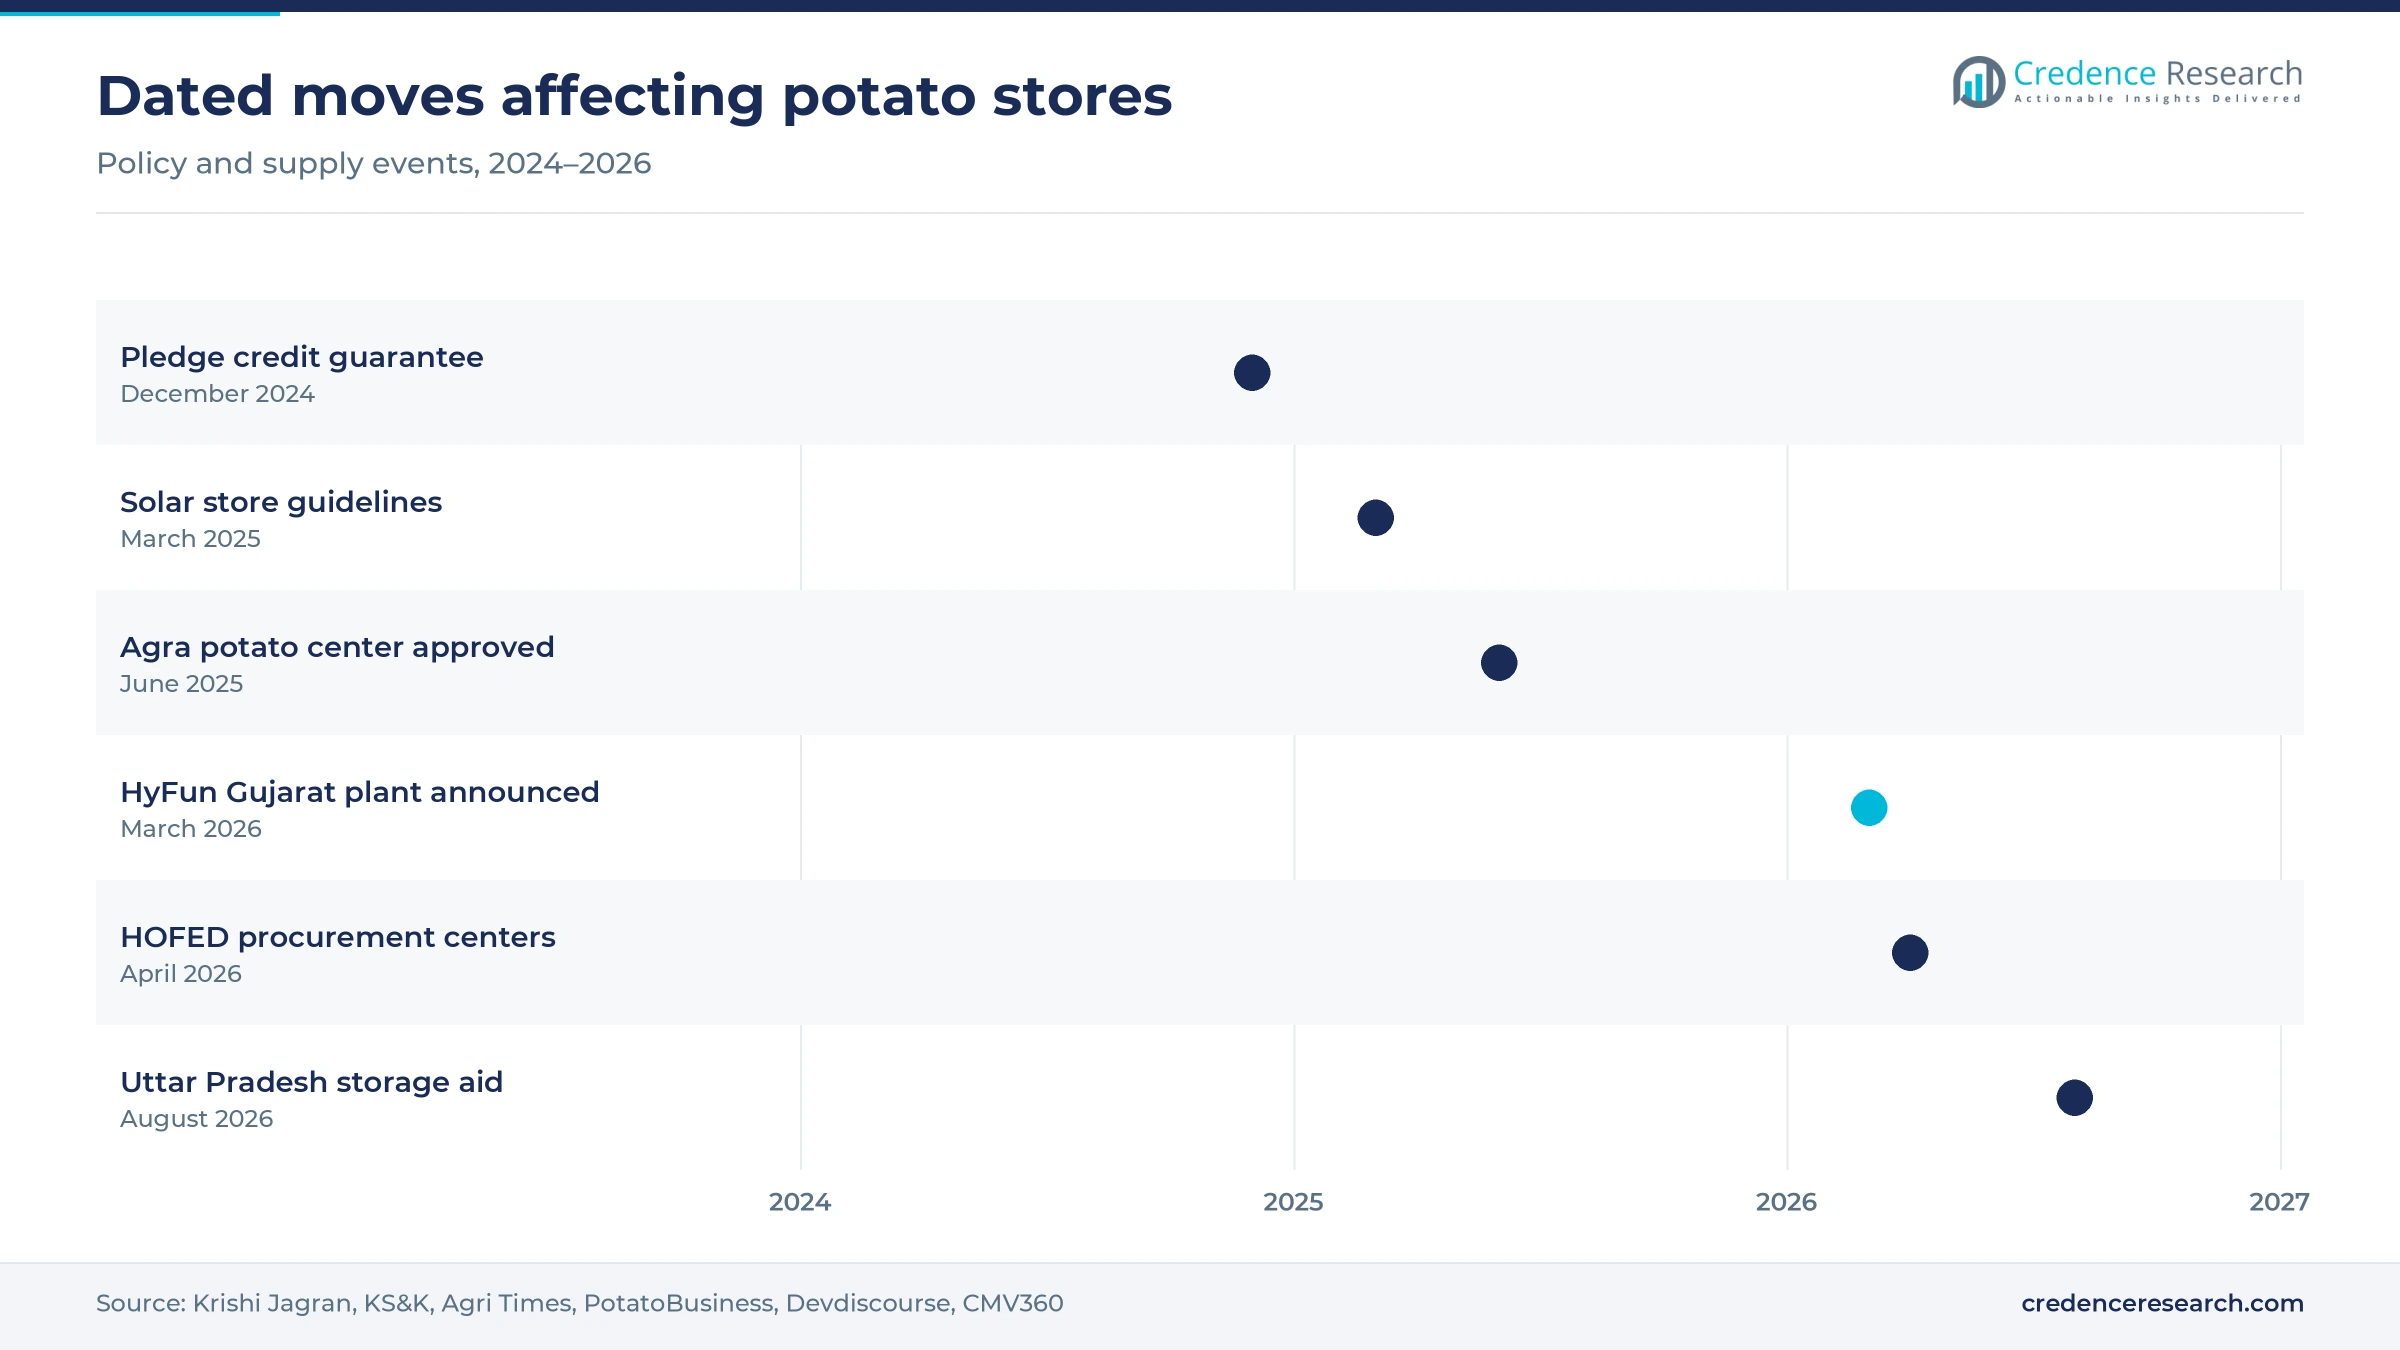
Policy and processing moves from 2024 to 2026
| Development | Status and market relevance |
|---|---|
| In December 2024, the central government launched a Rs 1,000 crore credit guarantee for pledge loans against electronic warehouse receipts, according to Krishi Jagran. | In force, widens formal credit for registered receipts |
| In June 2025, the Union Cabinet approved a South Asia center of the International Potato Center at Singna, Agra, with Rs 111.5 crore of support, Agri Times reported. | Approved, targets post-harvest losses and varieties |
| In March 2026, HyFun Foods announced a roughly USD 108 million frozen potato plant in North Gujarat, PotatoBusiness reported. | Due to start with the January 2027 harvest |
| In April 2026, Uttar Pradesh directed HOFED to open potato procurement centers in 10 districts at Rs 650.09 per quintal, according to Devdiscourse. | Started in phases, sets a floor in a glut year |
| In August 2026, Uttar Pradesh launched assistance of Rs 100 per quintal for storage in private stores, CMV360 reported. | Open through a state portal for 2026-27 |
Ammonia plants and insulation decide running costs
- Ammonia refrigeration remains the standard for large Indian potato stores, according to IndianPotato.com, and it requires fire and safety clearances that small owners must plan for.
- Polyurethane foam panels are the usual wall and ceiling insulation, and with sensor-based temperature tracking they help owners hold chambers within narrow limits through summer.
- Thermal energy backup gives off-grid units 48 hours of autonomy under guidelines reported by KS&K in March 2025, which suits small lots of 2 to 20 metric tons.
- Electronic negotiable receipts let registered warehouses support bank pledge loans through two repositories named by the Warehousing Development and Regulatory Authority, NERL and CCRL.
Need a Custom Version of This Report?
Tailor the scope, geography, or segments to your exact requirements.
- Custom geography or segment scope
- Direct access to our analyst team
Thousands of local owners buy from a few equipment makers
Ownership is highly fragmented, with thousands of private, family-run stores competing inside short trucking distances of the fields. Uttar Pradesh horticulture data cited by IndianPotato.com counted 2,207 private units, and Mainpuri district alone has about 55 to 60 stores, according to Amar Ujala. Because rent is local and often regulated, these owners compete on loading dates, weight loss, credit to depositors and how quickly stock is released. Associations carry much of the bargaining with state governments, as the West Bengal Cold Storage Association did over tariffs in 2024. Equipment suppliers form a separate, more concentrated layer, with Kirloskar Pneumatic known for ammonia compressors. Large processors such as HyFun Foods add a third source of demand through their own raw material needs.
Companies profiled and their roles in this market
| Company | Type | Role in the market |
|---|---|---|
| Kirloskar Pneumatic | Equipment supplier | Indian maker of Khione ammonia screw compressors, with a long record in potato stores |
| HyFun Foods | Processor and buyer | Building a North Gujarat fry plant that raises demand for processing-grade holding |
| HOFED | State procurement federation | Ordered to run potato procurement centers in 10 Uttar Pradesh districts in April 2026 |
| West Bengal Cold Storage Association | Owner association | Negotiates rent tariffs with the state on behalf of licensed stores |
| Cold Chain Association of Indore | Owner association | Publishes seasonal rent schedules for the Indore and Ujjain belt |
Rent discipline will matter more than new chambers
Credence Research's view is that this market will reward owners who protect occupancy and margin rather than those who only add chambers. National capacity is expected to rise only about 2.2% a year to 2031, according to a September 2025 NCCD projection cited by the International Institute of Refrigeration. Market revenue growth of 5.00% a year therefore depends on rent revision and on lower losses inside older buildings. The strongest cases are retrofits in Uttar Pradesh and West Bengal, new chambers in Bihar and processing-grade holding in Gujarat. Owners relying on stock-backed lending should watch prices closely, since a single glut year can erase several seasons of interest income.
How the rent-based market model was built
The report uses 2025 as the base year and forecasts to 2035. Market values come from the Credence Research model, checked against stored volume multiplied by published rents per quintal. Segment and regional splits are Credence Research estimates informed by Lok Sabha capacity data, state horticulture counts and regional rent reports. Sources used include government replies, regulator pages, FAO material, trade press and company announcements. No interviews or surveys were conducted in preparing this report.
Value grows faster than capacity through 2035
Revenue is forecast to reach USD 1.33 billion by 2035, with rent increases and fuller chambers doing more of the work than new construction. North India should remain the largest region, although its share slips as East India, West India and Northeast India add stores and processor contracts. Uttar Pradesh aid of Rs 100 per quintal, introduced in 2026, will test whether direct support steadies market demand for storage over several seasons. Formal pledge lending and solar-backed small units are likely to grow from low bases, while glut years will continue to produce sharp swings in rent recovery and store viability.
Frequently Asked Questions
How big is the India potato cold storage market?
Which region leads the market?
Which capacity class is largest?
How do store owners earn revenue?
What rent do Indian potato stores charge?
What did Uttar Pradesh announce for potato storage in 2026?
Why does Bihar grow fastest among the named states?
What is the largest risk for store owners?
Table of Content
Chapter 1 Market Segmentation
- 1.1 Segmentation Framework
- 1.1.1 Product and Service Classification
- 1.1.2 Application and End-Use Classification
- 1.1.3 Technology and Solution Classification
- 1.1.4 Customer and Distribution Channel Classification
- 1.1.5 Geographic Segmentation
- 1.1.6 Market Segment Definitions and Boundaries
- 1.2 By Capacity
- 1.2.1 5,000–10,000 Metric Tons
- 1.2.2 Over 10,000 Metric Tons
- 1.2.3 Under 5,000 Metric Tons
- 1.3 By Producing State
- 1.3.1 Uttar Pradesh
- 1.3.2 West Bengal
- 1.3.3 Punjab
- 1.3.4 Bihar
- 1.3.5 Other States
- 1.4 By Revenue
- 1.4.1 Storage Rent
- 1.4.2 Loans Against Produce
Chapter 2 Introduction
- 2.1 Report Objectives and Scope
- 2.2 Product Definition and Industry Terminology
- 2.3 Market Inclusions and Exclusions
- 2.4 Research Process
- 2.4.1 Primary Research and Expert Interviews
- 2.4.2 Secondary Research and Source Review
- 2.4.3 Top-Down and Bottom-Up Estimation
- 2.4.4 Data Triangulation and Verification
- 2.5 Market Size Measurement Basis
- 2.5.1 2025: USD 820.0 million → 2035: USD 1.33 billion
- 2.6 Historical and Forecast Reference Periods
- 2.6.1 Historical Period: 2018-2025
- 2.6.2 Base Year: 2025
- 2.6.3 Forecast Period: 2025-2035
- 2.7 Research Assumptions and Limitations
Chapter 3 Executive Summary
- 3.1 Market Snapshot and Key Findings
- 3.2 Base-Year Market Size, 2025
- 3.3 Forecast Market Size, 2035
- 3.4 Revenue and Volume Growth Outlook
- 3.5 Key Demand and Supply Indicators
- 3.6 Leading Market Segments
- 3.7 Fastest-Growing Market Opportunities
- 3.8 Regional Performance Highlights
- 3.9 Technology and Industry Transformation
- 3.10 Competitive Landscape Summary
- 3.11 Analyst View and Strategic Implications
Chapter 4 India Potato Cold Storage Market Trends and Developments
- 4.1 Historical Industry Development, 2018-2025
- 4.2 Recent Market Trends and Developments
- 4.3 Demand and Customer Behavior Trends
- 4.4 Technology and Product Innovation
- 4.5 Artificial Intelligence, Automation and Digitalization
- 4.6 Local Manufacturing and Supply Chain Realignment
- 4.7 Industry Partnerships, Mergers and Acquisitions
- 4.8 Sustainability and Circular Economy Developments
- 4.9 Government and Private Sector Investment Trends
- 4.10 Emerging Business Models and Commercialization
- 4.11 Industry Developments and Announcements
Chapter 5 India Potato Cold Storage Market Production, Supply and Demand Analysis
- 5.1 Demand Trend and Consumption Analysis, 2018-2025
- 5.2 Demand Forecast, 2025-2035
- 5.3 Production and Output Trend, 2018-2025
- 5.4 Production and Output Forecast, 2025-2035
- 5.5 Installed Capacity and Capacity Utilization
- 5.6 Company-Wise Production Plants and Statistics
- 5.6.1 Installed Production Capacity
- 5.6.2 Actual Production
- 5.6.3 Planned Capacity and Expansion Targets
- 5.7 Supply Chain Structure and Procurement Trends
- 5.8 Supply-Demand Gap and Bottlenecks
- 5.9 Import Dependence and Sourcing Structure
- 5.10 Contract Manufacturing and Outsourcing
- 5.11 Regional Supply and Demand Concentration
Chapter 6 India Potato Cold Storage Market Pricing Analysis
- 6.1 Pricing Structure and Measurement
- 6.2 Historical Pricing Trends, 2018-2025
- 6.3 Pricing Outlook, 2025-2035
- 6.4 Average Selling Price and Unit Economics
- 6.5 Pricing by Product and Market Segment
- 6.6 Geographic Pricing Differences
- 6.7 Key Input, Energy, Labor and Logistics Costs
- 6.8 Contract Pricing and Purchasing Models
- 6.9 Pricing Sensitivity and Competitive Positioning
- 6.10 Price, Margin and Profitability Implications
Chapter 7 India Potato Cold Storage Market Dynamics
- 7.1 Market Growth Drivers
- 7.1.1 Demand-Side Drivers
- 7.1.2 Technology and Innovation Drivers
- 7.1.3 Infrastructure and Investment Drivers
- 7.1.4 Regulatory and Policy Drivers
- 7.2 Market Restraints
- 7.2.1 Cost and Affordability Constraints
- 7.2.2 Technology and Adoption Barriers
- 7.2.3 Supply Chain and Operational Constraints
- 7.3 Market Challenges
- 7.3.1 Competitive Pressure and Margin Erosion
- 7.3.2 Skills, Infrastructure and Implementation Gaps
- 7.4 Emerging Market Opportunities
- 7.5 Market Dynamics Impact and Time-Horizon Assessment
Chapter 8 India Potato Cold Storage Value Chain Analysis
- 8.1 Industry Value Chain Overview
- 8.2 Upstream Suppliers and Critical Inputs
- 8.3 Technology and Component Providers
- 8.4 Manufacturing or Service Delivery
- 8.5 Distribution, Channel Partners and Integrators
- 8.6 Downstream Applications and End Users
- 8.7 Value Addition and Profit Pools
- 8.8 Vertical Integration and Outsourcing
- 8.9 Supplier Concentration and Risk
- 8.10 Supply Chain Localization and Resilience
Chapter 9 India Potato Cold Storage Market Regulations and Policies
- 9.1 Relevant Laws, Standards and Compliance Frameworks
- 9.2 Product, Service, Safety and Quality Requirements
- 9.3 Government Policies, Incentives and Subsidies
- 9.4 Imports, Exports and Trade Barriers
- 9.5 Public Procurement and Local Content Requirements
- 9.6 Environmental and Sustainability Compliance
- 9.7 Upcoming Policy Changes and Market Implications
Chapter 10 India Potato Cold Storage Market Hotspots and Opportunities
- 10.1 Market Opportunity Mapping and Growth Hotspots
- 10.2 High-Growth Applications and Customer Groups
- 10.3 Underserved Markets and White-Space Opportunities
- 10.4 Emerging Technology and Product Opportunities
- 10.5 New Capacity and Investment Hotspots
- 10.6 Market Entry and Expansion Opportunities
- 10.7 Distribution and Partnership Opportunities
- 10.8 Near-Term and Long-Term Commercial Potential
- 10.9 Opportunity Attractiveness and Execution Risks
Chapter 11 India Potato Cold Storage Market Outlook, 2025-2035
- 11.1 Market Size and Analysis
- 11.1.1 Revenue (Market Measurement: 2025: USD 820.0 million → 2035: USD 1.33 billion)
- 11.1.2 Market Volume and Quantity Sold
- 11.1.3 Historical Market Size, 2018-2025
- 11.1.4 Base-Year Market Size, 2025
- 11.2 Market Forecast, 2025-2035
- 11.2.1 Revenue Forecast to 2035
- 11.2.2 Volume Forecast to 2035
- 11.2.3 CAGR and Year-on-Year Growth
- 11.2.4 Incremental Revenue Opportunity
- 11.3 Forecast Assumptions and Scenario Analysis
- 11.3.1 Base-Case Forecast
- 11.3.2 Optimistic and Conservative Scenarios
- 11.3.3 Technology, Pricing and Policy Sensitivities
- 11.4 Market Attractiveness and Growth Outlook
Chapter 12 India Potato Cold Storage Market Segmentation and Outlook
- 12.1 Segmentation Summary and Market Shares, 2025
- 12.2 Largest and Fastest-Growing Segments
- 12.3 By Capacity - Market Size and Forecast, 2025-2035
- 12.3.1 Segment Definition and Scope
- 12.3.2 Historical Market Size, 2018-2025
- 12.3.3 Revenue Forecast, 2025-2035
- 12.3.4 Volume Forecast, 2025-2035
- 12.3.5 Base-Year Market Share, 2025
- 12.3.6 Segment CAGR and Growth Drivers
- 12.3.7 Subsegment Market Size and Forecast
- 12.3.7.1 5,000–10,000 Metric Tons
- 12.3.7.2 Over 10,000 Metric Tons
- 12.3.7.3 Under 5,000 Metric Tons
- 12.3.8 Subsegment Pricing and Adoption Trends
- 12.3.9 Leading Suppliers and Competition
- 12.3.10 Regional Demand and Opportunities
- 12.4 By Producing State - Market Size and Forecast, 2025-2035
- 12.4.1 Segment Definition and Scope
- 12.4.2 Historical Market Size, 2018-2025
- 12.4.3 Revenue Forecast, 2025-2035
- 12.4.4 Volume Forecast, 2025-2035
- 12.4.5 Base-Year Market Share, 2025
- 12.4.6 Segment CAGR and Growth Drivers
- 12.4.7 Subsegment Market Size and Forecast
- 12.4.7.1 Uttar Pradesh
- 12.4.7.2 West Bengal
- 12.4.7.3 Punjab
- 12.4.7.4 Bihar
- 12.4.7.5 Other States
- 12.4.8 Subsegment Pricing and Adoption Trends
- 12.4.9 Leading Suppliers and Competition
- 12.4.10 Regional Demand and Opportunities
- 12.5 By Revenue - Market Size and Forecast, 2025-2035
- 12.5.1 Segment Definition and Scope
- 12.5.2 Historical Market Size, 2018-2025
- 12.5.3 Revenue Forecast, 2025-2035
- 12.5.4 Volume Forecast, 2025-2035
- 12.5.5 Base-Year Market Share, 2025
- 12.5.6 Segment CAGR and Growth Drivers
- 12.5.7 Subsegment Market Size and Forecast
- 12.5.7.1 Storage Rent
- 12.5.7.2 Loans Against Produce
- 12.5.8 Subsegment Pricing and Adoption Trends
- 12.5.9 Leading Suppliers and Competition
- 12.5.10 Regional Demand and Opportunities
- 12.6 Segment Growth Comparison
- 12.7 Segment Attractiveness and Priority Matrix
Chapter 13 India Potato Cold Storage Geographic Market Outlook, 2025-2035
- 13.1 Domestic Market Distribution and Demand Clusters
- 13.2 State- or Province-Wise Market Size and Forecast, 2025-2035
- 13.3 City and Metropolitan Market Outlook
- 13.4 Industrial, Manufacturing and Commercial Clusters
- 13.5 Geographic Concentration of Key End Users
- 13.6 Local Pricing and Purchasing Differences
- 13.7 Domestic Production Facilities and Capacity Map
- 13.8 Local Infrastructure and Project Pipeline
- 13.9 State-Level Policy and Incentive Differences
- 13.10 Subnational Investment Hotspots and Opportunities
- 13.11 Distribution and Logistics Networks
- 13.12 Domestic Competitive Footprint
Chapter 14 India Potato Cold Storage Technology, Innovation and Sustainability Outlook
- 14.1 Technology Landscape and Maturity
- 14.2 Product, Process and Service Innovation
- 14.3 AI, Automation and Digital Tools in the Industry
- 14.4 Technology Adoption and Performance Benchmarking
- 14.5 Innovation Pipeline and R&D Investment
- 14.6 Patent and Intellectual Property Trends
- 14.7 Energy Efficiency and Resource Management
- 14.8 Sustainability, Recycling and Circularity
- 14.9 Technology Roadmap, 2025-2035
- 14.10 Risks of Obsolescence and Technology Substitution
Chapter 15 India Potato Cold Storage Market Key Strategic Imperatives
- 15.1 Growth and Market Entry Priorities
- 15.2 High-Return Products and Segments
- 15.3 Pricing, Profitability and Cost Optimization
- 15.4 Technology Investment and Product Differentiation
- 15.5 Supply Chain Localization and Resilience
- 15.6 Distribution and Customer Acquisition
- 15.7 Partnership, Acquisition and Capacity Strategy
- 15.8 Regional Expansion Priorities
- 15.9 Short-, Medium- and Long-Term Actions
Chapter 16 Competition Outlook
- 16.1 Industry Competition Characteristics
- 16.2 Market Structure and Concentration
- 16.3 Market Share and Competitive Positioning, 2025
- 16.4 Company-Wise Revenue and Product Benchmarking
- 16.5 Production and Service Capacity Benchmarking
- 16.6 Technology, Pricing and Differentiation
- 16.7 Regional Footprint and Distribution Strength
- 16.8 Mergers, Acquisitions and Strategic Alliances
- 16.9 New Entrants and Competitive Threats
- 16.10 Porter's Five Forces and Industry Attractiveness
- 16.11 Competitive Outlook, 2025-2035
Chapter 17 Company Profiles
- 17.1 Company Coverage and Selection Criteria
- 17.2 Kirloskar Pneumatic
- 17.2.1 Business Description
- 17.2.2 Company Ownership and Geographic Presence
- 17.2.3 Product and Service Portfolio
- 17.2.4 Manufacturing and Operating Footprint
- 17.2.5 Production Capacity and Expansion Plans
- 17.2.6 Financial Performance and Investment
- 17.2.7 Market Share and Competitive Position
- 17.2.8 Technology and Innovation Capabilities
- 17.2.9 Strategic Alliances or Partnerships
- 17.2.10 Recent Developments
- 17.2.11 Growth Strategy and Outlook
- 17.3 HyFun Foods
- 17.4 HOFED
- 17.5 West Bengal Cold Storage Association
- 17.6 Cold Chain Association of Indore
- 17.7 Other Relevant Market Participants
Note: Every listed company is profiled on the structure shown under the first company. The company list is preliminary and may change based on research findings, market developments, data availability and client requirements.
Chapter 18 Disclaimer
- 18.1 Research and Forecast Disclaimer
- 18.2 Data Source and Estimation Limitations
Note: The depth of individual sections depends on data availability for this market. Volume, capacity, trade and other unit-based metrics are included where applicable.

