
Small farms and price gaps sustain resale demand
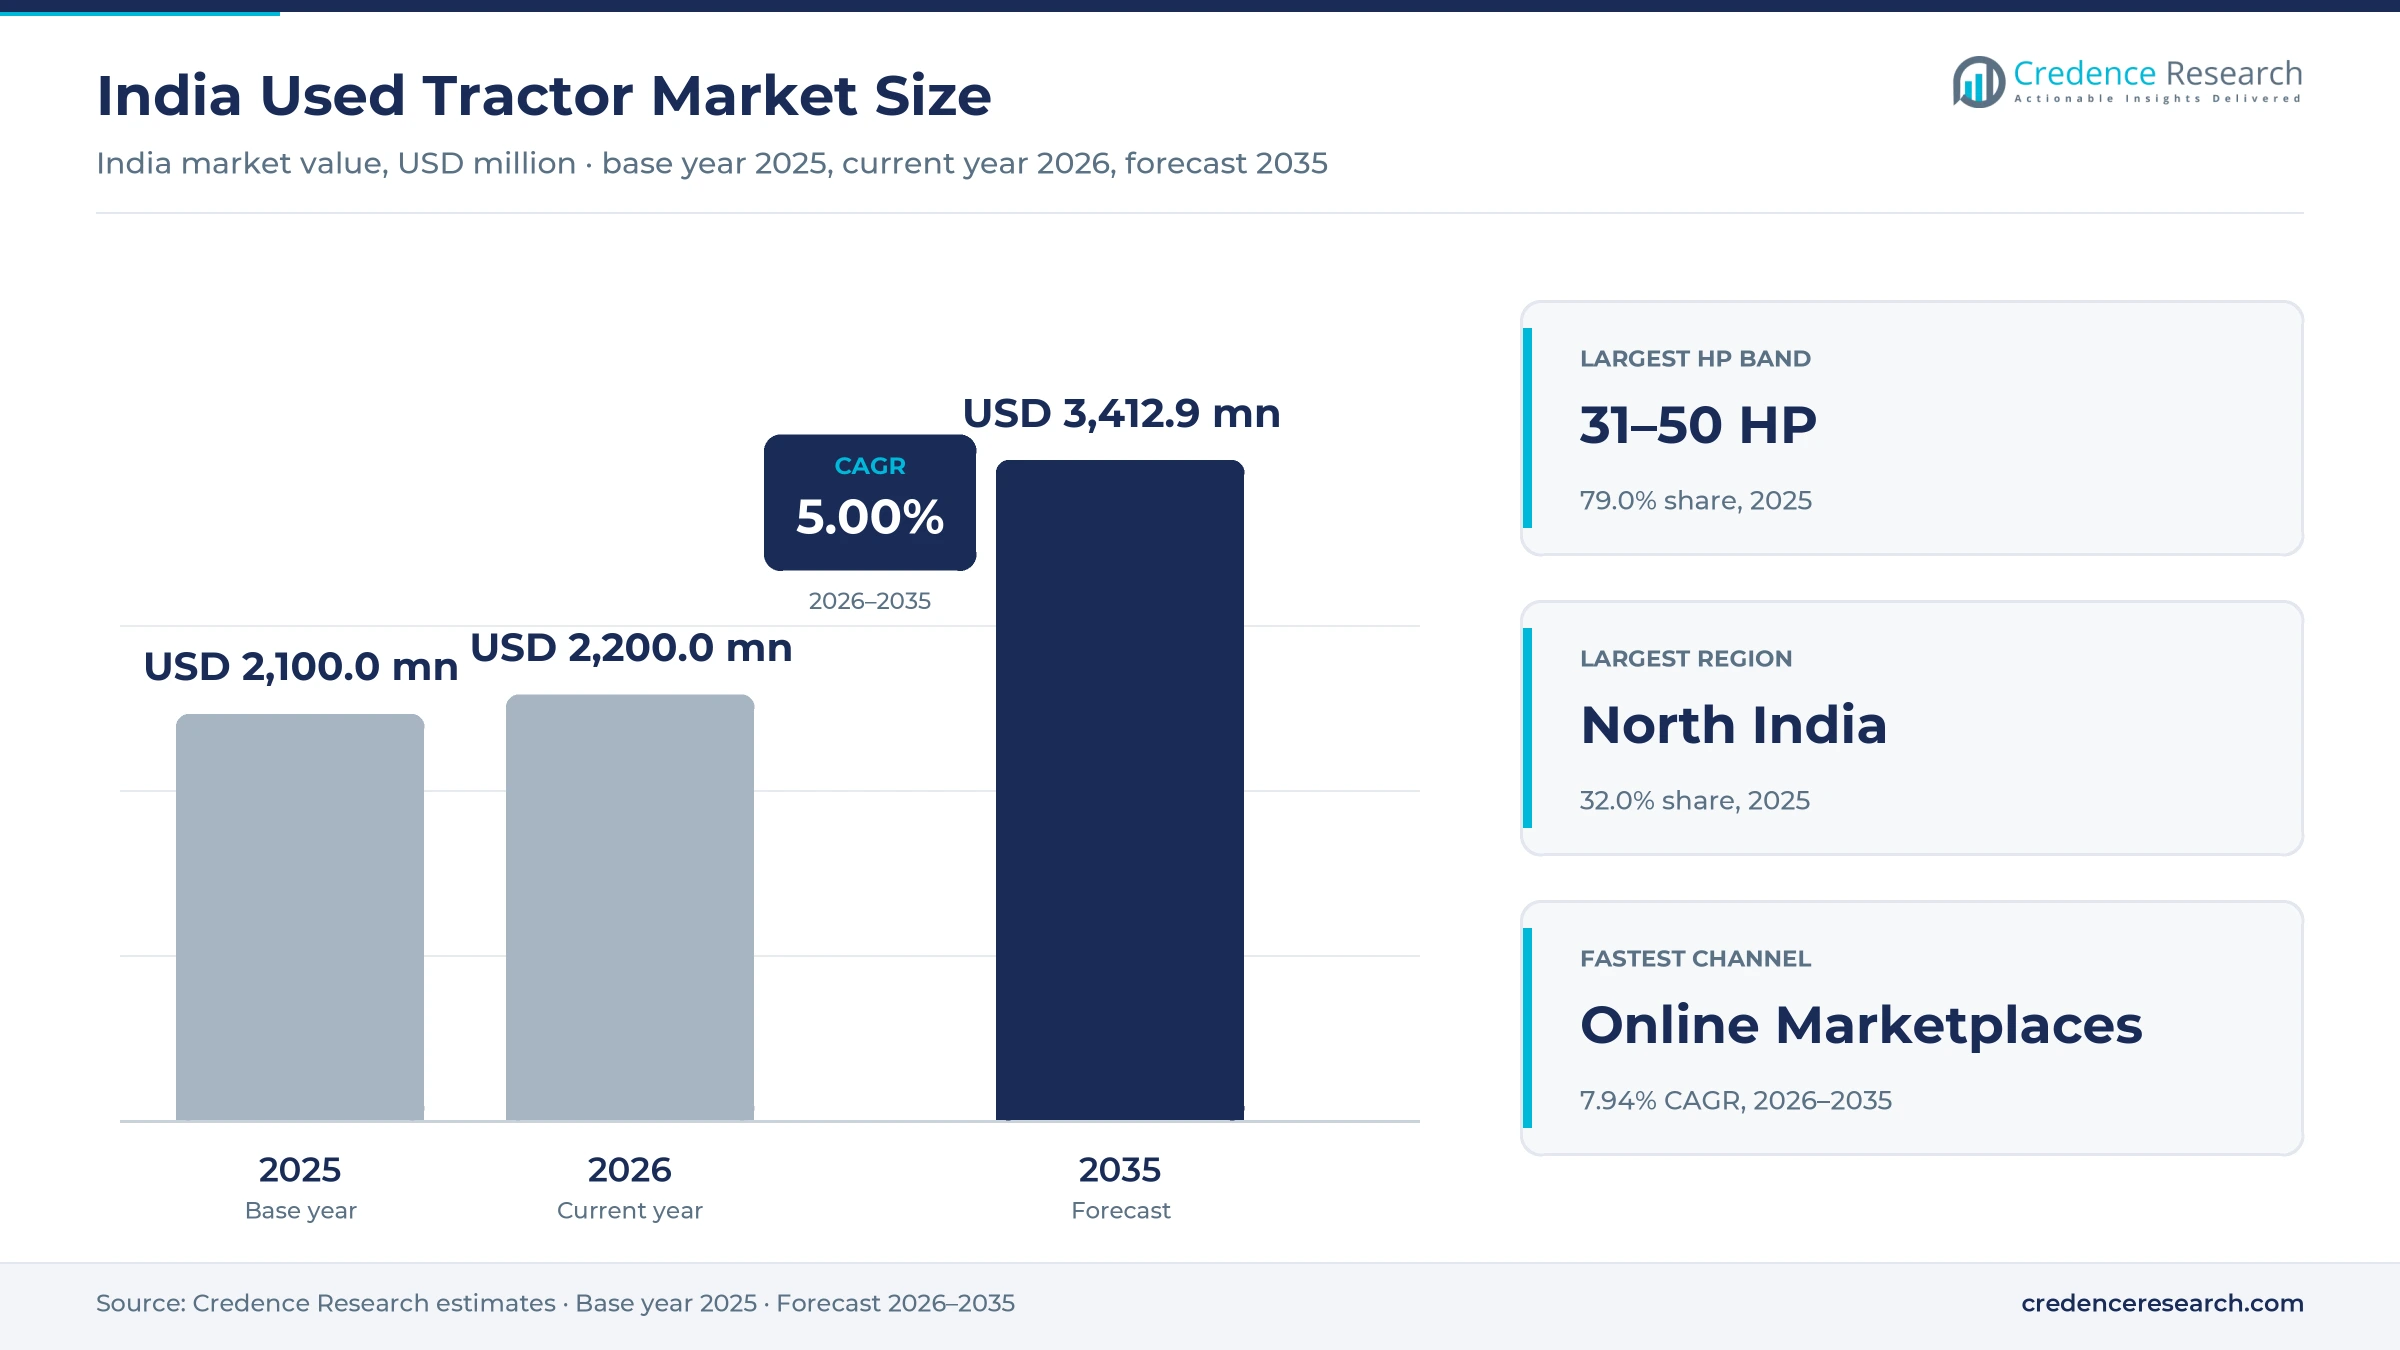
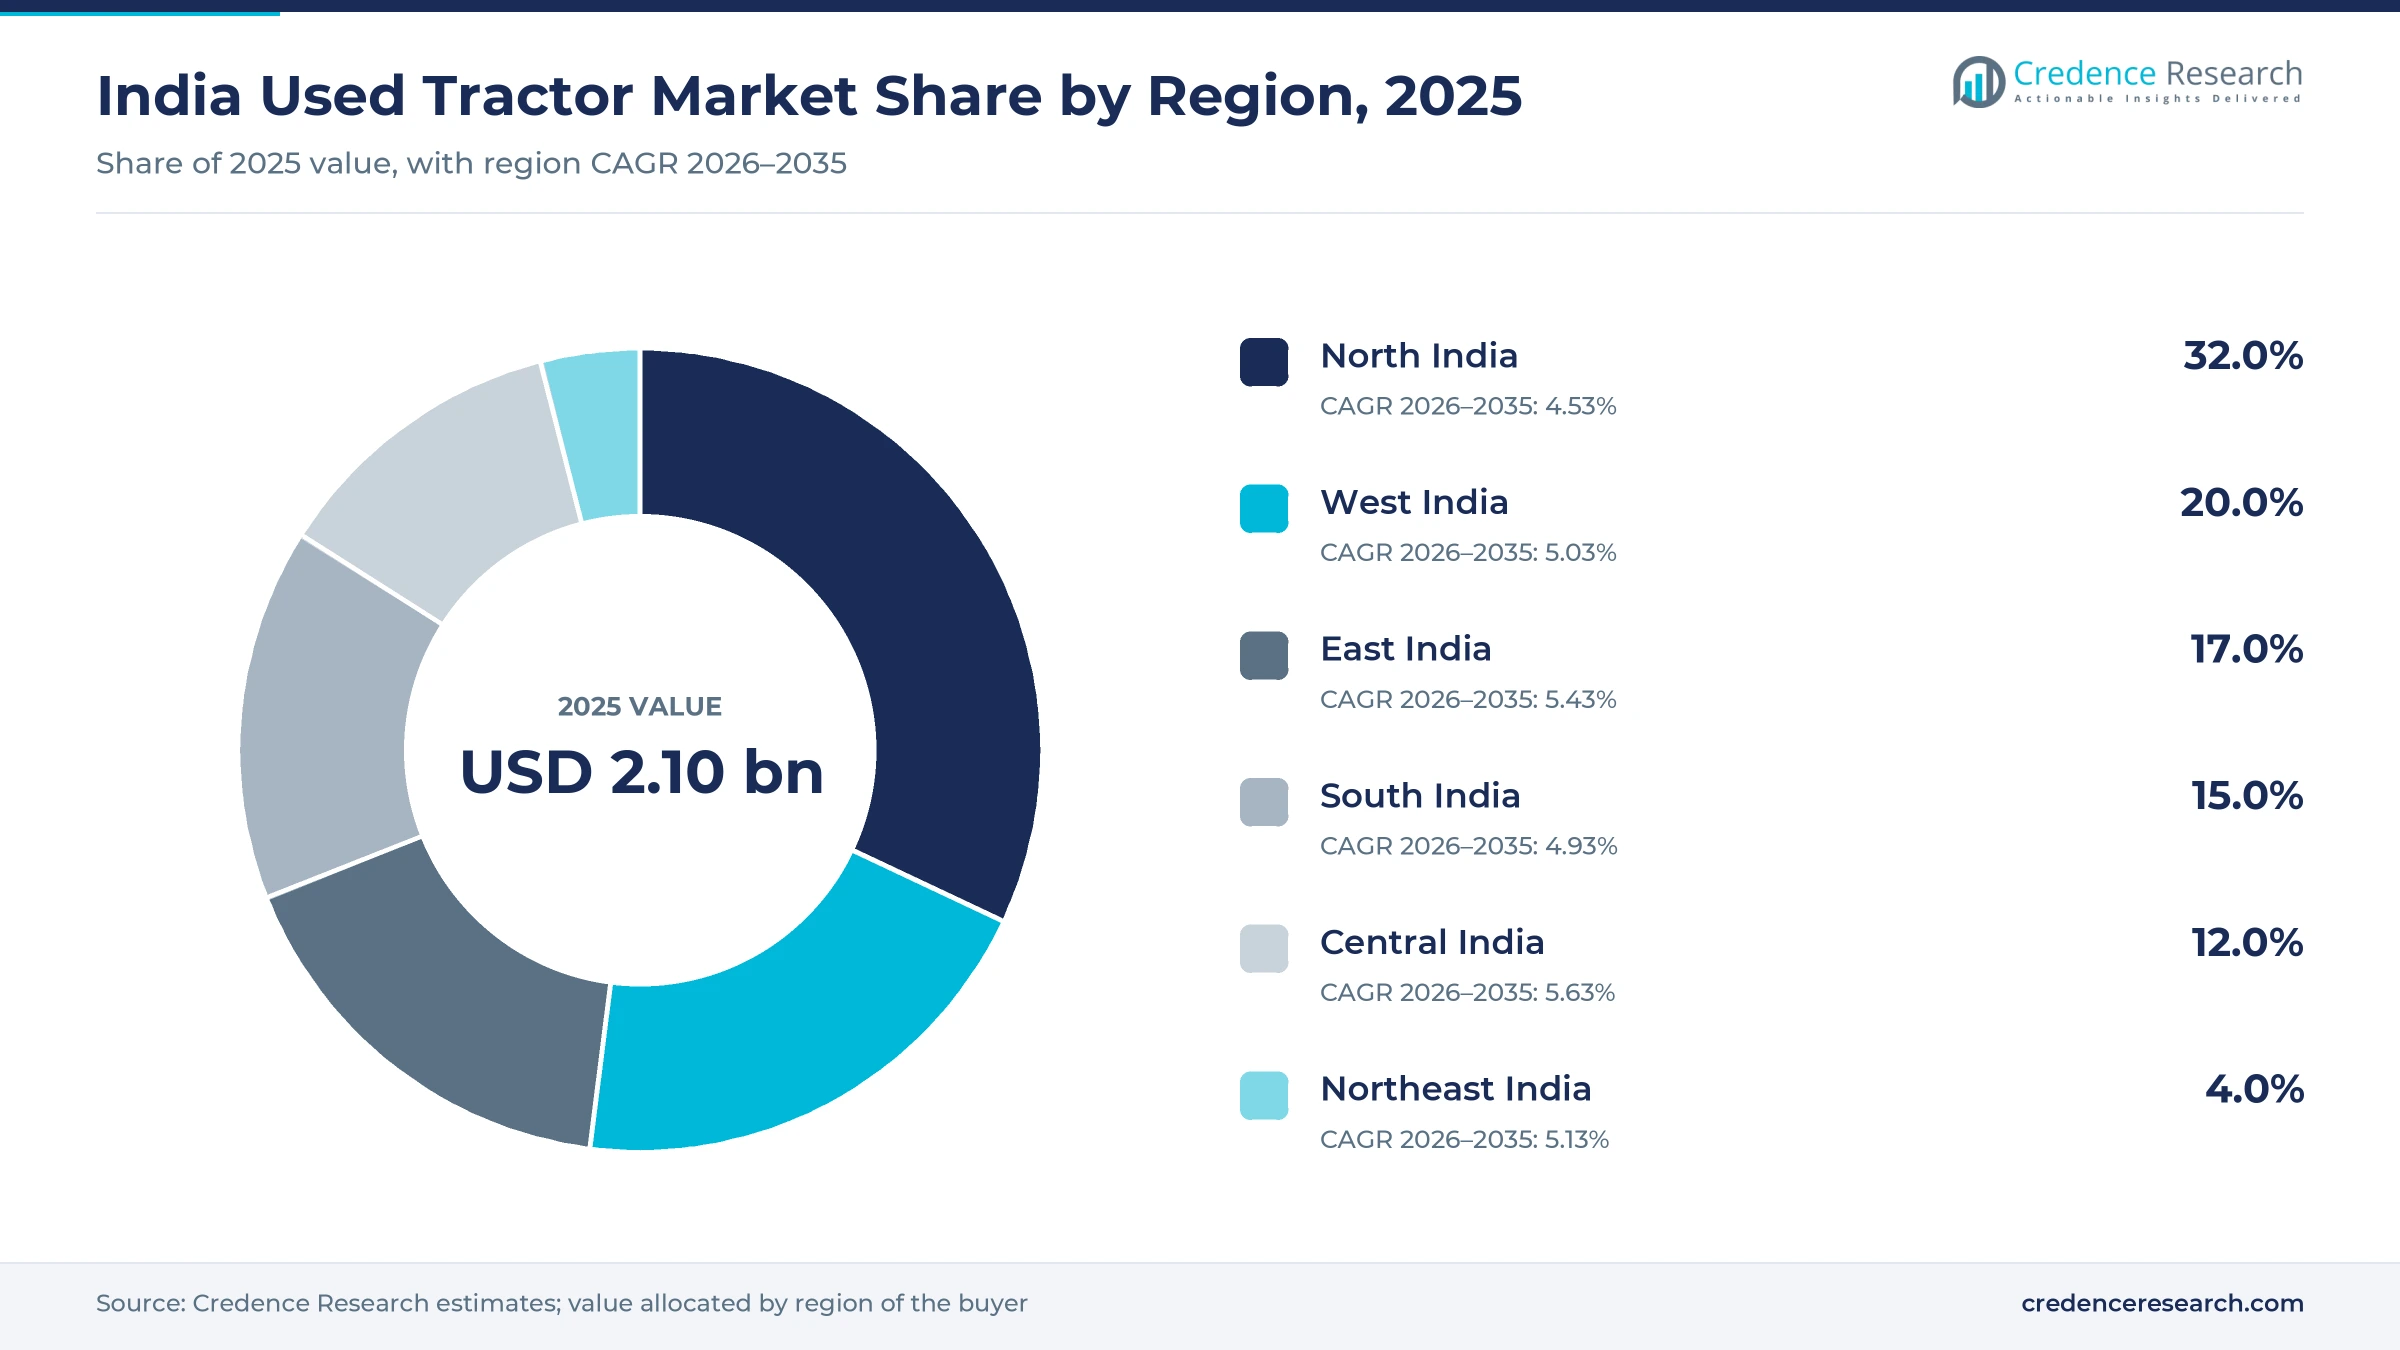
The India used tractor market was valued at USD 2.10 billion in 2025 and is projected to increase from USD 2.20 billion in 2026 to USD 3.41 billion by 2035, registering a CAGR of 5.00% during 2026–2035. Demand comes from small and marginal farmers, custom hiring operators and rural contractors who want working horsepower at a lower outlay than a new machine requires. North India held the largest regional share, 32.0% in 2025, supported by dense tractor ownership in Uttar Pradesh, Rajasthan and Punjab. Central India is the fastest-growing region at 5.63% a year as organized retail and lending reach Madhya Pradesh. A commercial change is now under way, because marketplace operator Tractor Junction received a Reserve Bank of India lending license in 2026 and planned to begin used tractor loans that October. Draft emission rules are also widening the expected price gap between new and older equipment over the coming decade, which keeps buyers looking at the secondary market.
What does the used tractor trade in India include?
The market counts the value of secondhand farm tractors sold to farmers, hiring operators and rural contractors through dealers, online marketplaces and direct sales between individuals. Buyers usually compare horsepower, age, hour-meter reading and registration status before they pay, and many pay partly through a bank or finance company loan.
The estimates exclude new tractor sales, loan interest, insurance, spare parts, implements and rental income. The value chain starts with an owner or a lender selling a machine, moves through brokers, dealers, auction yards or digital listings, and ends with registration transfer at a regional transport office.
India Used Tractor Market Insights
- The India used tractor market rises from USD 2.10 billion in 2025 to USD 3.41 billion by 2035, a 5.00% CAGR across 2026–2035, on small-farm demand and wider price gaps.
- North India held 32.0% of 2025 value, while Central India grows fastest at 5.63% a year as organized sellers and lenders enter Madhya Pradesh.
- 31–50 HP machines led with 79.0% of 2025 value, reflecting the band that farmers already buy most often when they purchase new tractors.
- Tractor Junction received a Reserve Bank of India lending license in 2026 and planned its first used tractor loans in Rajasthan and Madhya Pradesh that October.
- Dealers led channels with 48.0% of 2025 value, yet digital sellers are scaling quickly after a ₹200 crore funding round closed in November 2025.
Mid-power machines dominate resale value in 2025
Why do 31–50 HP machines lead resale value?
Based on horsepower, the market is categorized into Below 30 HP, 31–50 HP and Above 50 HP. 31–50 HP led with 79.0% of 2025 value because Autocar Professional reports that 41–50 HP models rose to nearly two-thirds of new sales by FY26, and those fleets feed resale. Below 30 HP grows fastest at 5.98% a year as a draft ministry notification, reported March 3, 2026, moves tractors below 25 HP to TREM V on Oct. 1, 2026. Executives quoted by Autocar Professional expect full compliance could lift small-tractor prices by up to 20%, which favors older compact units.
How do dealers, platforms and direct sellers differ?
Based on channel, the market is categorized into Dealers, Online Marketplaces and Peer-to-Peer. Dealers led with 48.0% of 2025 value because exchange bonuses of ₹30,000 to ₹50,000, reported by Tractor For Everyone for December 2025, route trade-ins through showrooms. Online Marketplaces grow fastest at 7.94% a year as Tractor Junction lifted monthly sales from about 300 units, reported by Inc42 in November 2025, to more than 500 units in its 2026 company statement. Direct sales cannot be measured precisely, since Kotak Mahindra Bank told BusinessLine in April 2024 that no formal industry data source exists for used tractors.
Which states carry the most resale activity?
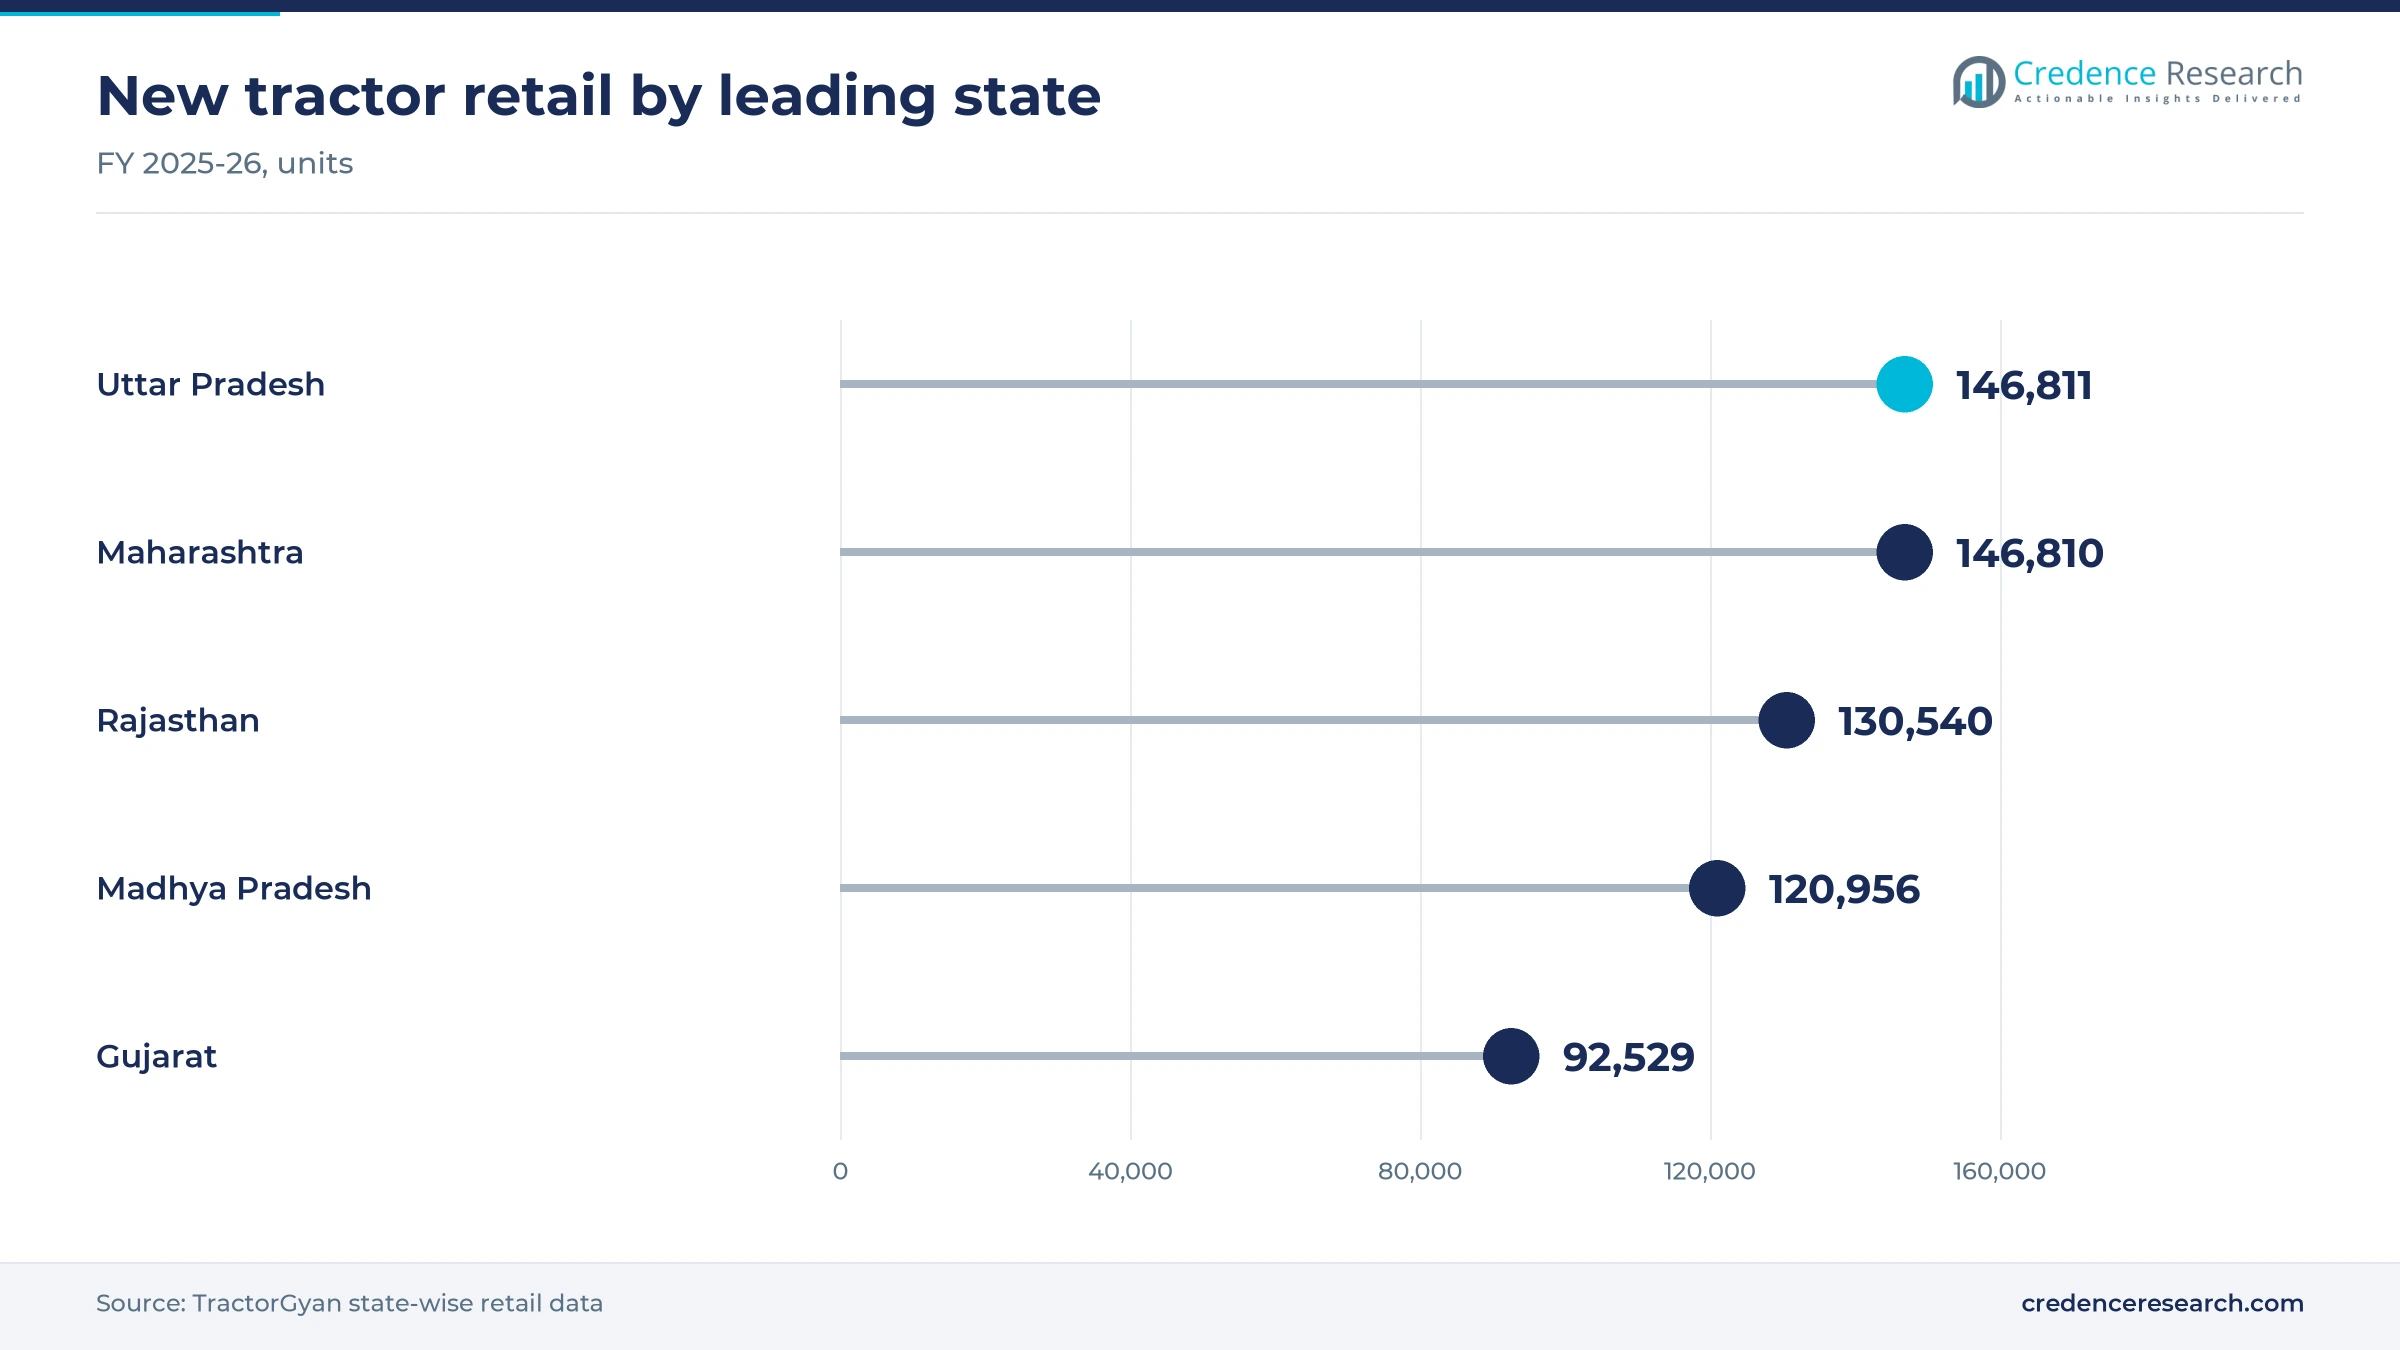
Based on state, the market is categorized into Uttar Pradesh, Madhya Pradesh, Rajasthan, Maharashtra, Punjab and Other States. Other States together held 49.0% of 2025 value because TractorGyan data shows no state above 14.24% of new retail in FY26, so demand spreads well beyond the five named states. Rajasthan grows fastest at 5.72% a year as Tractor Junction chose it and Madhya Pradesh for its first used tractor loans in October 2026. Uttar Pradesh is the largest named state, and it retailed 146,811 new tractors in FY26 according to TractorGyan, one unit ahead of Maharashtra.
| Segment Group | Leading Sub-segment | Share, 2025 | Fastest-growing Sub-segment | CAGR, 2026–2035 |
|---|---|---|---|---|
| By Horsepower | 31–50 HP | 79.0% | Below 30 HP | 5.98% |
| By Channel | Dealers | 48.0% | Online Marketplaces | 7.94% |
| By State | Other States | 49.0% | Rajasthan | 5.72% |
Request a Free Sample
Fill in your details and we'll send you a free sample report.
- Sample data tables & charts
- Research methodology
Farm size, prices and credit shape buying decisions
Small-farm mechanization supports secondhand transactions
Small holdings keep a lower-priced machine attractive across rural India. The provisional 2015-16 Agriculture Census, reported by Business Standard, placed 86.21% of operational holdings below two hectares and put the average farm at 1.08 hectares. Rural residents still made up 64.31% of the population in 2025, according to World Bank data, which keeps the buyer base large. Autocar Professional also cited a 2025 count of 75,915 custom hiring centers nationally, including 11,148 in Punjab, and these operators need machines that repay their cost quickly. As a result, many first-time owners and hiring operators enter through an older unit rather than a new one. In the Credence Research model this adds about 2.10 percentage points to annual growth to 2035.
High new-tractor prices favor lower-cost used equipment
The price gap between new and older machines remains the clearest reason to buy secondhand. Kotak Mahindra Bank told BusinessLine in April 2024 that a used tractor is worth about 60% of a new one. Tractor For Everyone puts a 30 HP used unit at about ₹2.5 lakh to ₹3 lakh and a 50 HP unit at up to ₹8 lakh. The GST cut from 12% to 5% on Sept. 22, 2025 trimmed new prices by ₹40,000 to ₹60,000, yet Autocar Professional cited estimates that TREM 5 norms could add ₹1.5 lakh to ₹3 lakh once fully implemented. This keeps the gap wide for buyers with limited cash on hand. In the Credence Research model this adds about 1.30 percentage points to annual growth to 2035.
Inspection and financing platforms reduce buyer uncertainty
Buyers hesitate when condition and credit are both uncertain, so organized platforms now address the two problems together. Tractor Junction announced in 2026 that subsidiary Dhanrise Finance would launch lending in Rajasthan and Madhya Pradesh in October 2026 and target ₹100 crore of disbursements over 24 months. The company also uses a 120-point inspection and four years of pricing data to underwrite each machine. It estimates that only about 30% of used tractor buyers obtain formal loans, which shows how much demand depends on better underwriting. Tractor For Everyone adds valuation tools covering brand, year, hour-meter reading and tire condition. In the Credence Research model this adds about 0.85 percentage points to annual growth to 2035.
Record new-tractor sales widen the future resale pool
A larger new-tractor fleet today creates the secondhand supply of the next decade. Dealer body FADA recorded retail sales of 1,050,077 tractors in FY26, up 18.94% from 882,825 a year earlier, and Tractor Junction reported that Mahindra alone retailed 249,973 units. TractorGyan state data shows 146,811 units in Uttar Pradesh and 130,540 in Rajasthan, two states where resale activity is already deep. Tractor For Everyone also reports that exchange-eligible machines are mostly 8 to 12 years old, so machines sold in FY26 should begin reaching exchange desks from about 2034. As a result, buyers should gain more choice among newer, higher-power models and dealers should be able to hold deeper stock.
Organized retail and lending are reshaping resale
Shift toward company-run retail networks for older machines
Secondhand tractor retail is shifting from informal yards toward branded outlets with published prices. Inc42 reported on Nov. 19, 2025 that Tractor Junction had raised about ₹200 crore led by Astanor and planned to expand from 75 cities to about 200 within two years. The company later described a network of 100 cities in six states selling more than 500 units monthly. All In Capital also led an investment of $500,000 in Tractor Factory in January 2025 to build its own organized resale business. These moves remain small against a dispersed trade, since a seller at 500 units a month handles about 6,000 machines a year. Even so, branded retail gives buyers a reference price that local brokers must increasingly match, particularly in Rajasthan.
Rising trade-in values reshape exchange economics
Trade-in values have been rising as buyers bring purchases forward ahead of stricter emission rules. Tractor For Everyone reported resale price increases of up to 15.9% year on year, led by tractors aged three to five years. The same article cited exchange bonuses of ₹30,000 to ₹50,000 in December 2025, adjusted against the invoice of a new machine rather than paid in cash. Massey Ferguson India, a TAFE brand, also tells customers that many of its dealerships run exchange programs to ease upgrades. Merikheti separately describes exchange support on old tractors as a common dealer-level benefit in early 2026. As a result, showrooms are becoming an important source of supply for Dealers, which held 48.0% of 2025 value.
Opportunity in specialist credit for older tractors
Specialist equipment finance offers the largest near-term opening because the pricing gap between formal and informal credit is so wide. TractorGyan listed estimated used tractor loan rates on May 12, 2026, ranging from 9.50% at Punjab National Bank to 19.50% at Axis Bank. It also noted that most banks avoid tractors older than 7 to 10 years. Tractor Junction says local moneylenders can charge as much as 40%, while its FINJ arm facilitates about ₹350 crore of used vehicle loans monthly. Kotak Mahindra Bank told BusinessLine in April 2024 that used tractors formed about one-third of its tractor loan value. Lenders that can price older machines accurately could therefore serve farmers whom mainstream banks now turn away.
Opportunity in auctions and non-farm buyers
Auctions and non-farm users give sellers a route to buyers beyond the village market. Autocar Professional reported that Shriram Automall sold about 11,000 pre-owned vehicles and equipment, tractors among them, at a Diwali auction on Oct. 27, 2025. That event ran across more than 135 locations and drew about 13,000 participants from states including Punjab, Maharashtra and Tamil Nadu. Separately, Autocar Professional reported on April 6, 2026 that urban tractor retail grew 22.37% in FY26 against 18.17% for rural sales, suggesting expanding haulage and construction use. Those buyers often value a working machine over a recent model year. Dealers that build auction sourcing and contractor sales could therefore widen their customer base in Central India and beyond.
Credit cost and paperwork still slow transactions
Expensive credit limits the buyers who can transact
Credit remains the sharpest barrier because older machines carry far higher borrowing costs than new ones. Tractor Junction says new tractor loans typically cost about 12%, while used tractor buyers may pay up to 30% on an internal rate of return basis. Small farmers without land records feel this most, and many delay purchases or settle for older equipment. Lower rates will depend on lenders building reliable valuation data, a process that specialist finance companies have only started in 2026.
Open loan entries delay ownership transfer
Paperwork can stop a sale even after the buyer and seller agree on price. VahanBazaar explained on Sept. 28, 2026 that a tractor carrying a loan entry needs a lender no-objection certificate and Form 35 before transfer can proceed. Closure paperwork often lags the final installment, and out-of-state purchases require further clearance and re-registration. Buyers therefore risk paying for a machine they cannot register. Careful sellers now clear the record before listing, which shortens the sale and supports a better price.
Uneven condition makes fair pricing difficult
Condition risk persists because a fresh coat of paint can hide years of hard use. VahanBazaar noted on Sept. 4, 2026 that a repainted tractor can look much younger than its first registration date shows. Tractor For Everyone adds that machines with fewer than 3,000 hours hold higher value, so hour-meter claims directly affect price. Farmers who buy without an engine, hydraulics and transmission check absorb that risk themselves. Independent inspection reduces the problem, but it remains uncommon outside organized sellers today.
Weak monsoon spells and new-tractor offers squeeze demand
Rainfall still sets the rhythm of rural purchasing, and 2026 showed how quickly sentiment can cool. VahanBazaar reported on Oct. 1, 2026 that monsoon rainfall stood at 85% of the long-period average on Sept. 14, and that August retail rose only 0.84% to 87,977 tractors. Cash buyers in dry districts tend to postpone purchases in such periods. Dealers holding surplus new stock may also discount, which narrows the price advantage of older machines until conditions improve.
North India leads while Central India grows fastest
| Region | Value, 2025 (USD billion) | Share, 2025 | CAGR, 2026–2035 |
|---|---|---|---|
| North India | 0.67 | 32.0% | 4.53% |
| West India | 0.42 | 20.0% | 5.03% |
| East India | 0.36 | 17.0% | 5.43% |
| South India | 0.32 | 15.0% | 4.93% |
| Central India | 0.25 | 12.0% | 5.63% |
| Northeast India | 0.08 | 4.0% | 5.13% |
North India holds the deepest resale pool
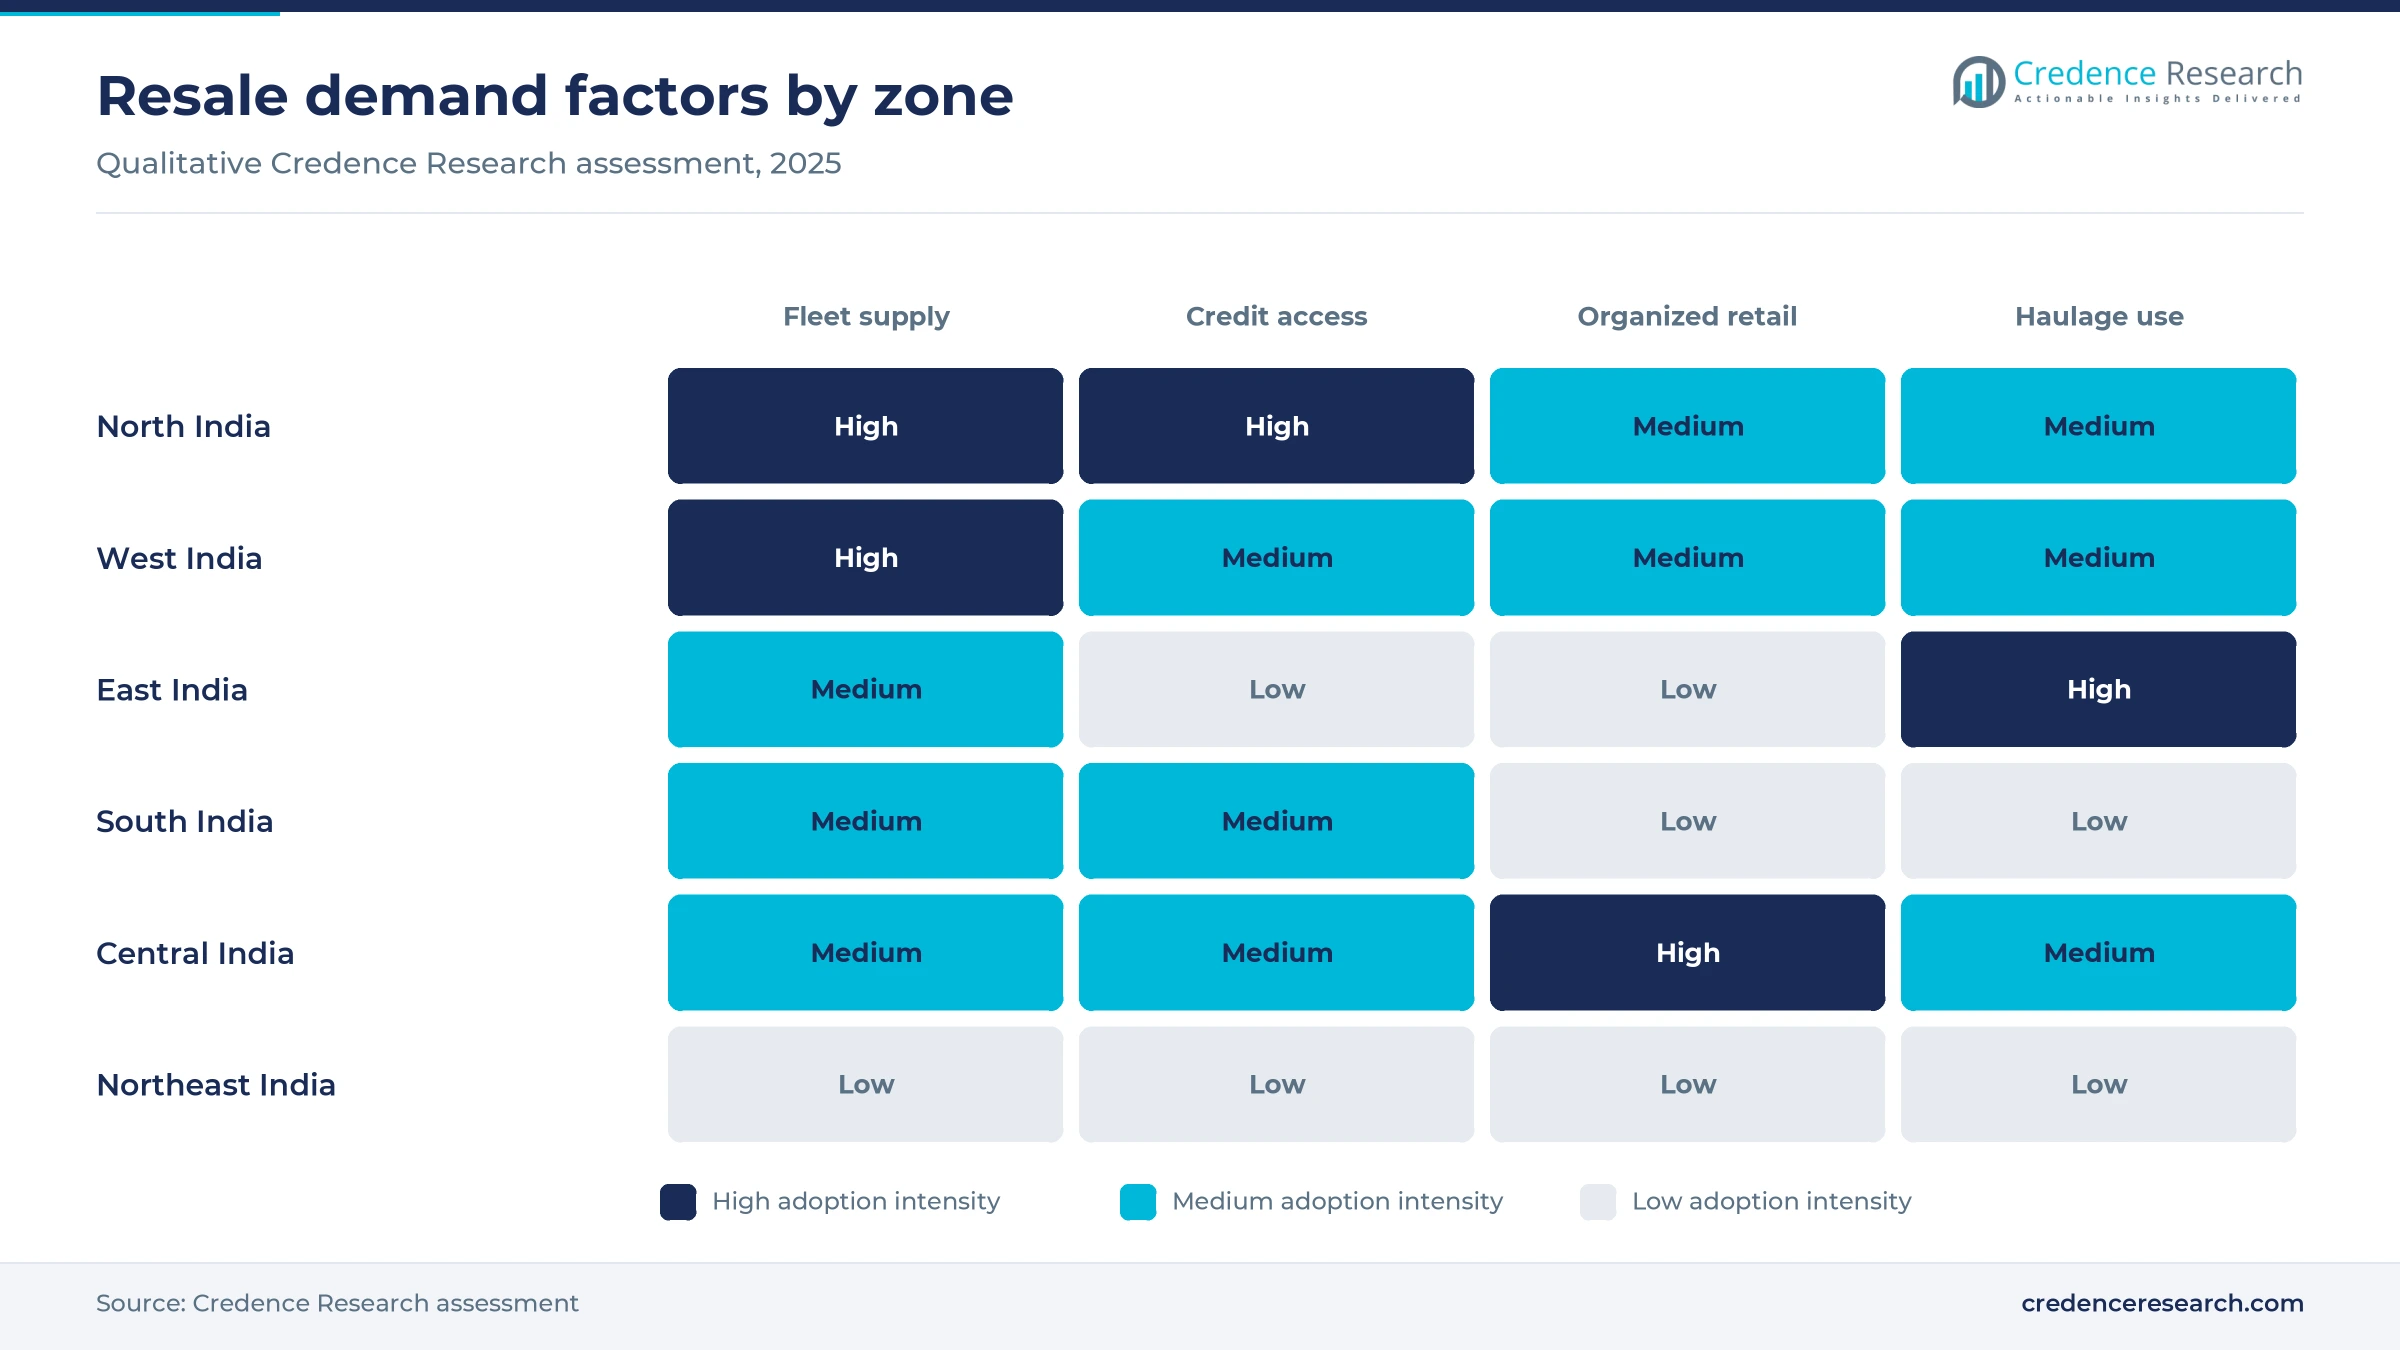
North India held a 32.0% share of 2025 demand and grows at 4.53% a year, the slowest pace among the zones because ownership is already dense. TractorGyan recorded 146,811 new tractors retailed in Uttar Pradesh in FY26, while CMV360 reported 39,032 wholesale units for Punjab and 41,389 for Haryana between April and December 2025. Those fleets create steady trade-in supply, and many older machines move onward to farmers in neighboring states. Rajasthan adds further depth through its strong retail base of 130,540 new units.
West India benefits from Maharashtra and Gujarat fleets
West India held a 20.0% share of 2025 demand and grows at 5.03% a year, supported by two large new-tractor states. TractorGyan counted 146,810 units in Maharashtra and 92,529 in Gujarat in FY26, and Autocar Professional said Maharashtra outpaced the national average that year. Autocar Professional also linked state subsidy schemes in Maharashtra to the recent sales surge. Those purchases should enlarge the regional supply of machines reaching resale over the next decade, particularly in the mid-power band.
East India pairs low mechanization with haulage use
East India held a 17.0% share of 2025 demand and grows at 5.43% a year as farmers and haulage operators add capacity. CMV360 reported wholesale dispatches of 33,013 units in Bihar, up 30.58%, and 18,297 in West Bengal, up 34.35%, between April and December 2025. Autocar Professional also identified Bihar, West Bengal, Jharkhand and Odisha as the states with the highest commercial-use share. Commercial buyers usually care more about earnings than model year, which suits lower-priced machines.
South India relies on Karnataka and mixed crop needs
South India held a 15.0% share of 2025 demand and grows at 4.93% a year, with demand centered on Karnataka and on compact machines for mixed cropping. CMV360 reported wholesale dispatches of 50,576 units in Karnataka, 24,878 in Andhra Pradesh and 21,292 in Tamil Nadu, the last up 45.27%, between April and December 2025. TractorGyan also identified Bijapur, Hassan and Raichur among the top registration districts in the first quarter of FY26, which indicates broad local fleets.
Central India gains from new lending and retail reach
Central India held a 12.0% share of 2025 demand and is the fastest-growing zone at 5.63% a year. TractorGyan counted 120,956 new tractors in Madhya Pradesh in FY26, and CMV360 reported 40,990 wholesale units for Chhattisgarh between April and December 2025. Tractor Junction selected Madhya Pradesh as a launch state for used tractor lending in October 2026, which should bring formal credit to more buyers there. Organized outlets also give farmers a clearer reference price than local brokers offer.
Northeast India remains small but steadily expanding
Northeast India held a 4.0% share of 2025 demand and grows at 5.13% a year from a limited base of machines. CMV360 reported 6,954 wholesale units for Assam between April and December 2025, up 6.41%, a much slower rise than in Bihar or West Bengal. Long transport distances and smaller holdings limit the choice of older machines locally, so buyers often have few sellers to compare. Better digital listings could gradually widen access to stock from neighboring states.
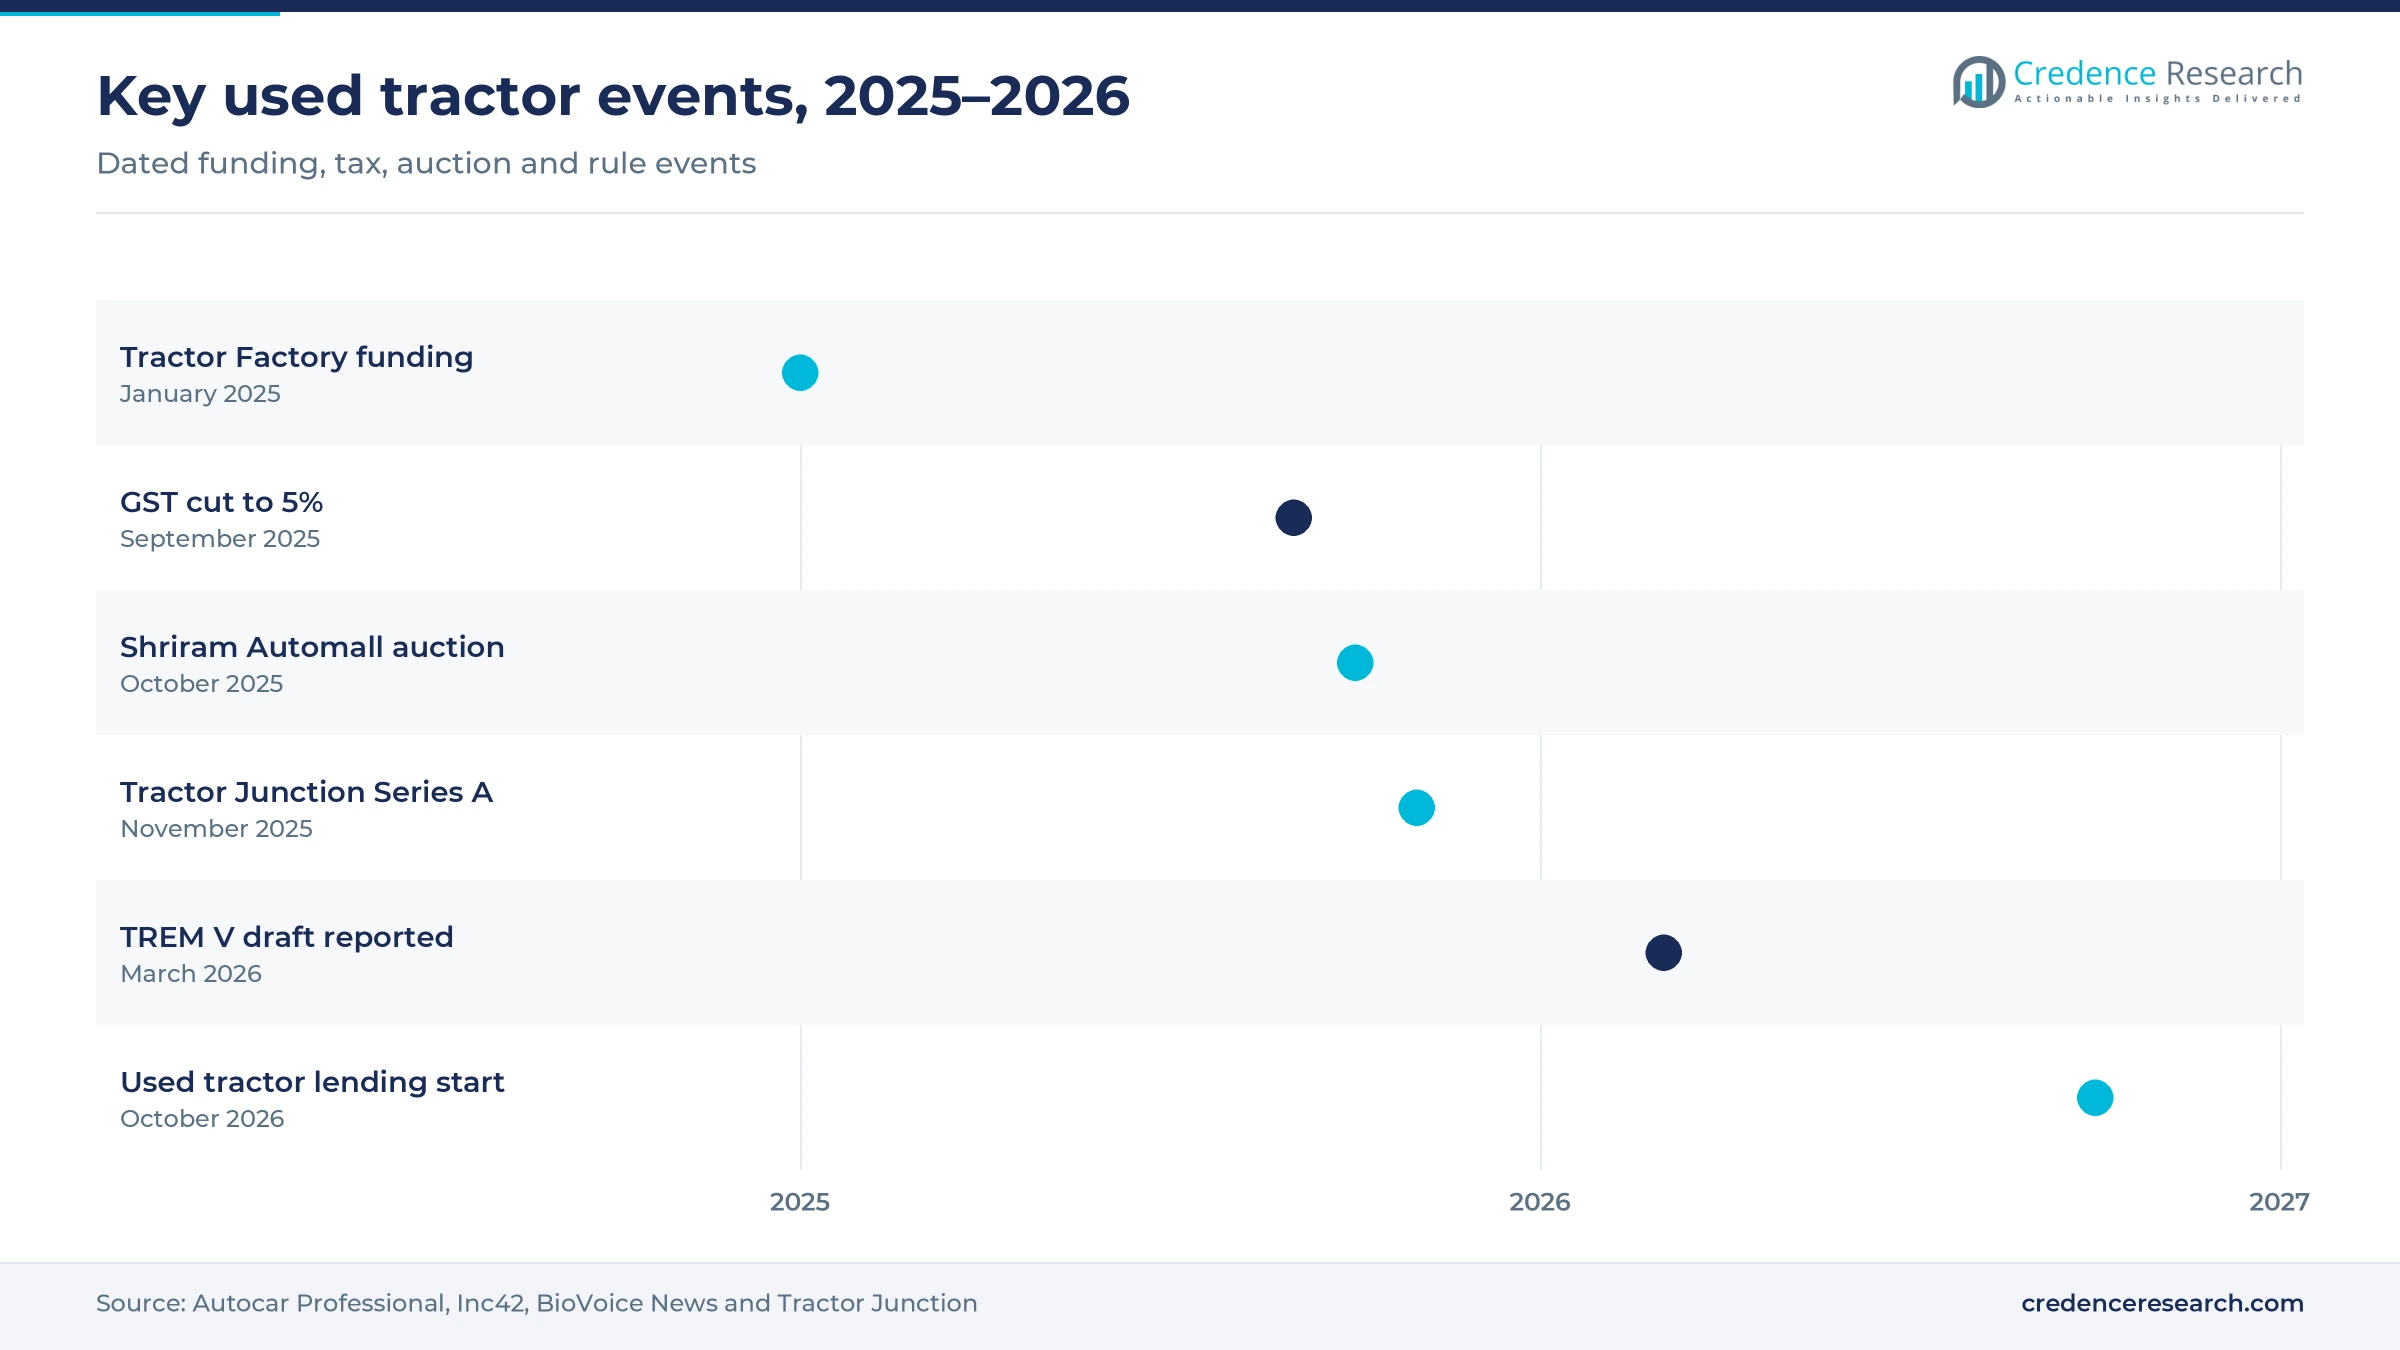
Funding, lending and rule changes marked 2025–2026
| Development | Status and market relevance |
|---|---|
| In January 2025, Tractor Factory raised $500,000 in a pre-seed round led by All In Capital to build an organized resale business. | Completed; adds a new branded entrant to a mostly unorganized trade |
| In September 2025, the GST rate on tractors fell to 5% from 12%, with the lower rate applying from Sept. 22. | In force; lowers new prices and narrows the gap against older machines at the margin |
| In October 2025, Shriram Automall held a Diwali auction covering about 11,000 pre-owned vehicles and equipment at more than 135 locations. | Completed; shows the reach of organized auctions for repossessed and resale assets |
| In November 2025, Tractor Junction closed a Series A round of about ₹200 crore led by Astanor, with Info Edge and Omnivore also participating. | Completed; funds wider retail expansion across cities |
| In March 2026, Autocar Professional reported a draft TREM V notification with phased dates from October 2026 to April 2032. | Draft; final dates depend on government notification |
Inspection data is replacing guesswork on price
- Structured inspection gives buyers a record of machine condition, and Tractor Junction uses a 120-point check when it underwrites a used tractor loan.
- AI-based valuation combines computer vision with years of pricing data, which helps a lender estimate value without relying on one local broker.
- VAHAN record checks show first registration date, owner serial number, loan entries and any blacklist flag, so title problems surface before payment.
- Online valuation tools let sellers enter brand, year, hours, tire condition and state, and Tractor For Everyone offers this through its Value Your Tractor service.
Need a Custom Version of This Report?
Tailor the scope, geography, or segments to your exact requirements.
- Custom geography or segment scope
- Direct access to our analyst team
Platforms challenge a dealer-led, fragmented trade
Competition in the market is fragmented, and most machines still change hands through local brokers, unorganized dealers and direct sales between farmers. Tractor Junction is the most visible organized seller, combining online listings, company-run outlets and a finance arm, while Tractor For Everyone offers listings, auctions, valuation tools and loans from its base in Pune. Tractor Factory is a younger entrant focused on organized resale. Makers of farm machinery influence supply indirectly, because dealers handling Mahindra, Massey Ferguson and other brands take older machines in exchange when farmers upgrade. Lenders matter as well, since Mahindra Finance, Kotak Mahindra Bank and others decide which ages and models can be financed. Shriram Automall adds an auction route for equipment that lenders and owners need to sell quickly. Companies compete on price transparency, loan access, inspection quality and the speed of registration transfer rather than on brand alone.
Companies profiled and their roles in this market
| Company | Type | Role in the market |
|---|---|---|
| Tractor Junction | Marketplace, retailer and lender | Runs online listings and outlets, and began used tractor lending plans through Dhanrise Finance |
| Tractor For Everyone | Online platform | Lists new and used tractors, runs auctions and offers valuation tools and finance |
| Mahindra & Mahindra | Manufacturer and finance group | Largest new tractor retailer in FY26, with Mahindra Finance offering used tractor loans |
| TAFE | Manufacturer | Massey Ferguson dealerships offer exchange programs that bring older tractors into resale |
| Shriram Automall | Auction operator | Holds multi-location auctions covering pre-owned vehicles and equipment, including tractors |
| Tractor Factory | Resale startup | Raised pre-seed funding in January 2025 to organize the resale of older tractors |
| Kotak Mahindra Bank | Lender | Finances used tractors, which formed about one-third of its tractor loan value in 2024 |
| Unorganized local dealers | Dealers and brokers | Handle much of the village-level trade, often with informal pricing and limited warranty |
Credit access will decide who wins organized resale
Credence Research's view is that credit access, more than tractor supply, will decide how quickly this market organizes. Record new sales mean machines will keep arriving, but sellers can only turn them into reliable transactions when buyers can borrow at a fair rate and verify what they are buying. Platforms that pair inspection data with lending hold an advantage over listing-only rivals because they control both risks. Dealers remain well placed through exchange flows, and those that publish condition records could defend their position. The most assumption-heavy figure in this report is the channel split.
How the Credence Research estimates were built
The report uses 2025 as the base year and 2035 as the forecast year, with growth stated for 2026–2035. Market values come from the Credence Research model, and segment and regional splits are Credence Research estimates. The inputs include published tractor retail and wholesale statistics, World Bank data, agricultural census results reported in the press, company statements, trade publications and lender disclosures. No formal industry count of used tractor sales exists, so the estimates rest on new-market volumes, resale prices and lender assumptions. No interviews or surveys were conducted for this edition of the report.
Larger fleets and tighter norms support growth to 2035
Growth to 2035 should come from a larger installed fleet, wider price gaps and better access to formal credit. The market is forecast to reach USD 3.41 billion by 2035, and the sharpest gains are expected where lending and retail networks arrive first. Emission rules remain the main variable, because the final dates could change how much new prices rise. Monsoon performance will continue to affect annual volumes in any given season. However, the basic appeal of a working machine at a lower price should keep small farmers and contractors active in this market throughout the period.
Frequently Asked Questions
How big is the India used tractor market?
Why do farmers in India buy used tractors?
Which horsepower band leads the market?
Which region of India is largest?
How are used tractors sold in India?
What interest rates do used tractor buyers pay?
Do new emission norms affect used tractor demand?
What should a buyer check before paying?
Table of Content
Chapter 1 Market Segmentation
- 1.1 Segmentation Framework
- 1.1.1 Product and Service Classification
- 1.1.2 Application and End-Use Classification
- 1.1.3 Technology and Solution Classification
- 1.1.4 Customer and Distribution Channel Classification
- 1.1.5 Geographic Segmentation
- 1.1.6 Market Segment Definitions and Boundaries
- 1.2 By Horsepower
- 1.2.1 Below 30 HP
- 1.2.2 31–50 HP
- 1.2.3 Above 50 HP
- 1.3 By Channel
- 1.3.1 Dealers
- 1.3.2 Online Marketplaces
- 1.3.3 Peer-to-Peer
- 1.4 By State
- 1.4.1 Uttar Pradesh
- 1.4.2 Madhya Pradesh
- 1.4.3 Rajasthan
- 1.4.4 Maharashtra
- 1.4.5 Punjab
- 1.4.6 Other States
Chapter 2 Introduction
- 2.1 Report Objectives and Scope
- 2.2 Product Definition and Industry Terminology
- 2.3 Market Inclusions and Exclusions
- 2.4 Research Process
- 2.4.1 Primary Research and Expert Interviews
- 2.4.2 Secondary Research and Source Review
- 2.4.3 Top-Down and Bottom-Up Estimation
- 2.4.4 Data Triangulation and Verification
- 2.5 Market Size Measurement Basis
- 2.5.1 2025: USD 2.10 billion → 2035: USD 3.41 billion
- 2.6 Historical and Forecast Reference Periods
- 2.6.1 Historical Period: 2018-2025
- 2.6.2 Base Year: 2025
- 2.6.3 Forecast Period: 2025-2035
- 2.7 Research Assumptions and Limitations
Chapter 3 Executive Summary
- 3.1 Market Snapshot and Key Findings
- 3.2 Base-Year Market Size, 2025
- 3.3 Forecast Market Size, 2035
- 3.4 Revenue and Volume Growth Outlook
- 3.5 Key Demand and Supply Indicators
- 3.6 Leading Market Segments
- 3.7 Fastest-Growing Market Opportunities
- 3.8 Regional Performance Highlights
- 3.9 Technology and Industry Transformation
- 3.10 Competitive Landscape Summary
- 3.11 Analyst View and Strategic Implications
Chapter 4 India Used Tractor Market Trends and Developments
- 4.1 Historical Industry Development, 2018-2025
- 4.2 Recent Market Trends and Developments
- 4.3 Demand and Customer Behavior Trends
- 4.4 Technology and Product Innovation
- 4.5 Artificial Intelligence, Automation and Digitalization
- 4.6 Local Manufacturing and Supply Chain Realignment
- 4.7 Industry Partnerships, Mergers and Acquisitions
- 4.8 Sustainability and Circular Economy Developments
- 4.9 Government and Private Sector Investment Trends
- 4.10 Emerging Business Models and Commercialization
- 4.11 Industry Developments and Announcements
Chapter 5 India Used Tractor Market Production, Supply and Demand Analysis
- 5.1 Demand Trend and Consumption Analysis, 2018-2025
- 5.2 Demand Forecast, 2025-2035
- 5.3 Production and Output Trend, 2018-2025
- 5.4 Production and Output Forecast, 2025-2035
- 5.5 Installed Capacity and Capacity Utilization
- 5.6 Company-Wise Production Plants and Statistics
- 5.6.1 Installed Production Capacity
- 5.6.2 Actual Production
- 5.6.3 Planned Capacity and Expansion Targets
- 5.7 Supply Chain Structure and Procurement Trends
- 5.8 Supply-Demand Gap and Bottlenecks
- 5.9 Import Dependence and Sourcing Structure
- 5.10 Contract Manufacturing and Outsourcing
- 5.11 Regional Supply and Demand Concentration
Chapter 6 India Used Tractor Market Pricing Analysis
- 6.1 Pricing Structure and Measurement
- 6.2 Historical Pricing Trends, 2018-2025
- 6.3 Pricing Outlook, 2025-2035
- 6.4 Average Selling Price and Unit Economics
- 6.5 Pricing by Product and Market Segment
- 6.6 Geographic Pricing Differences
- 6.7 Key Input, Energy, Labor and Logistics Costs
- 6.8 Contract Pricing and Purchasing Models
- 6.9 Pricing Sensitivity and Competitive Positioning
- 6.10 Price, Margin and Profitability Implications
Chapter 7 India Used Tractor Market Dynamics
- 7.1 Market Growth Drivers
- 7.1.1 Demand-Side Drivers
- 7.1.2 Technology and Innovation Drivers
- 7.1.3 Infrastructure and Investment Drivers
- 7.1.4 Regulatory and Policy Drivers
- 7.2 Market Restraints
- 7.2.1 Cost and Affordability Constraints
- 7.2.2 Technology and Adoption Barriers
- 7.2.3 Supply Chain and Operational Constraints
- 7.3 Market Challenges
- 7.3.1 Competitive Pressure and Margin Erosion
- 7.3.2 Skills, Infrastructure and Implementation Gaps
- 7.4 Emerging Market Opportunities
- 7.5 Market Dynamics Impact and Time-Horizon Assessment
Chapter 8 India Used Tractor Value Chain Analysis
- 8.1 Industry Value Chain Overview
- 8.2 Upstream Suppliers and Critical Inputs
- 8.3 Technology and Component Providers
- 8.4 Manufacturing or Service Delivery
- 8.5 Distribution, Channel Partners and Integrators
- 8.6 Downstream Applications and End Users
- 8.7 Value Addition and Profit Pools
- 8.8 Vertical Integration and Outsourcing
- 8.9 Supplier Concentration and Risk
- 8.10 Supply Chain Localization and Resilience
Chapter 9 India Used Tractor Market Regulations and Policies
- 9.1 Relevant Laws, Standards and Compliance Frameworks
- 9.2 Product, Service, Safety and Quality Requirements
- 9.3 Government Policies, Incentives and Subsidies
- 9.4 Imports, Exports and Trade Barriers
- 9.5 Public Procurement and Local Content Requirements
- 9.6 Environmental and Sustainability Compliance
- 9.7 Upcoming Policy Changes and Market Implications
Chapter 10 India Used Tractor Market Hotspots and Opportunities
- 10.1 Market Opportunity Mapping and Growth Hotspots
- 10.2 High-Growth Applications and Customer Groups
- 10.3 Underserved Markets and White-Space Opportunities
- 10.4 Emerging Technology and Product Opportunities
- 10.5 New Capacity and Investment Hotspots
- 10.6 Market Entry and Expansion Opportunities
- 10.7 Distribution and Partnership Opportunities
- 10.8 Near-Term and Long-Term Commercial Potential
- 10.9 Opportunity Attractiveness and Execution Risks
Chapter 11 India Used Tractor Market Outlook, 2025-2035
- 11.1 Market Size and Analysis
- 11.1.1 Revenue (Market Measurement: 2025: USD 2.10 billion → 2035: USD 3.41 billion)
- 11.1.2 Market Volume and Quantity Sold
- 11.1.3 Historical Market Size, 2018-2025
- 11.1.4 Base-Year Market Size, 2025
- 11.2 Market Forecast, 2025-2035
- 11.2.1 Revenue Forecast to 2035
- 11.2.2 Volume Forecast to 2035
- 11.2.3 CAGR and Year-on-Year Growth
- 11.2.4 Incremental Revenue Opportunity
- 11.3 Forecast Assumptions and Scenario Analysis
- 11.3.1 Base-Case Forecast
- 11.3.2 Optimistic and Conservative Scenarios
- 11.3.3 Technology, Pricing and Policy Sensitivities
- 11.4 Market Attractiveness and Growth Outlook
Chapter 12 India Used Tractor Market Segmentation and Outlook
- 12.1 Segmentation Summary and Market Shares, 2025
- 12.2 Largest and Fastest-Growing Segments
- 12.3 By Horsepower - Market Size and Forecast, 2025-2035
- 12.3.1 Segment Definition and Scope
- 12.3.2 Historical Market Size, 2018-2025
- 12.3.3 Revenue Forecast, 2025-2035
- 12.3.4 Volume Forecast, 2025-2035
- 12.3.5 Base-Year Market Share, 2025
- 12.3.6 Segment CAGR and Growth Drivers
- 12.3.7 Subsegment Market Size and Forecast
- 12.3.7.1 Below 30 HP
- 12.3.7.2 31–50 HP
- 12.3.7.3 Above 50 HP
- 12.3.8 Subsegment Pricing and Adoption Trends
- 12.3.9 Leading Suppliers and Competition
- 12.3.10 Regional Demand and Opportunities
- 12.4 By Channel - Market Size and Forecast, 2025-2035
- 12.4.1 Segment Definition and Scope
- 12.4.2 Historical Market Size, 2018-2025
- 12.4.3 Revenue Forecast, 2025-2035
- 12.4.4 Volume Forecast, 2025-2035
- 12.4.5 Base-Year Market Share, 2025
- 12.4.6 Segment CAGR and Growth Drivers
- 12.4.7 Subsegment Market Size and Forecast
- 12.4.7.1 Dealers
- 12.4.7.2 Online Marketplaces
- 12.4.7.3 Peer-to-Peer
- 12.4.8 Subsegment Pricing and Adoption Trends
- 12.4.9 Leading Suppliers and Competition
- 12.4.10 Regional Demand and Opportunities
- 12.5 By State - Market Size and Forecast, 2025-2035
- 12.5.1 Segment Definition and Scope
- 12.5.2 Historical Market Size, 2018-2025
- 12.5.3 Revenue Forecast, 2025-2035
- 12.5.4 Volume Forecast, 2025-2035
- 12.5.5 Base-Year Market Share, 2025
- 12.5.6 Segment CAGR and Growth Drivers
- 12.5.7 Subsegment Market Size and Forecast
- 12.5.7.1 Uttar Pradesh
- 12.5.7.2 Madhya Pradesh
- 12.5.7.3 Rajasthan
- 12.5.7.4 Maharashtra
- 12.5.7.5 Punjab
- 12.5.7.6 Other States
- 12.5.8 Subsegment Pricing and Adoption Trends
- 12.5.9 Leading Suppliers and Competition
- 12.5.10 Regional Demand and Opportunities
- 12.6 Segment Growth Comparison
- 12.7 Segment Attractiveness and Priority Matrix
Chapter 13 India Used Tractor Geographic Market Outlook, 2025-2035
- 13.1 Domestic Market Distribution and Demand Clusters
- 13.2 State- or Province-Wise Market Size and Forecast, 2025-2035
- 13.3 City and Metropolitan Market Outlook
- 13.4 Industrial, Manufacturing and Commercial Clusters
- 13.5 Geographic Concentration of Key End Users
- 13.6 Local Pricing and Purchasing Differences
- 13.7 Domestic Production Facilities and Capacity Map
- 13.8 Local Infrastructure and Project Pipeline
- 13.9 State-Level Policy and Incentive Differences
- 13.10 Subnational Investment Hotspots and Opportunities
- 13.11 Distribution and Logistics Networks
- 13.12 Domestic Competitive Footprint
Chapter 14 India Used Tractor Technology, Innovation and Sustainability Outlook
- 14.1 Technology Landscape and Maturity
- 14.2 Product, Process and Service Innovation
- 14.3 AI, Automation and Digital Tools in the Industry
- 14.4 Technology Adoption and Performance Benchmarking
- 14.5 Innovation Pipeline and R&D Investment
- 14.6 Patent and Intellectual Property Trends
- 14.7 Energy Efficiency and Resource Management
- 14.8 Sustainability, Recycling and Circularity
- 14.9 Technology Roadmap, 2025-2035
- 14.10 Risks of Obsolescence and Technology Substitution
Chapter 15 India Used Tractor Market Key Strategic Imperatives
- 15.1 Growth and Market Entry Priorities
- 15.2 High-Return Products and Segments
- 15.3 Pricing, Profitability and Cost Optimization
- 15.4 Technology Investment and Product Differentiation
- 15.5 Supply Chain Localization and Resilience
- 15.6 Distribution and Customer Acquisition
- 15.7 Partnership, Acquisition and Capacity Strategy
- 15.8 Regional Expansion Priorities
- 15.9 Short-, Medium- and Long-Term Actions
Chapter 16 Competition Outlook
- 16.1 Industry Competition Characteristics
- 16.2 Market Structure and Concentration
- 16.3 Market Share and Competitive Positioning, 2025
- 16.4 Company-Wise Revenue and Product Benchmarking
- 16.5 Production and Service Capacity Benchmarking
- 16.6 Technology, Pricing and Differentiation
- 16.7 Regional Footprint and Distribution Strength
- 16.8 Mergers, Acquisitions and Strategic Alliances
- 16.9 New Entrants and Competitive Threats
- 16.10 Porter's Five Forces and Industry Attractiveness
- 16.11 Competitive Outlook, 2025-2035
Chapter 17 Company Profiles
- 17.1 Company Coverage and Selection Criteria
- 17.2 Tractor Junction
- 17.2.1 Business Description
- 17.2.2 Company Ownership and Geographic Presence
- 17.2.3 Product and Service Portfolio
- 17.2.4 Manufacturing and Operating Footprint
- 17.2.5 Production Capacity and Expansion Plans
- 17.2.6 Financial Performance and Investment
- 17.2.7 Market Share and Competitive Position
- 17.2.8 Technology and Innovation Capabilities
- 17.2.9 Strategic Alliances or Partnerships
- 17.2.10 Recent Developments
- 17.2.11 Growth Strategy and Outlook
- 17.3 Tractor For Everyone
- 17.4 Mahindra & Mahindra
- 17.5 TAFE
- 17.6 Shriram Automall
- 17.7 Tractor Factory
- 17.8 Kotak Mahindra Bank
- 17.9 Unorganized local dealers
- 17.10 Other Relevant Market Participants
Note: Every listed company is profiled on the structure shown under the first company. The company list is preliminary and may change based on research findings, market developments, data availability and client requirements.
Chapter 18 Disclaimer
- 18.1 Research and Forecast Disclaimer
- 18.2 Data Source and Estimation Limitations
Note: The depth of individual sections depends on data availability for this market. Volume, capacity, trade and other unit-based metrics are included where applicable.

