
Small holdings turn farm machines into a seasonal service
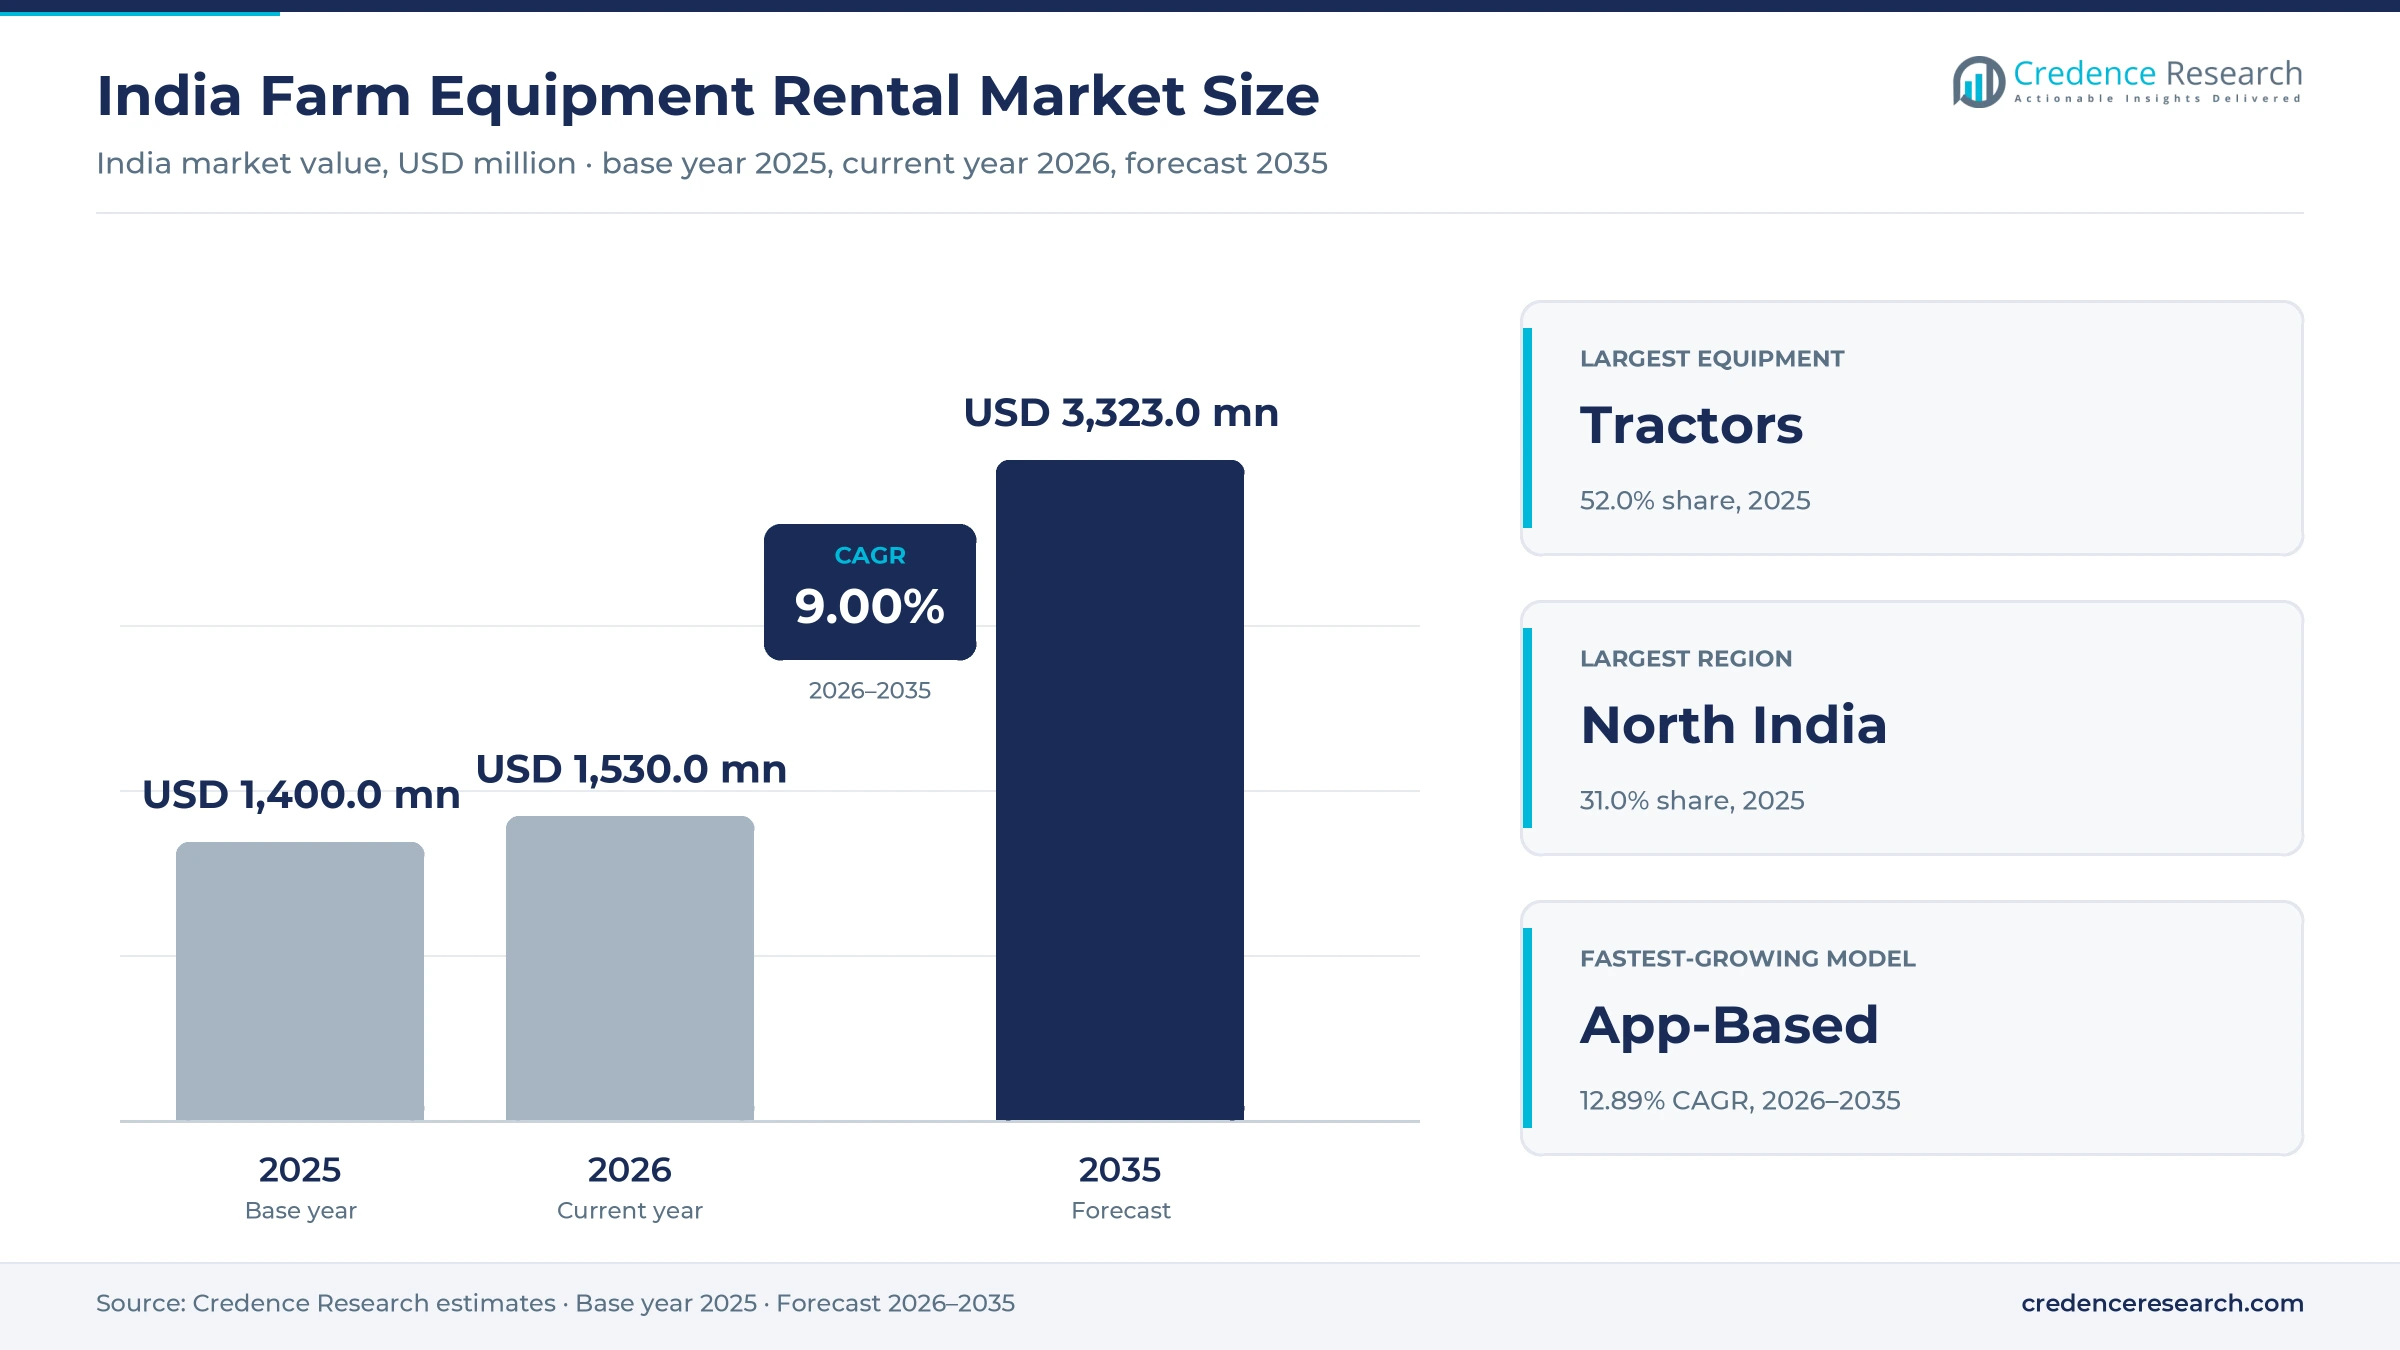
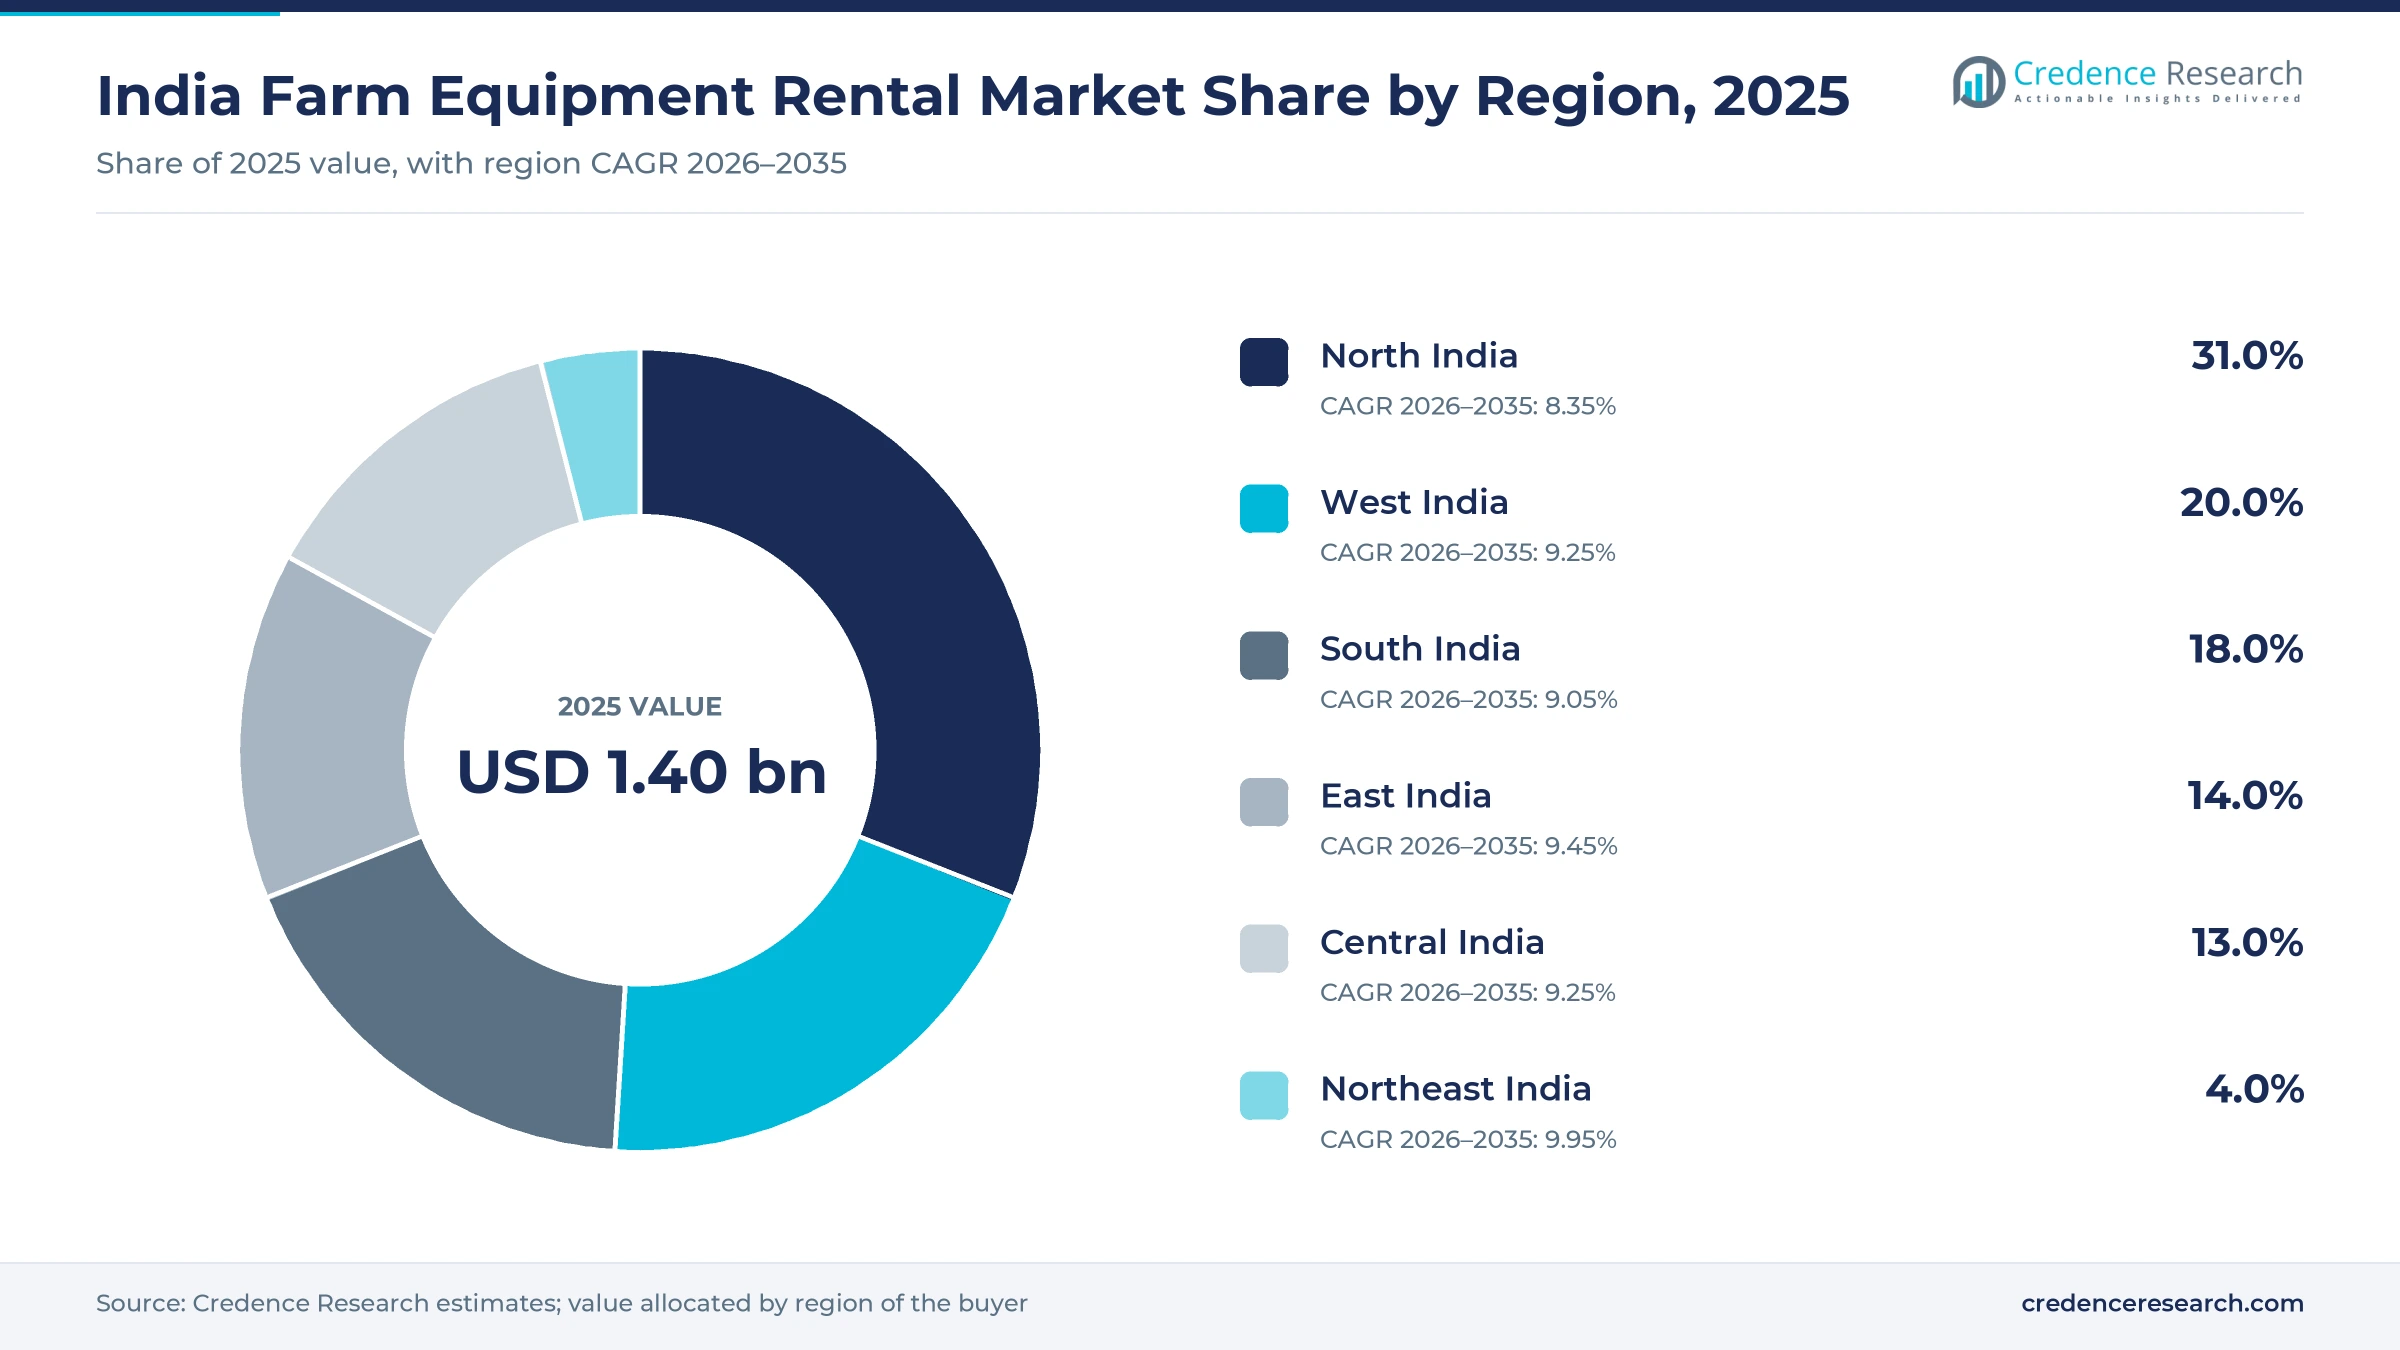
The India farm equipment rental market was valued at USD 1.40 billion in 2025 and is projected to increase from USD 1.53 billion in 2026 to USD 3.32 billion by 2035, registering a CAGR of 9.00% during 2026–2035. Hiring demand comes from small holdings that need a tractor, harvester or sprayer for a few days each season but cannot justify buying one. North India held the largest regional share, 31.0% in 2025, supported by dense wheat and paddy mechanization in Punjab and Haryana. Northeast India is the fastest-growing region at 9.95% a year from a small base, helped by public support that reaches 95% for farm machinery banks in northeastern states. A material commercial change came on Sept. 22, 2025, when India cut the goods and services tax on tractors from 12% to 5%, lowering showroom prices for the owners who supply most hired machine hours. State booking apps are also moving hiring away from informal agents and phone calls.
What does India farm equipment rental cover and how do farmers hire machines?
The market counts rental and hire fees that farmers and farmer groups pay for machine time on tractors, harvesters, rotavators and sprayers. Those fees reach custom hiring centers, farm machinery banks, farmer producer organizations, app-listed owners and neighboring tractor owners who sell spare hours. Farmers usually pay by the acre, the hour or the metric ton, and many arrangements include the operator.
The estimate excludes machine purchases, finance and leasing to dealers, spare parts and earthmoving work outside crop production. The value chain runs from manufacturers and subsidy agencies to machine owners, then through agents, cooperatives or booking apps to the farmer. Because most transactions remain informal and unrecorded, the market value is a Credence Research model estimate rather than a reported industry total. The value reflects machine-hire fees, so gross custom-service spending that includes fuel and operators would be higher.
India Farm Equipment Rental Market Insights
- India farm equipment rental grows from USD 1.40 billion in 2025 to USD 3.32 billion by 2035, a 9.00% annual pace built on small-holding demand for seasonal machine hours.
- North India held 31.0% of 2025 value, as Punjab and Haryana combine high wheat and paddy mechanization with a large subsidized crop residue machine fleet.
- Tractors led equipment with 52.0% of 2025 value, because most hired fieldwork begins with tractor power from owners selling spare hours after their own fields finish.
- Tamil Nadu launched e-Vaadagai 2.0 in February 2026 with 9,359 listed machines, showing how state apps are drawing cooperative and private owners into direct farmer booking.
- Packaged hiring earned Punjab centers about INR 1,037 an acre against INR 90 for machine-only rental, according to CEEW, which favors operators supplying tractor, fuel and driver together.
Tractors lead while sprayers and app booking gain fastest
Tractor hours anchor hiring as spraying moves to drones
Based on equipment, the market is categorized into tractors, harvesters, rotavators and sprayers. Tractors led with 52.0% of 2025 value because most hired fieldwork starts with tractor power, and domestic tractor dispatches reached 1.16 million units in fiscal 2026, leaving many owners with spare hours to sell after their own fields are done. Sprayers grow fastest at 11.17% a year, as drone spraying costs INR 400 to INR 800 an acre against INR 800 to INR 1,500 for manual spraying, according to a June 2026 comparison by Agri Farming.
Village owners dominate while booking apps scale quickly
Based on model, the market is categorized into CHCs, app-based platforms and informal hiring. Informal arrangements led with 63.0% of 2025 value because village owners remain the nearest source of machine hours, with only two to three private harvesters in each Cauvery Delta revenue village, according to DT Next in February 2026. App-Based platforms grow fastest at 12.89% a year, as Tamil Nadu listed 9,359 machines and 6,844 service providers on e-Vaadagai 2.0 at its February 2026 launch, again according to DT Next.
Paddy windows drive value while cane harvesting accelerates
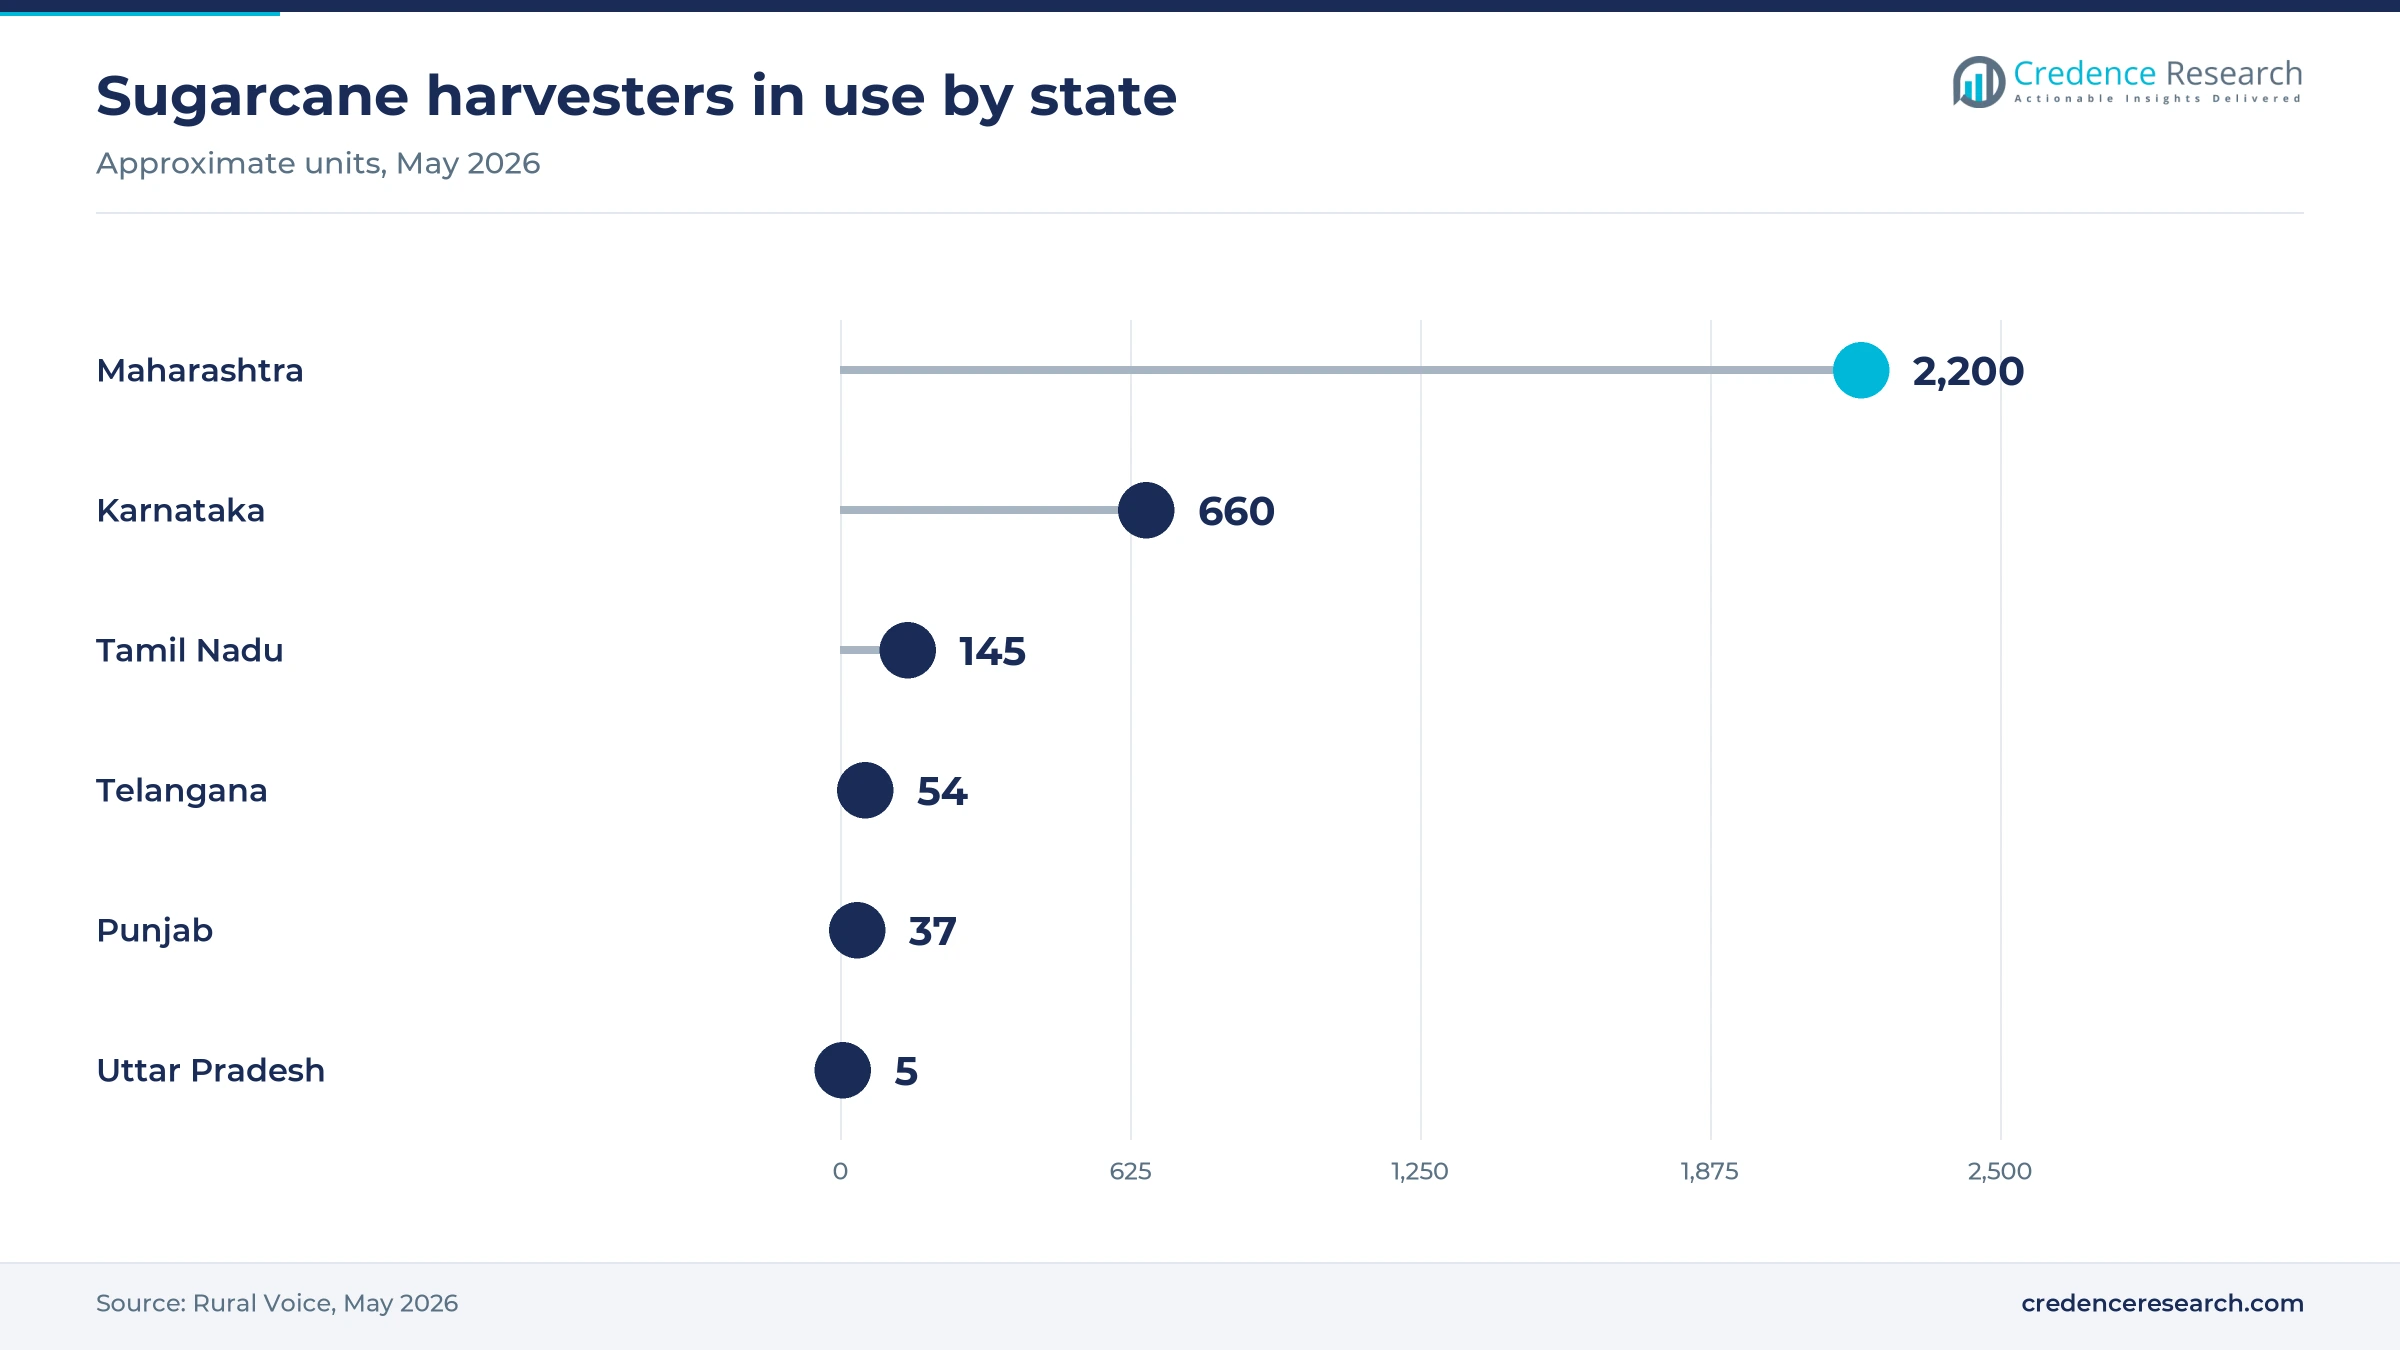
Based on crop, the market is categorized into paddy, wheat and sugarcane. Paddy led with 46.0% of 2025 value because compressed harvest windows concentrate spending, and Cauvery Delta farmers reported paying INR 2,900 to INR 3,200 an hour for harvesters in February 2026, according to DT Next. Wheat follows, with 69% of operations already mechanized in a July 2023 parliamentary committee report summarized by PRS Legislative Research. Sugarcane grows fastest at 9.87% a year, as one Latur mill reached nearly 100% machine harvesting in 2025-26 while Uttar Pradesh had only five of India's roughly 3,218 harvesters, according to Rural Voice in May 2026.
| Segment Group | Leading Sub-segment | Share, 2025 | Fastest-growing Sub-segment | CAGR, 2026–2035 |
|---|---|---|---|---|
| By Equipment | Tractors | 52.0% | Sprayers | 11.17% |
| By Model | Informal | 63.0% | App-Based | 12.89% |
| By Crop | Paddy | 46.0% | Sugarcane | 9.87% |
Request a Free Sample
Fill in your details and we'll send you a free sample report.
- Sample data tables & charts
- Research methodology
Short crop windows and subsidized centers lift hiring
Seasonal operations support pay-per-use machinery
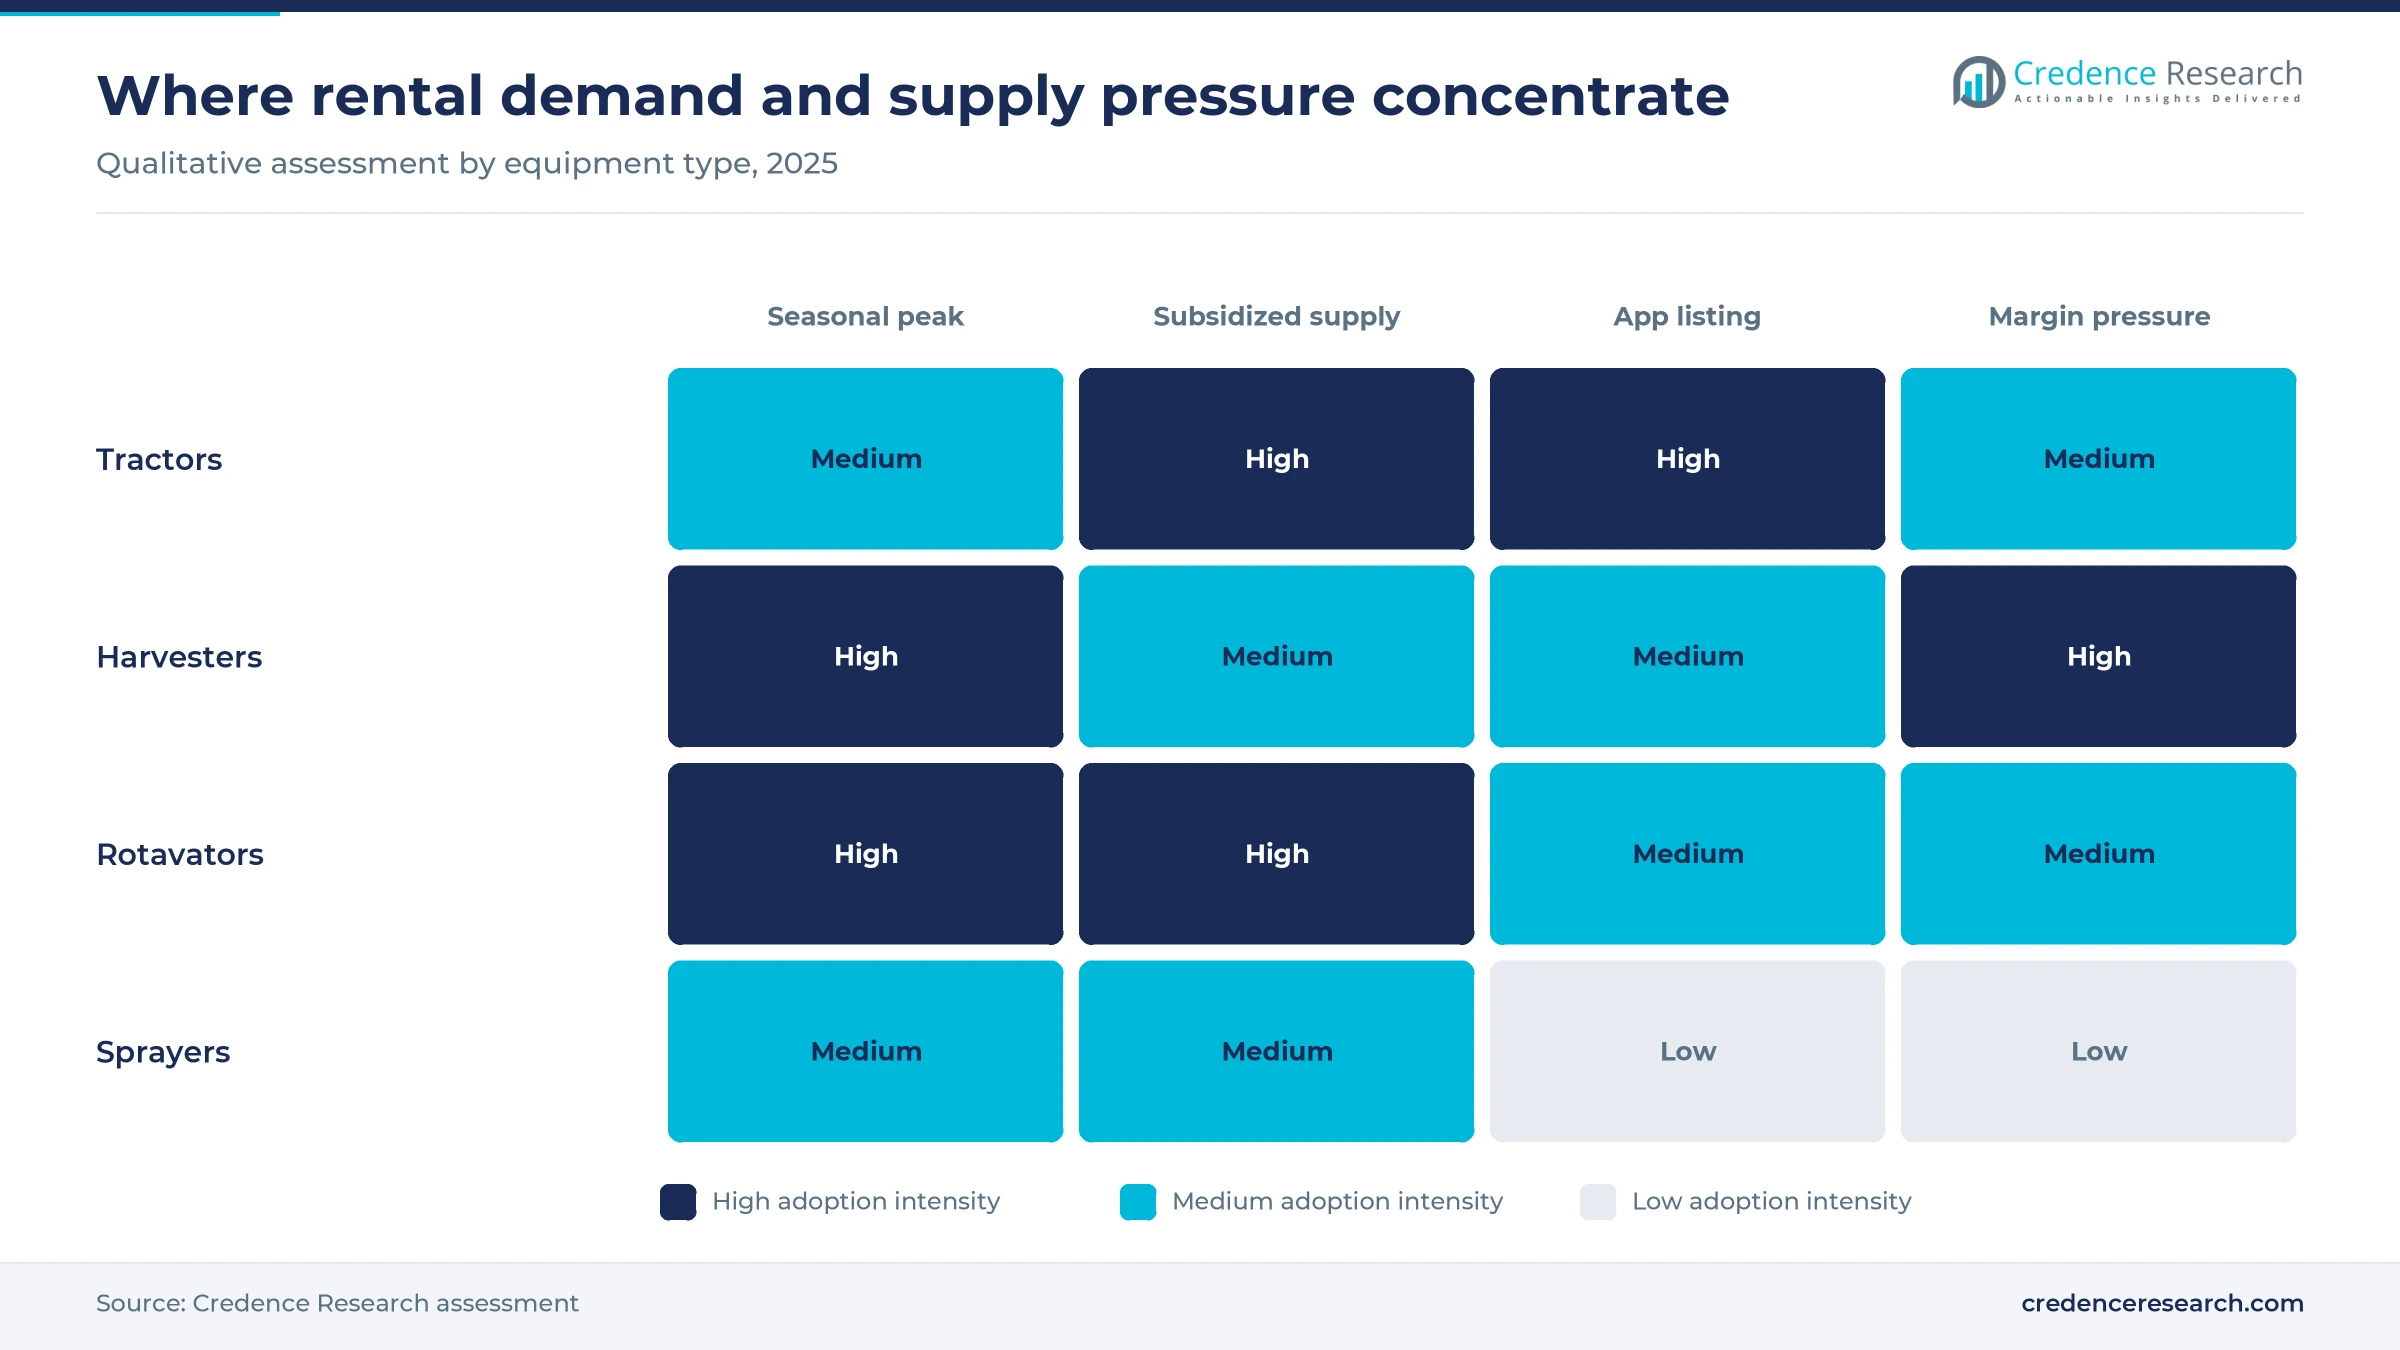
Pay-per-use hiring suits Indian farming because fieldwork arrives in short peaks that a small holding cannot justify owning a machine for. Small and marginal holdings make up 86% of operational holdings, according to a July 2023 parliamentary committee report summarized by PRS Legislative Research. Researchers writing for the International Growth Centre in August 2020 found that hired rotavators saw outstanding hours peak between mid-August and mid-October in kharif 2019 rental data. Combine harvesting takes 25 to 30 minutes an acre at INR 2,000 to INR 3,000, against more than INR 5,000 by hand, according to Vajiram & Ravi in April 2025. In the Credence Research model this adds about 3.8 percentage points to annual growth to 2035.
Custom hiring centers lower equipment ownership barriers
Custom hiring centers let groups and young entrepreneurs carry capital that individual farmers cannot, and they spread each machine across many fields. The agriculture ministry supported 27,554 centers, 25,608 farm machinery banks and 646 hi-tech hubs under its mechanization mission through 2025-26, with support at 40% of project cost up to INR 250 lakh. A well-established center serves about 100 to 200 farmers, according to PRS Legislative Research, which spreads agricultural machinery costs widely. Bihar planned 267 more centers for fiscal 2025-26, capping support at INR 4 lakh each, according to Indian Masterminds in January 2026. In the Credence Research model this adds about 2.3 percentage points to annual growth to 2035.
Digital booking and aggregators improve utilization
Booking platforms raise utilization because they show farmers machines beyond their own village and give owners work after local demand fades. TAFE says its free JFarm Services app, launched in 2017, has reached more than 85,000 farmers across 10 states, linking tractor owners and centers with hirers. Tamil Nadu built e-Vaadagai 2.0 for INR 37.88 lakh and listed 892 cooperative societies and 5,952 private owners, according to DT Next in February 2026. The Food and Agriculture Organization describes EM3Agri as a service model covering land preparation through post-harvest work, which replaces single-machine hire with a season-long relationship. In the Credence Research model this adds about 1.5 percentage points to annual growth to 2035.
Crop residue funding builds a northern rental fleet
Residue control programs have created a large hireable fleet because states routed subsidized machines through group-owned centers rather than individual buyers alone. More than 42,000 residue management centers and over 324,000 machines were in place by June 30, 2025, supported by INR 3,951.16 crore in central funds, according to a Lok Sabha reply of July 2025. Punjab then announced an INR 500 crore action plan in April 2025, offering 50% subsidy to individuals and 80% to groups, cooperatives and village councils, according to The Tribune. Groups that buy at that rate can price hiring lower, which helps explain why North India remains the largest region despite slower tractor sales growth.
Packaged services and drones reshape machine hiring
Shift toward packaged machine, driver and fuel hiring
Operators are shifting toward packaged hiring because margins on bare machine rental rarely cover maintenance. CEEW reported in September 2025 that Punjab centers charged about INR 2,000 an acre for a machine, fueled tractor and driver, against roughly INR 275 an acre for the machine alone. Packaged work earned about INR 1,037 an acre in profit, compared with INR 90 for machine-only rental in that study of 65 operators. All private centers that rent out machines offered packages, against about 39% of government centers. Rate setting reflects the same change, because Tamil Nadu tripartite meetings in January 2026 fixed hourly harvester rates rather than rates for an unattended machine.
Rise of drone spraying as a hired service
Spraying is emerging as a hired service because few small farmers can buy a drone, and service operators can cover many acres in a day. The agriculture ministry recorded 40,928 Kisan Drone demonstrations over 40,918 hectares between 2023-24 and 2025-26, with INR 52.50 crore in support. The Namo Drone Didi program targets 15,000 agricultural drones for women self-help groups, with assistance of 80% up to INR 8 lakh, according to Angel One in July 2025. Coromandel International charged INR 450 an acre with 22 drones and 60 pilots in Andhra Pradesh, according to Deccan Chronicle in August 2024, and planned 110 drones across two states.
Opportunity in Uttar Pradesh cane harvesting
Uttar Pradesh is the clearest open opportunity in cane because its growers still rely almost entirely on hand cutting. Rural Voice reported in May 2026 that the state had five harvesters against about 2,200 in Maharashtra, although roughly 4.5 million mostly smallholder growers supply its mills. Farmers there pay INR 55 to INR 60 a quintal for labor-driven harvesting, which gives a hired service a visible price to beat. The obstacle is organizational, because Maharashtra mills arrange harvesting centrally while Uttar Pradesh growers arrange their own. Mill-led or cooperative pools of sugarcane harvesters costing more than INR 1 crore each could close that gap with bundled field blocks.
Opportunity in small-farm service support and northeastern banks
New public support creates an opening for operators who serve the smallest farms and the hill states. The agriculture ministry listed support of INR 2,000 per hectare in July 2026 for small and marginal farmers using mechanized services through centers, self-help groups and producer organizations. Northeastern states receive up to 95% support for farm machinery banks and 90:10 central funding, which sharply reduces operator capital. Revised mechanization guidelines dated Dec. 18, 2025, also allow 90% assistance up to INR 30 lakh for banks set up by producer organizations of forest rights holders. Farm power averages 2.5 kW per hectare nationally but only 0.7 kW in Mizoram, according to PRS Legislative Research.
Rate gaps, idle machines and thin margins test operators
Agents push peak rates above agreed levels
Peak-season prices often exceed agreed rates because agents control scarce machines during harvest. Tripartite meetings in the Cauvery Delta fixed private belt-type harvesters at INR 2,600 an hour in January 2026, yet farmer leaders reported paying up to INR 3,200, according to DT Next. The state engineering department held only about 30 harvesters, so it could not discipline prices. Small growers carry this cost directly, which weakens trust in hiring. Direct app booking and larger public fleets are the main mitigation.
Idle machines undermine center finances
Many centers struggle financially because their machines sit idle outside narrow windows. CEEW found that about 53% of renting residue centers in Punjab had at least one underused machine in its September 2025 study, and only about 36% reached the roughly 100 acres per Super Seeder needed to break even. Of the 31 centers that shared their accounts, 55% were profitable. Weak returns then slow fleet renewal, because the centers bought far fewer new machines. Multi-crop scheduling and packaged services offer the most practical remedy.
Booking apps have reached few farmers so far
Digital booking remains thin because owners and farmers still prefer personal contacts. CEEW reported in September 2025 that only about 1% of Punjab farmers used the i-Khet app, while about 16% of renting centers had even heard of it. About 10% of renting centers relied on WhatsApp groups instead. This gap limits the utilization gains that platforms promise, particularly for smaller operators with few listed machines. Village-level agents, cooperative listings and vernacular support are the likely ways to widen use.
Fuel and loan costs squeeze cane harvester owners
Cane harvester owners face tight margins because contractual rates have not kept pace with running costs. Owners in Maharashtra told the state sugar commissioner in March 2025 that factories paid INR 450 to INR 500 per metric ton while operating costs reached INR 460, according to the Free Press Journal. They sought a 50% rate increase and a three-year loan extension. Further purchases could slow if returns stay low, because each machine costs more than INR 1 crore. Targeted subsidies and revised mill rates would ease this pressure on owners.
North India leads as eastern and hill states catch up
| Region | Value, 2025 (USD billion) | Share, 2025 | CAGR, 2026–2035 |
|---|---|---|---|
| North India | 0.43 | 31.0% | 8.35% |
| West India | 0.28 | 20.0% | 9.25% |
| South India | 0.25 | 18.0% | 9.05% |
| East India | 0.20 | 14.0% | 9.45% |
| Central India | 0.18 | 13.0% | 9.25% |
| Northeast India | 0.06 | 4.0% | 9.95% |
North India leads on residue fleets and mechanized grain
North India held 31.0% of 2025 value and grows at 8.35% a year as its dense fleet matures. CEEW listed 25,417 residue management centers in Punjab, 8,389 in Uttar Pradesh and 6,775 in Haryana in its September 2025 study, the three main states named in that residue program. Punjab averages 6 kW of farm power per hectare, according to PRS Legislative Research. Autocar Professional reported in April 2026 that the region still takes over a third of tractor sales while growing more slowly than the rest of India.
West India rises with tractors and mill-led cane harvesting
West India held 20.0% of 2025 value and grows at 9.25% a year, helped by strong machine supply and mill demand. Autocar Professional reported nearly 40% of national tractor sales and growth of up to 28% in the region during fiscal 2026. Maharashtra had subsidized 326 cane harvesters with about 100 more proposals under review, at up to INR 35 lakh per machine, according to ChiniMandi in February 2026. Mills pay for this harvesting directly, which gives owners more predictable seasonal work.
South India builds state apps and harvester hubs
South India held 18.0% of 2025 value and grows at 9.05% a year, supported by state-run hiring channels and paddy harvest demand. Tamil Nadu sets public rates, with engineering department tyre-type harvesters at INR 1,160 an hour in January 2026, according to DT Next. Karnataka has set up 344 harvester hubs in two years at a cost of INR 130 crore, according to Deccan Herald. The region also holds about 660 cane harvesters in Karnataka and 145 in Tamil Nadu, according to Rural Voice.
East India grows from new centers and strong subsidies
East India held 14.0% of 2025 value and grows at 9.45% a year as public programs add supply to low-mechanization districts. Bihar selected 221 farmers by online lottery to run centers in fiscal 2025-26, according to Indian Masterminds in January 2026. The state also offers subsidies across 91 machinery categories, according to Autocar Professional. In northern West Bengal, 32 Siliguri centers each served more than 400 farmers in June 2023, according to Tractor News, showing how producer companies can run hiring locally.
Central India relies on young operators and service models
Central India held 13.0% of 2025 value and grows at 9.25% a year, driven by tractor and rotavator hiring in districts with few machine owners. Madhya Pradesh offers educated young farmers capital subsidy and interest rebates of up to 3% to open centers. Shahdol district alone had 52 centers by May 2025, according to a report from the IANS news agency. EM3 built its early network in this region, with 10 service centers and 8,000 farms claimed by August 2017, according to TechCrunch.
Northeast India starts small with the fastest growth
Northeast India held 4.0% of 2025 value and grows fastest at 9.95% a year from a low mechanization base. Mizoram averages 0.7 kW of farm power per hectare, among the lowest levels reported by PRS Legislative Research. The agriculture ministry offers the region up to 100% subsidy on small machinery and its highest support for farm machinery banks, which suits small terraced plots and power tillers. TAFE also lists Assam among the states served by its JFarm Services booking app, so private supply can follow public banks.
Tax, subsidy and app changes marked 2025 and 2026
| Development | Status and market relevance |
|---|---|
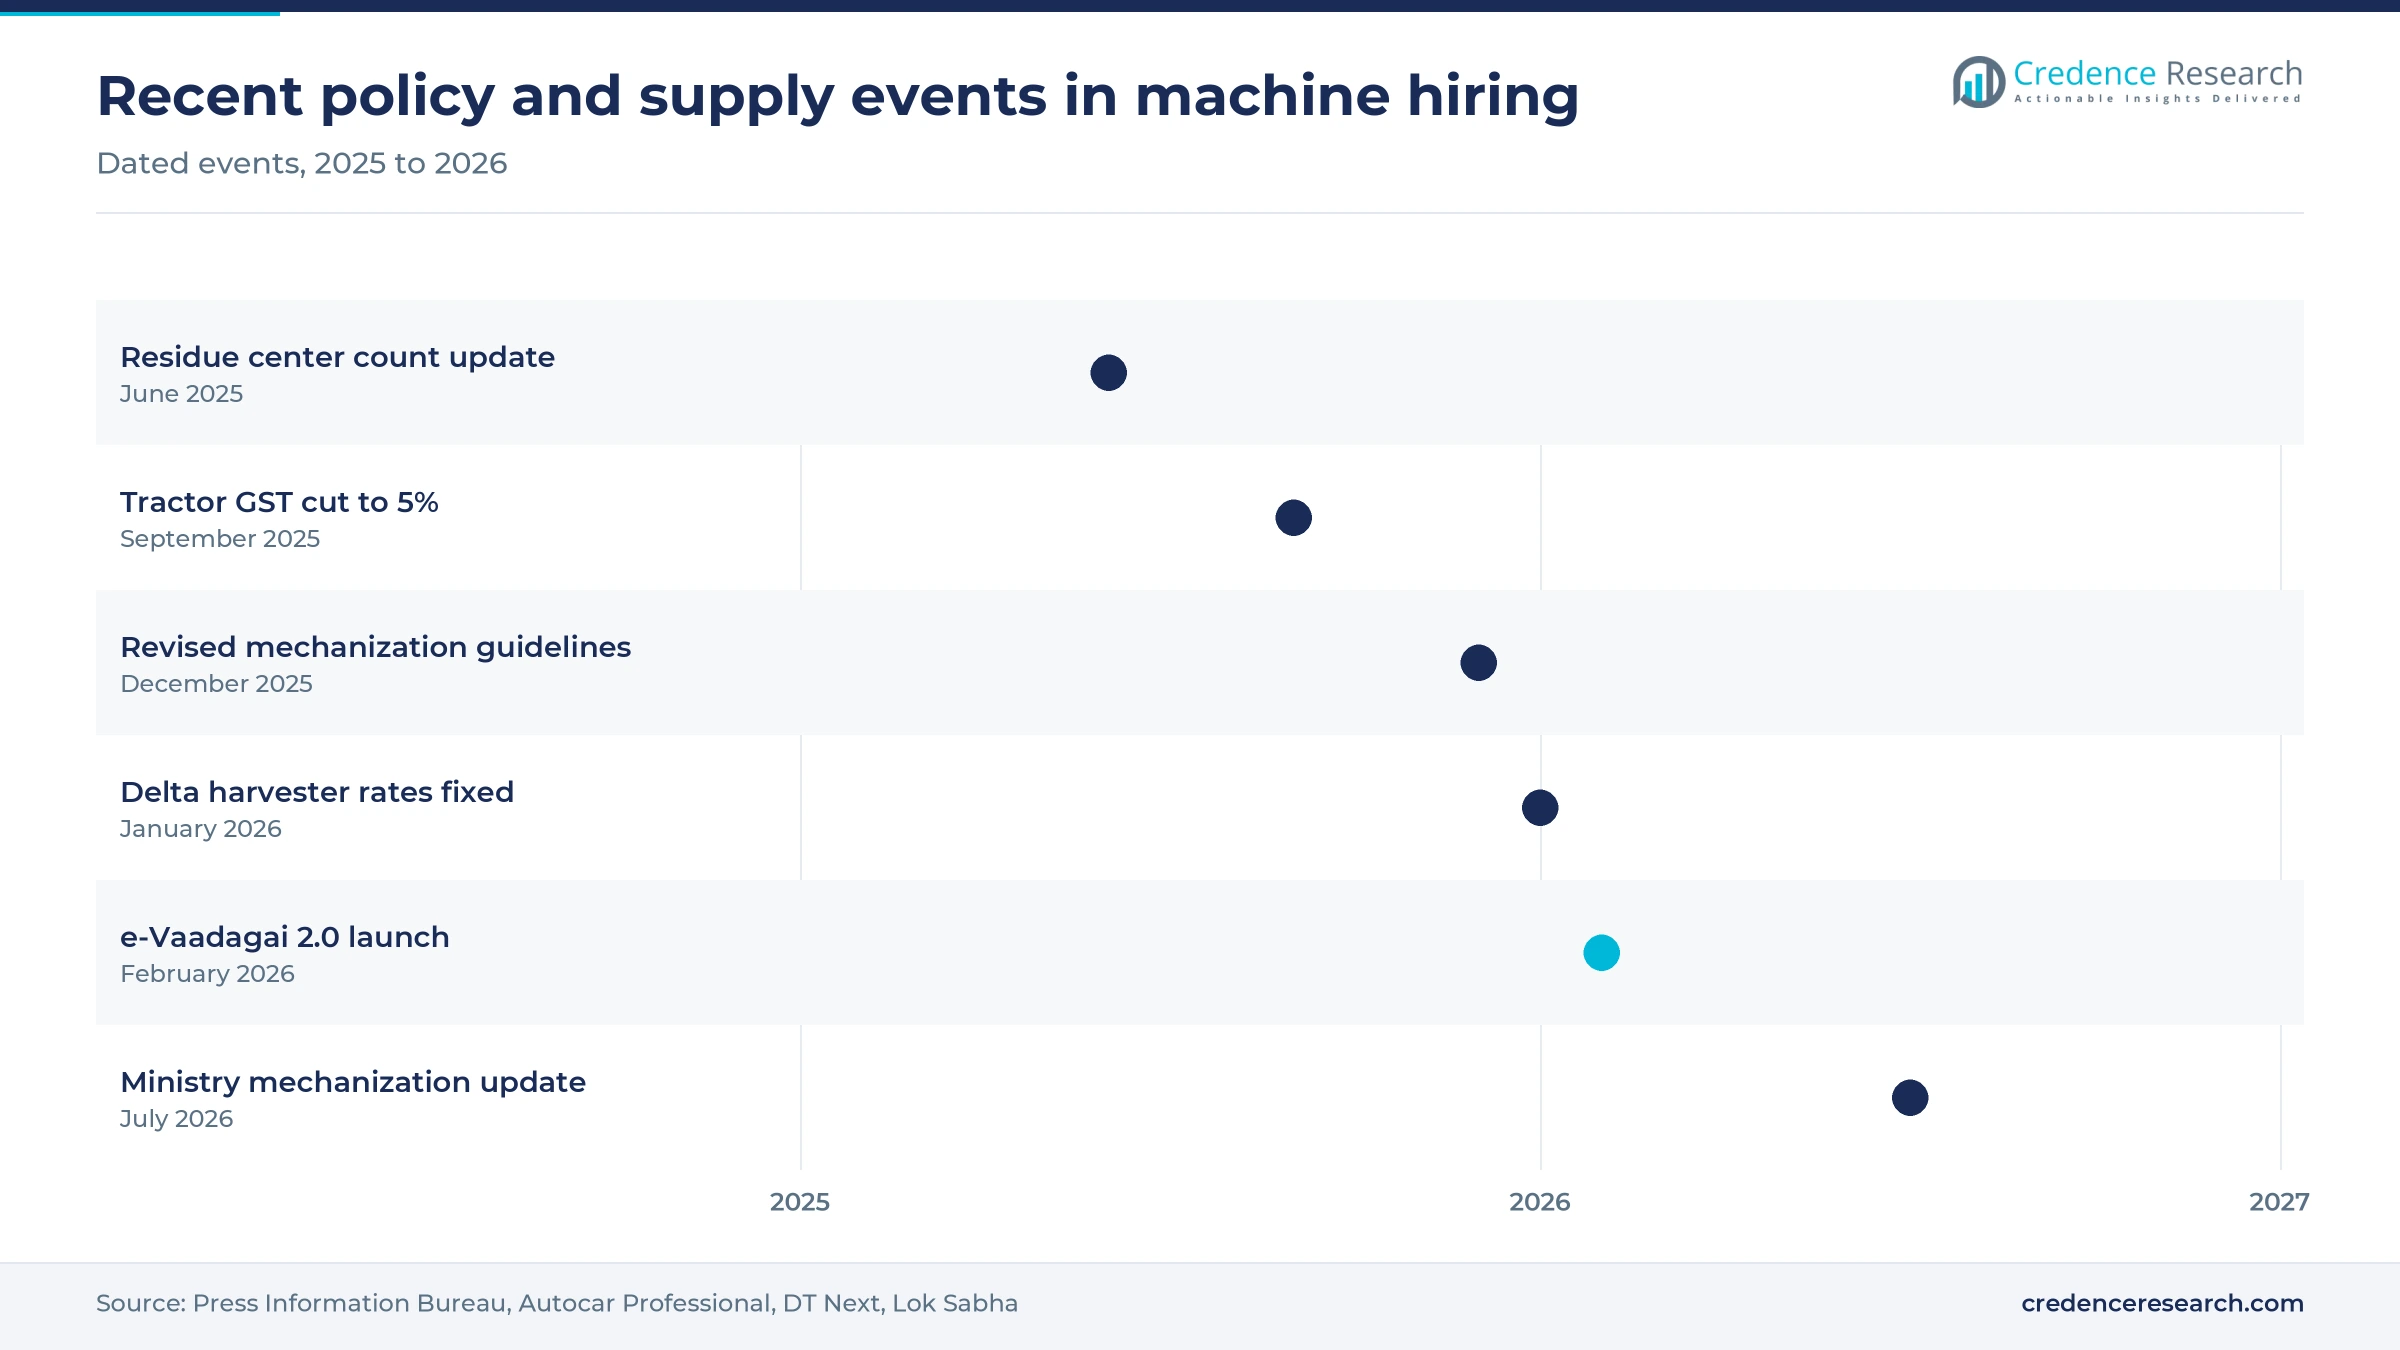
| In September 2025, India cut the goods and services tax on tractors from 12% to 5%, effective Sept. 22, lowering showroom prices by INR 40,000 to INR 60,000 depending on horsepower. | In force; it lowers entry cost for owners who sell spare hours |
| In December 2025, the agriculture ministry revised its mechanization mission guidelines, keeping custom hiring center support at 40% of project cost up to INR 250 lakh. | In force; it sets the capital terms for new centers |
| In January 2026, tripartite meetings in the Cauvery Delta fixed private harvester rates at INR 1,850 to INR 2,600 an hour for the samba and thalady harvests. | Completed; farmers reported higher rates through agents |
| In February 2026, Tamil Nadu launched e-Vaadagai 2.0, listing 9,359 machines and 6,780 implements for tractors, paddy transplanters, harvesters and drones. | Live; it extends booking to cooperative and private owners |
| In July 2026, the agriculture ministry reported INR 9,404.47 crore of support under the mission since 2014-15, including 2.16 million machines supplied to individual farmers. | Reported; it shows the scale of public fleet support |
Booking apps, drones and cane harvesters widen supply
- Booking apps list machines and service providers by location, as e-Vaadagai 2.0 does for 6,844 providers in Tamil Nadu, which reduces the role of agents.
- Kisan Drones turn spraying into an acre-based service, and Deccan Chronicle reported they need about 10 liters of water an acre against about 200 by conventional methods.
- Cane harvesters replace scarce cutting crews, and one Latur mill reached nearly 100% machine harvesting in 2025-26, according to Rural Voice.
- Georeferencing gives public centers a checkable location, since the December 2025 guidelines require new center establishments to be uploaded through a mobile application.
Need a Custom Version of This Report?
Tailor the scope, geography, or segments to your exact requirements.
- Custom geography or segment scope
- Direct access to our analyst team
Village owners and subsidized centers set local prices
Competition is local and fragmented, because a farmer usually compares the nearest tractor owner with the nearest subsidized center rather than national brands. Village owners set most prices, often through agents during harvest, while centers and machinery banks funded under the mechanization mission provide a lower-priced reference in many districts. EM3 Agri Services competes on season-long service, covering land preparation through post-harvest work, instead of single-machine hire. JFarm Services takes a platform approach, using a free TAFE app to connect owners, centers and farmers across states. Farmer producer organizations and cooperative societies compete through membership, and Tamil Nadu lists 892 cooperative societies on its state app. Coromandel International shows how input companies can enter through drone spraying, using a per-acre service rate. Scale matters less than timing, because the operator who arrives during the harvest window usually wins the job.
Companies profiled and their roles in this market
| Company | Type | Role in the market |
|---|---|---|
| EM3 Agri Services | Farming-as-a-service provider | Described by FAO as a full-cycle mechanized service model, with 10 service centers and 8,000 farms claimed in August 2017 |
| JFarm Services (TAFE) | Booking platform | Runs a free app linking tractor owners and custom hiring centers with farmers in about 10 states |
| FPO/CHC networks | Group-owned operators | Run subsidized centers and machinery banks, including producer company centers around Siliguri |
| Coromandel International | Input company service arm | Offered drone spraying at INR 450 an acre in Andhra Pradesh in 2024 with plans for 110 drones |
| Tamil Nadu Agricultural Engineering Department | State operator and platform owner | Hires out its own machines at public rates and runs e-Vaadagai 2.0 for cooperative and private owners |
Utilization will decide which rental operators earn
Credence Research's view is that utilization, not fleet size, will decide who earns in this market. India already has tens of thousands of subsidized centers, and CEEW evidence from Punjab shows that many still miss break-even acreage on single-purpose machines. Operators should favor multi-crop fleets, packaged services and contracted acreage through producer organizations or mills. Policymakers can raise returns by funding services per hectare, as the July 2026 ministry support does, rather than machines alone. The most assumption-heavy figure is the informal share, because village hiring has no reported national statistic.
How the rental market estimates were built
The report uses 2025 as the base year and 2035 as the forecast year. Market values come from the Credence Research model, and regional and segment splits are Credence Research estimates built from public data on holdings, subsidized centers, tractor sales and crop patterns. Source types used were Indian government releases and parliamentary replies, the Food and Agriculture Organization, policy research bodies, company pages and named trade or news publishers. No interviews or surveys were conducted for the preparation of this report. Rates cited are observations from named places and dates, not national averages.
Hiring moves from village habit toward booked service
India farm equipment rental should move from USD 1.53 billion in 2026 to USD 3.32 billion by 2035, as hiring shifts gradually from village habit toward booked and packaged service. Tractors should remain the largest pool of hours, while spraying and cane harvesting add the newest demand. North India is likely to lose some share to eastern and northeastern states as public support reaches lower-mechanization areas. Informal owners will keep most transactions through much of the period, although state apps and producer organizations should narrow that lead. Operators who secure full-season work should capture a disproportionate share of value.
Frequently Asked Questions
How big is the India farm equipment rental market?
Which region leads India farm equipment rental?
Which equipment type generates the most rental value?
How many custom hiring centers does India have?
What do farmers pay to hire machines in India?
Are booking apps replacing informal tractor hiring?
Why is sugarcane the fastest-growing crop segment?
What are the main risks for rental operators?
Table of Content
Chapter 1 Market Segmentation
- 1.1 Segmentation Framework
- 1.1.1 Product and Service Classification
- 1.1.2 Application and End-Use Classification
- 1.1.3 Technology and Solution Classification
- 1.1.4 Customer and Distribution Channel Classification
- 1.1.5 Geographic Segmentation
- 1.1.6 Market Segment Definitions and Boundaries
- 1.2 By Equipment
- 1.2.1 Tractors
- 1.2.2 Harvesters
- 1.2.3 Rotavators
- 1.2.4 Sprayers
- 1.3 By Model
- 1.3.1 Informal
- 1.3.2 CHCs
- 1.3.3 App-Based
- 1.4 By Crop
- 1.4.1 Paddy
- 1.4.2 Wheat
- 1.4.3 Sugarcane
Chapter 2 Introduction
- 2.1 Report Objectives and Scope
- 2.2 Product Definition and Industry Terminology
- 2.3 Market Inclusions and Exclusions
- 2.4 Research Process
- 2.4.1 Primary Research and Expert Interviews
- 2.4.2 Secondary Research and Source Review
- 2.4.3 Top-Down and Bottom-Up Estimation
- 2.4.4 Data Triangulation and Verification
- 2.5 Market Size Measurement Basis
- 2.5.1 2025: USD 1.40 billion → 2035: USD 3.32 billion
- 2.6 Historical and Forecast Reference Periods
- 2.6.1 Historical Period: 2018-2025
- 2.6.2 Base Year: 2025
- 2.6.3 Forecast Period: 2025-2035
- 2.7 Research Assumptions and Limitations
Chapter 3 Executive Summary
- 3.1 Market Snapshot and Key Findings
- 3.2 Base-Year Market Size, 2025
- 3.3 Forecast Market Size, 2035
- 3.4 Revenue and Volume Growth Outlook
- 3.5 Key Demand and Supply Indicators
- 3.6 Leading Market Segments
- 3.7 Fastest-Growing Market Opportunities
- 3.8 Regional Performance Highlights
- 3.9 Technology and Industry Transformation
- 3.10 Competitive Landscape Summary
- 3.11 Analyst View and Strategic Implications
Chapter 4 India Farm Equipment Rental Market Trends and Developments
- 4.1 Historical Industry Development, 2018-2025
- 4.2 Recent Market Trends and Developments
- 4.3 Demand and Customer Behavior Trends
- 4.4 Technology and Product Innovation
- 4.5 Artificial Intelligence, Automation and Digitalization
- 4.6 Local Manufacturing and Supply Chain Realignment
- 4.7 Industry Partnerships, Mergers and Acquisitions
- 4.8 Sustainability and Circular Economy Developments
- 4.9 Government and Private Sector Investment Trends
- 4.10 Emerging Business Models and Commercialization
- 4.11 Industry Developments and Announcements
Chapter 5 India Farm Equipment Rental Market Production, Supply and Demand Analysis
- 5.1 Demand Trend and Consumption Analysis, 2018-2025
- 5.2 Demand Forecast, 2025-2035
- 5.3 Production and Output Trend, 2018-2025
- 5.4 Production and Output Forecast, 2025-2035
- 5.5 Installed Capacity and Capacity Utilization
- 5.6 Company-Wise Production Plants and Statistics
- 5.6.1 Installed Production Capacity
- 5.6.2 Actual Production
- 5.6.3 Planned Capacity and Expansion Targets
- 5.7 Supply Chain Structure and Procurement Trends
- 5.8 Supply-Demand Gap and Bottlenecks
- 5.9 Import Dependence and Sourcing Structure
- 5.10 Contract Manufacturing and Outsourcing
- 5.11 Regional Supply and Demand Concentration
Chapter 6 India Farm Equipment Rental Market Pricing Analysis
- 6.1 Pricing Structure and Measurement
- 6.2 Historical Pricing Trends, 2018-2025
- 6.3 Pricing Outlook, 2025-2035
- 6.4 Average Selling Price and Unit Economics
- 6.5 Pricing by Product and Market Segment
- 6.6 Geographic Pricing Differences
- 6.7 Key Input, Energy, Labor and Logistics Costs
- 6.8 Contract Pricing and Purchasing Models
- 6.9 Pricing Sensitivity and Competitive Positioning
- 6.10 Price, Margin and Profitability Implications
Chapter 7 India Farm Equipment Rental Market Dynamics
- 7.1 Market Growth Drivers
- 7.1.1 Demand-Side Drivers
- 7.1.2 Technology and Innovation Drivers
- 7.1.3 Infrastructure and Investment Drivers
- 7.1.4 Regulatory and Policy Drivers
- 7.2 Market Restraints
- 7.2.1 Cost and Affordability Constraints
- 7.2.2 Technology and Adoption Barriers
- 7.2.3 Supply Chain and Operational Constraints
- 7.3 Market Challenges
- 7.3.1 Competitive Pressure and Margin Erosion
- 7.3.2 Skills, Infrastructure and Implementation Gaps
- 7.4 Emerging Market Opportunities
- 7.5 Market Dynamics Impact and Time-Horizon Assessment
Chapter 8 India Farm Equipment Rental Value Chain Analysis
- 8.1 Industry Value Chain Overview
- 8.2 Upstream Suppliers and Critical Inputs
- 8.3 Technology and Component Providers
- 8.4 Manufacturing or Service Delivery
- 8.5 Distribution, Channel Partners and Integrators
- 8.6 Downstream Applications and End Users
- 8.7 Value Addition and Profit Pools
- 8.8 Vertical Integration and Outsourcing
- 8.9 Supplier Concentration and Risk
- 8.10 Supply Chain Localization and Resilience
Chapter 9 India Farm Equipment Rental Market Regulations and Policies
- 9.1 Relevant Laws, Standards and Compliance Frameworks
- 9.2 Product, Service, Safety and Quality Requirements
- 9.3 Government Policies, Incentives and Subsidies
- 9.4 Imports, Exports and Trade Barriers
- 9.5 Public Procurement and Local Content Requirements
- 9.6 Environmental and Sustainability Compliance
- 9.7 Upcoming Policy Changes and Market Implications
Chapter 10 India Farm Equipment Rental Market Hotspots and Opportunities
- 10.1 Market Opportunity Mapping and Growth Hotspots
- 10.2 High-Growth Applications and Customer Groups
- 10.3 Underserved Markets and White-Space Opportunities
- 10.4 Emerging Technology and Product Opportunities
- 10.5 New Capacity and Investment Hotspots
- 10.6 Market Entry and Expansion Opportunities
- 10.7 Distribution and Partnership Opportunities
- 10.8 Near-Term and Long-Term Commercial Potential
- 10.9 Opportunity Attractiveness and Execution Risks
Chapter 11 India Farm Equipment Rental Market Outlook, 2025-2035
- 11.1 Market Size and Analysis
- 11.1.1 Revenue (Market Measurement: 2025: USD 1.40 billion → 2035: USD 3.32 billion)
- 11.1.2 Market Volume and Quantity Sold
- 11.1.3 Historical Market Size, 2018-2025
- 11.1.4 Base-Year Market Size, 2025
- 11.2 Market Forecast, 2025-2035
- 11.2.1 Revenue Forecast to 2035
- 11.2.2 Volume Forecast to 2035
- 11.2.3 CAGR and Year-on-Year Growth
- 11.2.4 Incremental Revenue Opportunity
- 11.3 Forecast Assumptions and Scenario Analysis
- 11.3.1 Base-Case Forecast
- 11.3.2 Optimistic and Conservative Scenarios
- 11.3.3 Technology, Pricing and Policy Sensitivities
- 11.4 Market Attractiveness and Growth Outlook
Chapter 12 India Farm Equipment Rental Market Segmentation and Outlook
- 12.1 Segmentation Summary and Market Shares, 2025
- 12.2 Largest and Fastest-Growing Segments
- 12.3 By Equipment - Market Size and Forecast, 2025-2035
- 12.3.1 Segment Definition and Scope
- 12.3.2 Historical Market Size, 2018-2025
- 12.3.3 Revenue Forecast, 2025-2035
- 12.3.4 Volume Forecast, 2025-2035
- 12.3.5 Base-Year Market Share, 2025
- 12.3.6 Segment CAGR and Growth Drivers
- 12.3.7 Subsegment Market Size and Forecast
- 12.3.7.1 Tractors
- 12.3.7.2 Harvesters
- 12.3.7.3 Rotavators
- 12.3.7.4 Sprayers
- 12.3.8 Subsegment Pricing and Adoption Trends
- 12.3.9 Leading Suppliers and Competition
- 12.3.10 Regional Demand and Opportunities
- 12.4 By Model - Market Size and Forecast, 2025-2035
- 12.4.1 Segment Definition and Scope
- 12.4.2 Historical Market Size, 2018-2025
- 12.4.3 Revenue Forecast, 2025-2035
- 12.4.4 Volume Forecast, 2025-2035
- 12.4.5 Base-Year Market Share, 2025
- 12.4.6 Segment CAGR and Growth Drivers
- 12.4.7 Subsegment Market Size and Forecast
- 12.4.7.1 Informal
- 12.4.7.2 CHCs
- 12.4.7.3 App-Based
- 12.4.8 Subsegment Pricing and Adoption Trends
- 12.4.9 Leading Suppliers and Competition
- 12.4.10 Regional Demand and Opportunities
- 12.5 By Crop - Market Size and Forecast, 2025-2035
- 12.5.1 Segment Definition and Scope
- 12.5.2 Historical Market Size, 2018-2025
- 12.5.3 Revenue Forecast, 2025-2035
- 12.5.4 Volume Forecast, 2025-2035
- 12.5.5 Base-Year Market Share, 2025
- 12.5.6 Segment CAGR and Growth Drivers
- 12.5.7 Subsegment Market Size and Forecast
- 12.5.7.1 Paddy
- 12.5.7.2 Wheat
- 12.5.7.3 Sugarcane
- 12.5.8 Subsegment Pricing and Adoption Trends
- 12.5.9 Leading Suppliers and Competition
- 12.5.10 Regional Demand and Opportunities
- 12.6 Segment Growth Comparison
- 12.7 Segment Attractiveness and Priority Matrix
Chapter 13 India Farm Equipment Rental Geographic Market Outlook, 2025-2035
- 13.1 Domestic Market Distribution and Demand Clusters
- 13.2 State- or Province-Wise Market Size and Forecast, 2025-2035
- 13.3 City and Metropolitan Market Outlook
- 13.4 Industrial, Manufacturing and Commercial Clusters
- 13.5 Geographic Concentration of Key End Users
- 13.6 Local Pricing and Purchasing Differences
- 13.7 Domestic Production Facilities and Capacity Map
- 13.8 Local Infrastructure and Project Pipeline
- 13.9 State-Level Policy and Incentive Differences
- 13.10 Subnational Investment Hotspots and Opportunities
- 13.11 Distribution and Logistics Networks
- 13.12 Domestic Competitive Footprint
Chapter 14 India Farm Equipment Rental Technology, Innovation and Sustainability Outlook
- 14.1 Technology Landscape and Maturity
- 14.2 Product, Process and Service Innovation
- 14.3 AI, Automation and Digital Tools in the Industry
- 14.4 Technology Adoption and Performance Benchmarking
- 14.5 Innovation Pipeline and R&D Investment
- 14.6 Patent and Intellectual Property Trends
- 14.7 Energy Efficiency and Resource Management
- 14.8 Sustainability, Recycling and Circularity
- 14.9 Technology Roadmap, 2025-2035
- 14.10 Risks of Obsolescence and Technology Substitution
Chapter 15 India Farm Equipment Rental Market Key Strategic Imperatives
- 15.1 Growth and Market Entry Priorities
- 15.2 High-Return Products and Segments
- 15.3 Pricing, Profitability and Cost Optimization
- 15.4 Technology Investment and Product Differentiation
- 15.5 Supply Chain Localization and Resilience
- 15.6 Distribution and Customer Acquisition
- 15.7 Partnership, Acquisition and Capacity Strategy
- 15.8 Regional Expansion Priorities
- 15.9 Short-, Medium- and Long-Term Actions
Chapter 16 Competition Outlook
- 16.1 Industry Competition Characteristics
- 16.2 Market Structure and Concentration
- 16.3 Market Share and Competitive Positioning, 2025
- 16.4 Company-Wise Revenue and Product Benchmarking
- 16.5 Production and Service Capacity Benchmarking
- 16.6 Technology, Pricing and Differentiation
- 16.7 Regional Footprint and Distribution Strength
- 16.8 Mergers, Acquisitions and Strategic Alliances
- 16.9 New Entrants and Competitive Threats
- 16.10 Porter's Five Forces and Industry Attractiveness
- 16.11 Competitive Outlook, 2025-2035
Chapter 17 Company Profiles
- 17.1 Company Coverage and Selection Criteria
- 17.2 EM3 Agri Services
- 17.2.1 Business Description
- 17.2.2 Company Ownership and Geographic Presence
- 17.2.3 Product and Service Portfolio
- 17.2.4 Manufacturing and Operating Footprint
- 17.2.5 Production Capacity and Expansion Plans
- 17.2.6 Financial Performance and Investment
- 17.2.7 Market Share and Competitive Position
- 17.2.8 Technology and Innovation Capabilities
- 17.2.9 Strategic Alliances or Partnerships
- 17.2.10 Recent Developments
- 17.2.11 Growth Strategy and Outlook
- 17.3 JFarm Services (TAFE)
- 17.4 FPO/CHC networks
- 17.5 Coromandel International
- 17.6 Tamil Nadu Agricultural Engineering Department
- 17.7 Other Relevant Market Participants
Note: Every listed company is profiled on the structure shown under the first company. The company list is preliminary and may change based on research findings, market developments, data availability and client requirements.
Chapter 18 Disclaimer
- 18.1 Research and Forecast Disclaimer
- 18.2 Data Source and Estimation Limitations
Note: The depth of individual sections depends on data availability for this market. Volume, capacity, trade and other unit-based metrics are included where applicable.

