Corporate swag platforms turn branded goods into a service
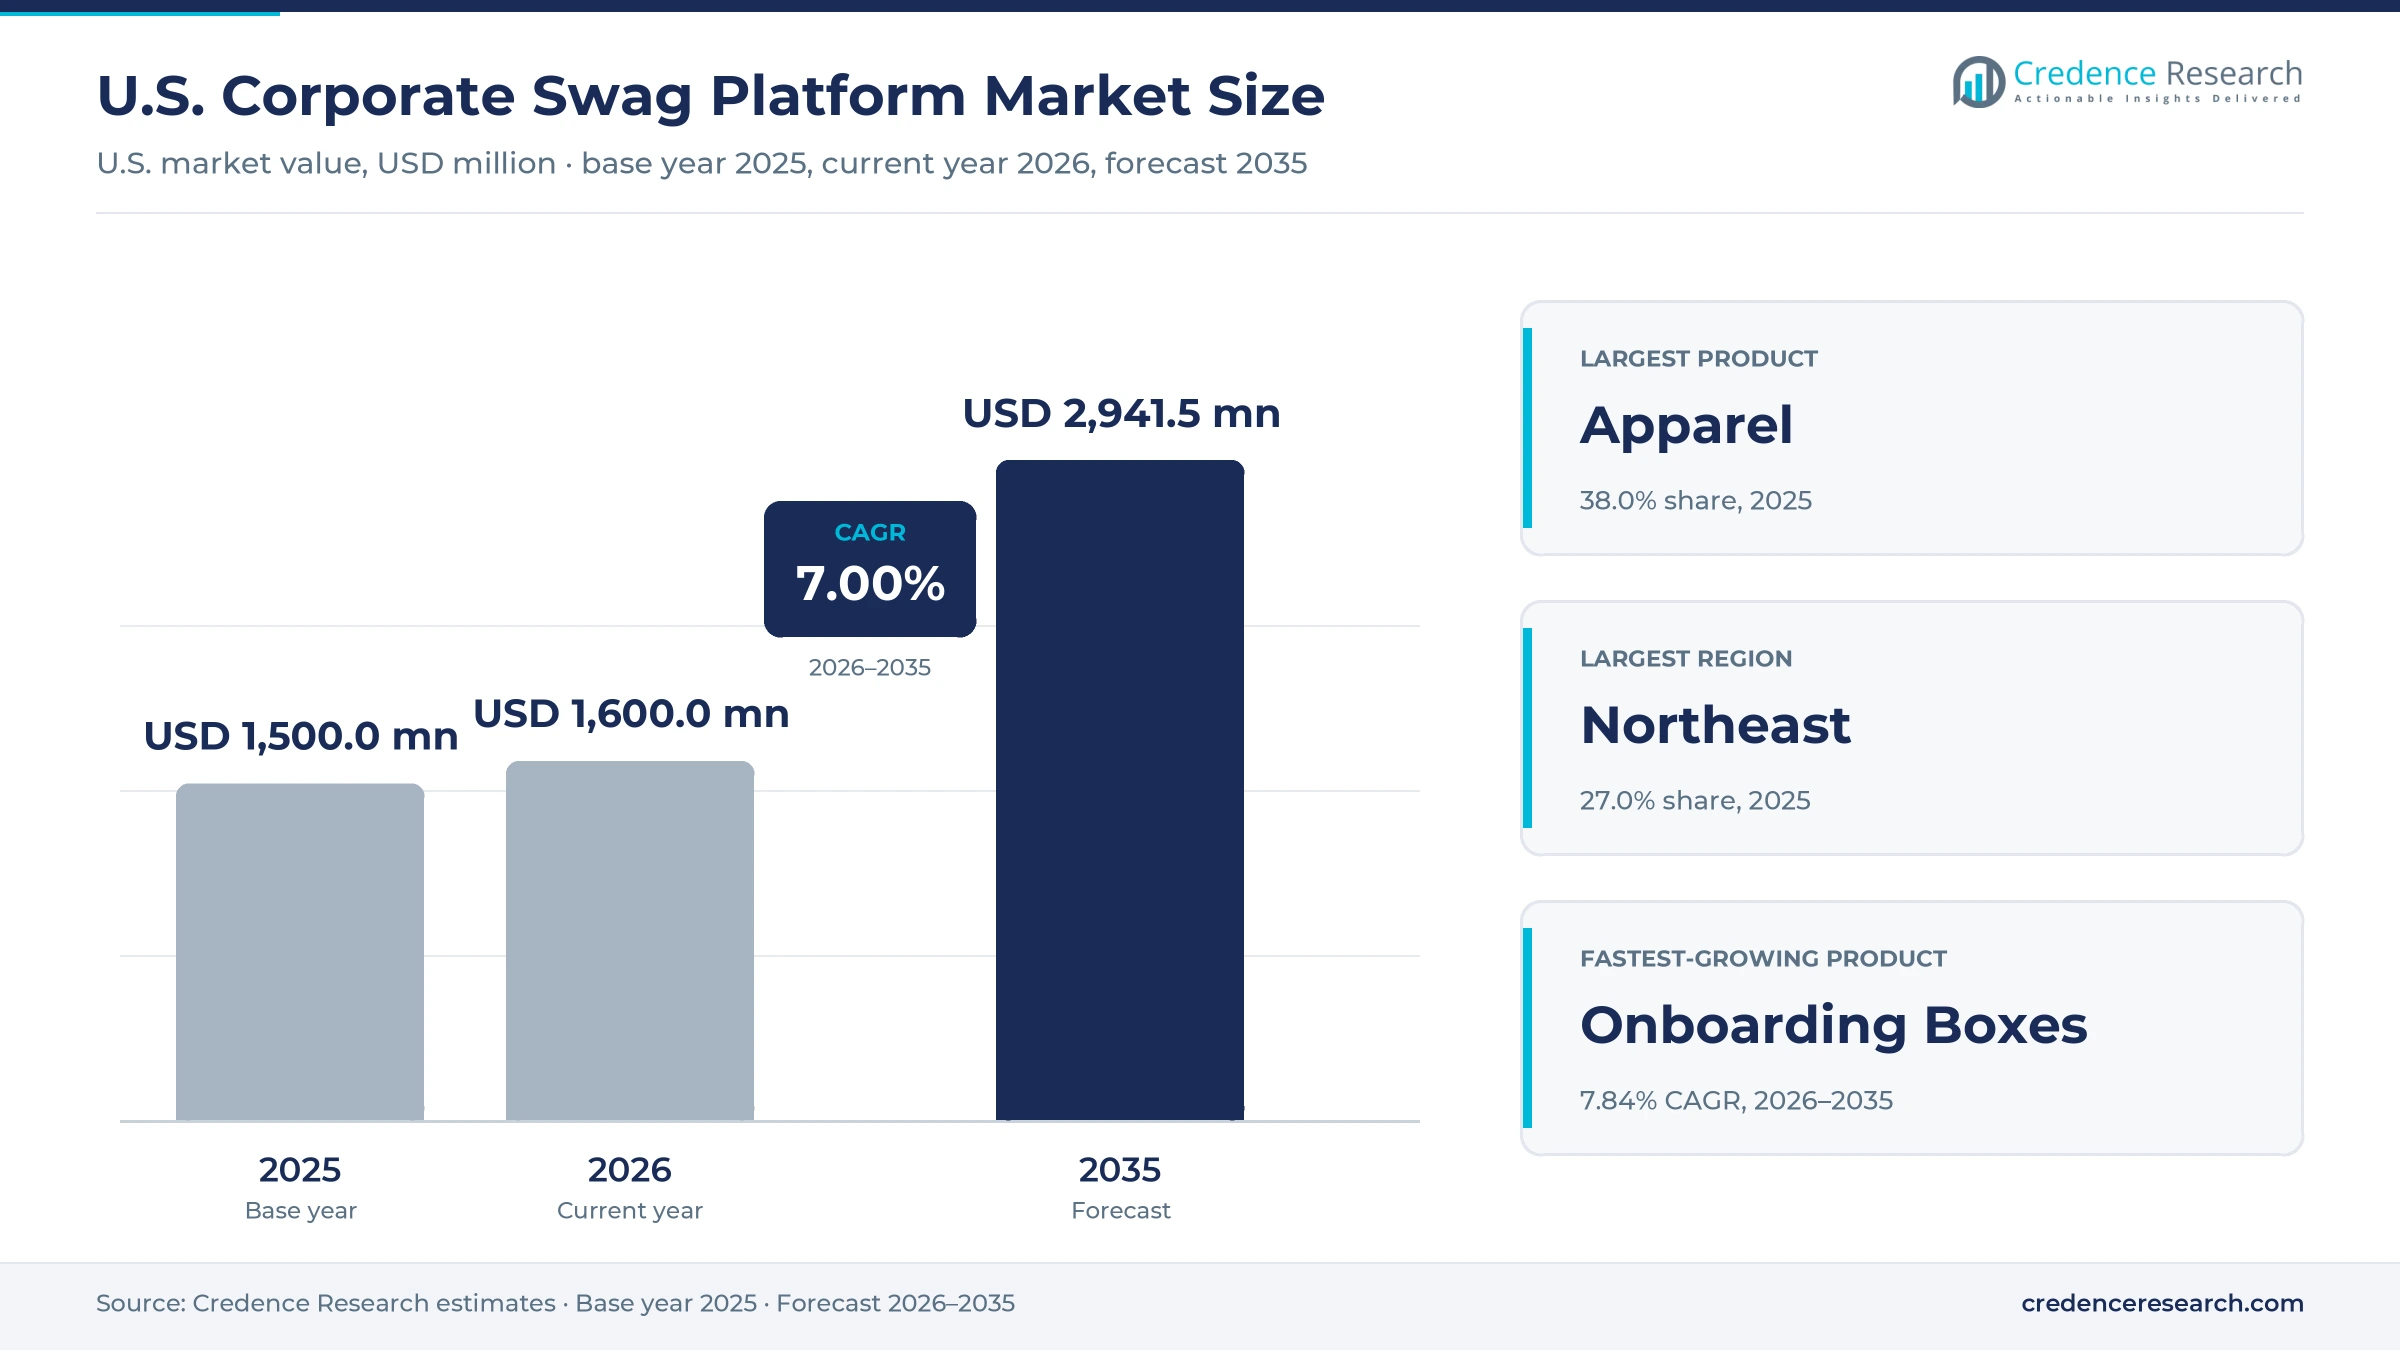
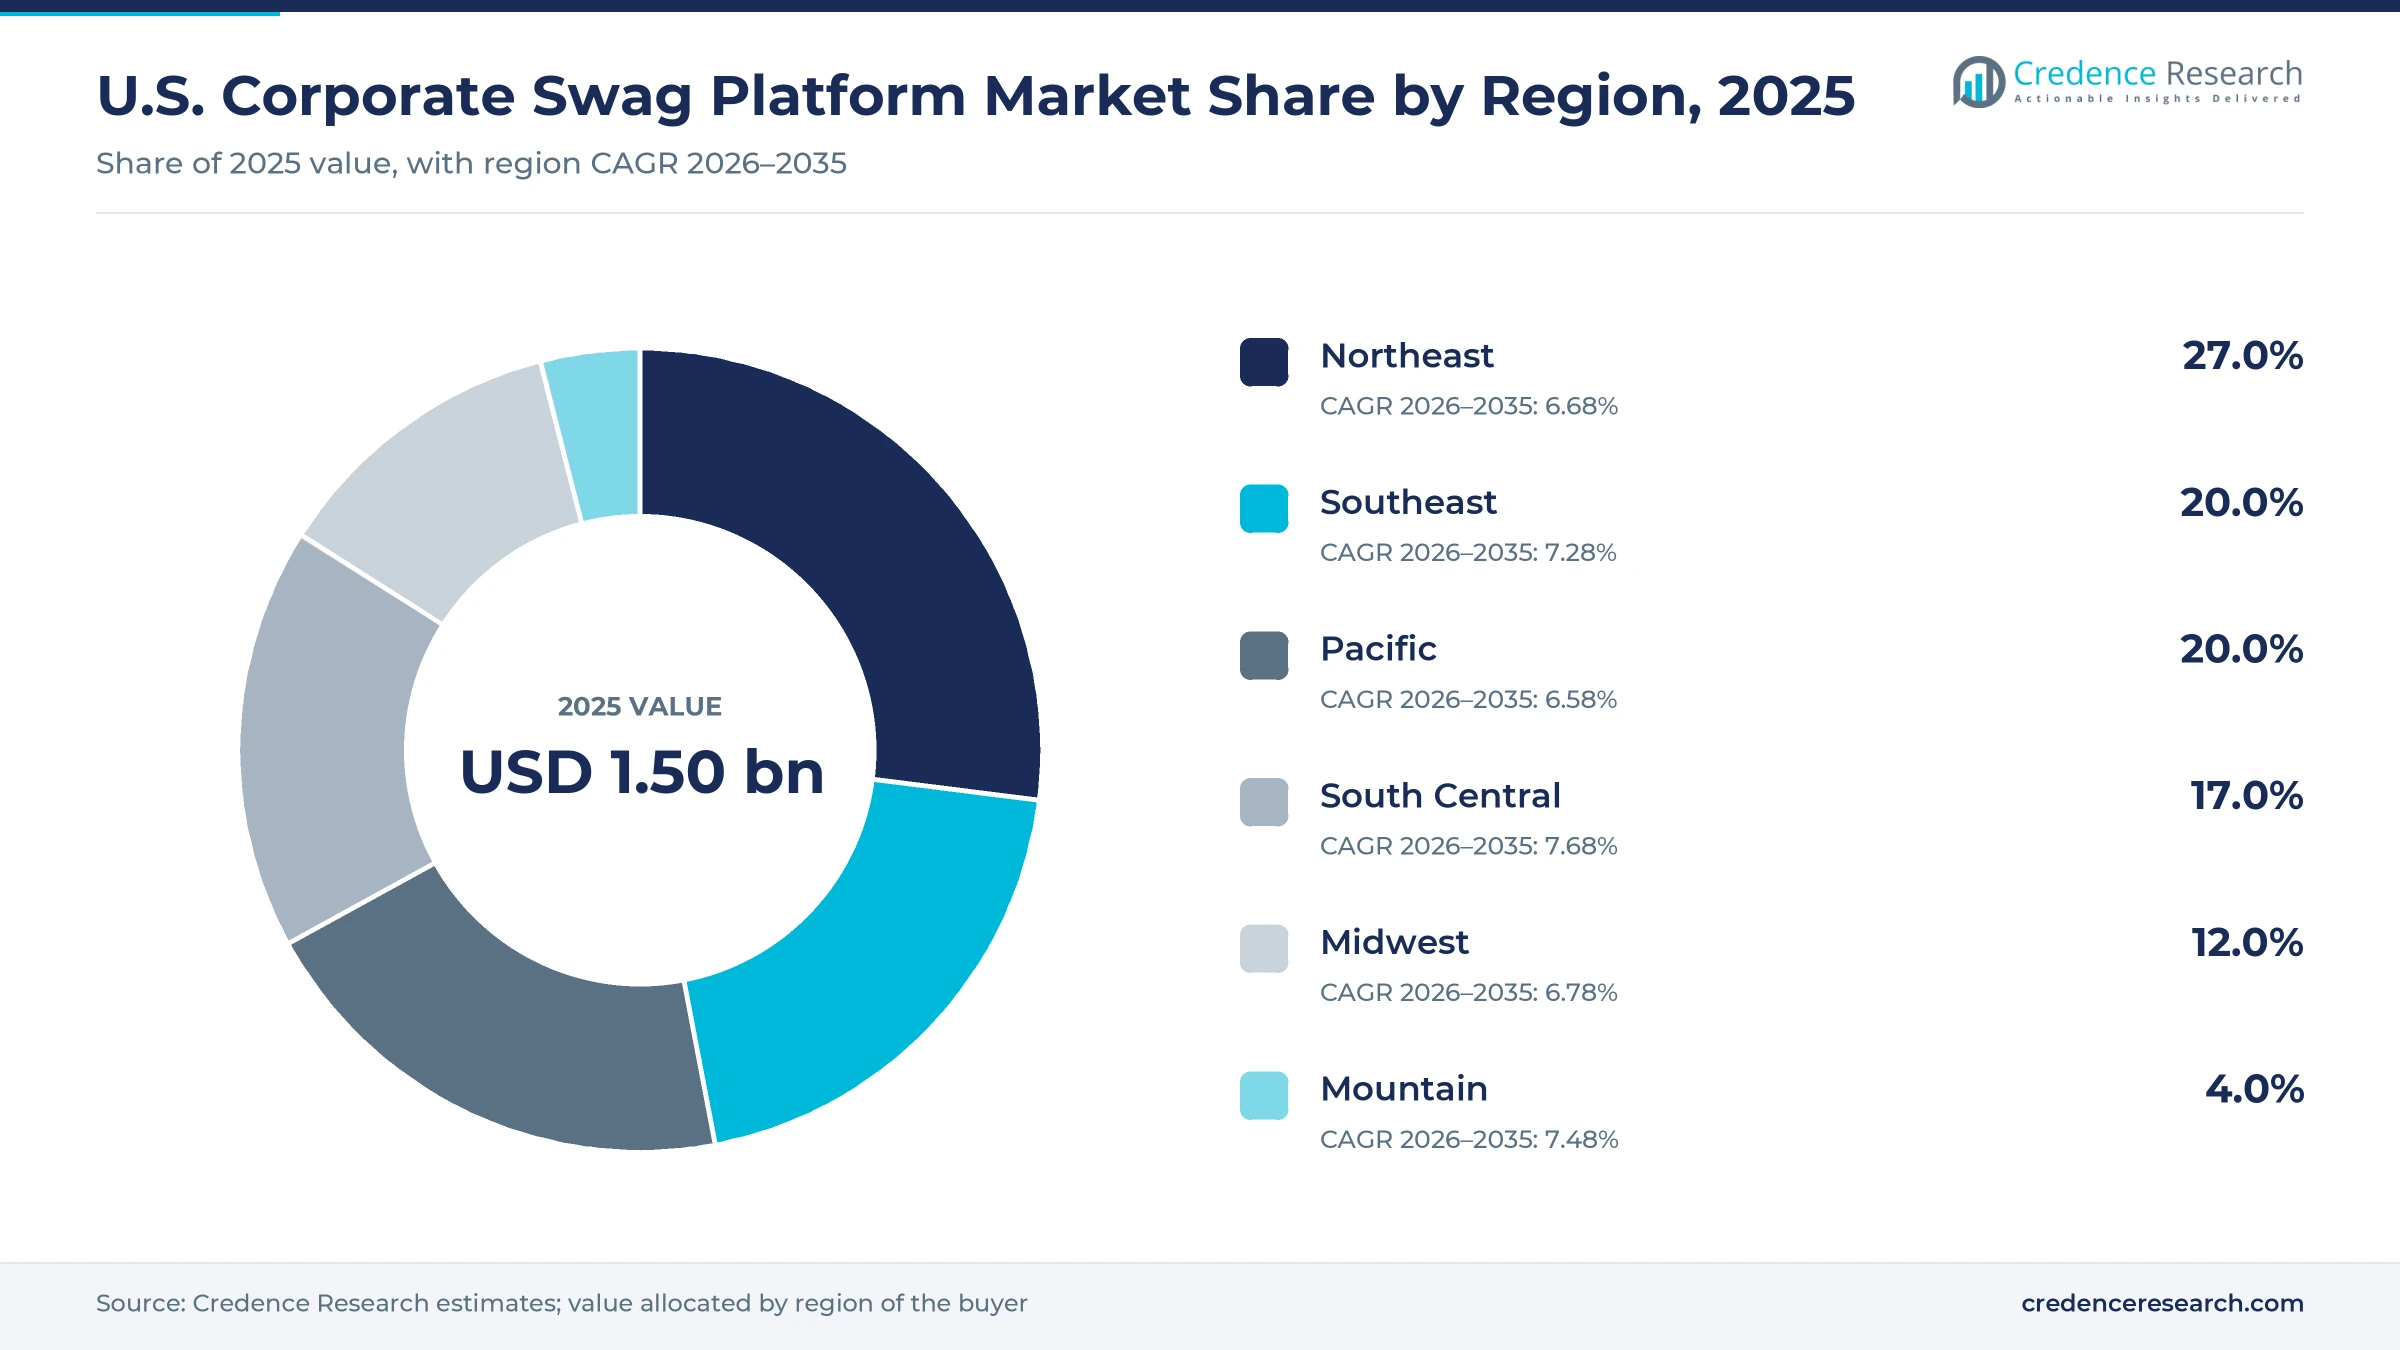
The U.S. corporate swag platform market was valued at USD 1.50 billion in 2025 and is projected to increase from USD 1.60 billion in 2026 to USD 2.94 billion by 2035, registering a CAGR of 7.00% during 2026–2035. Demand comes from HR teams that send welcome boxes to new hires, marketers who stock event booths and sales teams that mail branded gifts through online ordering platforms with storage and fulfillment. The Northeast held the largest regional share, 27.0% in 2025, supported by enterprise headquarters in finance, media and software, while the South Central region grows fastest at 7.68% a year as Texas adds residents. Hiring sets the base of demand, and the Bureau of Labor Statistics counted 62,972,000 U.S. hires in 2025. On the commercial side, Sendoso acquired Merch.co on May 19, 2026, adding print-on-demand production at more than 100 facilities, while BDA bought SwagUp in December 2024.
What do U.S. corporate swag platforms sell to employers?
The market counts what U.S. employers spend on branded merchandise, kits and onboarding boxes ordered through online swag platforms, together with the kitting, storage and fulfillment fees those platforms charge. Value covers apparel, drinkware, tech accessories and packaged kits sent to employees, prospects and event guests, whether bought as one-off on-demand orders or drawn from inventory held in a platform warehouse.
The estimate excludes promotional products sold through traditional offline distributors without a self-serve ordering platform, gift cards, food gifts and travel incentives. Stand-alone software licenses for gifting or recognition tools are also excluded, because buyers purchase them from HR and marketing technology budgets rather than as branded goods.
U.S. Corporate Swag Platform Market Insights
- The market grows from USD 1.50 billion in 2025 to USD 2.94 billion by 2035, a 7.00% CAGR, as employers turn hiring, events and sales outreach into recurring branded shipments.
- The Northeast led with 27.0% of 2025 value, supported by enterprise headquarters such as those served by Piscataway, New Jersey-based SwagUp.
- Apparel held 38.0% of 2025 value, as Gildan completed its HanesBrands acquisition on Dec. 1, 2025, doubling its scale as a garment maker.
- Sendoso acquired Merch.co on May 19, 2026, adding more than 100 production facilities and print-on-demand runs at any quantity.
- PPAI estimated U.S. promotional products distributor sales at $27.1 billion in 2025, with sustainable products at 14% of the total.
Apparel leads while onboarding boxes grow fastest
Why does apparel lead platform swag orders?
Based on product, the market is categorized into apparel, kits, onboarding boxes and event swag. Apparel led with 38.0% of 2025 value because branded tees and hoodies, the core of the wider custom apparel trade, anchor most programs and blank garment maker Gildan doubled its scale when it completed its HanesBrands acquisition on Dec. 1, 2025, according to BNN Bloomberg. Printfection sets a 50-piece minimum for apparel, which keeps shirts in stored inventory. Onboarding Boxes grow fastest at 7.84% a year as employers made 62,972,000 hires in 2025, according to the Bureau of Labor Statistics, and each new hire is a candidate for a welcome box.
How do enterprise, tech and small business buyers differ?
Based on buyer, the market is categorized into tech, SMB and enterprise HR/marketing. Enterprise HR/Marketing buyers led with 40.0% of 2025 value because large employers run recurring programs, and Custom Ink named Salesforce, HubSpot and Zendesk among Printfection's enterprise customers. SwagUp, which BDA acquired in December 2024, grew from startups into enterprise clients such as Nasdaq, Logitech and Northrop Grumman, according to PPAI. SMB buyers grow fastest at 7.78% a year as the Small Business Administration counted 36.2 million small businesses in June 2025, employing nearly 46% of private-sector workers, and self-serve portals let these firms order small runs without an agency.
Why do on-demand orders outweigh warehoused programs?
Based on model, the market is categorized into on-demand and warehousing. On-Demand ordering led with 58.0% of 2025 value because most buyers place one-off orders for a launch, an event or a hire class, and Sendoso bought Merch.co on May 19, 2026, to add more than 100 production facilities for print-on-demand runs at any quantity. Warehousing grows fastest at 7.57% a year as SwagUp bills $5.00 per stored pack, reassessed every six months, and Printfection folds storage into a monthly plan, which turns one-time orders into recurring storage and fulfillment fees.
| Segment Group | Leading Sub-segment | Share, 2025 | Fastest-growing Sub-segment | CAGR, 2026–2035 |
|---|---|---|---|---|
| By Product | Apparel | 38.0% | Onboarding Boxes | 7.84% |
| By Buyer | Enterprise HR/Marketing | 40.0% | SMB | 7.78% |
| By Model | On-Demand | 58.0% | Warehousing | 7.57% |
Request a Free Sample
Fill in your details and we'll send you a free sample report.
- Sample data tables & charts
- Research methodology
Hiring, online ordering and storage contracts lift spend
Onboarding and event kits turn hiring into repeat orders
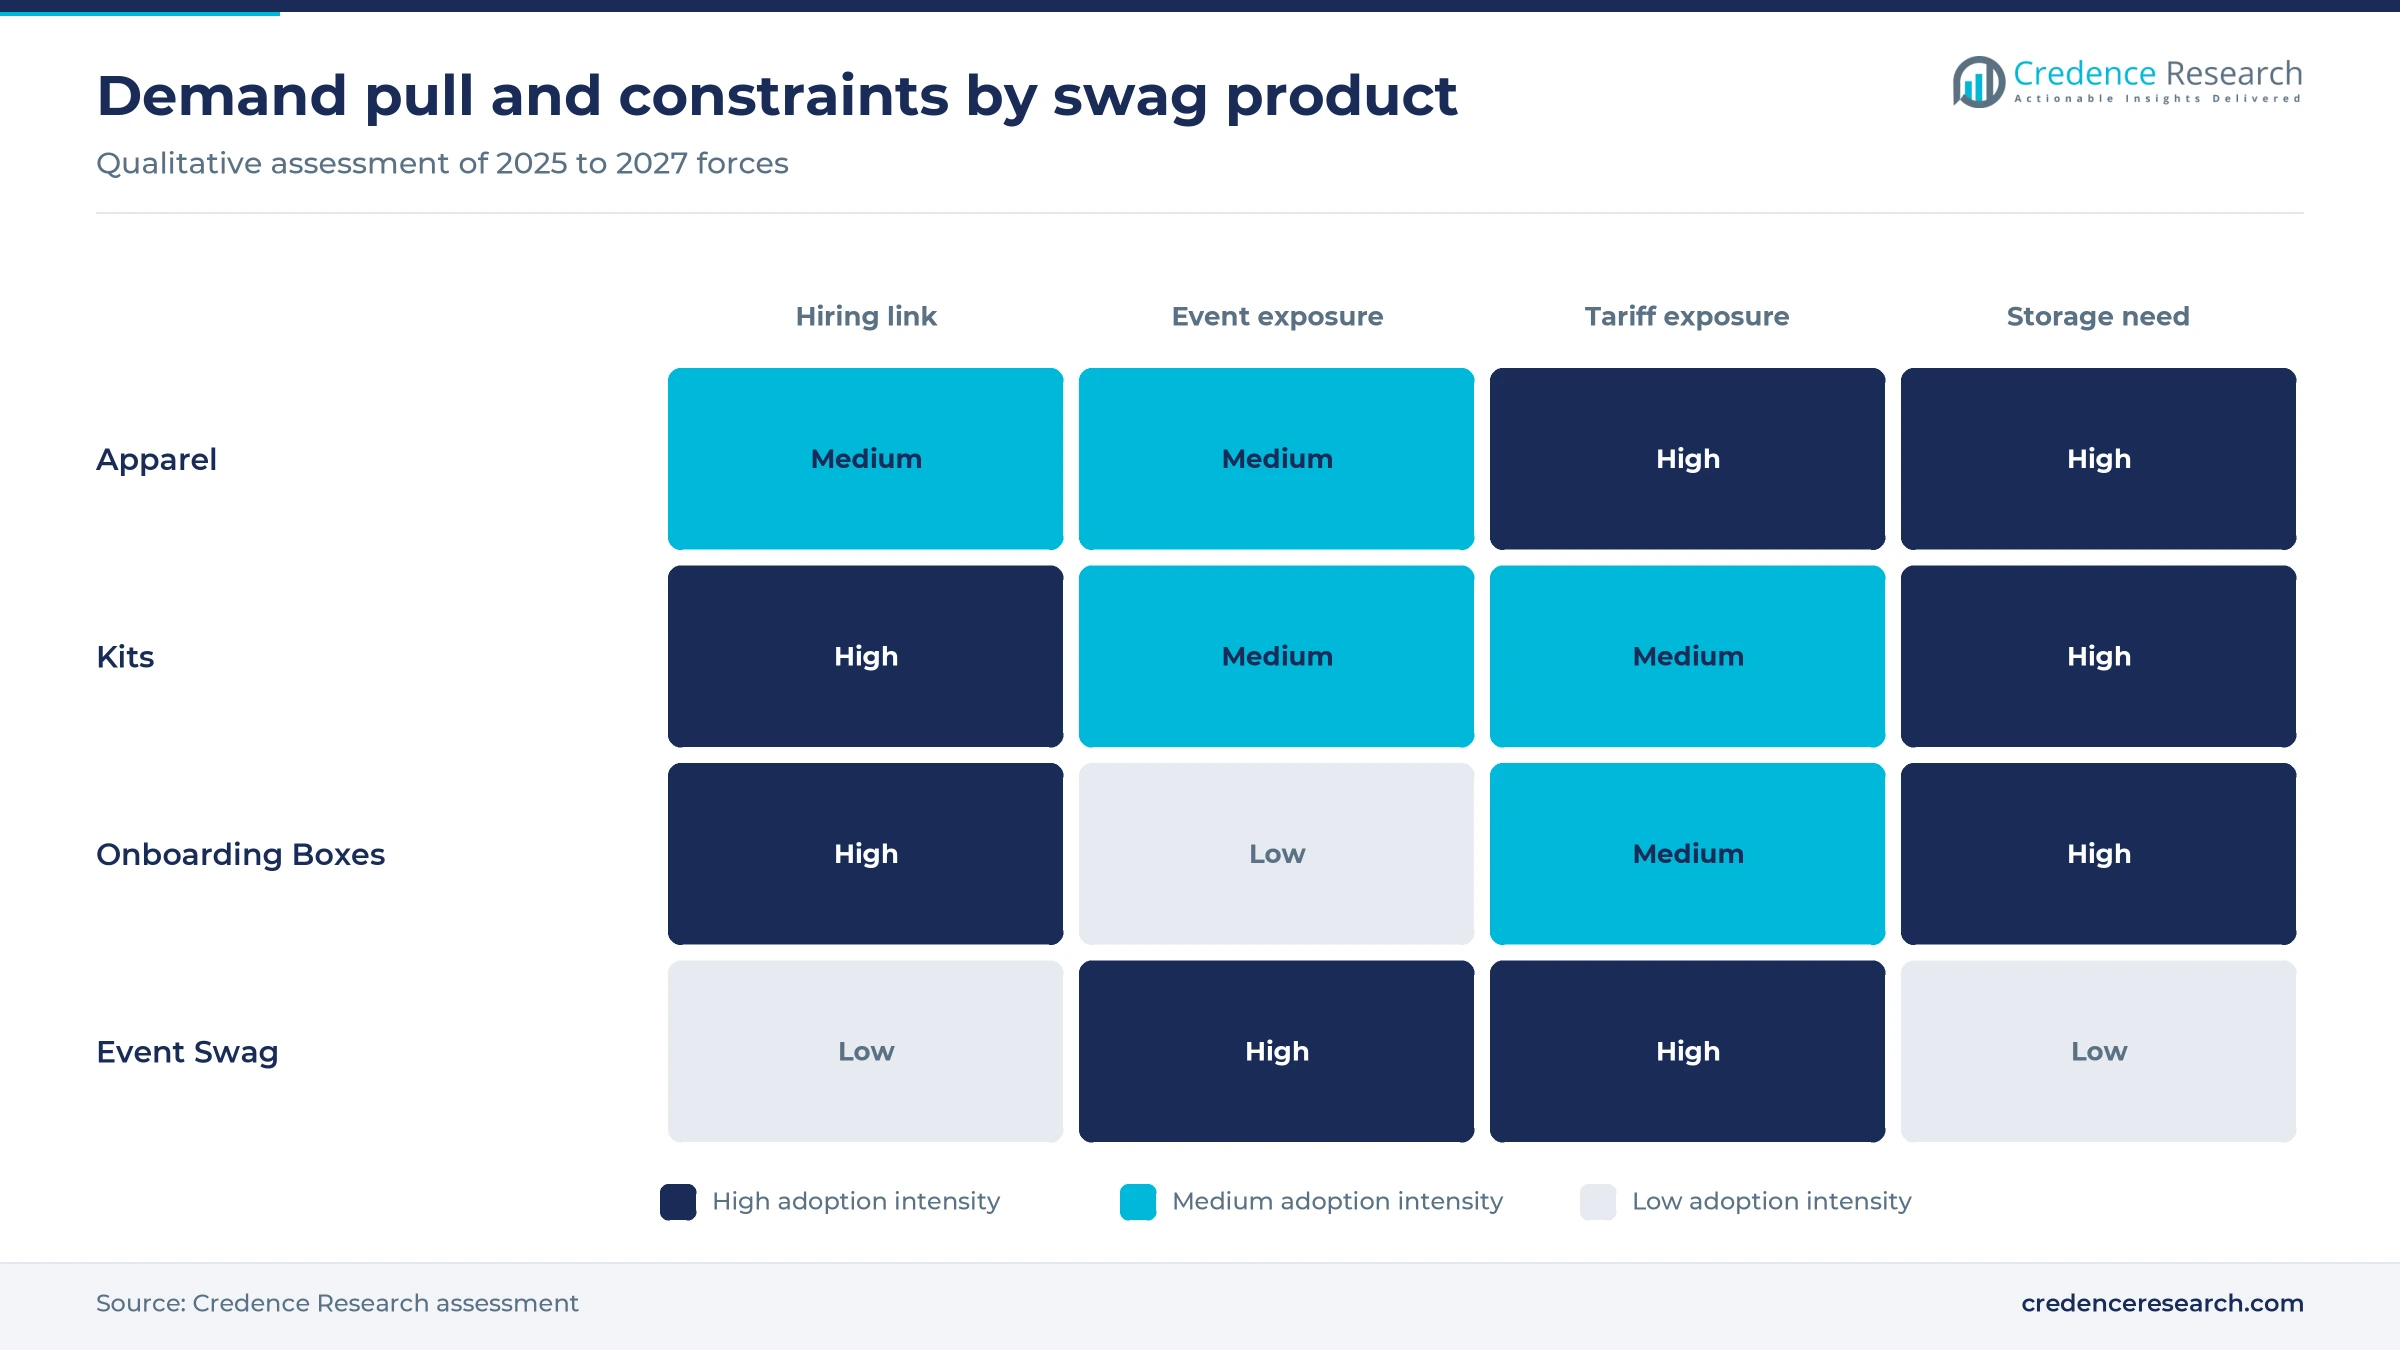
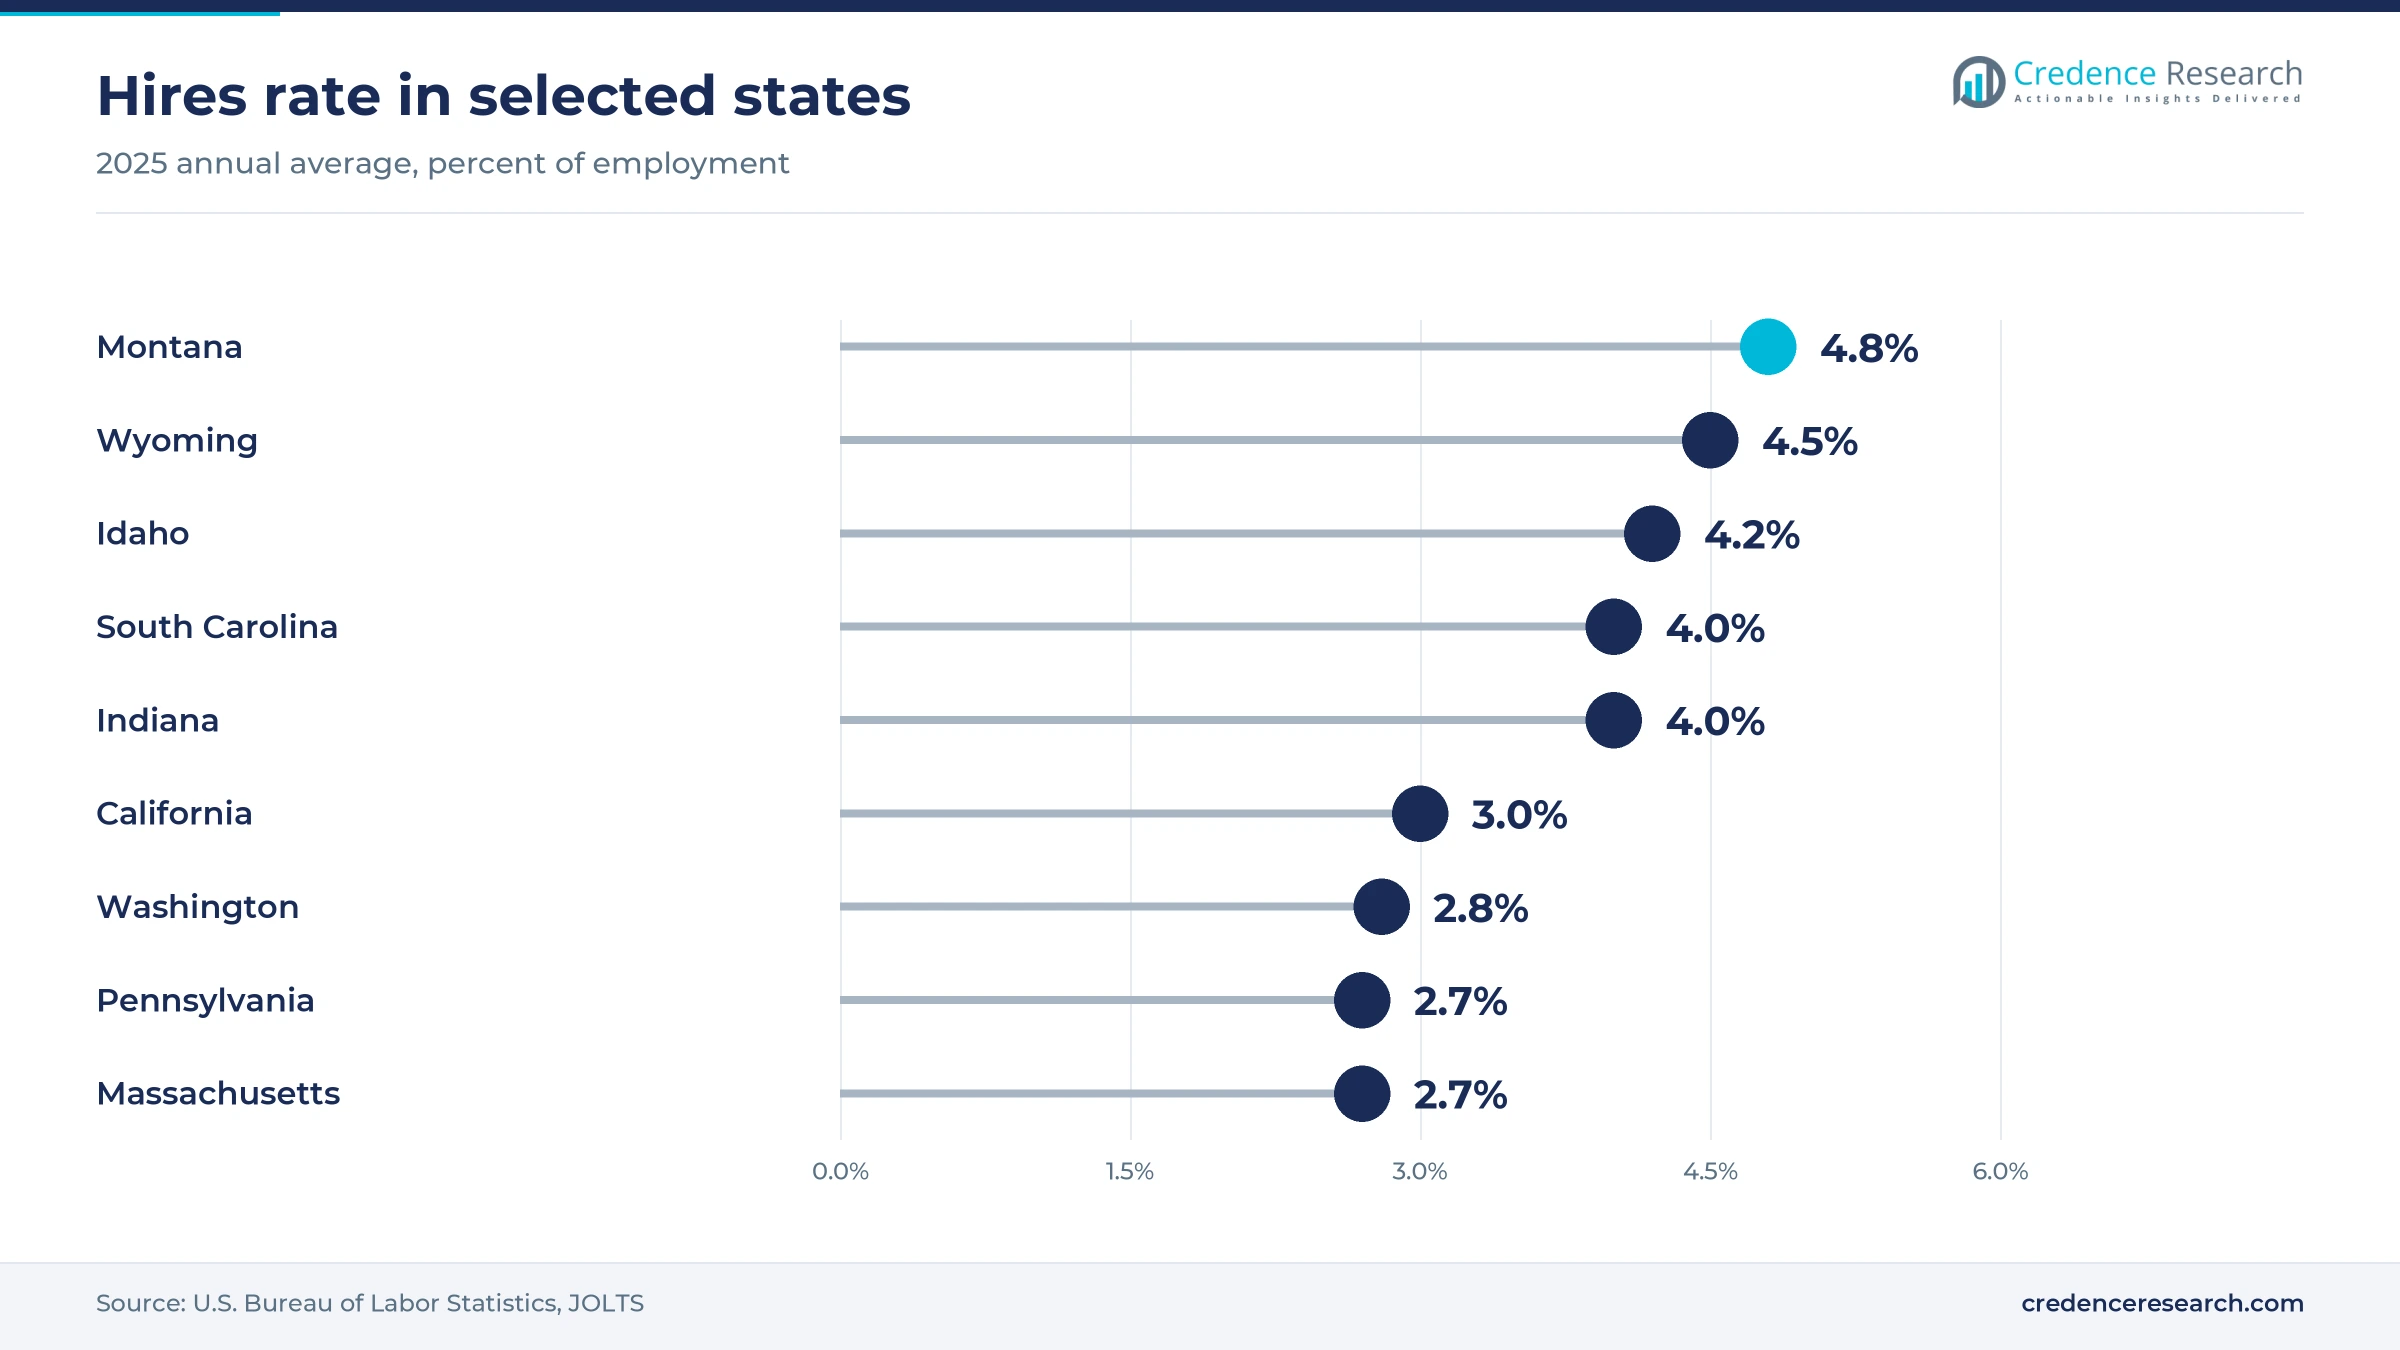
Employers send branded kits to each new hire and to guests at company events, which ties swag spending to hiring and event calendars. The Bureau of Labor Statistics counted 62,972,000 hires across the U.S. in 2025, an annual average hires rate of 3.3%. Hiring is spread unevenly, as Montana posted a 4.8% rate while Massachusetts and Pennsylvania stood at 2.7%. On the event side, IAEE forecast on May 4, 2026, that the CEIR Total Index for B2B exhibitions would grow 2.1% in 2026, which keeps booth giveaways in marketing budgets. As a result, onboarding boxes become the fastest-growing product in the Credence Research estimate. In the Credence Research model this adds about 2.73 percentage points to annual growth to 2035.
Online portals simplify swag buying for distributed teams
Online portals let managers order, approve and ship branded items to staff wherever they work, which matters as teams spread across homes and offices. The American Time Use Survey for 2025 from the Bureau of Labor Statistics found that 35% of employed people did some or all of their work at home on days they worked, rising to 51% among workers with a bachelor's degree. Buyers already shop this way, as the Census Bureau put e-commerce at 17.1% of retail sales in the second quarter of 2026. Sendoso's purchase of Merch.co on May 19, 2026, added print-on-demand production with no minimum order quantities. In the Credence Research model this adds about 1.89 percentage points to annual growth to 2035.
Warehousing and fulfillment contracts lift recurring spend
Warehousing contracts convert one-time swag orders into recurring storage, kitting and shipping fees that renew as long as inventory sits on the shelf. SwagUp charges $5.00 per stored pack and $0.25 to $3.00 per bulk item, reassessed every six months, according to its support pages. Printfection wraps storage into a monthly plan and bills shipping when inventory leaves its facility. 4imprint is moving its Oshkosh, Wisconsin, office into a distribution center expanded in a project of about $10 million due in mid-2026, after a $20 million capacity expansion completed in 2024. Warehousing grows fastest at 7.57% a year as these fees accumulate. In the Credence Research model this adds about 1.26 percentage points to annual growth to 2035.
Acquisitions give swag platforms production scale
Acquisitions are folding stand-alone swag platforms into larger distributors and gifting firms, which gives buyers one vendor for design, production, storage and delivery. Custom Ink, based in Fairfax, Virginia, bought Swag.com on Nov. 8, 2021, and Denver-based Printfection in January 2022, according to company releases. BDA, the No. 4 distributor in the PPAI 100, acquired SwagUp in December 2024. Sendoso followed with Alyce in 2024, Postal in May 2025 and Merch.co in May 2026, according to Print+Promo. As a result, enterprise buyers can consolidate several vendors into one contract, which favors Enterprise HR/Marketing programs that hold 40.0% of 2025 value in the Credence Research estimate.
Sustainable goods and print-on-demand reshape swag orders
Rise of sustainable and retail-brand items in swag orders
Buyers are shifting budgets toward sustainable goods and recognizable retail brands, because recipients keep those items longer and use them in public. PPAI estimated U.S. distributor sales at $27.1 billion in 2025, with sustainable products at $3.8 billion, or 14% of the total, and retail-branded products at about $6 billion. Swag.com built its offer around higher-quality products and served about 5,000 customers, including Amazon, Google and Spotify, when Custom Ink acquired it in November 2021. California also limited PFAS in textiles to 100 parts per million from Jan. 1, 2025, which pushes platforms to certify apparel inputs. Platforms that stock certified, retail-brand apparel can therefore charge more per item.
Shift from bulk minimums to print-on-demand runs
Platforms are shifting production from large bulk runs toward print-on-demand production, which cuts leftover inventory when headcount plans change. Sendoso said its May 19, 2026, purchase of Merch.co makes print-on-demand practical at any quantity, backed by more than 100 production facilities. ASI reported on July 14, 2026, that orders were smaller and more last-minute in the second quarter, with longer decision processes. 4imprint, which handles embroidery and printing in-house in Oshkosh and Appleton, Wisconsin, processed 2,060,000 orders in 2025, with average order value up 1%. In turn, small and frequent orders favor On-Demand ordering, which held 58.0% of 2025 value.
Opening in home-delivered kits for hybrid workers
Hybrid work creates an opening for platforms that can kit and ship branded items to individual home addresses instead of one office. The Bureau of Labor Statistics found that 35% of employed people worked at home on days they worked in 2025, and women were more likely than men to do so, at 38% versus 31%. SwagUp assembles packs at its warehouse and ships them on request, while Printfection offers on-demand distribution and gift kitting. Printfection also lets enterprise customers connect its platform with existing apps such as Marketo, according to Custom Ink. Onboarding Boxes grow at 7.84% a year in the Credence Research estimate, and home delivery serves that demand directly.
Opening in self-serve swag stores for small businesses
Small businesses offer an opening for self-serve platforms, because most lack a marketing department to manage vendors and inventory. The Small Business Administration counted 36.2 million small businesses in June 2025, accounting for nearly 46% of private-sector jobs. SwagUp started with startups and small and medium-sized businesses before adding enterprise clients, and it ranked No. 890 on the 2023 Inc. 5000 list, according to PPAI. However, 4imprint reported that new customer orders fell 12% to 421,000 in 2025, which shows that winning first-time buyers needs easier ordering and lower minimums. SMB buyers grow fastest at 7.78% a year in the Credence Research estimate.
Tariff, budget and PFAS pressures squeeze swag platforms
How do tariff swings raise swag product costs?
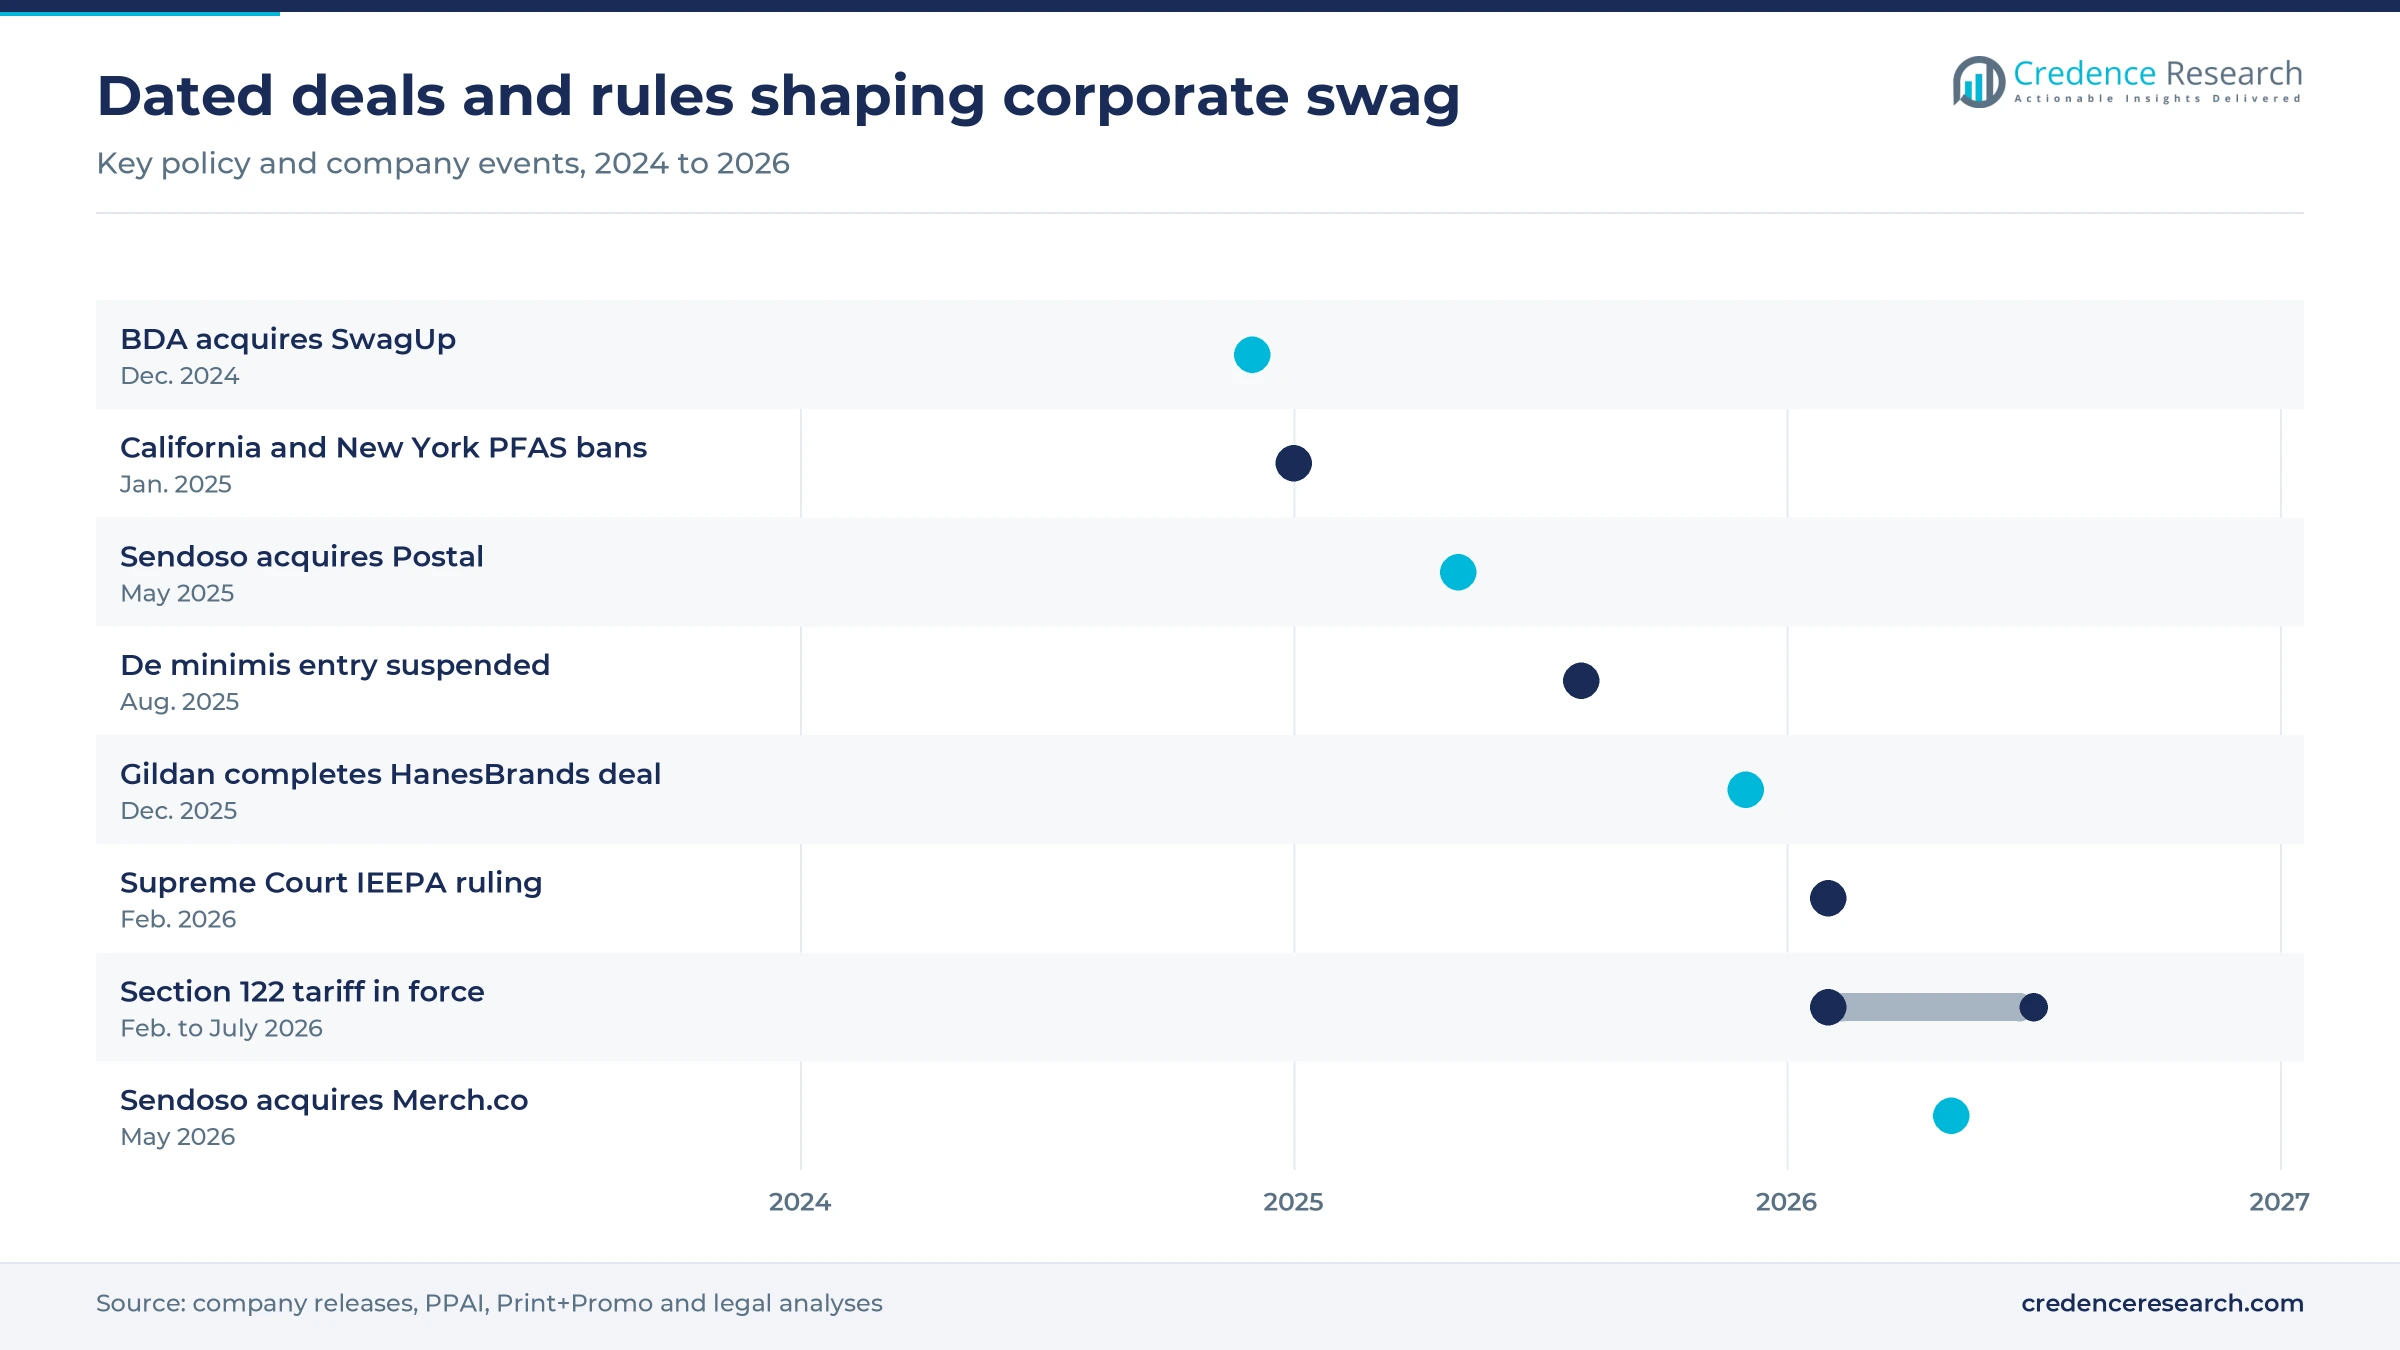
Landed costs for imported apparel, drinkware and tech accessories now move with each change in U.S. trade policy, a risk for every kit. The U.S. suspended duty-free de minimis entry for shipments of $800 or less on Aug. 29, 2025, and the Supreme Court struck down IEEPA tariffs on Feb. 20, 2026. A 10% Section 122 tariff then ran from Feb. 24, 2026, until it expired on July 24, 2026. 4imprint said further supplier tariff increases arrived in early 2026, so platforms must reprice quotes and hold buffer stock.
Will tight budgets slow corporate swag orders?
Discretionary HR and marketing lines are often cut first when buyers face uncertain demand, and branded goods sit in that group. PPAI reported that 2025 distributor sales rose just 1.3%, below inflation, and ASI found that only 38% of distributors grew sales in the second quarter of 2026. Small and medium distributors were roughly flat while large firms grew close to 4%. Platforms therefore compete harder on price and bundle storage to keep clients committed.
How do PFAS rules complicate apparel sourcing?
Chemical rules for textiles add testing and documentation to every apparel order a platform accepts. California banned regulated PFAS in textile articles above 100 parts per million from Jan. 1, 2025, tightening to 50 ppm on Jan. 1, 2027, and requires certificates of compliance from manufacturers. New York banned intentionally added PFAS in new apparel on the same date. Platforms selling nationwide must therefore vet blanks and decorators against the strictest state rules.
Do rising freight and inflation costs squeeze margins?
Each kit sent to a home address carries its own postage, which magnifies every rise in freight rates for platforms. ASI reported on July 14, 2026, that inflation peaked at 4.2% in May and container rates hit a three-year high, while energy and gasoline prices rose with the Iran conflict. As a result, platforms add per-pack fees or push buyers toward consolidated warehouse releases, which limits the appeal of one-off home shipments.
The Northeast holds the largest share of swag spending
| Region | Value, 2025 (USD billion) | Share, 2025 | CAGR, 2026–2035 |
|---|---|---|---|
| Northeast | 0.41 | 27.0% | 6.68% |
| Southeast | 0.30 | 20.0% | 7.28% |
| Pacific | 0.30 | 20.0% | 6.58% |
| South Central | 0.26 | 17.0% | 7.68% |
| Midwest | 0.18 | 12.0% | 6.78% |
| Mountain | 0.06 | 4.0% | 7.48% |
The Northeast leads on enterprise headquarters
The Northeast held 27.0% of 2025 value and grows at 6.68% a year, the largest share among the six zones. Financial, media and software headquarters drive enterprise programs, and SwagUp, based in Piscataway, New Jersey, serves clients such as Nasdaq. Hiring is slower than elsewhere, as the Bureau of Labor Statistics put 2025 hires rates at 2.7% in Massachusetts and Pennsylvania. The Census Bureau counted 58.0 million Northeast residents in 2025, up just 0.7% since 2020, which limits growth in new hire kits.
The Southeast gains from hiring and population growth
The Southeast held 20.0% of 2025 value and grows at 7.28% a year, faster than the national rate. Custom Ink, which owns Swag.com and Printfection, is headquartered in Fairfax, Virginia, giving the zone a large platform operator. Hiring is brisk, as South Carolina posted a 4.0% hires rate in 2025, among the six highest in the country. The Census Bureau's South region, which includes the Southeast states, grew 6.0% from 2020 to 133.8 million residents in 2025, adding employers and new hires.
The Pacific relies on software and internet employers
The Pacific held 20.0% of 2025 value and grows at 6.58% a year, below the national rate. Software and internet employers anchor demand, and San Francisco-based Sendoso bought Merch.co in May 2026 to add production capacity. BDA, the acquirer of SwagUp, is headquartered in Woodinville, Washington. Growth is held back by slower hiring, with hires rates of 3.0% in California and 2.8% in Washington in 2025, according to the Bureau of Labor Statistics. California's PFAS limits for textiles also raise apparel compliance work.
South Central grows fastest on Texas population gains
The South Central held 17.0% of 2025 value and grows at 7.68% a year, the fastest pace among the zones. Texas leads the zone, adding about 391,000 residents in 2025 to reach 31.7 million, the largest gain of any state, according to Census data reported by Spectrum News. New residents who join the workforce add to the hire counts that drive welcome kits. Because offices in the zone are spread across large metro areas, on-demand portals that ship to each address suit local buyers.
The Midwest hosts large-scale decoration capacity
The Midwest held 12.0% of 2025 value and grows at 6.78% a year. 4imprint runs production and distribution in Oshkosh and Appleton, Wisconsin, with in-house embroidery and printing for a significant share of apparel orders. Its expanded Oshkosh distribution center, a project of about $10 million, was due for completion in mid-2026. Indiana had one of the six highest hires rates in 2025, according to the Bureau of Labor Statistics, while the Census Bureau counted 69.8 million Midwest residents, up 1.1% since 2020.
The Mountain grows from a small base on fast hiring
The Mountain held 4.0% of 2025 value and grows at 7.48% a year, faster than the national rate from a small base. Printfection, founded in 2004 by University of Denver students, runs its enterprise swag management platform from Denver, Colorado. Hiring is among the strongest in the country, as Montana posted a 4.8% hires rate in 2025, Wyoming 4.5% and Idaho 4.2%, according to the Bureau of Labor Statistics. Those hires feed onboarding box orders for growing employers across the zone.
Acquisitions and tariff rulings from 2024 to 2026
| Development | Status and market relevance |
|---|---|
| In December 2024, BDA acquired SwagUp, a Piscataway, New Jersey, swag platform serving startups and enterprises. | Completed; adds a SaaS swag platform to a top distributor |
| In May 2025, Sendoso acquired Postal, a gifting solutions company. | Completed; widens corporate gifting reach |
| In December 2025, Gildan completed its acquisition of HanesBrands, doubling its scale in blank apparel. | Completed; consolidates apparel supply |
| In February 2026, the Supreme Court struck down IEEPA tariffs, and a 10% Section 122 tariff took effect. | Expired July 24, 2026, after 150 days; reset import costs |
| In May 2026, Sendoso acquired Merch.co, a swag production and supply chain platform with 100+ facilities. | Completed; adds print-on-demand production |
Kit builders, storage dashboards and app links run swag
- Pack builders let buyers assemble custom swag packs that SwagUp kits at its warehouse and stores at $5.00 per pack every six months.
- Inventory dashboards from Printfection give enterprise buyers real-time inventory management with storage folded into a monthly plan.
- App integrations connect swag platforms with marketing tools such as Marketo, as Printfection offers to its enterprise customers.
- Print-on-demand networks such as Merch.co route orders across more than 100 production facilities with no minimum order quantities.
Need a Custom Version of This Report?
Tailor the scope, geography, or segments to your exact requirements.
- Custom geography or segment scope
- Direct access to our analyst team
Distributor-owned platforms and gifting firms compete
Competition in U.S. corporate swag platforms pits distributor-owned platforms against gifting software firms and large online promotional products sellers. Custom Ink runs Swag.com for curated, higher-quality products and Printfection for enterprise inventory programs. SwagUp, now part of BDA, sells a software-led service with pack building, storage and shipping. Sendoso approaches the market from sales and marketing gifting, and its Merch.co deal adds print-on-demand production. 4imprint competes on breadth and speed, with in-house embroidery and printing in Wisconsin and 2,060,000 orders in 2025. Buyers compare platforms on minimum order quantities, storage fees, shipping speed and integration with HR and marketing tools. Platforms also compete with gift cards for the same recognition budgets, so curated product quality matters.
How do the leading swag platforms position their offer?
| Company | Type | Role in the market |
|---|---|---|
| Swag.com | Curated swag platform | Sells higher-quality branded products with storage and distribution as part of Custom Ink |
| SwagUp | SaaS swag platform | Builds and stores swag packs for startups and enterprises as part of BDA |
| Printfection | Enterprise swag management | Runs real-time inventory and on-demand distribution for enterprise programs |
| Sendoso | Gifting and direct mail platform | Added print-on-demand production through the Merch.co acquisition in May 2026 |
| 4imprint | Online promotional products seller | Handled 2,060,000 orders in 2025 with in-house embroidery in Wisconsin |
Storage, speed and sourcing control decide platform growth
Credence Research's view is that storage, speed and control over sourcing will decide which platforms gain share in U.S. corporate swag. Hiring of nearly 63 million people a year keeps onboarding demand steady, but buyers now want smaller, faster orders and fewer leftover boxes. Platforms that pair print-on-demand networks with warehoused kits can serve both needs. Those that connect with HR systems and employee recognition software should win enterprise renewals. Apparel held 38.0% of 2025 value, so tariff and PFAS compliance on garments remains the largest operating risk.
How platform-delivered swag spending was modeled
The report uses 2025 as the base year and 2035 as the forecast year, with market values taken from the Credence Research model. Product, buyer, model and regional splits are Credence Research estimates informed by public data and are not reported statistics. Sources include Bureau of Labor Statistics hiring and time use data, Census Bureau population and e-commerce estimates, Small Business Administration counts, industry association sales estimates, company releases, filings and pricing pages, and legal analyses of tariff and chemical rules.
Hiring and recurring storage carry swag demand to 2035
From USD 1.60 billion in 2026, the market is expected to reach USD 2.94 billion by 2035 as hiring, events and sales outreach keep branded shipments flowing. Onboarding boxes should gain share as more employers send welcome kits to remote and hybrid hires. Warehoused programs will grow faster than one-off orders because storage and fulfillment fees recur each year. Tariff and chemical rules will keep pressure on apparel costs, while the South Central region leads regional growth on population gains in Texas.
Frequently Asked Questions
How big is the U.S. corporate swag platform market?
Which product holds the largest share?
Why do employers use swag platforms instead of local vendors?
Which region leads and which grows fastest?
How do warehousing programs work?
How do tariffs affect corporate swag platforms?
Which buyers grow fastest?
Who are the leading companies?
Table of Content
Chapter 1 Market Segmentation
- 1.1 Segmentation Framework
- 1.1.1 Product and Service Classification
- 1.1.2 Application and End-Use Classification
- 1.1.3 Technology and Solution Classification
- 1.1.4 Customer and Distribution Channel Classification
- 1.1.5 Geographic Segmentation
- 1.1.6 Market Segment Definitions and Boundaries
- 1.2 By Product
- 1.2.1 Apparel
- 1.2.2 Kits
- 1.2.3 Onboarding Boxes
- 1.2.4 Event Swag
- 1.3 By Buyer
- 1.3.1 Enterprise HR/Marketing
- 1.3.2 Tech
- 1.3.3 SMB
- 1.4 By Model
- 1.4.1 On-Demand
- 1.4.2 Warehousing
Chapter 2 Introduction
- 2.1 Report Objectives and Scope
- 2.2 Product Definition and Industry Terminology
- 2.3 Market Inclusions and Exclusions
- 2.4 Research Process
- 2.4.1 Primary Research and Expert Interviews
- 2.4.2 Secondary Research and Source Review
- 2.4.3 Top-Down and Bottom-Up Estimation
- 2.4.4 Data Triangulation and Verification
- 2.5 Market Size Measurement Basis
- 2.5.1 2025: USD 1.50 billion → 2035: USD 2.94 billion
- 2.6 Historical and Forecast Reference Periods
- 2.6.1 Historical Period: 2018-2025
- 2.6.2 Base Year: 2025
- 2.6.3 Forecast Period: 2025-2035
- 2.7 Research Assumptions and Limitations
Chapter 3 Executive Summary
- 3.1 Market Snapshot and Key Findings
- 3.2 Base-Year Market Size, 2025
- 3.3 Forecast Market Size, 2035
- 3.4 Revenue and Volume Growth Outlook
- 3.5 Key Demand and Supply Indicators
- 3.6 Leading Market Segments
- 3.7 Fastest-Growing Market Opportunities
- 3.8 Regional Performance Highlights
- 3.9 Technology and Industry Transformation
- 3.10 Competitive Landscape Summary
- 3.11 Analyst View and Strategic Implications
Chapter 4 U.S. Corporate Swag Platform Market Trends and Developments
- 4.1 Historical Industry Development, 2018-2025
- 4.2 Recent Market Trends and Developments
- 4.3 Demand and Customer Behavior Trends
- 4.4 Technology and Product Innovation
- 4.5 Artificial Intelligence, Automation and Digitalization
- 4.6 Local Manufacturing and Supply Chain Realignment
- 4.7 Industry Partnerships, Mergers and Acquisitions
- 4.8 Sustainability and Circular Economy Developments
- 4.9 Government and Private Sector Investment Trends
- 4.10 Emerging Business Models and Commercialization
- 4.11 Industry Developments and Announcements
Chapter 5 U.S. Corporate Swag Platform Market Production, Supply and Demand Analysis
- 5.1 Demand Trend and Consumption Analysis, 2018-2025
- 5.2 Demand Forecast, 2025-2035
- 5.3 Production and Output Trend, 2018-2025
- 5.4 Production and Output Forecast, 2025-2035
- 5.5 Installed Capacity and Capacity Utilization
- 5.6 Company-Wise Production Plants and Statistics
- 5.6.1 Installed Production Capacity
- 5.6.2 Actual Production
- 5.6.3 Planned Capacity and Expansion Targets
- 5.7 Supply Chain Structure and Procurement Trends
- 5.8 Supply-Demand Gap and Bottlenecks
- 5.9 Import Dependence and Sourcing Structure
- 5.10 Contract Manufacturing and Outsourcing
- 5.11 Regional Supply and Demand Concentration
Chapter 6 U.S. Corporate Swag Platform Market Pricing Analysis
- 6.1 Pricing Structure and Measurement
- 6.2 Historical Pricing Trends, 2018-2025
- 6.3 Pricing Outlook, 2025-2035
- 6.4 Average Selling Price and Unit Economics
- 6.5 Pricing by Product and Market Segment
- 6.6 Geographic Pricing Differences
- 6.7 Key Input, Energy, Labor and Logistics Costs
- 6.8 Contract Pricing and Purchasing Models
- 6.9 Pricing Sensitivity and Competitive Positioning
- 6.10 Price, Margin and Profitability Implications
Chapter 7 U.S. Corporate Swag Platform Market Dynamics
- 7.1 Market Growth Drivers
- 7.1.1 Demand-Side Drivers
- 7.1.2 Technology and Innovation Drivers
- 7.1.3 Infrastructure and Investment Drivers
- 7.1.4 Regulatory and Policy Drivers
- 7.2 Market Restraints
- 7.2.1 Cost and Affordability Constraints
- 7.2.2 Technology and Adoption Barriers
- 7.2.3 Supply Chain and Operational Constraints
- 7.3 Market Challenges
- 7.3.1 Competitive Pressure and Margin Erosion
- 7.3.2 Skills, Infrastructure and Implementation Gaps
- 7.4 Emerging Market Opportunities
- 7.5 Market Dynamics Impact and Time-Horizon Assessment
Chapter 8 U.S. Corporate Swag Platform Value Chain Analysis
- 8.1 Industry Value Chain Overview
- 8.2 Upstream Suppliers and Critical Inputs
- 8.3 Technology and Component Providers
- 8.4 Manufacturing or Service Delivery
- 8.5 Distribution, Channel Partners and Integrators
- 8.6 Downstream Applications and End Users
- 8.7 Value Addition and Profit Pools
- 8.8 Vertical Integration and Outsourcing
- 8.9 Supplier Concentration and Risk
- 8.10 Supply Chain Localization and Resilience
Chapter 9 U.S. Corporate Swag Platform Market Regulations and Policies
- 9.1 Relevant Laws, Standards and Compliance Frameworks
- 9.2 Product, Service, Safety and Quality Requirements
- 9.3 Government Policies, Incentives and Subsidies
- 9.4 Imports, Exports and Trade Barriers
- 9.5 Public Procurement and Local Content Requirements
- 9.6 Environmental and Sustainability Compliance
- 9.7 Upcoming Policy Changes and Market Implications
Chapter 10 U.S. Corporate Swag Platform Market Hotspots and Opportunities
- 10.1 Market Opportunity Mapping and Growth Hotspots
- 10.2 High-Growth Applications and Customer Groups
- 10.3 Underserved Markets and White-Space Opportunities
- 10.4 Emerging Technology and Product Opportunities
- 10.5 New Capacity and Investment Hotspots
- 10.6 Market Entry and Expansion Opportunities
- 10.7 Distribution and Partnership Opportunities
- 10.8 Near-Term and Long-Term Commercial Potential
- 10.9 Opportunity Attractiveness and Execution Risks
Chapter 11 U.S. Corporate Swag Platform Market Outlook, 2025-2035
- 11.1 Market Size and Analysis
- 11.1.1 Revenue (Market Measurement: 2025: USD 1.50 billion → 2035: USD 2.94 billion)
- 11.1.2 Market Volume and Quantity Sold
- 11.1.3 Historical Market Size, 2018-2025
- 11.1.4 Base-Year Market Size, 2025
- 11.2 Market Forecast, 2025-2035
- 11.2.1 Revenue Forecast to 2035
- 11.2.2 Volume Forecast to 2035
- 11.2.3 CAGR and Year-on-Year Growth
- 11.2.4 Incremental Revenue Opportunity
- 11.3 Forecast Assumptions and Scenario Analysis
- 11.3.1 Base-Case Forecast
- 11.3.2 Optimistic and Conservative Scenarios
- 11.3.3 Technology, Pricing and Policy Sensitivities
- 11.4 Market Attractiveness and Growth Outlook
Chapter 12 U.S. Corporate Swag Platform Market Segmentation and Outlook
- 12.1 Segmentation Summary and Market Shares, 2025
- 12.2 Largest and Fastest-Growing Segments
- 12.3 By Product - Market Size and Forecast, 2025-2035
- 12.3.1 Segment Definition and Scope
- 12.3.2 Historical Market Size, 2018-2025
- 12.3.3 Revenue Forecast, 2025-2035
- 12.3.4 Volume Forecast, 2025-2035
- 12.3.5 Base-Year Market Share, 2025
- 12.3.6 Segment CAGR and Growth Drivers
- 12.3.7 Subsegment Market Size and Forecast
- 12.3.7.1 Apparel
- 12.3.7.2 Kits
- 12.3.7.3 Onboarding Boxes
- 12.3.7.4 Event Swag
- 12.3.8 Subsegment Pricing and Adoption Trends
- 12.3.9 Leading Suppliers and Competition
- 12.3.10 Regional Demand and Opportunities
- 12.4 By Buyer - Market Size and Forecast, 2025-2035
- 12.4.1 Segment Definition and Scope
- 12.4.2 Historical Market Size, 2018-2025
- 12.4.3 Revenue Forecast, 2025-2035
- 12.4.4 Volume Forecast, 2025-2035
- 12.4.5 Base-Year Market Share, 2025
- 12.4.6 Segment CAGR and Growth Drivers
- 12.4.7 Subsegment Market Size and Forecast
- 12.4.7.1 Enterprise HR/Marketing
- 12.4.7.2 Tech
- 12.4.7.3 SMB
- 12.4.8 Subsegment Pricing and Adoption Trends
- 12.4.9 Leading Suppliers and Competition
- 12.4.10 Regional Demand and Opportunities
- 12.5 By Model - Market Size and Forecast, 2025-2035
- 12.5.1 Segment Definition and Scope
- 12.5.2 Historical Market Size, 2018-2025
- 12.5.3 Revenue Forecast, 2025-2035
- 12.5.4 Volume Forecast, 2025-2035
- 12.5.5 Base-Year Market Share, 2025
- 12.5.6 Segment CAGR and Growth Drivers
- 12.5.7 Subsegment Market Size and Forecast
- 12.5.7.1 On-Demand
- 12.5.7.2 Warehousing
- 12.5.8 Subsegment Pricing and Adoption Trends
- 12.5.9 Leading Suppliers and Competition
- 12.5.10 Regional Demand and Opportunities
- 12.6 Segment Growth Comparison
- 12.7 Segment Attractiveness and Priority Matrix
Chapter 13 U.S. Corporate Swag Platform Geographic Market Outlook, 2025-2035
- 13.1 Domestic Market Distribution and Demand Clusters
- 13.2 State- or Province-Wise Market Size and Forecast, 2025-2035
- 13.3 City and Metropolitan Market Outlook
- 13.4 Industrial, Manufacturing and Commercial Clusters
- 13.5 Geographic Concentration of Key End Users
- 13.6 Local Pricing and Purchasing Differences
- 13.7 Domestic Production Facilities and Capacity Map
- 13.8 Local Infrastructure and Project Pipeline
- 13.9 State-Level Policy and Incentive Differences
- 13.10 Subnational Investment Hotspots and Opportunities
- 13.11 Distribution and Logistics Networks
- 13.12 Domestic Competitive Footprint
Chapter 14 U.S. Corporate Swag Platform Technology, Innovation and Sustainability Outlook
- 14.1 Technology Landscape and Maturity
- 14.2 Product, Process and Service Innovation
- 14.3 AI, Automation and Digital Tools in the Industry
- 14.4 Technology Adoption and Performance Benchmarking
- 14.5 Innovation Pipeline and R&D Investment
- 14.6 Patent and Intellectual Property Trends
- 14.7 Energy Efficiency and Resource Management
- 14.8 Sustainability, Recycling and Circularity
- 14.9 Technology Roadmap, 2025-2035
- 14.10 Risks of Obsolescence and Technology Substitution
Chapter 15 U.S. Corporate Swag Platform Market Key Strategic Imperatives
- 15.1 Growth and Market Entry Priorities
- 15.2 High-Return Products and Segments
- 15.3 Pricing, Profitability and Cost Optimization
- 15.4 Technology Investment and Product Differentiation
- 15.5 Supply Chain Localization and Resilience
- 15.6 Distribution and Customer Acquisition
- 15.7 Partnership, Acquisition and Capacity Strategy
- 15.8 Regional Expansion Priorities
- 15.9 Short-, Medium- and Long-Term Actions
Chapter 16 Competition Outlook
- 16.1 Industry Competition Characteristics
- 16.2 Market Structure and Concentration
- 16.3 Market Share and Competitive Positioning, 2025
- 16.4 Company-Wise Revenue and Product Benchmarking
- 16.5 Production and Service Capacity Benchmarking
- 16.6 Technology, Pricing and Differentiation
- 16.7 Regional Footprint and Distribution Strength
- 16.8 Mergers, Acquisitions and Strategic Alliances
- 16.9 New Entrants and Competitive Threats
- 16.10 Porter's Five Forces and Industry Attractiveness
- 16.11 Competitive Outlook, 2025-2035
Chapter 17 Company Profiles
- 17.1 Company Coverage and Selection Criteria
- 17.2 Swag.com
- 17.2.1 Business Description
- 17.2.2 Company Ownership and Geographic Presence
- 17.2.3 Product and Service Portfolio
- 17.2.4 Manufacturing and Operating Footprint
- 17.2.5 Production Capacity and Expansion Plans
- 17.2.6 Financial Performance and Investment
- 17.2.7 Market Share and Competitive Position
- 17.2.8 Technology and Innovation Capabilities
- 17.2.9 Strategic Alliances or Partnerships
- 17.2.10 Recent Developments
- 17.2.11 Growth Strategy and Outlook
- 17.3 SwagUp
- 17.4 Printfection
- 17.5 Sendoso
- 17.6 4imprint
- 17.7 Other Relevant Market Participants
Note: Every listed company is profiled on the structure shown under the first company. The company list is preliminary and may change based on research findings, market developments, data availability and client requirements.
Chapter 18 Disclaimer
- 18.1 Research and Forecast Disclaimer
- 18.2 Data Source and Estimation Limitations
Note: The depth of individual sections depends on data availability for this market. Volume, capacity, trade and other unit-based metrics are included where applicable.