Plant-based skin care anchors Japan clean beauty spending
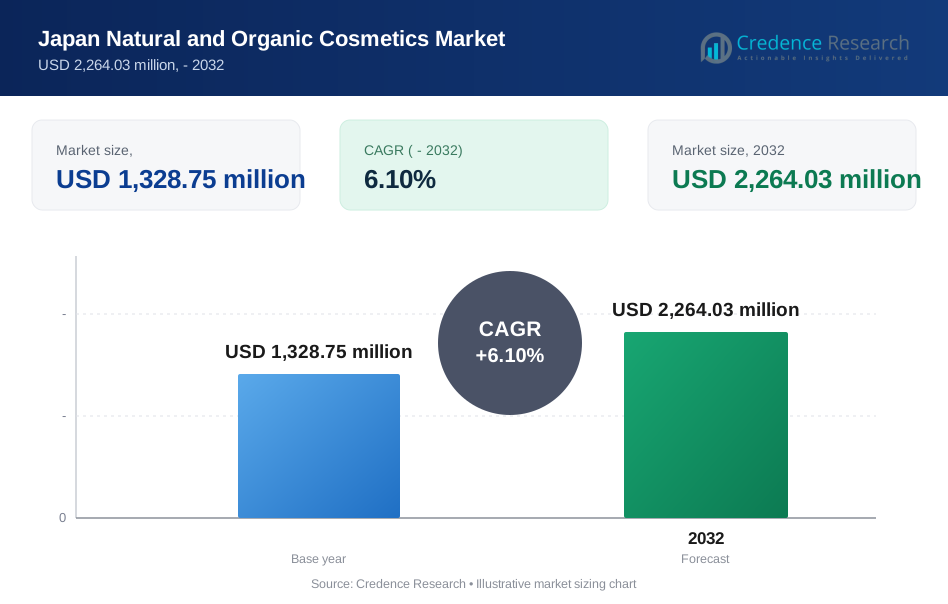
The Japan natural and organic cosmetics market was valued at USD 1.50 billion in 2025 and is projected to increase from USD 1.59 billion in 2026 to USD 2.70 billion by 2035, registering a CAGR of 6.10% during 2026–2035. Demand comes from Japanese shoppers who choose plant-based skin care, hair care and make-up sold through drugstores, department stores, select shops and online stores, plus visitors who buy Japanese brands. Kanto held the largest regional share, 38.0% in 2025, because the Tokyo area concentrates flagship stores, department store counters and higher household spending. Kyushu is the fastest-growing region at 6.6% a year, as select shops expand in Fukuoka. However, the market is changing, because Japan has no government certification for organic cosmetics, so brands increasingly publish natural-origin ingredient percentages and seek private seals such as COSMOS to prove their claims.
What does the natural and organic cosmetics estimate cover in Japan?
The estimate measures retail sales value of cosmetics sold in Japan that are made mainly with plant, mineral or other natural-origin ingredients, including products that carry COSMOS, Ecocert or Japanese association seals. It covers skin care, hair care, make-up, oral care and body and fragrance items bought by women, men and both genders through stores and online channels.
The estimate excludes conventional cosmetics without natural positioning, quasi-drug medicines, salon treatments and exports shipped outside Japan. The value chain runs from ingredient growers and contract makers through brand owners such as Shiseido and KOSÉ to select shops, drugstores and online stores.
Japan Natural and Organic Cosmetics Market Insights
- The Japan natural and organic cosmetics market was valued at USD 1.50 billion in 2025 and is projected to reach USD 2.70 billion by 2035, registering a CAGR of 6.10% during 2026–2035.
- Kanto held a 38.0% share of 2025 value, because Tokyo posted the fastest population growth of any prefecture, 0.66%, in the year to Oct. 1, 2024.
- Skin care led with a 46.0% share of 2025 value, because 29.4% of Japan’s 123.22 million residents were aged 65 or older on Oct. 1, 2025.
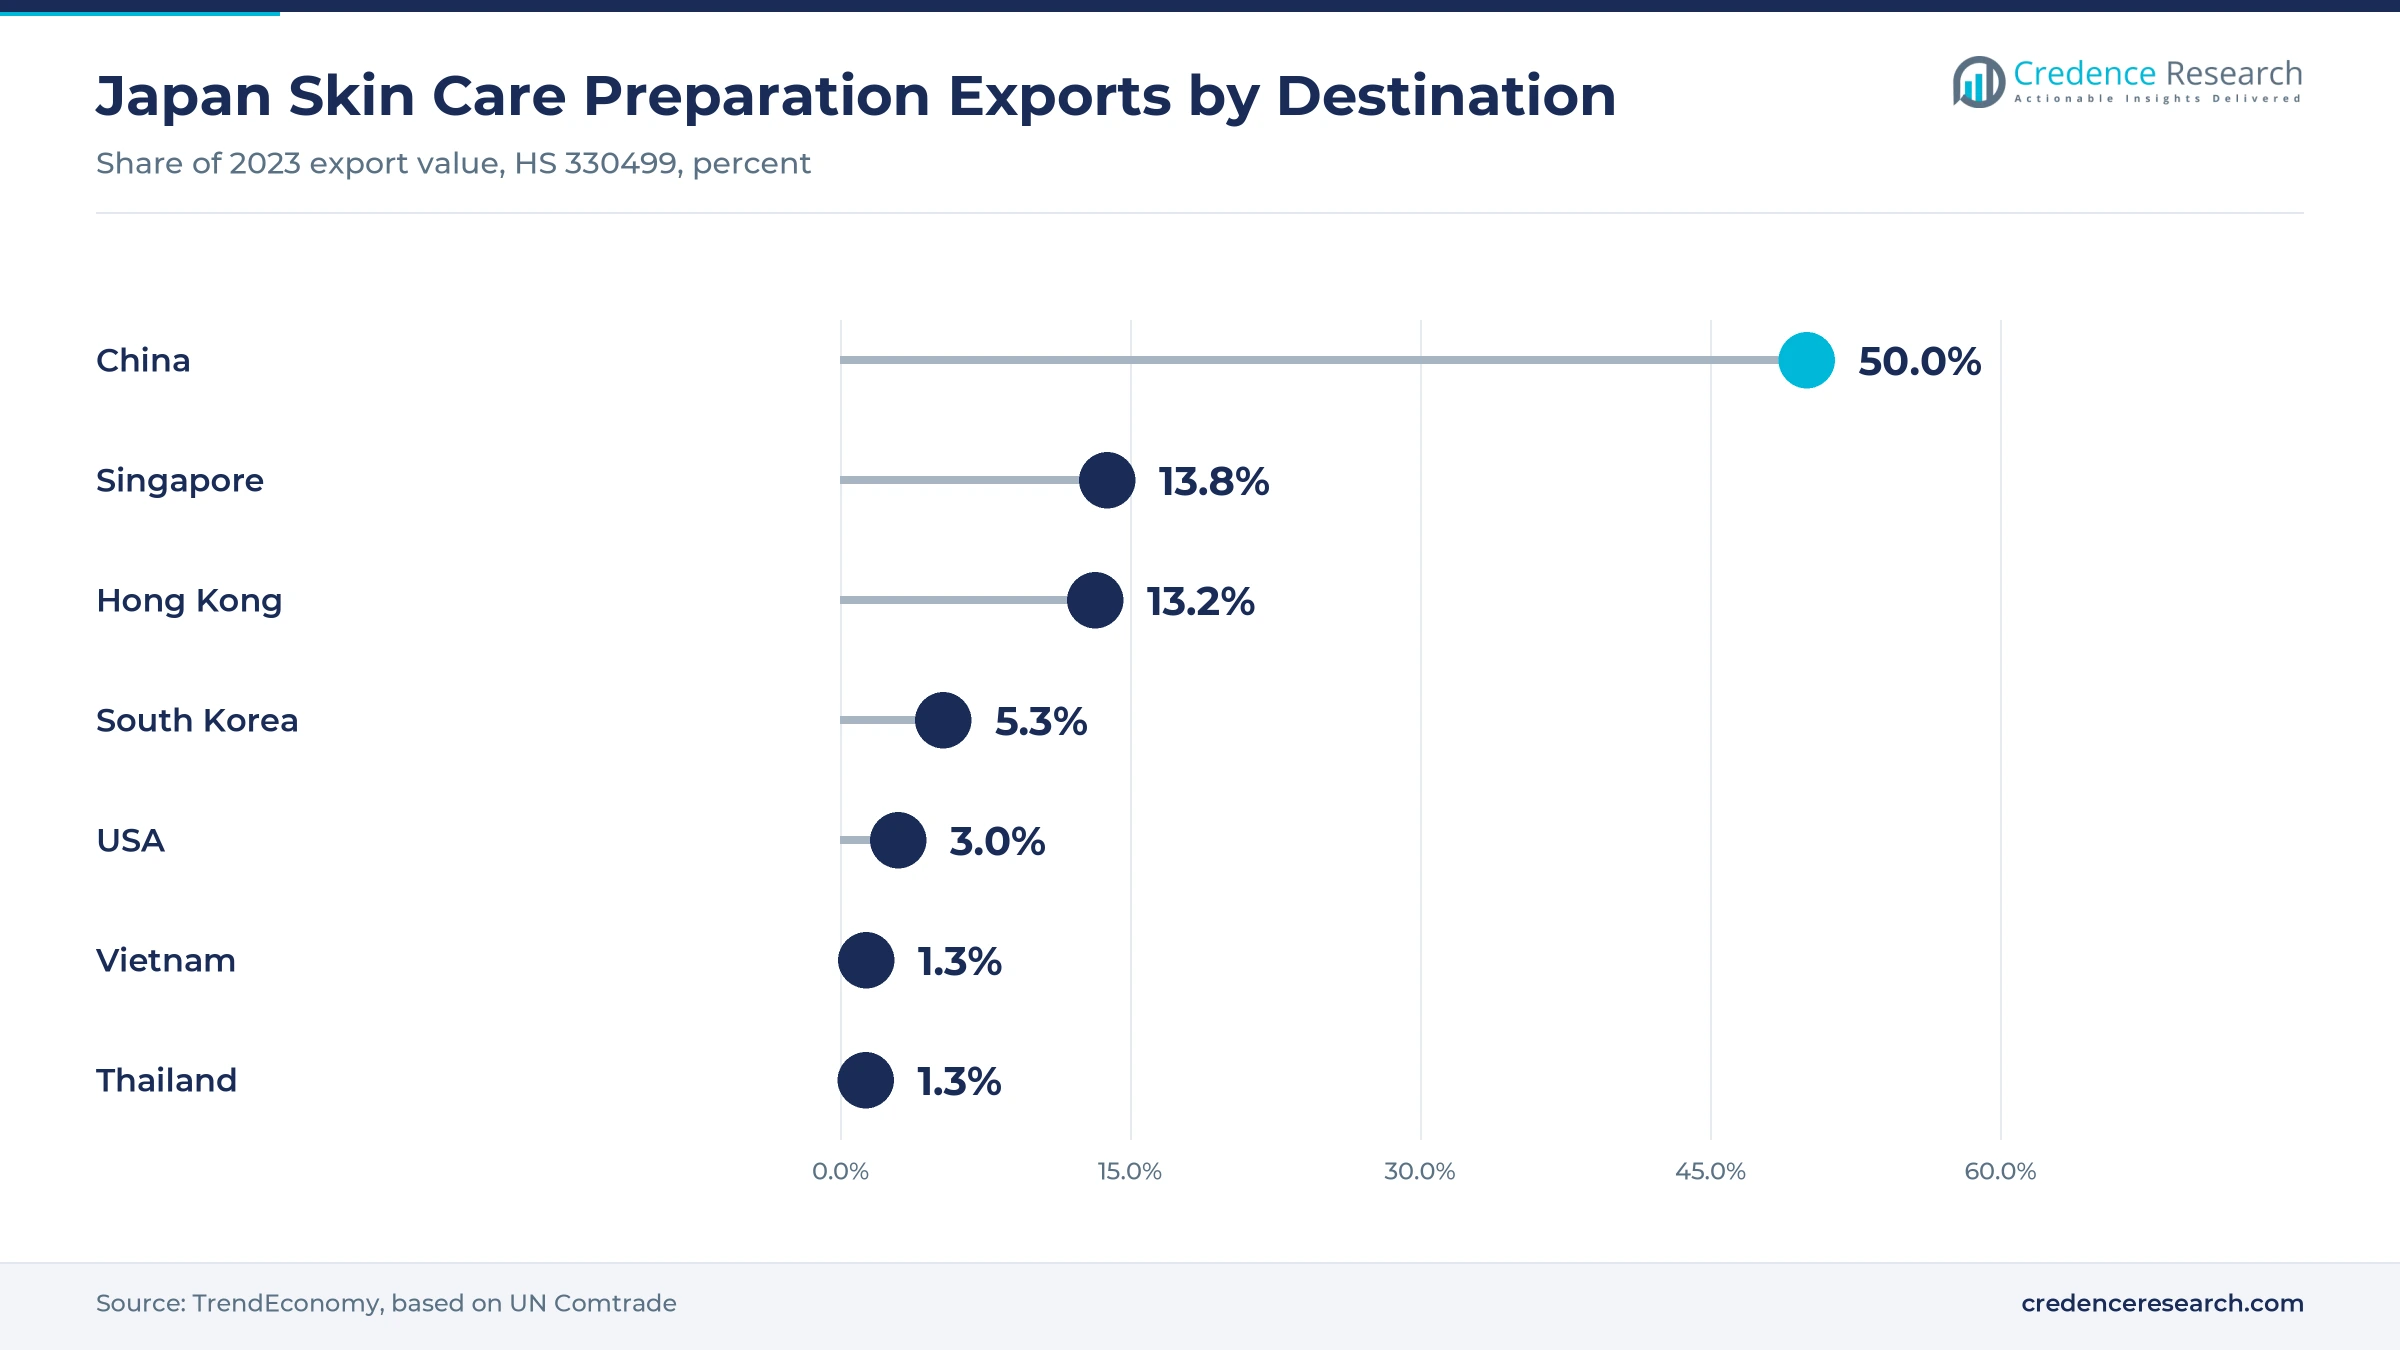
- Kirin Holdings announced on Sept. 12, 2024, that its tender offer for FANCL at 2,800 yen per share had succeeded, lifting its stake to 75.24% on settlement Sept. 19.
- Unisex products grow fastest at 7.0% a year during 2026–2035, as Shiseido’s BAUM, a unisex brand with at least 90% natural-origin ingredients, widens its store reach.
Skin care and stores lead while unisex lines grow fastest
Why does skin care hold the largest share?
Based on product type, the market is categorized into skin care, hair care, make-up cosmetics, oral care and others. Skin Care led with a 46.0% share of 2025 value, because older buyers spend most on lotions, serums and creams, and 29.4% of residents were aged 65 or older on Oct. 1, 2025, according to the Cabinet Office. Make-Up Cosmetics grows fastest at 6.8% a year, as mineral color lines widen. ETVOS released a six-shade mineral multi powder at 2,530 yen on May 1, 2025, according to WWD Japan. Botanical hair care also sells through hair salons and drugstores.
How do women and unisex buyers shape demand?
Based on end user, the market is categorized into female, male and unisex buyers. Female buyers led with a 68.0% share of 2025 value, because women buy most premium skin care and make-up. About nine in 10 women aged 15 to 74 use skin care, according to a POLA Research Institute of Beauty & Culture survey of 1,800 women published Dec. 26, 2025. Unisex products grow fastest at 7.0% a year, as Shiseido positions BAUM as a unisex brand with at least 90% natural-origin ingredients. Male demand also grows alongside men’s grooming products, as the Men’s Beauty Festival ran at Omotesando Hills on Oct. 4–5, 2025.
Why do stores still sell most natural cosmetics?
Based on distribution channel, the market is categorized into offline and online sales. Offline sales led with a 72.0% share of 2025 value, because shoppers test textures and scents in stores. Japan had 23,723 drugstores in fiscal 2024, and beauty care sales there reached 1.83 trillion yen, according to the Japan Chain Drug Store Association. Online sales grow fastest at 7.1% a year, as business-to-consumer e-commerce reached 26.1 trillion yen in 2024, up 5.1%, according to the Ministry of Economy, Trade and Industry. Select shops such as Cosme Kitchen also run online preorders before seasonal sales.
| Segment Group | Leading Sub-segment | Share, 2025 | Fastest-growing Sub-segment | CAGR, 2026–2035 |
|---|---|---|---|---|
| By Product Type | Skin Care | 46.0% | Make-Up Cosmetics | 6.8% |
| By End User | Female | 68.0% | Unisex | 7.0% |
| By Distribution Channel | Offline | 72.0% | Online | 7.1% |
Request a Free Sample
Fill in your details and we'll send you a free sample report.
- Sample data tables & charts
- Research methodology
Aging shoppers, tourists and specialty retail lift sales
How does an older population lift natural skin care spending?
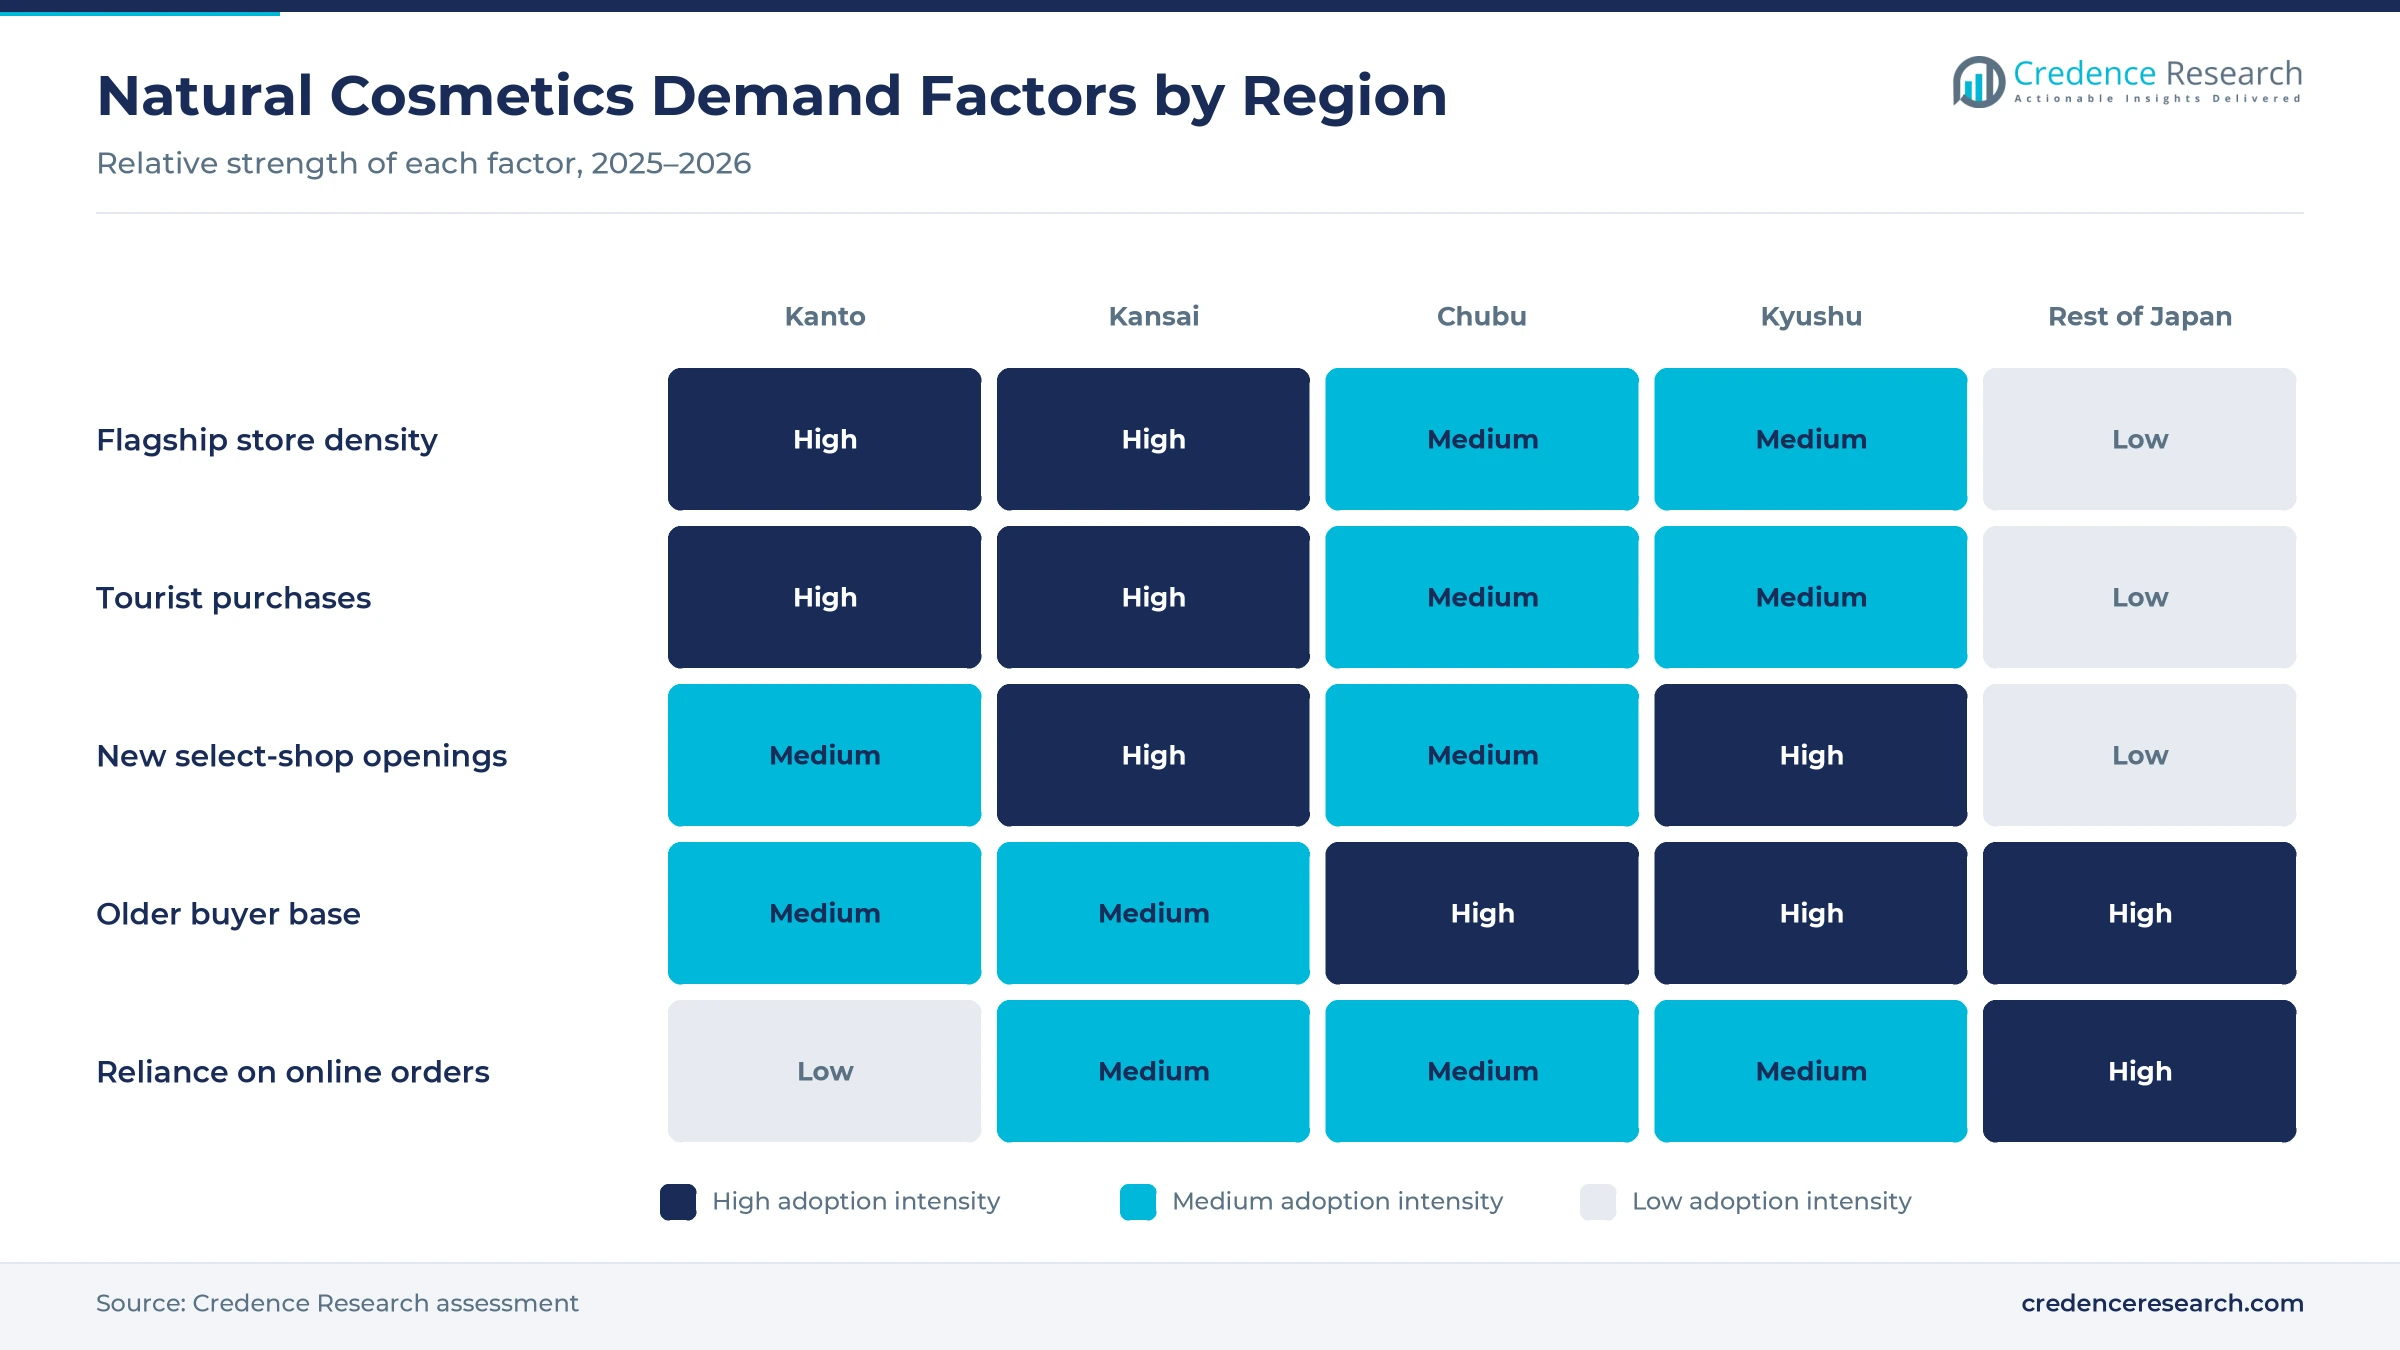
An older population buys more skin care, because mature skin needs gentle moisturizing products used every day. People aged 65 and over reached 36.24 million, or 29.3% of the population, on Oct. 1, 2024, a record share, according to the Statistics Bureau of Japan. The Cabinet Office put the share at 29.4% a year later, so the core buyer group keeps growing. The Japan Cosmetic Industry Association guideline of Feb. 1, 2018, lets brands label natural and organic ingredient content under ISO 16128, according to ChemLinked. As a result, skin care holds 46.0% of 2025 value, because older buyers check ingredient percentages before switching from conventional creams.
Why do record tourist arrivals support Japanese natural brands?
Foreign visitors add a second buyer group, because many tourists buy Japanese skin care in department stores and duty-free shops. Japan welcomed 42,683,600 international visitors in 2025, up 15.8%, according to Travel Voice, citing JNTO. Visitor spending reached a record 9.5 trillion yen that year, according to the same publisher. Shiseido opened its first BAUM travel retail counter of about 25 square meters at Japan Duty Free Ginza in February 2023, according to Global Travel Retail Magazine. Expo 2025 Osaka also drew 25,578,986 general visitors from April to October 2025. As a result, tourist purchases in Tokyo and Osaka department stores add value on top of domestic demand, because visitors often buy several items at once.
How do specialty stores and online channels widen access?
Specialty retailers make natural brands easier to compare, because one shop shows hundreds of labels side by side. I-Style Retail opened @cosme OSAKA on Sept. 1, 2023, with about 893 square meters, 500 brands and more than 12,000 products, according to I-Style. Mash Beauty Lab opened Cosme Kitchen online preorders on Dec. 4, 2024, for its New Year bags, according to WWD Japan. Business-to-consumer e-commerce reached 26.1 trillion yen in 2024, while the online share of goods sales rose to 9.8%, according to the Ministry of Economy, Trade and Industry. As a result, online sales grow fastest at 7.1% a year during 2026–2035.
Why do sustainability rules favor plant-based brands?
Packaging and sourcing rules reward brands that cut plastic and use renewable materials, which suits natural cosmetics makers. The Plastic Resource Circulation Act took effect on April 1, 2022, and covers 12 products including hair brushes, razors and toothbrushes, according to Ota City. Retailers must ask buyers whether they want these items, which pushes stores and hotels toward plant-based alternatives. Shiseido’s BAUM uses upcycled oak from furniture offcuts in its packaging, and some products are refillable. KOSÉ Holdings reported that its BIOLISS project had planted 1,600 trees on 3,372 square meters by 2025. In turn, demand for refillable beauty packaging rises, because retailers ask suppliers for lower-plastic formats.
Factory tourism, mineral make-up and exports reshape demand
How is the shift to factory and flagship experiences changing sales?
Brands increasingly sell through places where shoppers can see products made, which builds trust in natural claims. SHIRO opened its Minna no Kojo factory complex on a 20,332-square-meter former school site in Sunagawa, Hokkaido, on April 28, 2023, according to WWD Japan. Visitors watch blending and filling through glass walls before buying in the shop. KOSÉ Holdings said its Minami Alps Plant would start in July 2026, with an environmental strategy centered on water. I-Style Retail also planned an @cosme NAGOYA flagship of about 810 square meters for summer 2025, according to Netshop Impress. As a result, offline sales keep a 72.0% share of 2025 value.
Why is the rise of mineral make-up widening the color category?
Natural make-up is moving beyond simple powders, because brands now add sun protection and skin care benefits to mineral formulas. ETVOS launched its Serenity Lagoon collection on May 1, 2025, including a mineral primer with SPF50 and PA++++ at 4,180 yen, according to WWD Japan. Its mineral multi powder works as eye, cheek and lip color at 2,530 yen and comes in six shades, two of them limited. Cosme Kitchen bags in January 2025 carried brands such as SOEL, F ORGANICS and LA CASTA. Interest in vegan beauty formulations also supports this shift toward plant and mineral color. As a result, make-up cosmetics grow fastest at 6.8% a year.
Can exports to Southeast Asia open new demand for natural brands?
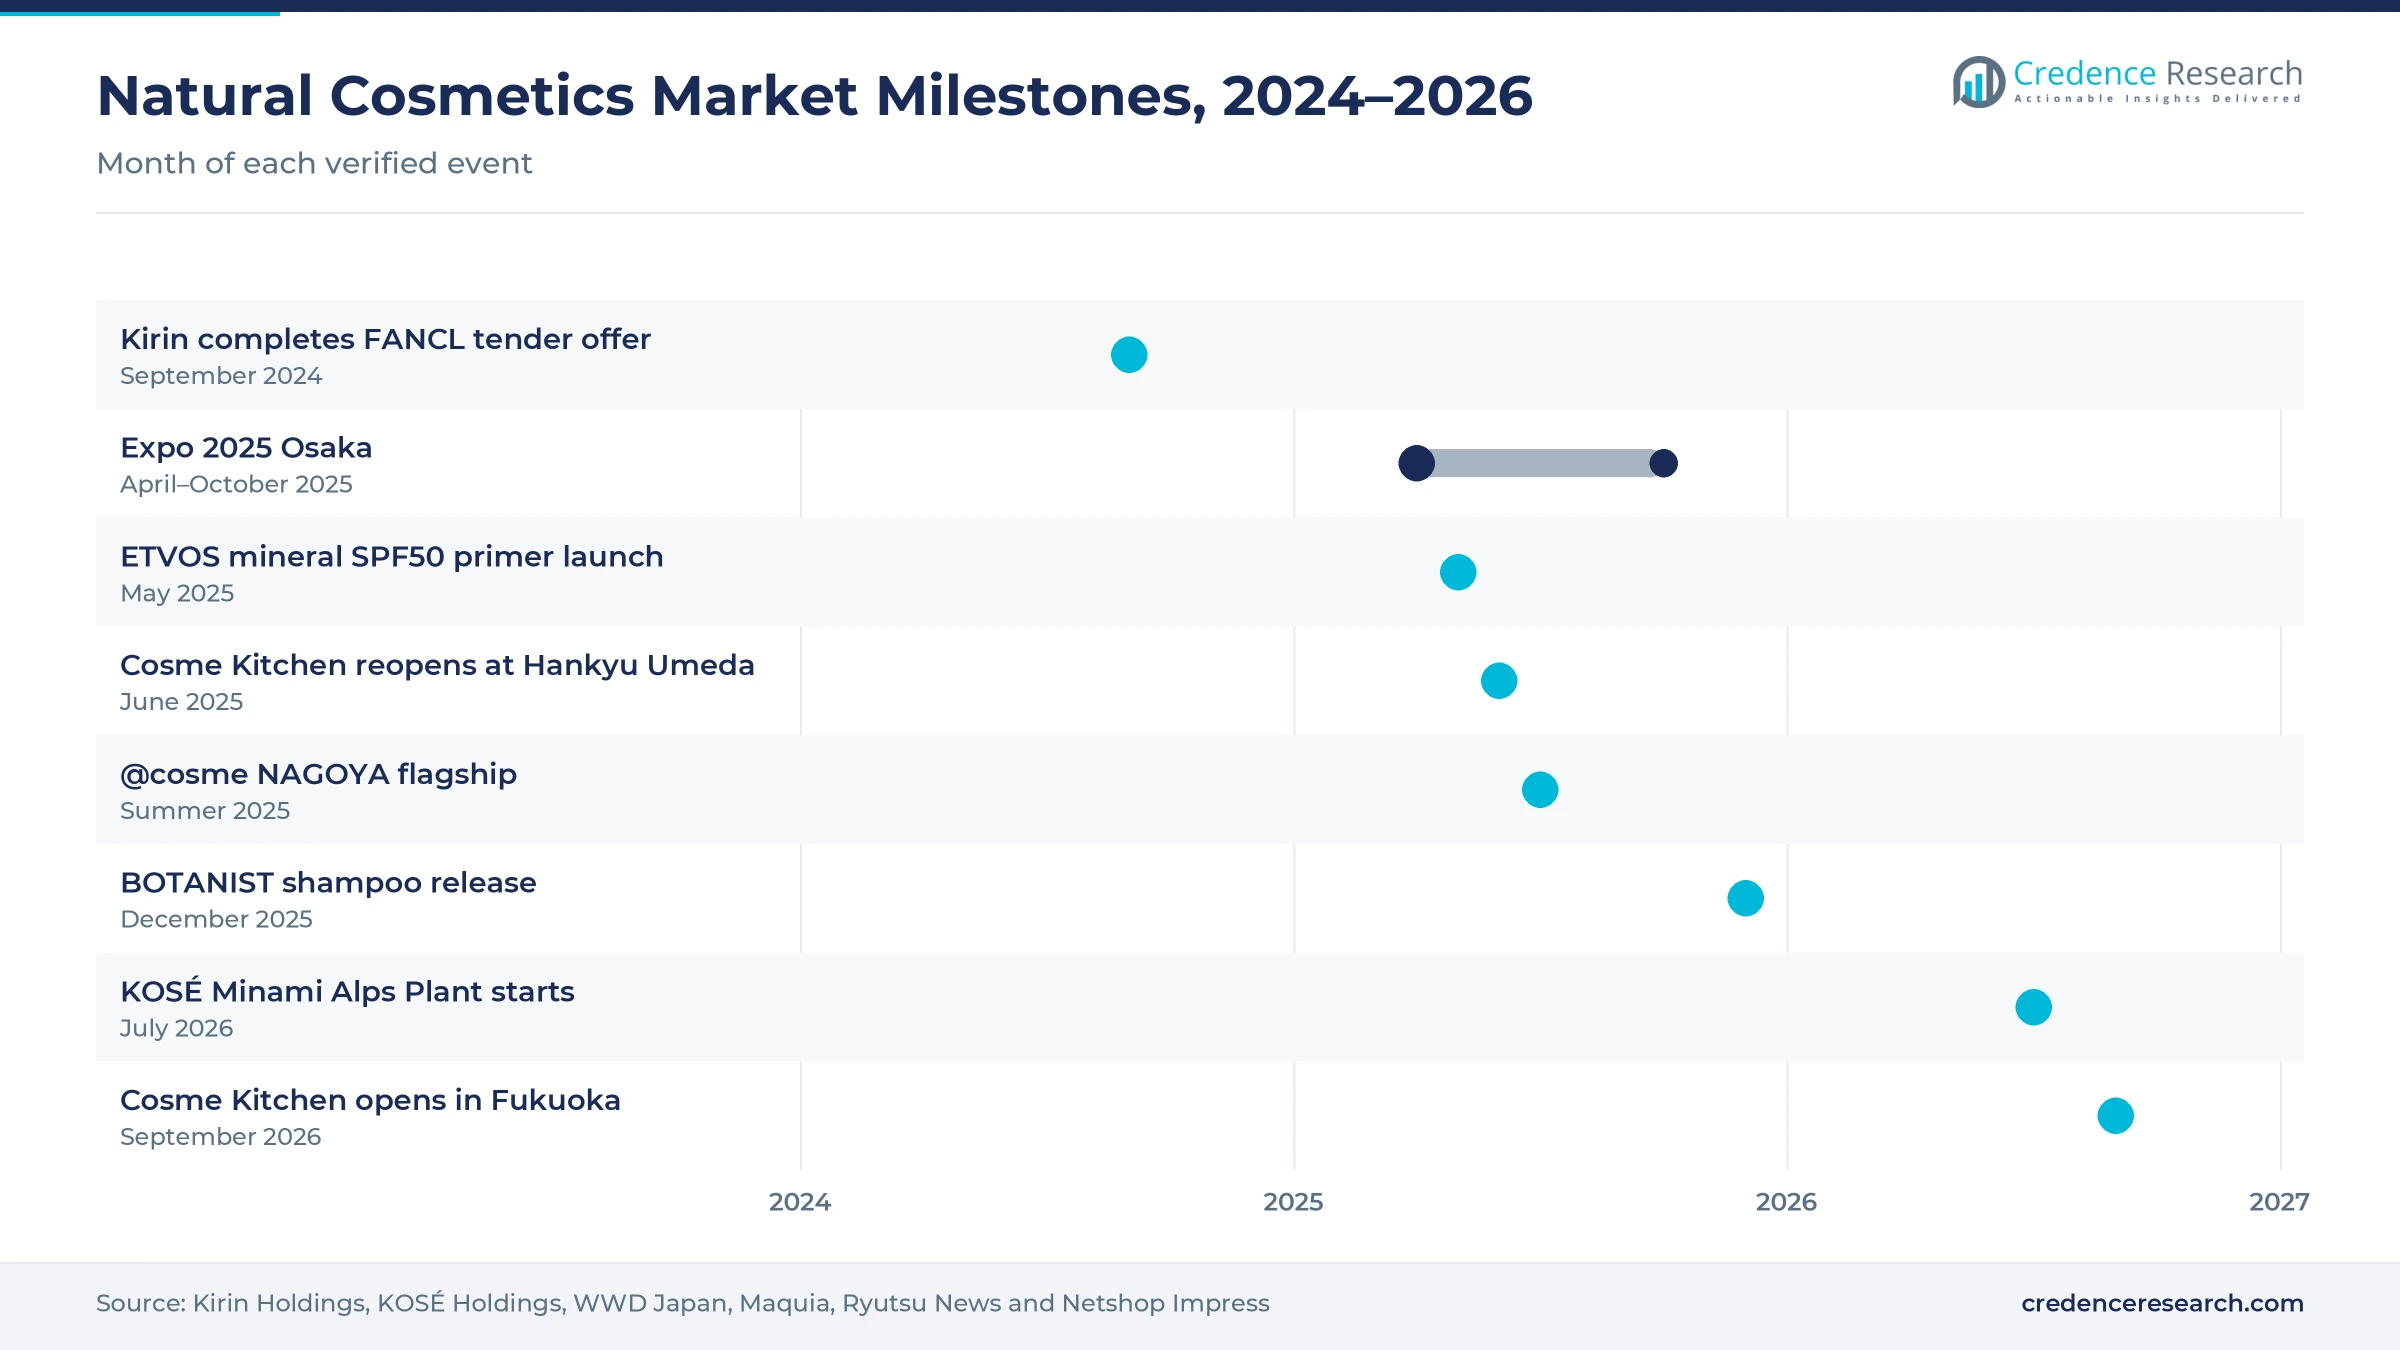
Export markets offer room for natural brands, because Japanese skin care has a strong name across Asia. Japan exported cosmetics worth USD 4,254 million in 2023, down from USD 5,276 million in 2022, with China, Hong Kong and Singapore as the main destinations, according to the Ministry of Economy, Trade and Industry. Singapore took 13.8% of Japan’s 2023 skin care preparation exports, according to TrendEconomy data. Vietnam and Thailand each took about 1.3% of that value, so both remain small but open markets. Cosmetics imports reached about 0.4 trillion yen in 2023, according to the same ministry, which shows that foreign brands also compete hard at home. As a result, makers that build plant-based ranges at home can spread fixed costs across Southeast Asian buyers.
Will health-science groups create an opening for larger natural ranges?
Food and health groups are buying cosmetics makers, which opens funding for larger natural and additive-free ranges. Kirin Holdings announced on Sept. 12, 2024, that its tender offer for FANCL at 2,800 yen per share had succeeded, lifting its stake to 75.24% on settlement Sept. 19. The total purchase price was about 230 billion yen, including the expected squeeze-out, and Kirin aims to become one of the largest health science companies in the Asia-Pacific region. Aeon sells its COSMOS-certified Geo Organics oils at 1,500 to 2,000 yen before tax, according to BeautyTech.jp. As a result, large retailers and groups can take natural products into mass channels at lower prices, which widens the buyer base beyond select shops.
Loose labeling rules and a shrinking population weigh
Why does the lack of an official organic label confuse shoppers?
Shoppers struggle to compare claims, because Japan has no official government certification system for organic cosmetics, according to COSMOS in June 2026. The industry guideline of Feb. 1, 2018, allows only natural and organic ingredient claims, not product claims, according to ChemLinked. As a result, brands rely on private seals from COSMOS, JOCA or JNOCA with different rules. Clear ingredient percentages and third-party audits help reduce this confusion for buyers.
How does a shrinking population limit volume growth?
The domestic buyer base is getting smaller, which limits the number of new customers for every brand. Japan’s population fell by 550,000 to about 123.8 million in the year to Oct. 1, 2024, according to the Statistics Bureau of Japan. As a result, growth must come from higher value per buyer rather than more buyers. Brands respond with premium serums, refills and tourist sales in large cities.
Why do drugstore price points squeeze premium natural lines?
Mass channels set a low price anchor, which makes premium natural items harder to justify for many buyers. Drugstores sold 1.83 trillion yen of beauty care in fiscal 2024, according to the Japan Chain Drug Store Association. An ETVOS mineral primer costs 4,180 yen, according to WWD Japan, while a Cosme Kitchen opening kit costs 7,700 yen. As a result, premium brands use trial sizes and limited kits to win first purchases.
How does export weakness in China hurt domestic makers?
Weak demand in China cuts the scale that funds new natural ranges, because China took half of Japan’s skin care preparation exports in 2023. Those exports fell 28.1% to about USD 3.18 billion that year, according to TrendEconomy data based on UN Comtrade. As a result, makers have less volume to spread research and packaging costs. Many now shift focus to domestic select shops and Southeast Asian buyers.
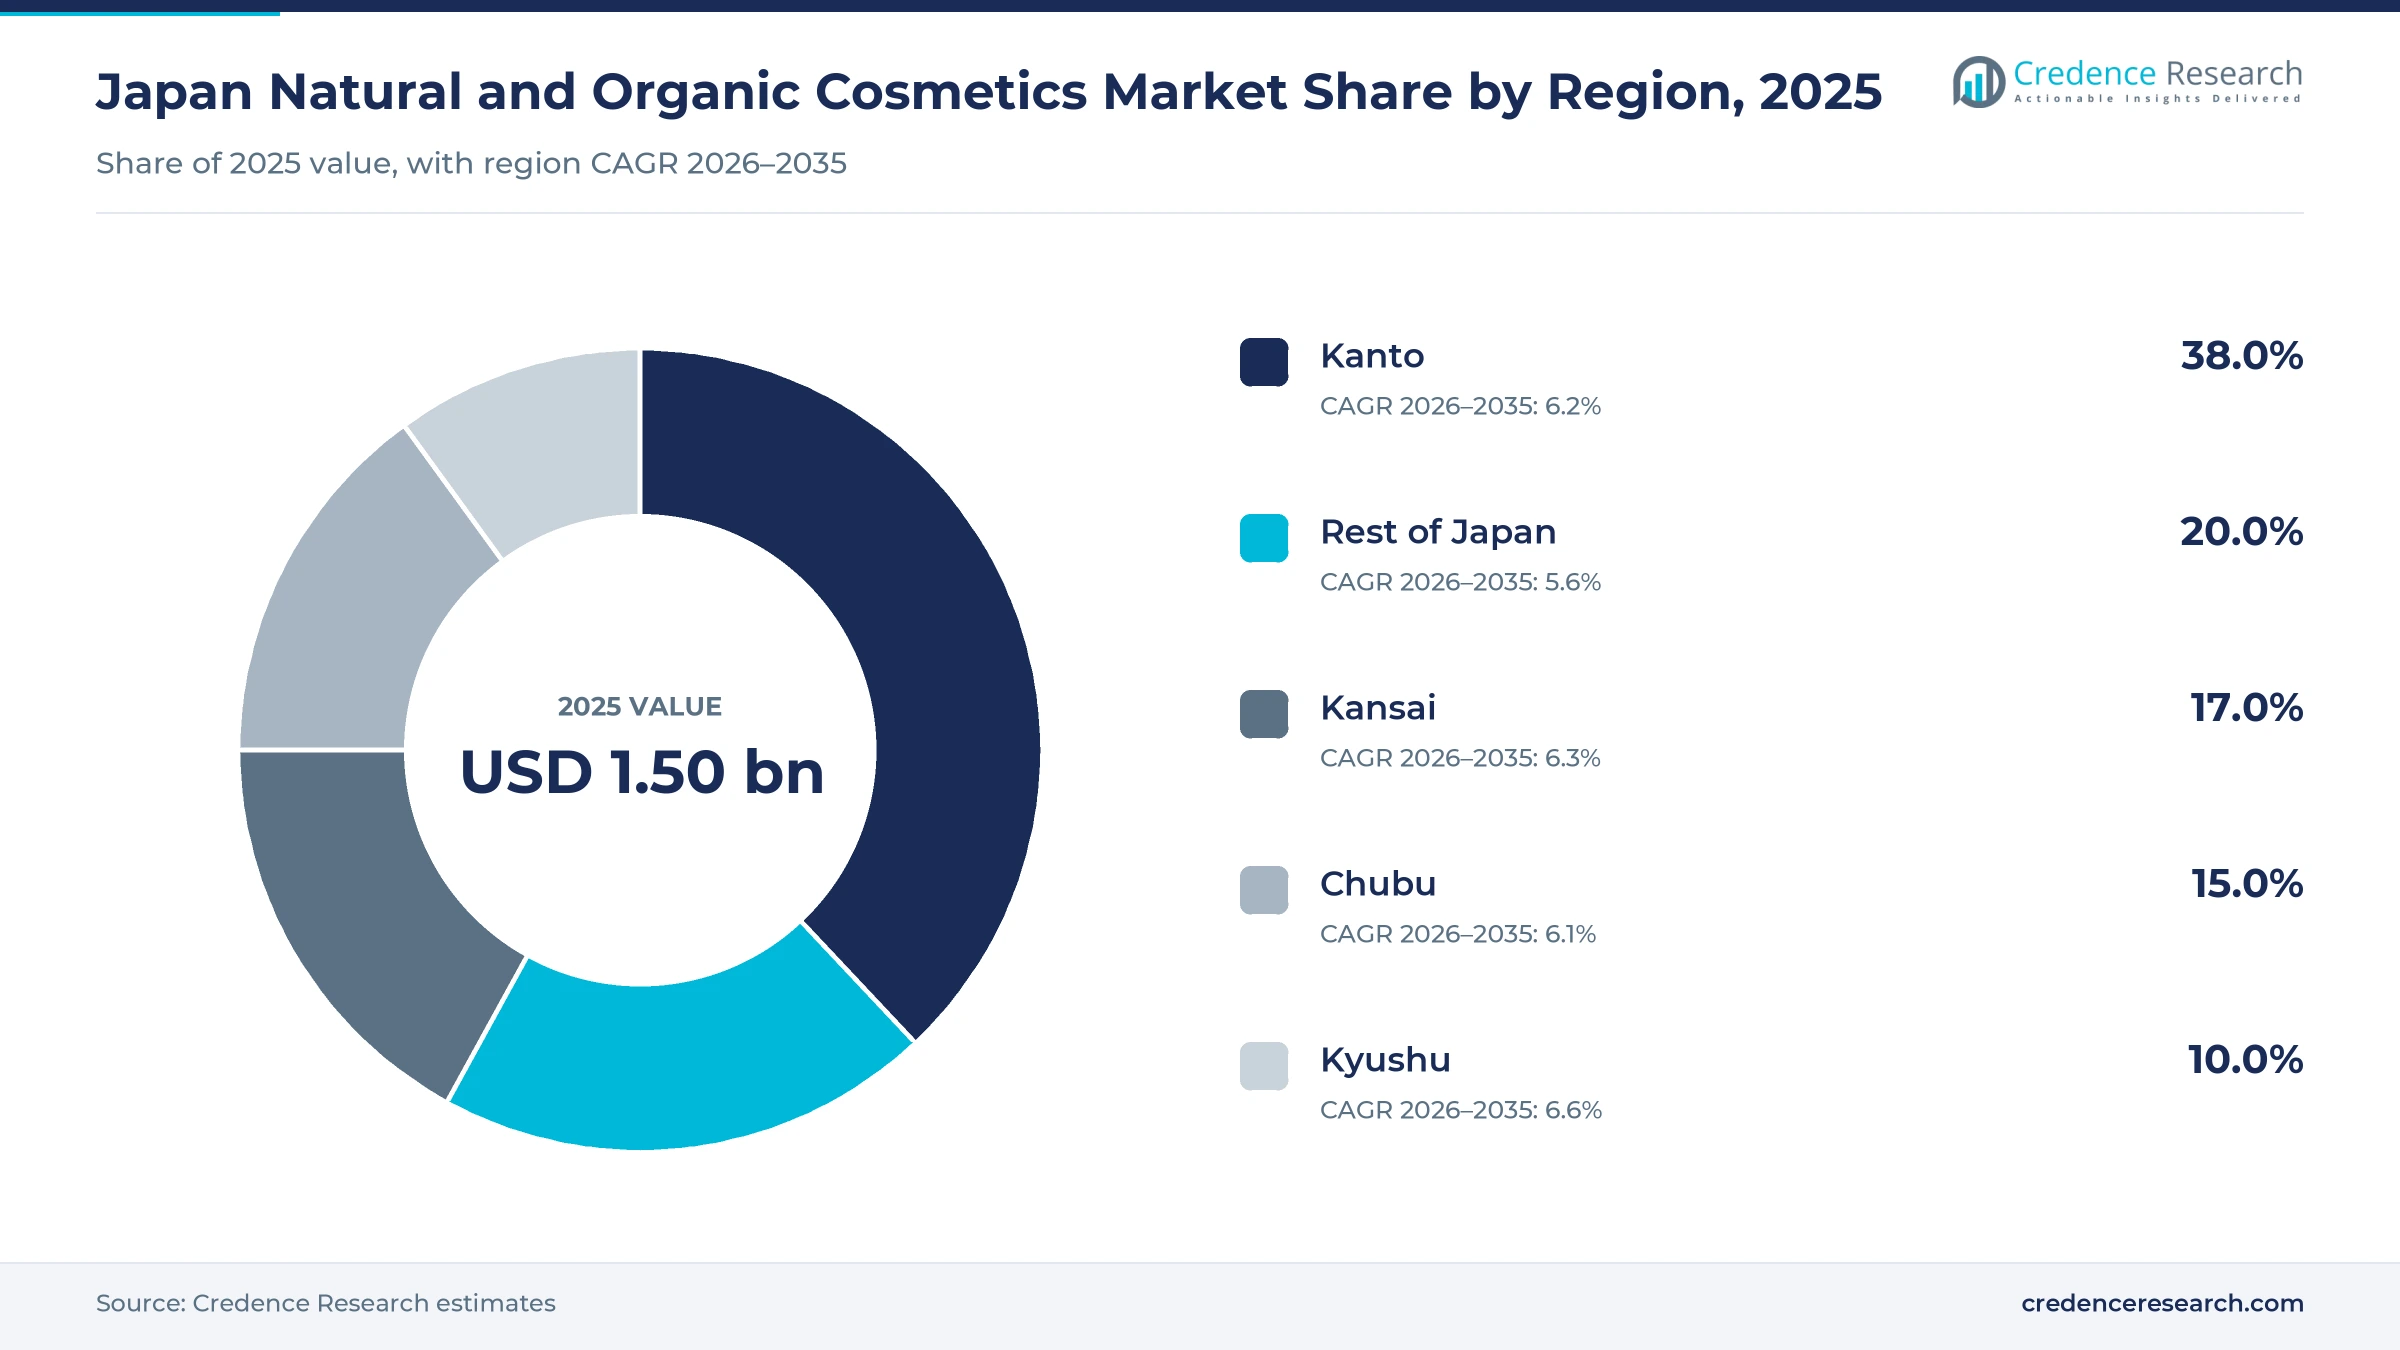
Tokyo area buys most while Kyushu adds stores fastest
| Region | Value, 2025 (USD billion) | Share, 2025 | CAGR, 2026–2035 |
|---|---|---|---|
| Kanto | 0.57 | 38.0% | 6.2% |
| Rest of Japan | 0.30 | 20.0% | 5.6% |
| Kansai | 0.25 | 17.0% | 6.3% |
| Chubu | 0.22 | 15.0% | 6.1% |
| Kyushu | 0.15 | 10.0% | 6.6% |
Why does Kanto buy the most natural cosmetics?
Kanto held a 38.0% share of 2025 value and grows at 6.2% a year, because Tokyo and nearby prefectures host the largest flagship stores and department store counters. Tokyo had the fastest population growth of any prefecture, 0.66%, in the year to Oct. 1, 2024, according to the Statistics Bureau of Japan. @cosme TOKYO has operated in front of Harajuku Station since January 2020. Tokyo buyers also combine skin care with visits to aesthetic clinics.
How does Kansai build demand around Umeda?
Kansai held a 17.0% share of 2025 value and grows at 6.3% a year, because Osaka’s Umeda district concentrates large beauty stores. @cosme OSAKA opened there on Sept. 1, 2023, with 500 brands and more than 12,000 products. Cosme Kitchen reopened on the eighth floor of Hankyu Umeda Honten on June 11, 2025, according to Ryutsu News. Expo 2025 Osaka also drew 25,578,986 general visitors, which brought new shoppers into the region.
Why is Chubu gaining flagship and factory investment?
Chubu held a 15.0% share of 2025 value and grows at 6.1% a year, because Nagoya is the main retail hub between Tokyo and Osaka. I-Style Retail planned a new @cosme NAGOYA store of about 810 square meters at Takashimaya Gate Tower Mall for summer 2025. KOSÉ Holdings also said its Minami Alps Plant in Yamanashi would start in July 2026. As a result, Chubu gains both stores and production capacity.
What makes Kyushu the fastest-growing region?
Kyushu held a 10.0% share of 2025 value and grows fastest at 6.6% a year, because select shops are adding stores in Fukuoka, the region’s largest city. Mash Beauty Lab opened Cosme Kitchen at Solaria Stage in Tenjin, Fukuoka, on Sept. 18, 2026, according to Ryutsu News. The store sells natural cosmetics, herbs and detergents, with an opening kit at 7,700 yen. In turn, Kyushu buyers gain access to brands once sold mainly in Tokyo and Osaka.
How do Hokkaido and other regions shape demand?
Rest of Japan, which covers Hokkaido, Tohoku, Chugoku and Shikoku, held a 20.0% share of 2025 value and grows at 5.6% a year. These areas lose residents faster than the large cities, which slows store growth. However, SHIRO opened its Minna no Kojo complex in Sunagawa, Hokkaido, on April 28, 2023, which draws visitors to a local factory. As a result, online orders matter more here than in Kanto.
Takeovers, store openings and launches since 2023
| Development | Status and market relevance |
|---|---|
| In September 2023, I-Style Retail opened @cosme OSAKA in Umeda with 500 brands and more than 12,000 products. | Kansai flagship for comparing natural brands |
| In September 2024, Kirin Holdings completed its tender offer for FANCL, lifting its stake to 75.24%. | Brings an additive-free cosmetics maker into a health-science group |
| In May 2025, ETVOS launched its Serenity Lagoon mineral make-up collection with an SPF50 primer. | Widens mineral color cosmetics |
| In June 2025, Cosme Kitchen reopened on the eighth floor of Hankyu Umeda Honten in Osaka. | Expands select-shop space in Kansai |
| In September 2026, Mash Beauty Lab opened Cosme Kitchen at Solaria Stage in Fukuoka. | Extends natural select shops into Kyushu |
Natural-origin indexes and refill formats shape products
- ISO 16128 natural-origin indexes let brands calculate and label the share of natural and organic ingredients, which the industry guideline has allowed since 2018.
- Mineral pigment formulations replace synthetic dyes in powders and primers, which lets make-up brands add sun protection without heavy oils.
- Refill and upcycled packaging reuses bottles or wood offcuts, as Shiseido’s BAUM does with oak from furniture makers.
- Open-view production lines show blending and filling to visitors, which SHIRO uses at its Sunagawa factory to build trust.
Need a Custom Version of This Report?
Tailor the scope, geography, or segments to your exact requirements.
- Custom geography or segment scope
- Direct access to our analyst team
Domestic houses and select shops compete for clean shoppers
Competition combines large Japanese cosmetics houses, natural specialist brands, select-shop operators and European organic labels. Shiseido runs BAUM, a unisex brand with at least 90% natural-origin ingredients, while KOSÉ runs the BIOLISS hair care line with a tree-planting program. FANCL, now majority-owned by Kirin Holdings, sells additive-free skin care. Specialists such as SHIRO, ETVOS and I-ne’s BOTANIST compete on plant ingredients, mineral formulas and drugstore prices. Mash Beauty Lab runs Cosme Kitchen and BIOPLE, which stock imported and domestic labels, and Takashimaya sells Weleda and Dr. Hauschka oral care. Brands compete on ingredient percentages, private seals, store experience and price. As a result, scale in stores and supply favors large houses, while specialists win on trust and story.
Which brands and retailers are expanding natural ranges?
| Company | Type | Role in the market |
|---|---|---|
| Shiseido Company, Limited | Cosmetics house | Runs BAUM, a unisex brand with 90% natural-origin ingredients |
| KOSÉ Corporation | Cosmetics house | BIOLISS hair care and Minami Alps Plant from July 2026 |
| FANCL Corporation | Additive-free cosmetics maker | Kirin Holdings stake reached 75.24% in September 2024 |
| Weleda | Imported organic brand | Swiss natural skin, body and oral care sold in Japan, including at Takashimaya |
| Mash Beauty Lab | Select-shop operator | Runs Cosme Kitchen, opened in Fukuoka in September 2026 |
| SHIRO | Natural specialist brand | Opened its Sunagawa factory complex in April 2023 |
| I-ne | Botanical hair and body care maker | Sells BOTANIST plant-based shampoo and body care through drugstores |
| ETVOS | Mineral make-up brand | Launched an SPF50 mineral primer in May 2025 |
| Aeon | Retailer private label | Sells its COSMOS-certified Geo Organics oils through mass retail stores |
| Dr. Hauschka (WALA) | Imported organic brand | German natural skin and oral care sold in Japan through Takashimaya |
Why trusted natural claims will decide brand winners
Credence Research's view is that Japan natural and organic cosmetics will grow steadily, because older buyers, record tourist numbers and wider online access keep demand rising. Skin care remains the largest category, while make-up cosmetics, unisex lines and online sales grow fastest. The lack of an official organic label means trust will decide winners, so brands that publish ingredient percentages and hold private seals should gain share. Large groups such as Kirin and Aeon can push natural ranges into mass channels, while select shops widen access outside Tokyo by 2035.
Industry statistics and population data anchor the model
The report uses 2025 as the base year on a calendar basis, and market values come from the Credence Research model. The earlier 2023 estimate was brought to 2025 with its own growth rate and checked against cosmetics shipment, import and population data. Segment splits and zone shares are Credence Research estimates from public data. Sources used are official statistics, government releases, industry association data, trade press and company releases, and no interviews or surveys were used.
Online sales and unisex lines carry growth to 2035
The Japan natural and organic cosmetics market is expected to reach USD 2.70 billion by 2035, a 6.10% CAGR during 2026–2035, as older buyers, tourist sales and online channels keep demand rising. Growth should be strongest in make-up cosmetics, unisex products, online sales and Kyushu, because these areas gain most from mineral formulas, gender-neutral brands, e-commerce and new select shops. Loose labeling rules and a shrinking population could slow volume, while refills, exports and larger group owners should support value growth.
Frequently Asked Questions
How big is the Japan natural and organic cosmetics market?
How large is the overall cosmetics industry in Japan?
What was the value of Japan’s cosmetics exports in 2023?
Which product type leads the market?
Is there an official organic cosmetics label in Japan?
Which sales channel grows fastest?
Which region leads the Japan natural and organic cosmetics market?
What are the main beauty market trends in Japan?
Table of Content
Chapter 1 Market Segmentation
- 1.1 Segmentation Framework
- 1.1.1 Product and Service Classification
- 1.1.2 Application and End-Use Classification
- 1.1.3 Technology and Solution Classification
- 1.1.4 Customer and Distribution Channel Classification
- 1.1.5 Geographic Segmentation
- 1.1.6 Market Segment Definitions and Boundaries
- 1.2 By Product Type
- 1.2.1 Skin Care
- 1.2.2 Hair Care
- 1.2.3 Make-Up Cosmetics
- 1.2.4 Oral Care
- 1.2.5 Others
- 1.3 By End User
- 1.3.1 Female
- 1.3.2 Male
- 1.3.3 Unisex
Chapter 2 Introduction
- 2.1 Report Objectives and Scope
- 2.2 Product Definition and Industry Terminology
- 2.3 Market Inclusions and Exclusions
- 2.4 Research Process
- 2.4.1 Primary Research and Expert Interviews
- 2.4.2 Secondary Research and Source Review
- 2.4.3 Top-Down and Bottom-Up Estimation
- 2.4.4 Data Triangulation and Verification
- 2.5 Market Size Measurement Basis
- 2.5.1 2025: USD 1.50 billion → 2035: USD 2.70 billion
- 2.6 Historical and Forecast Reference Periods
- 2.6.1 Historical Period: 2018-2025
- 2.6.2 Base Year: 2025
- 2.6.3 Forecast Period: 2025-2035
- 2.7 Research Assumptions and Limitations
Chapter 3 Executive Summary
- 3.1 Market Snapshot and Key Findings
- 3.2 Base-Year Market Size, 2025
- 3.3 Forecast Market Size, 2035
- 3.4 Revenue and Volume Growth Outlook
- 3.5 Key Demand and Supply Indicators
- 3.6 Leading Market Segments
- 3.7 Fastest-Growing Market Opportunities
- 3.8 Regional Performance Highlights
- 3.9 Technology and Industry Transformation
- 3.10 Competitive Landscape Summary
- 3.11 Analyst View and Strategic Implications
Chapter 4 Japan Natural and Organic Cosmetics Market Trends and Developments
- 4.1 Historical Industry Development, 2018-2025
- 4.2 Recent Market Trends and Developments
- 4.3 Demand and Customer Behavior Trends
- 4.4 Technology and Product Innovation
- 4.5 Artificial Intelligence, Automation and Digitalization
- 4.6 Local Manufacturing and Supply Chain Realignment
- 4.7 Industry Partnerships, Mergers and Acquisitions
- 4.8 Sustainability and Circular Economy Developments
- 4.9 Government and Private Sector Investment Trends
- 4.10 Emerging Business Models and Commercialization
- 4.11 Industry Developments and Announcements
Chapter 5 Japan Natural and Organic Cosmetics Market Production, Supply and Demand Analysis
- 5.1 Demand Trend and Consumption Analysis, 2018-2025
- 5.2 Demand Forecast, 2025-2035
- 5.3 Production and Output Trend, 2018-2025
- 5.4 Production and Output Forecast, 2025-2035
- 5.5 Installed Capacity and Capacity Utilization
- 5.6 Company-Wise Production Plants and Statistics
- 5.6.1 Installed Production Capacity
- 5.6.2 Actual Production
- 5.6.3 Planned Capacity and Expansion Targets
- 5.7 Supply Chain Structure and Procurement Trends
- 5.8 Supply-Demand Gap and Bottlenecks
- 5.9 Import Dependence and Sourcing Structure
- 5.10 Contract Manufacturing and Outsourcing
- 5.11 Regional Supply and Demand Concentration
Chapter 6 Japan Natural and Organic Cosmetics Market Pricing Analysis
- 6.1 Pricing Structure and Measurement
- 6.2 Historical Pricing Trends, 2018-2025
- 6.3 Pricing Outlook, 2025-2035
- 6.4 Average Selling Price and Unit Economics
- 6.5 Pricing by Product and Market Segment
- 6.6 Geographic Pricing Differences
- 6.7 Key Input, Energy, Labor and Logistics Costs
- 6.8 Contract Pricing and Purchasing Models
- 6.9 Pricing Sensitivity and Competitive Positioning
- 6.10 Price, Margin and Profitability Implications
Chapter 7 Japan Natural and Organic Cosmetics Market Dynamics
- 7.1 Market Growth Drivers
- 7.1.1 Demand-Side Drivers
- 7.1.2 Technology and Innovation Drivers
- 7.1.3 Infrastructure and Investment Drivers
- 7.1.4 Regulatory and Policy Drivers
- 7.2 Market Restraints
- 7.2.1 Cost and Affordability Constraints
- 7.2.2 Technology and Adoption Barriers
- 7.2.3 Supply Chain and Operational Constraints
- 7.3 Market Challenges
- 7.3.1 Competitive Pressure and Margin Erosion
- 7.3.2 Skills, Infrastructure and Implementation Gaps
- 7.4 Emerging Market Opportunities
- 7.5 Market Dynamics Impact and Time-Horizon Assessment
Chapter 8 Japan Natural and Organic Cosmetics Value Chain Analysis
- 8.1 Industry Value Chain Overview
- 8.2 Upstream Suppliers and Critical Inputs
- 8.3 Technology and Component Providers
- 8.4 Manufacturing or Service Delivery
- 8.5 Distribution, Channel Partners and Integrators
- 8.6 Downstream Applications and End Users
- 8.7 Value Addition and Profit Pools
- 8.8 Vertical Integration and Outsourcing
- 8.9 Supplier Concentration and Risk
- 8.10 Supply Chain Localization and Resilience
Chapter 9 Japan Natural and Organic Cosmetics Market Regulations and Policies
- 9.1 Relevant Laws, Standards and Compliance Frameworks
- 9.2 Product, Service, Safety and Quality Requirements
- 9.3 Government Policies, Incentives and Subsidies
- 9.4 Imports, Exports and Trade Barriers
- 9.5 Public Procurement and Local Content Requirements
- 9.6 Environmental and Sustainability Compliance
- 9.7 Upcoming Policy Changes and Market Implications
Chapter 10 Japan Natural and Organic Cosmetics Market Hotspots and Opportunities
- 10.1 Market Opportunity Mapping and Growth Hotspots
- 10.2 High-Growth Applications and Customer Groups
- 10.3 Underserved Markets and White-Space Opportunities
- 10.4 Emerging Technology and Product Opportunities
- 10.5 New Capacity and Investment Hotspots
- 10.6 Market Entry and Expansion Opportunities
- 10.7 Distribution and Partnership Opportunities
- 10.8 Near-Term and Long-Term Commercial Potential
- 10.9 Opportunity Attractiveness and Execution Risks
Chapter 11 Japan Natural and Organic Cosmetics Market Outlook, 2025-2035
- 11.1 Market Size and Analysis
- 11.1.1 Revenue (Market Measurement: 2025: USD 1.50 billion → 2035: USD 2.70 billion)
- 11.1.2 Market Volume and Quantity Sold
- 11.1.3 Historical Market Size, 2018-2025
- 11.1.4 Base-Year Market Size, 2025
- 11.2 Market Forecast, 2025-2035
- 11.2.1 Revenue Forecast to 2035
- 11.2.2 Volume Forecast to 2035
- 11.2.3 CAGR and Year-on-Year Growth
- 11.2.4 Incremental Revenue Opportunity
- 11.3 Forecast Assumptions and Scenario Analysis
- 11.3.1 Base-Case Forecast
- 11.3.2 Optimistic and Conservative Scenarios
- 11.3.3 Technology, Pricing and Policy Sensitivities
- 11.4 Market Attractiveness and Growth Outlook
Chapter 12 Japan Natural and Organic Cosmetics Market Segmentation and Outlook
- 12.1 Segmentation Summary and Market Shares, 2025
- 12.2 Largest and Fastest-Growing Segments
- 12.3 By Product Type - Market Size and Forecast, 2025-2035
- 12.3.1 Segment Definition and Scope
- 12.3.2 Historical Market Size, 2018-2025
- 12.3.3 Revenue Forecast, 2025-2035
- 12.3.4 Volume Forecast, 2025-2035
- 12.3.5 Base-Year Market Share, 2025
- 12.3.6 Segment CAGR and Growth Drivers
- 12.3.7 Subsegment Market Size and Forecast
- 12.3.7.1 Skin Care
- 12.3.7.2 Hair Care
- 12.3.7.3 Make-Up Cosmetics
- 12.3.7.4 Oral Care
- 12.3.7.5 Others
- 12.3.8 Subsegment Pricing and Adoption Trends
- 12.3.9 Leading Suppliers and Competition
- 12.3.10 Regional Demand and Opportunities
- 12.4 By End User - Market Size and Forecast, 2025-2035
- 12.4.1 Segment Definition and Scope
- 12.4.2 Historical Market Size, 2018-2025
- 12.4.3 Revenue Forecast, 2025-2035
- 12.4.4 Volume Forecast, 2025-2035
- 12.4.5 Base-Year Market Share, 2025
- 12.4.6 Segment CAGR and Growth Drivers
- 12.4.7 Subsegment Market Size and Forecast
- 12.4.7.1 Female
- 12.4.7.2 Male
- 12.4.7.3 Unisex
- 12.4.8 Subsegment Pricing and Adoption Trends
- 12.4.9 Leading Suppliers and Competition
- 12.4.10 Regional Demand and Opportunities
- 12.5 Segment Growth Comparison
- 12.6 Segment Attractiveness and Priority Matrix
Chapter 13 Japan Natural and Organic Cosmetics End-Use and Application Market Outlook
- 13.1 End-Use Industry and Customer Demand Structure
- 13.2 Leading Applications and Customer Groups
- 13.3 End-Use Market Size, Share and Forecast
- 13.4 Major End-Use Industry Deep Dives
- 13.4.1 Customer Requirements and Use Cases
- 13.4.2 Demand and Replacement Cycles
- 13.4.3 Technical and Regulatory Considerations
- 13.4.4 Purchasing and Procurement Models
- 13.4.5 Leading Vendors and Distribution Channels
- 13.4.6 Forecast and Commercial Opportunities
- 13.5 Emerging Applications and Cross-Segment Demand
- 13.6 End-Use Industry Investment Priorities
Chapter 14 Japan Natural and Organic Cosmetics Geographic Market Outlook, 2025-2035
- 14.1 Domestic Market Distribution and Demand Clusters
- 14.2 State- or Province-Wise Market Size and Forecast, 2025-2035
- 14.3 City and Metropolitan Market Outlook
- 14.4 Industrial, Manufacturing and Commercial Clusters
- 14.5 Geographic Concentration of Key End Users
- 14.6 Local Pricing and Purchasing Differences
- 14.7 Domestic Production Facilities and Capacity Map
- 14.8 Local Infrastructure and Project Pipeline
- 14.9 State-Level Policy and Incentive Differences
- 14.10 Subnational Investment Hotspots and Opportunities
- 14.11 Distribution and Logistics Networks
- 14.12 Domestic Competitive Footprint
Chapter 15 Japan Natural and Organic Cosmetics Technology, Innovation and Sustainability Outlook
- 15.1 Technology Landscape and Maturity
- 15.2 Product, Process and Service Innovation
- 15.3 AI, Automation and Digital Tools in the Industry
- 15.4 Technology Adoption and Performance Benchmarking
- 15.5 Innovation Pipeline and R&D Investment
- 15.6 Patent and Intellectual Property Trends
- 15.7 Energy Efficiency and Resource Management
- 15.8 Sustainability, Recycling and Circularity
- 15.9 Technology Roadmap, 2025-2035
- 15.10 Risks of Obsolescence and Technology Substitution
Chapter 16 Japan Natural and Organic Cosmetics Market Key Strategic Imperatives
- 16.1 Growth and Market Entry Priorities
- 16.2 High-Return Products and Segments
- 16.3 Pricing, Profitability and Cost Optimization
- 16.4 Technology Investment and Product Differentiation
- 16.5 Supply Chain Localization and Resilience
- 16.6 Distribution and Customer Acquisition
- 16.7 Partnership, Acquisition and Capacity Strategy
- 16.8 Regional Expansion Priorities
- 16.9 Short-, Medium- and Long-Term Actions
Chapter 17 Competition Outlook
- 17.1 Industry Competition Characteristics
- 17.2 Market Structure and Concentration
- 17.3 Market Share and Competitive Positioning, 2025
- 17.4 Company-Wise Revenue and Product Benchmarking
- 17.5 Production and Service Capacity Benchmarking
- 17.6 Technology, Pricing and Differentiation
- 17.7 Regional Footprint and Distribution Strength
- 17.8 Mergers, Acquisitions and Strategic Alliances
- 17.9 New Entrants and Competitive Threats
- 17.10 Porter's Five Forces and Industry Attractiveness
- 17.11 Competitive Outlook, 2025-2035
Chapter 18 Company Profiles
- 18.1 Company Coverage and Selection Criteria
- 18.2 Shiseido Company, Limited
- 18.2.1 Business Description
- 18.2.2 Company Ownership and Geographic Presence
- 18.2.3 Product and Service Portfolio
- 18.2.4 Manufacturing and Operating Footprint
- 18.2.5 Production Capacity and Expansion Plans
- 18.2.6 Financial Performance and Investment
- 18.2.7 Market Share and Competitive Position
- 18.2.8 Technology and Innovation Capabilities
- 18.2.9 Strategic Alliances or Partnerships
- 18.2.10 Recent Developments
- 18.2.11 Growth Strategy and Outlook
- 18.3 KOSÉ Corporation
- 18.4 FANCL Corporation
- 18.5 Weleda
- 18.6 Mash Beauty Lab
- 18.7 SHIRO
- 18.8 I-ne
- 18.9 ETVOS
- 18.10 Aeon
- 18.11 Dr. Hauschka (WALA)
- 18.12 Other Relevant Market Participants
Note: Every listed company is profiled on the structure shown under the first company. The company list is preliminary and may change based on research findings, market developments, data availability and client requirements.
Chapter 19 Disclaimer
- 19.1 Research and Forecast Disclaimer
- 19.2 Data Source and Estimation Limitations
Note: The depth of individual sections depends on data availability for this market. Volume, capacity, trade and other unit-based metrics are included where applicable.