
Cash-pay drips move from storefronts to homes and hotels
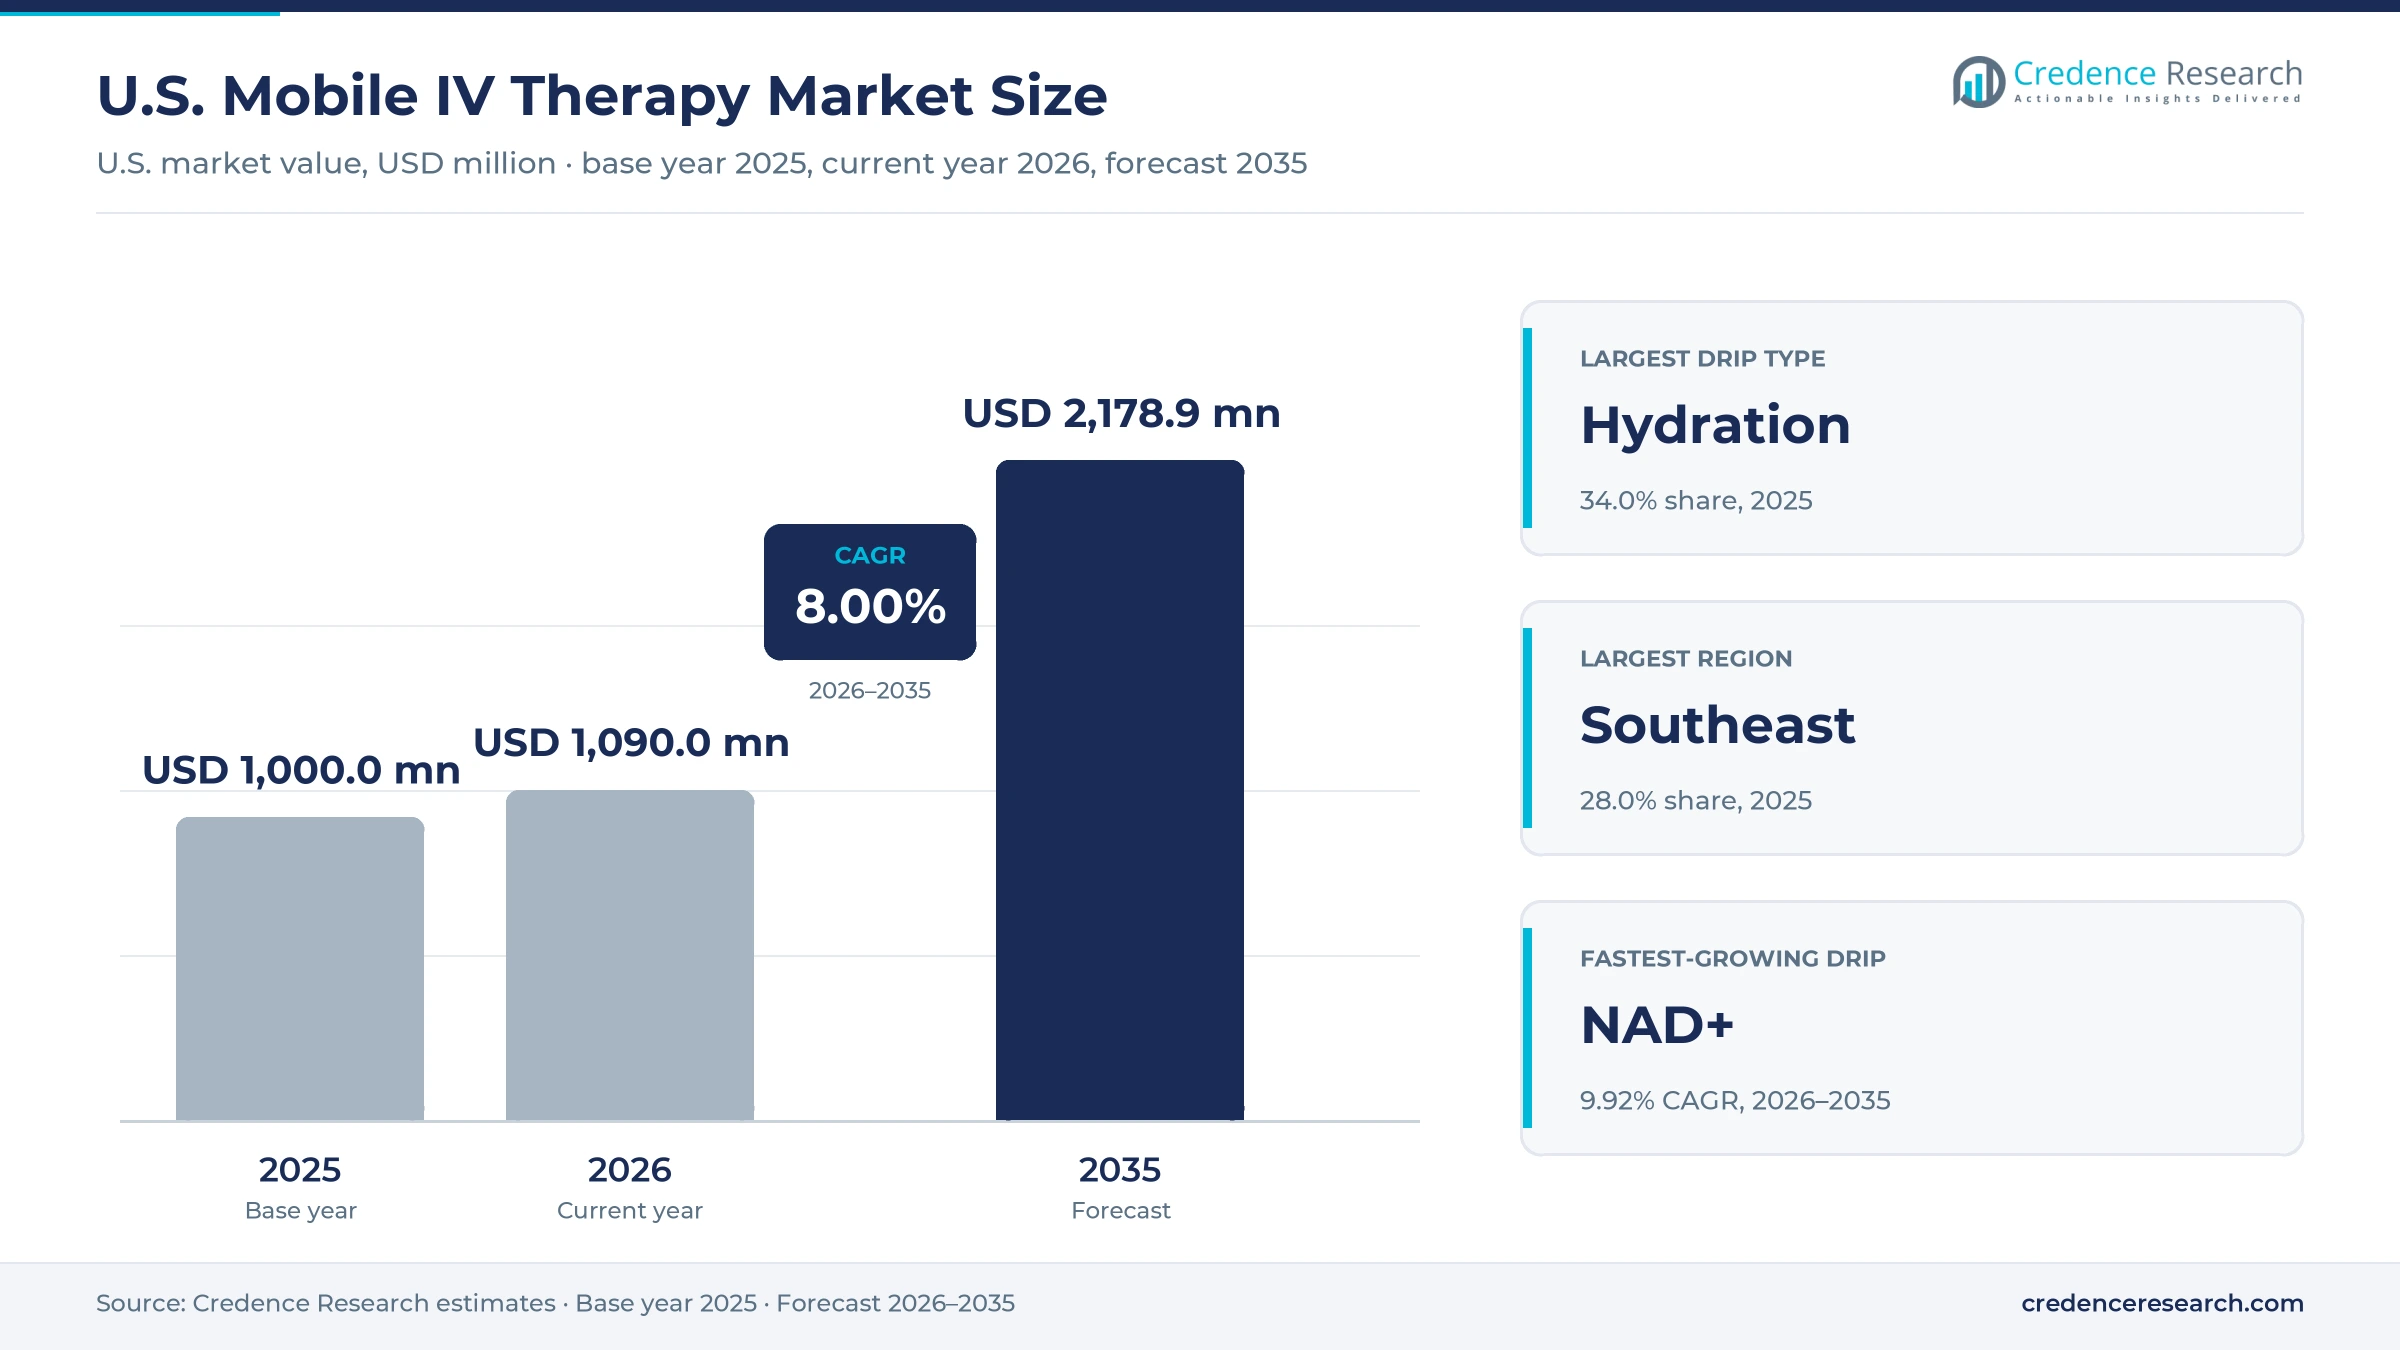
The U.S. mobile IV therapy market was valued at USD 1.00 billion in 2025 and is projected to increase from USD 1.09 billion in 2026 to USD 2.18 billion by 2035, registering a CAGR of 8.00% during 2026–2035. Demand comes from adults who pay cash for nurse-delivered hydration, vitamin, hangover and NAD+ drips at home, in hotel rooms, at events and in offices. The Southeast held the largest regional share, 28.0% in 2025, while the South Central region grows fastest at 8.48% a year as Texas defined elective IV therapy in state law from Sept. 1, 2025. Spending stays cash-based because a 2025 study in JAMA Internal Medicine found that none of the IV spas it called accepted health insurance. At the same time, state boards in California, Oregon, Mississippi and Wisconsin issued guidance between 2024 and 2025 that requires a prescriber order before each infusion. As a result, operators with medical oversight and pharmacy supply are gaining ground over informal providers.
What does nurse-delivered drip spending in the U.S. include?
The market counts consumer spending on intravenous drips that a registered nurse or other licensed clinician delivers at the customer location, including homes, hotel rooms, event venues and offices. Value covers the drip ingredients, the clinician visit, travel fees and the single-visit, package or membership charges that operators bill for each infusion.
The estimate excludes insurer-paid home infusion of antibiotics, chemotherapy or nutrition ordered for diagnosed disease, which follows a separate clinical and reimbursement path. It also excludes vitamin shots sold alone and oral supplements, while storefront drip lounges are counted only where they send nurses out for mobile and event visits.
U.S. Mobile IV Therapy Market Insights
- The market grows from USD 1.00 billion in 2025 to USD 2.18 billion by 2035, an 8.00% CAGR, as cash-pay drips spread from storefront lounges into homes, hotels and offices.
- The Southeast led with 28.0% of 2025 value, and the Census Bureau reported that the South grew 6.0% from 2020 to 2025.
- Hydration drips held 34.0% of 2025 value, while a JAMA Internal Medicine study put the median single IV spa treatment at $179.
- Texas signed HB 3749 on June 20, 2025, making it one of the first states to define elective IV therapy in law.
- Drip Hydration reports service in more than 100 cities and says a nurse can reach a home or office within two hours.
Hydration drips lead while NAD+ infusions grow fastest
Why do basic hydration drips still lead the menu?
Based on drip, the market is categorized into hydration, vitamin, NAD+ and hangover drips. Hydration led with 34.0% of 2025 value because saline-based bags are the entry product on most menus, and a JAMA Internal Medicine study published Oct. 6, 2025, found that 86.2% of IV spas it called recommended a specific drip for simple headache and cold symptoms. Vitamin blends follow, often sold as the Myers cocktail at $199 on the Hydrate IV Bar menu. NAD+ drips grow fastest at 9.92% a year as Drip Hydration lists its NAD+ IV Boost at $999, against $299 for its hangover drip.
Where do mobile nurses deliver most infusions?
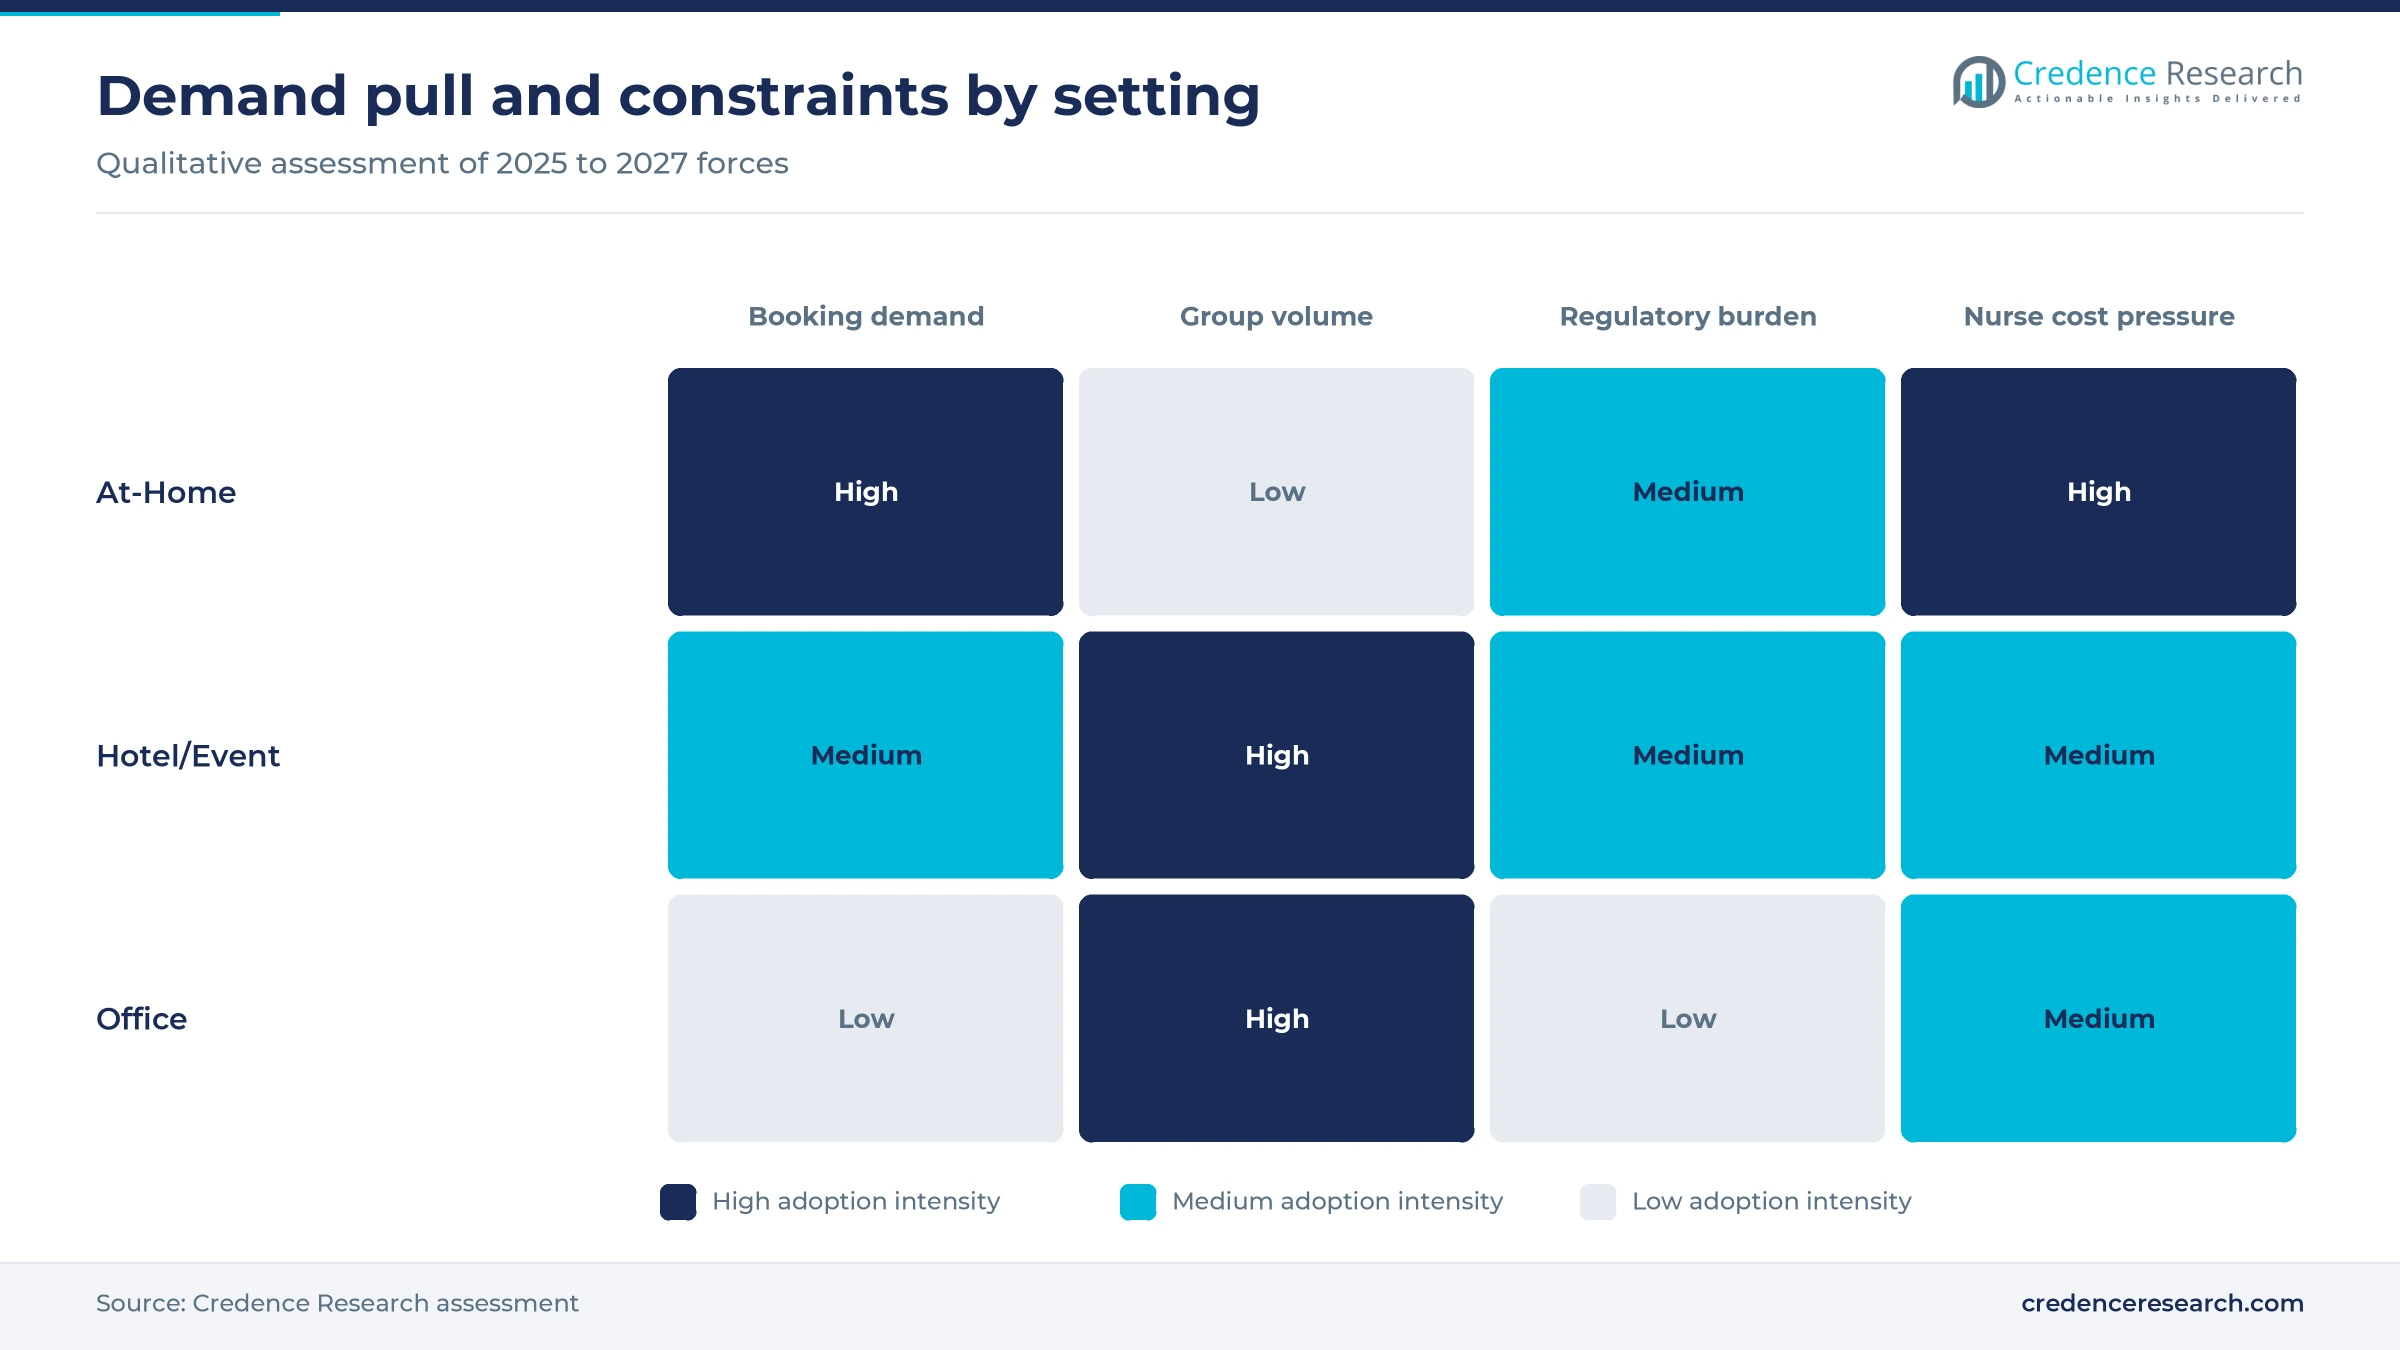
Based on setting, the market is categorized into at-home, hotel/event and office visits. At-Home visits led with 62.0% of 2025 value because the core promise is a nurse at the door, and Drip Hydration says it can send a nurse to a home within two hours across more than 100 cities. Office visits remain smaller and depend on employer wellness days. Hotel/Event visits grow fastest at 8.50% a year as hospitality brands add drips, with Niagen Bioscience bringing its Niagen IV to Equinox Hotel New York in July 2025, according to Athletech News.
How do single visits and memberships split cash spending?
Based on payer, the market is categorized into cash-pay single visit and cash-pay membership spending, because insurers do not pay for elective drips. Cash-Pay Single Visit spending led with 66.0% of 2025 value because most customers book after a late night or a trip, and the JAMA Internal Medicine study found that none of the IV spas it reached accepted insurance, while 35.3% took health savings or flexible spending accounts. Cash-Pay Membership spending grows fastest at 8.78% a year as Hydrate IV Bar sells a $139 monthly membership and reported 10,000 memberships to Franchise Times in July 2026.
| Segment Group | Leading Sub-segment | Share, 2025 | Fastest-growing Sub-segment | CAGR, 2026–2035 |
|---|---|---|---|---|
| By Drip | Hydration | 34.0% | NAD+ | 9.92% |
| By Setting | At-Home | 62.0% | Hotel/Event | 8.50% |
| By Payer | Cash-Pay Single Visit | 66.0% | Cash-Pay Membership | 8.78% |
Request a Free Sample
Fill in your details and we'll send you a free sample report.
- Sample data tables & charts
- Research methodology
Convenience, lean networks and group bookings lift demand
Convenience-led wellness buyers book home visits
Customers who value time over price are the core buyers, because a mobile visit removes travel and waiting at a lounge. Drip Hydration says it serves more than 100 cities, has treated more than 50,000 patients and can usually reach a home or office within two hours of booking. A JAMA Internal Medicine study published on Oct. 6, 2025, found a median storefront price of $179 per treatment, which sets the baseline that mobile operators price above. Intravene launched a $225 banana bag in Denver, Tampa and Dallas on March 19, 2026, showing that buyers accept a home-visit premium. In the Credence Research model this convenience driver adds about 3.12 percentage points to annual growth to 2035.
At-home networks avoid storefront overhead
Operators that send nurses out avoid most of the fixed cost of a storefront lounge, which lets new entrants reach a city with little capital. Hydrate IV Bar lists a franchise investment of $347,050 to $577,600 per lounge, according to Franchise Times in July 2026. Storefront chains still expand quickly, as Prime IV Hydration and Wellness entered 2026 with 208 open locations after adding 53 in 2025, according to Athletech News. A mobile operator instead carries a nurse, a kit and a vehicle, while the Bureau of Labor Statistics put median registered nurse pay at $97,550 in May 2025. In the Credence Research model this network driver adds about 2.24 percentage points to annual growth to 2035.
Event and group packages raise bookings per nurse
Group bookings let one nurse team treat many customers at a single address, which raises revenue per trip and lowers travel cost per drip. Drip Hydration offers on-site nurses for corporate events, weddings and VIP events, and it advises customers to book early for group slots. Las Vegas alone drew about 38.5 million visitors and about 1.0 million tradeshow attendees in 2025, according to LVCVA figures reported by News 3 on Jan. 29, 2026. Hotel occupancy there held at 80.3%, which keeps a steady base of room-service drip demand. In the Credence Research model this group driver adds about 1.36 percentage points to annual growth to 2035, and Hotel/Event visits grow at 8.50% a year.
NAD+ and longevity drips raise ticket values
NAD+ infusions carry much higher prices than basic hydration, so their spread lifts average spending per visit even when visit counts grow slowly. Drip Hydration prices its NAD+ IV Boost at $999 across several sessions, more than three times its $299 hangover drip. Hydration Room launched an NAD+ IV membership with three tiers on June 9, 2025, when it opened its Porter Ranch clinic in California. Niagen Bioscience also began selling at-home NAD+ precursor injection kits through telehealth on May 4, 2026, according to Athletech News, which widens consumer interest in the category. As a result, NAD+ drips grow at 9.92% a year, the fastest rate in the drip group.
Memberships and state IV rules reshape the channel
Shift from single bookings to monthly memberships
Operators are moving customers from one-off bookings to monthly plans, which smooths nurse schedules and raises lifetime value per customer. Hydrate IV Bar charges $139 a month for a membership usable at all of its locations, or $109 for students, and reported 10,000 memberships to Franchise Times in July 2026. Prime IV Hydration and Wellness sells three membership tiers, named Select, Essentials and Transformation, according to Athletech News in February 2026. Hydration Room added an NAD+ IV membership with shareable treatment credits on June 9, 2025. Consequently, Cash-Pay Membership spending grows at 8.78% a year in the Credence Research model, faster than single-visit spending.
Rise of state rules that define elective IV therapy
States are moving from informal guidance to written rules on who may order and give elective drips, which raises compliance costs but also clarifies the business model. A JAMA Internal Medicine study found that 32 states had issued IV spa guidance by June 2024, although none had passed a law aimed at these businesses. Texas then signed HB 3749 on June 20, 2025, according to the American Med Spa Association, and the law took effect on Sept. 1, 2025. The Wisconsin Department of Safety and Professional Services issued its first formal guidance on Oct. 22, 2025, according to Michael Best. Each rule ties a nurse visit to a prescriber order.
Opening in hotel and hospitality drip partnerships
Hotels, resorts and event venues offer an opening because guests already pay premium prices for recovery and wellness services during short stays. Niagen Bioscience introduced its Niagen IV at Equinox Hotel New York in July 2025, which Athletech News described as its first move into luxury hospitality. Drip Hydration already staffs weddings, corporate events and VIP gatherings with registered nurses who bring all supplies. Las Vegas hotels ran at 80.3% occupancy in 2025 despite a 7.5% fall in visitors, according to LVCVA data reported by News 3. Operators that sign venue agreements can fill nurse schedules on weekends, when demand from hangover cure products buyers also peaks.
Opening in workplace wellness days and office visits
Employers offer a second opening because one office visit can serve a whole team during a single nurse booking. Drip Hydration markets on-site corporate event service and says a nurse can reach an office within two hours in its coverage areas. The JAMA Internal Medicine study found that 35.3% of IV spas accepted health savings or flexible spending accounts, which gives employees a pre-tax way to pay. Employers that already fund corporate wellness programs can add drip days to existing benefit calendars. Because the BLS counted 3,465,400 registered nurse jobs in 2025, operators can recruit part-time nurses for weekday office slots that fall outside hospital shifts.
Compounding limits, nurse costs and fluid supply weigh
How do compounding rules limit bedside mixing?
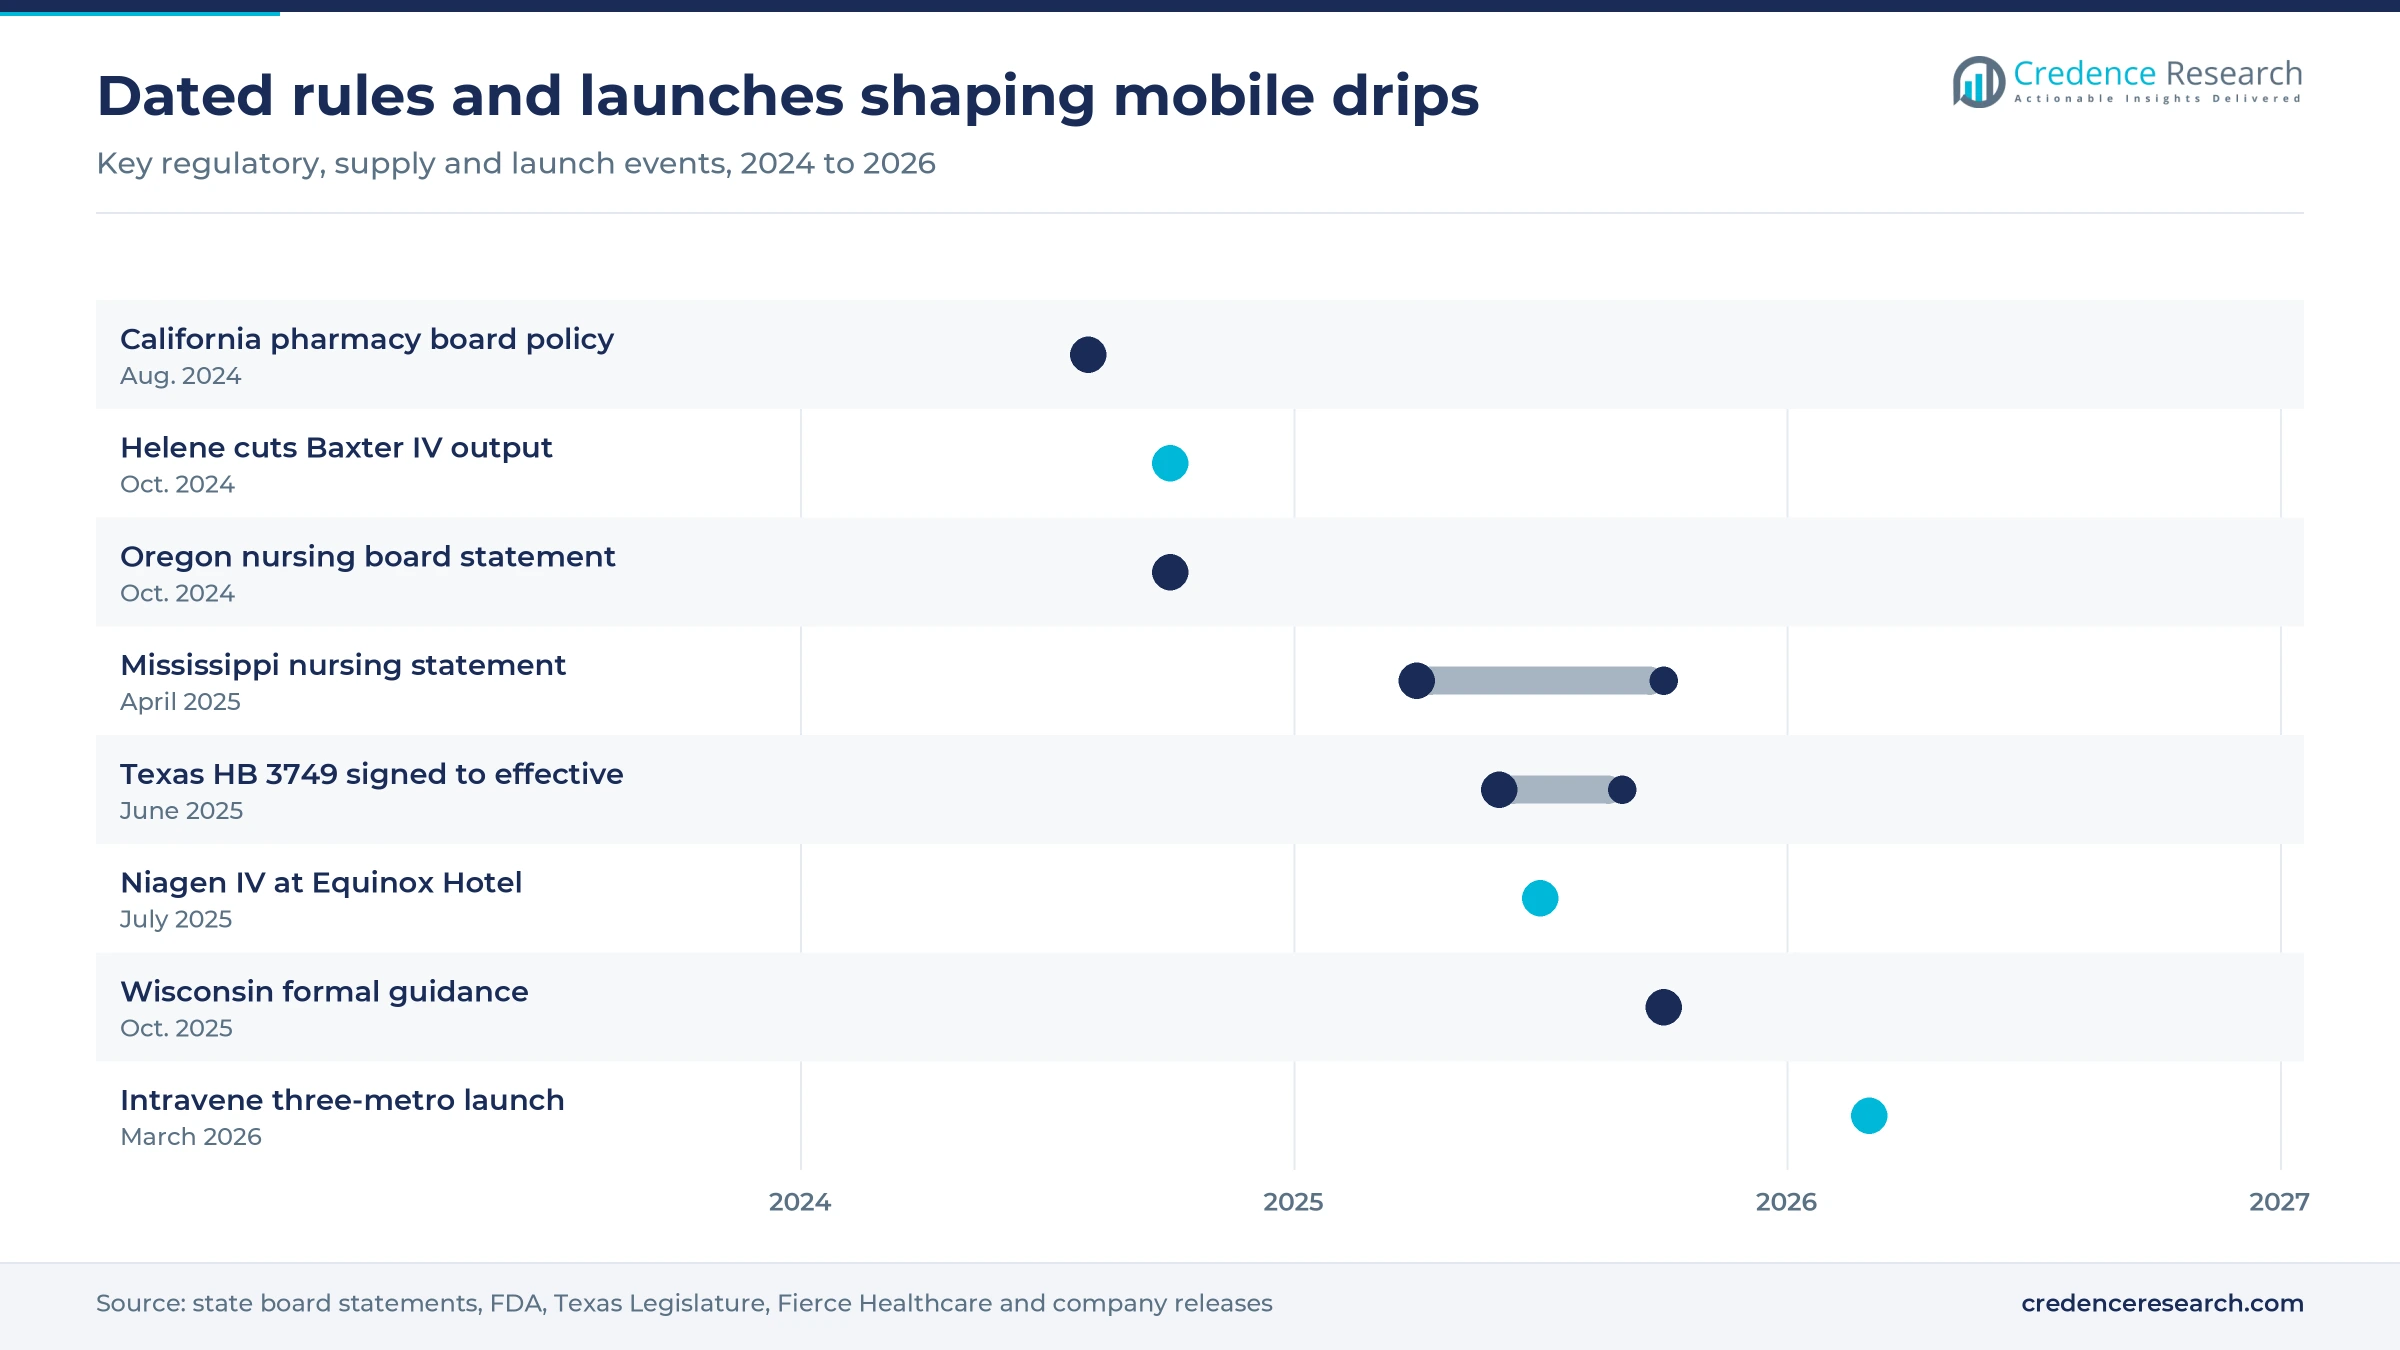
Mixing vitamins and additives into a bag at the bedside can count as sterile compounding, which nurses cannot lawfully do in several states. The FDA warned on Oct. 25, 2021 that some mobile IV infusion services compound drugs that may not meet federal or state rules. The California State Board of Pharmacy adopted a policy on Aug. 1, 2024, treating these mixtures as sterile compounding. Operators must therefore buy patient-specific bags from licensed pharmacies, which adds cost and lead time.
Do safety reports and weak screening raise scrutiny?
Reported harms keep regulators focused on screening before each infusion. The FDA described a February 2021 case in which a 50-year-old woman developed suspected septic shock after an IV vitamin infusion at home that a California clinic had compounded. The JAMA Internal Medicine secret-shopper study found that only 27.6% of IV spas said a licensed clinician consultation was required, and only 24.4% described any risks. Operators without medical directors face complaints, board inquiries and higher insurance costs.
Will nurse pay and staffing squeeze visit margins?
Registered nurse labor is the largest variable cost of a home visit, and hospitals compete for the same staff. The BLS reported median registered nurse pay of $97,550 in May 2025 and expects about 180,800 openings a year over the next decade. The Mississippi Board of Nursing also rejected standing orders in its April 11, 2025, position statement, so each visit needs an individualized prescriber order. Small operators therefore pay more per visit for both nursing and medical oversight.
How exposed are operators to IV fluid shortages?
Mobile operators depend on the same saline bags that hospitals use, so supply shocks reach them quickly. Hurricane Helene shut Baxter's North Cove plant in North Carolina in the fall of 2024, a site that makes about 60% of U.S. IV solutions, according to Fierce Healthcare. Baxter then limited orders, with shipments expected near 40% of normal. Physicians also questioned whether infusion businesses were diverting fluids from acute care, according to the JAMA Internal Medicine study, which adds reputational risk.
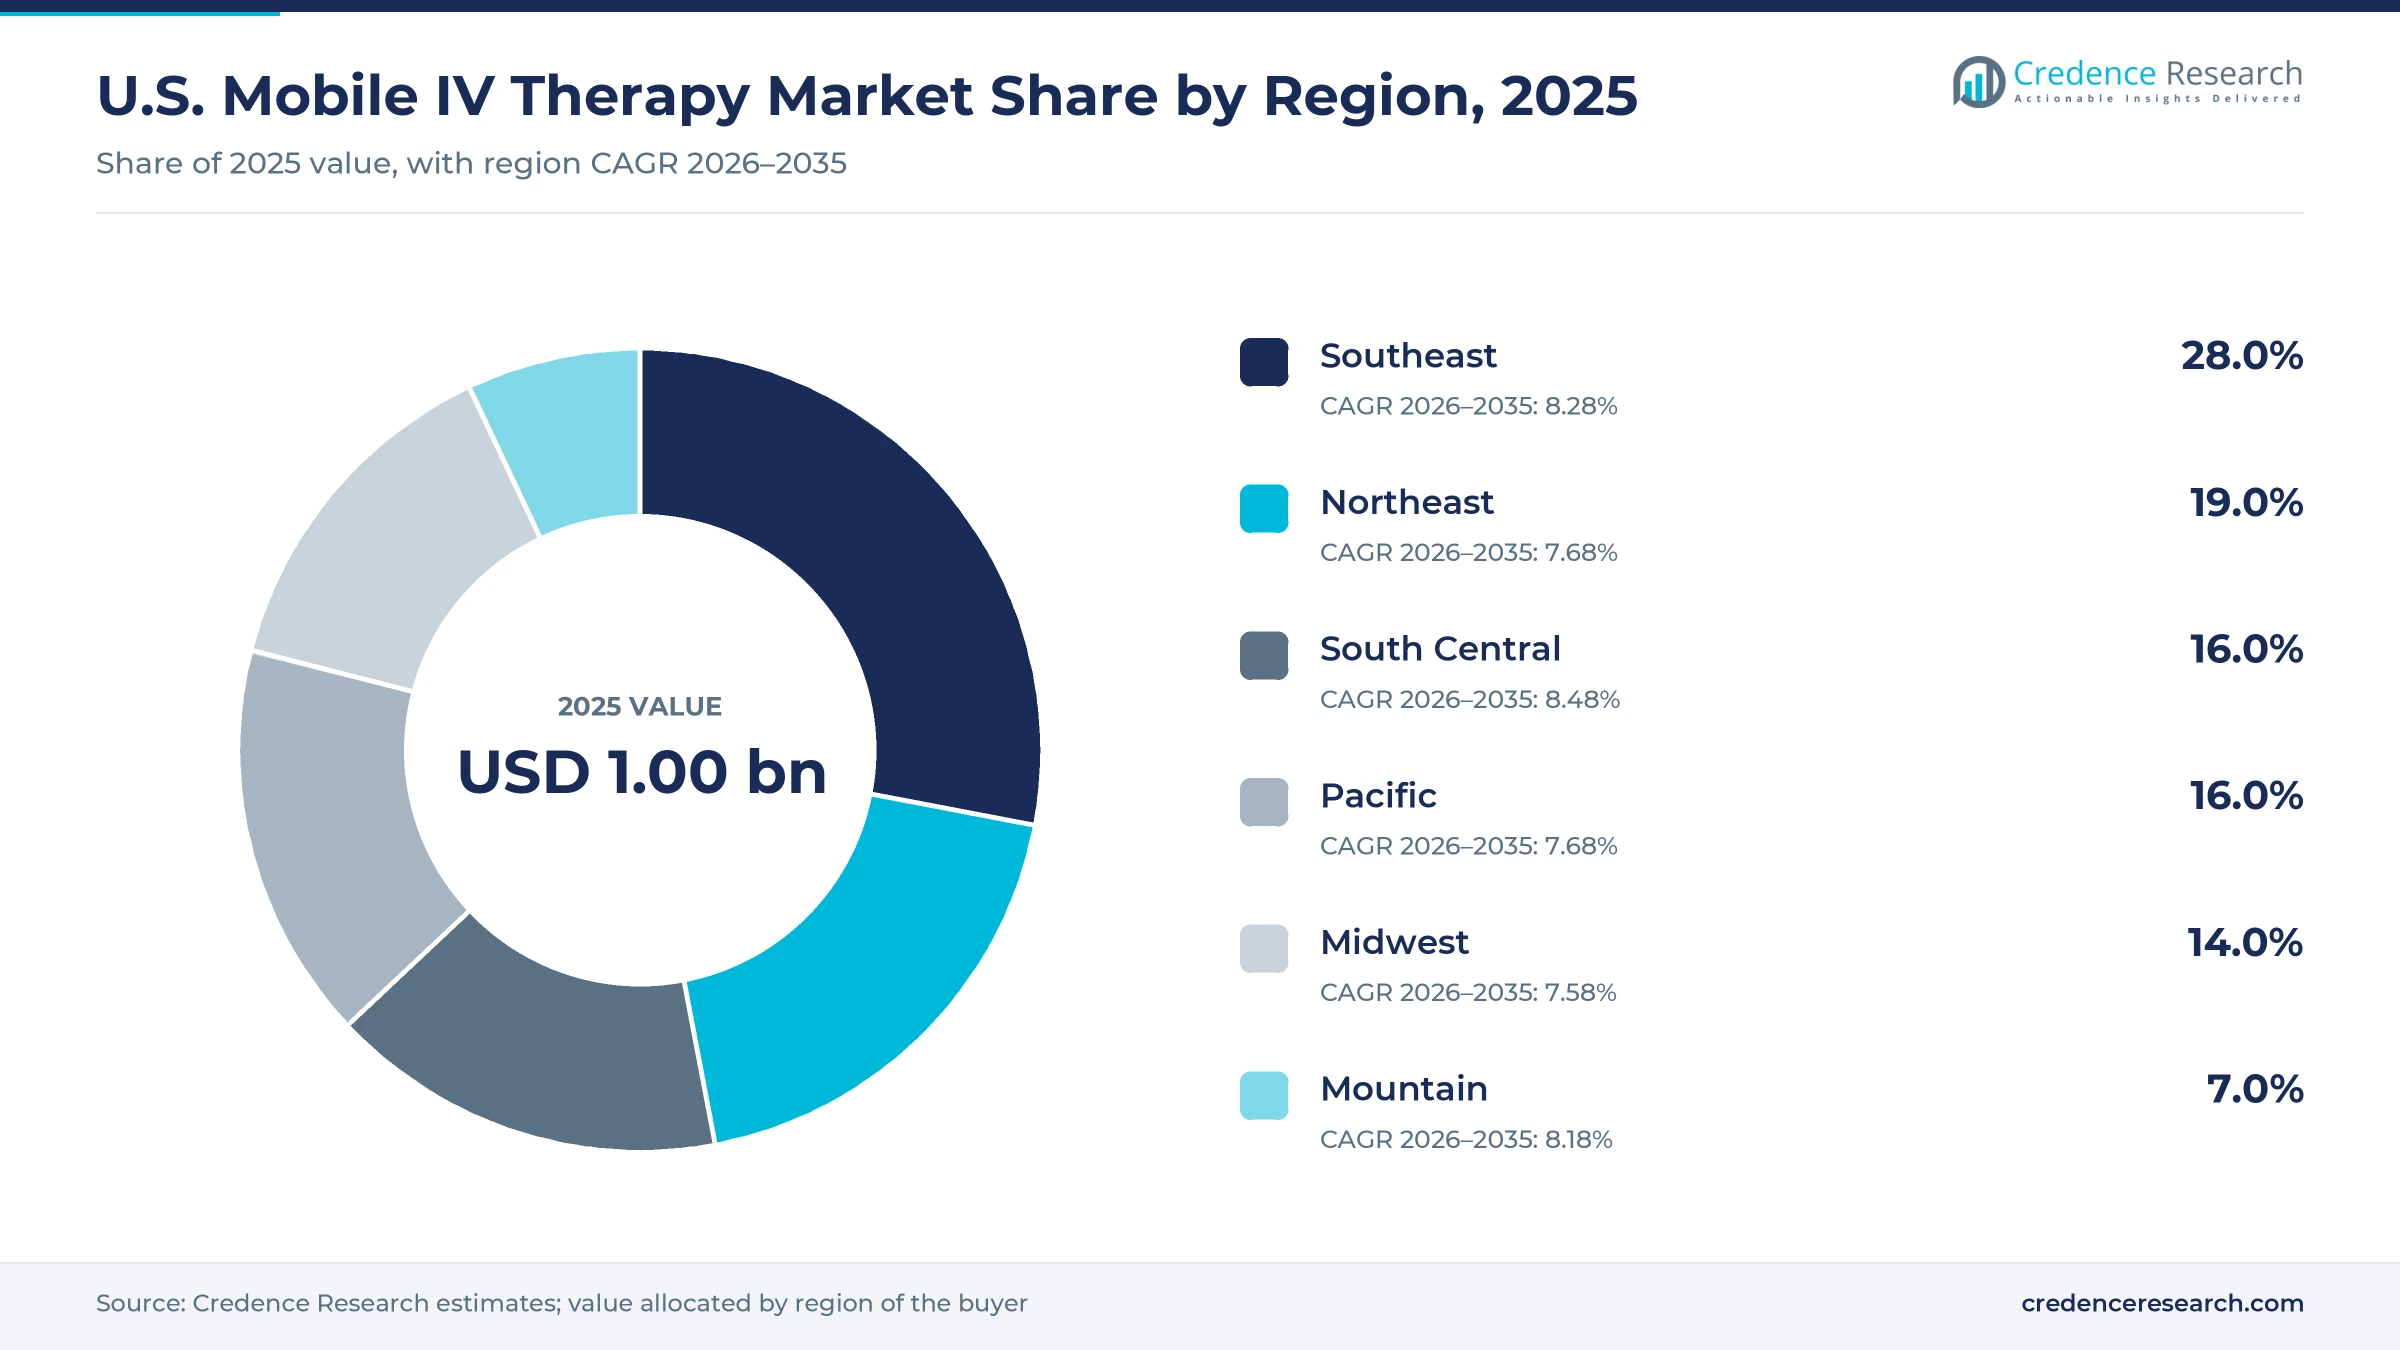
The Southeast holds the largest share of mobile drip spend
| Region | Value, 2025 (USD billion) | Share, 2025 | CAGR, 2026–2035 |
|---|---|---|---|
| Southeast | 0.28 | 28.0% | 8.28% |
| Northeast | 0.19 | 19.0% | 7.68% |
| South Central | 0.16 | 16.0% | 8.48% |
| Pacific | 0.16 | 16.0% | 7.68% |
| Midwest | 0.14 | 14.0% | 7.58% |
| Mountain | 0.07 | 7.0% | 8.18% |
The Southeast leads on population growth and resort demand
The Southeast held 28.0% of 2025 value and grows at 8.28% a year, the largest regional share in the market. The Census Bureau reported in June 2026 that the South grew 6.0% from 2020 to 2025, nearly double the national rate. Intravene chose Tampa as one of three cities for its $225 banana bag launch in March 2026. Mississippi also set nurse rules in a position statement adopted April 11, 2025, and updated on Oct. 10, 2025.
The Northeast pairs dense cities with hotel wellness demand
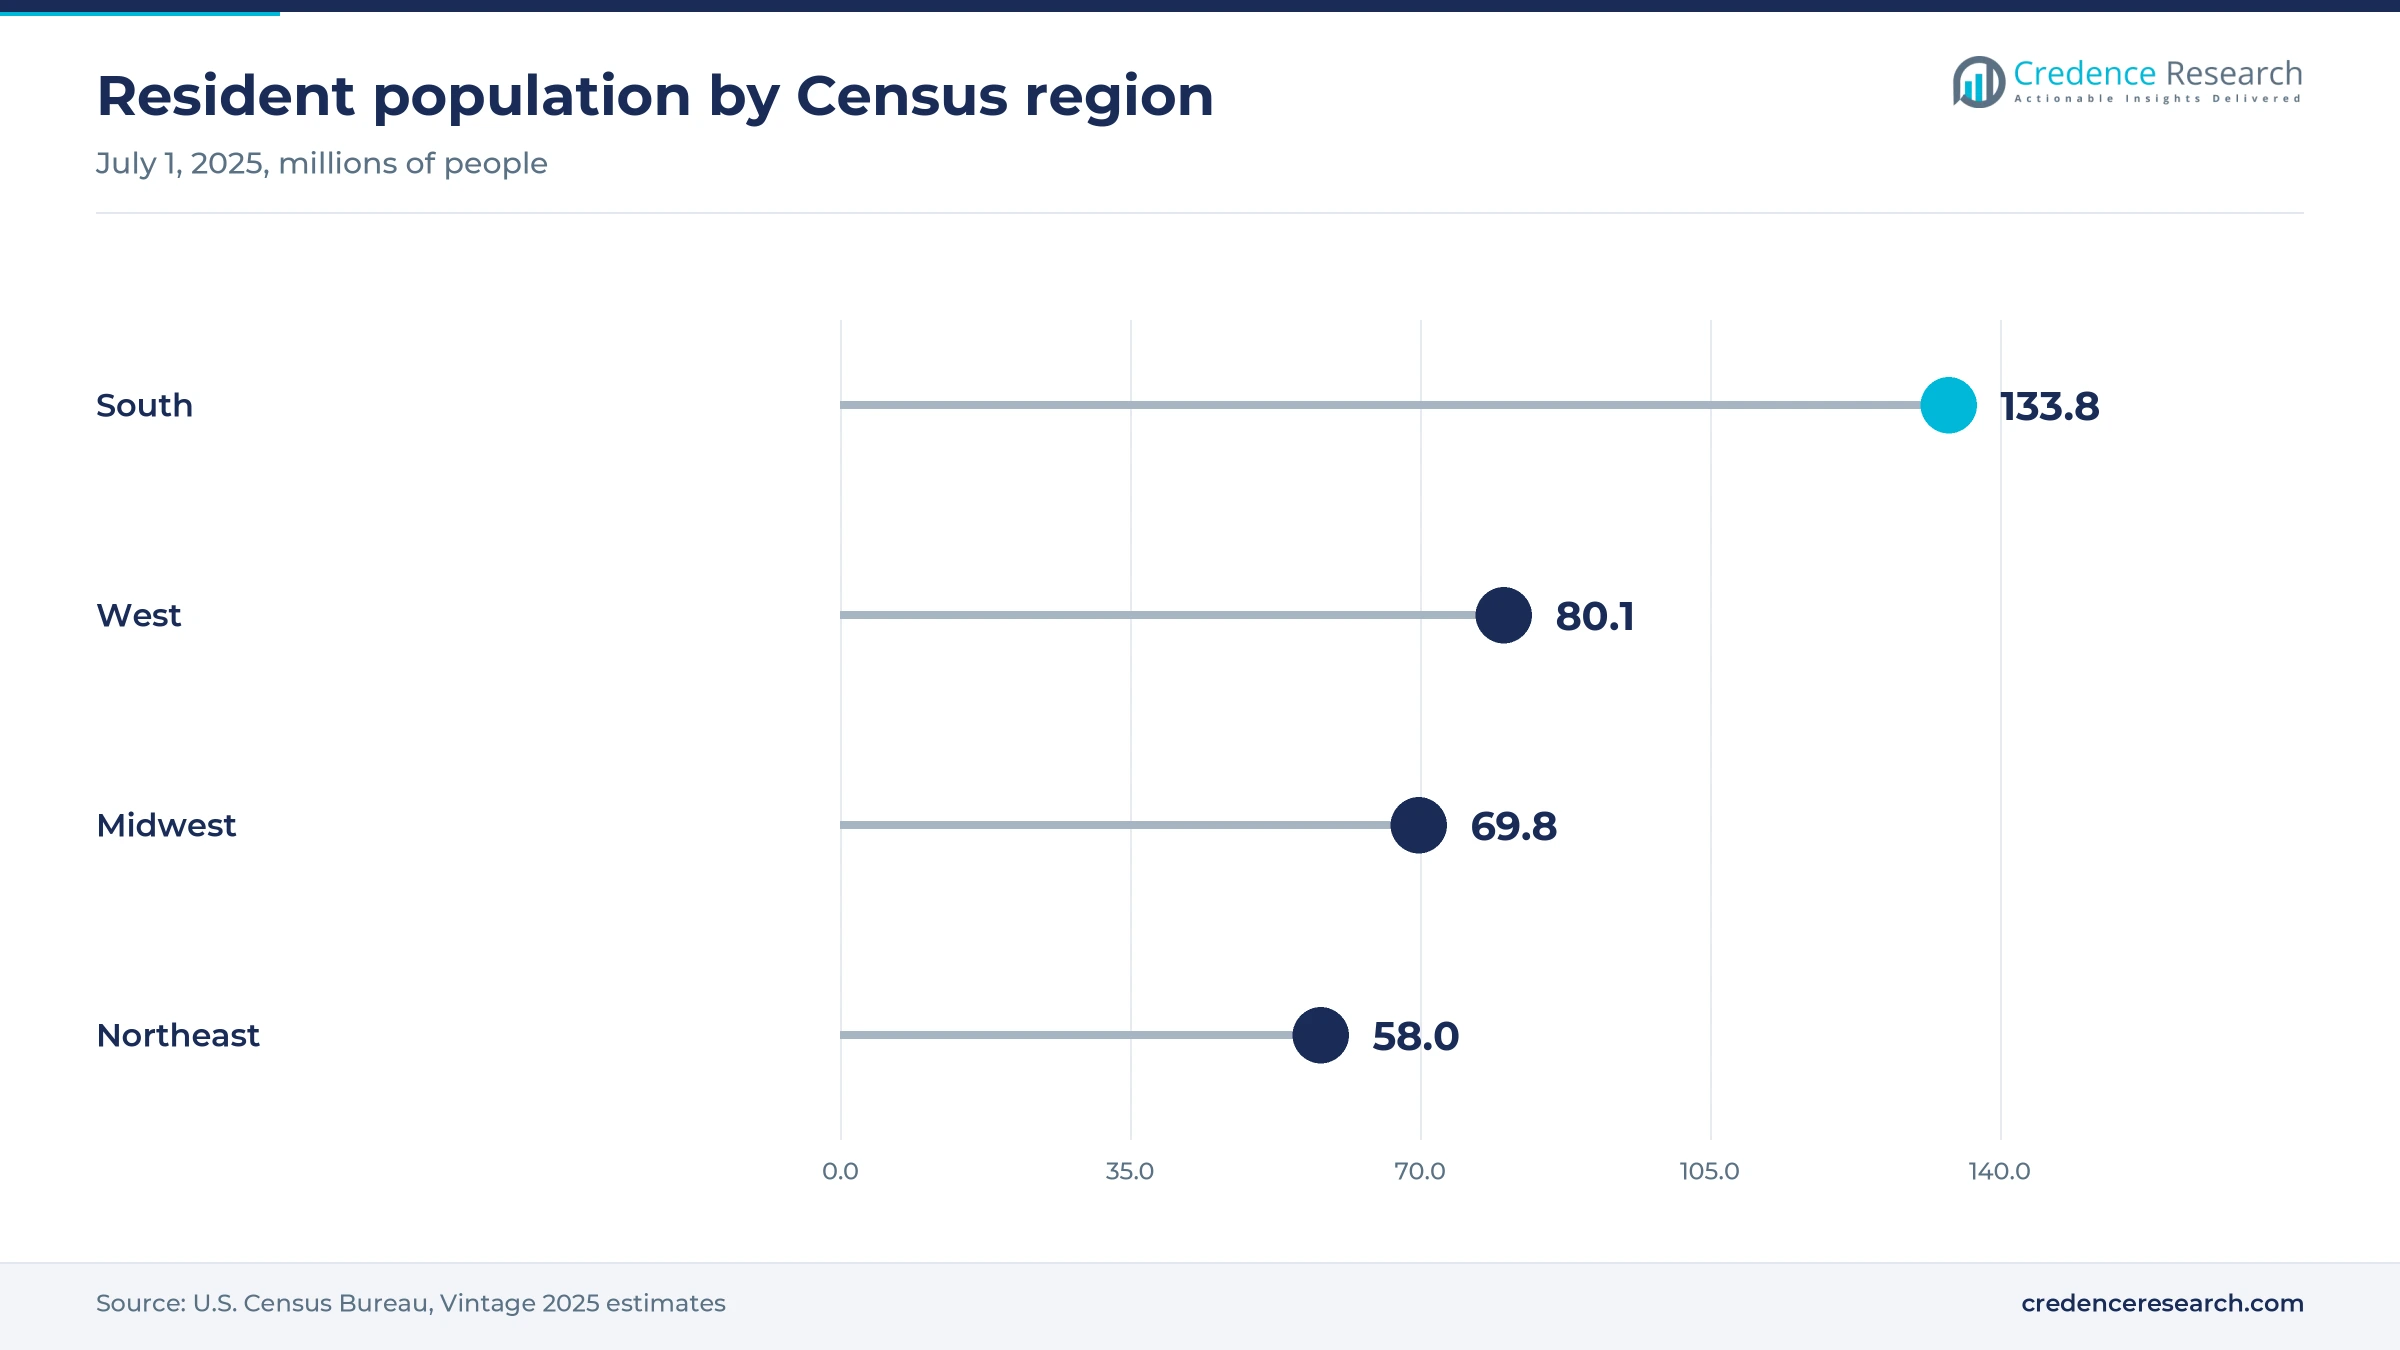
The Northeast held 19.0% of 2025 value and grows at 7.68% a year, below the national pace. The Census Bureau counted 58.0 million Northeast residents in July 2025, up only 0.7% since 2020, which limits growth in new customers. Dense hotel markets still support premium visits, as Niagen IV launched at Equinox Hotel New York in July 2025. Prime IV Hydration and Wellness also entered Connecticut during 2025, adding storefront competition for mobile operators.
South Central grows fastest under the new Texas law
The South Central region held 16.0% of 2025 value and grows at 8.48% a year, the fastest pace among the six zones. Texas HB 3749 took effect on Sept. 1, 2025, and lets physicians delegate IV administration to registered nurses under adequate supervision. Nurse.org reported that the law followed the death of a patient after an IV treatment at a San Antonio med spa. Intravene also added Dallas to its March 2026 launch, which shows operators building in the state.
The Pacific region carries strict mixing and ordering rules
The Pacific region held 16.0% of 2025 value and grows at 7.68% a year, slightly below the national rate. California requires a prescriber examination before clinic IV hydration under a Board of Pharmacy policy approved on Aug. 1, 2024. The Oregon State Board of Nursing ruled on Oct. 16, 2024, that customers cannot self-prescribe a drip from a menu. Hydration Room still began adding six Bay Area clinics in July 2025, according to Athletech News, which intensifies storefront competition.
The Midwest tightens oversight from a smaller base
The Midwest held 14.0% of 2025 value and grows at 7.58% a year, the slowest pace among the six zones. The Census Bureau counted 69.8 million Midwest residents in July 2025, up 1.1% since 2020. Wisconsin regulators issued formal guidance on Oct. 22, 2025, stating that registered nurses cannot own an IV hydration business or choose the drip themselves, according to the National Law Review. Prime IV Hydration and Wellness entered Nebraska in 2025, showing that chains still see demand there.
Las Vegas visitors and Denver operators anchor the Mountain region
The Mountain region held 7.0% of 2025 value and grows at 8.18% a year, slightly above the national pace. Las Vegas drew about 38.5 million visitors in 2025, down 7.5% from 41.7 million in 2024, according to LVCVA data reported by News 3. That fall trims hotel drip demand in the near term, although convention demand held steady with about 1.0 million tradeshow attendees. Denver hosts the Hydrate IV Bar headquarters, and Intravene included Denver in its March 2026 launch.
State rules and new launches mark 2024 to 2026
| Development | Status and market relevance |
|---|---|
| In August 2024, the California State Board of Pharmacy approved a policy that requires a prescriber exam and order before clinic IV hydration. | In effect; treats bag mixing as sterile compounding |
| In October 2024, the Oregon State Board of Nursing adopted an interpretive statement that bars customers from self-prescribing drips from a menu. | In effect; ties each nurse visit to a prescriber order |
| In June 2025, Texas Gov. Greg Abbott signed HB 3749, which defines elective IV therapy and took effect on Sept. 1, 2025. | In effect; sets delegation rules for nurse-given drips |
| In July 2025, Niagen Bioscience introduced Niagen IV at Equinox Hotel New York, its first luxury hospitality placement. | Launched; expands hotel-based NAD+ drips |
| In March 2026, Intravene launched a $225 banana bag drip for home visits in Denver, Tampa and Dallas. | Launched; adds a mid-priced mobile vitamin drip in three metros |
Dispatch tools and pharmacy-mixed bags change delivery
- On-demand dispatch platforms match bookings to nearby nurses, and Drip Hydration says they let a nurse reach most addresses within two hours.
- Patient-specific pharmacy bags let operators avoid bedside mixing, which California and Oregon regulators treat under sterile compounding standards such as USP 797.
- Remote prescriber screening connects a physician, physician assistant or nurse practitioner to each customer before the nurse arrives, as Texas HB 3749 allows.
- At-home NAD+ injection kits extend the category beyond drips, as Niagen Bioscience began selling them through telehealth in May 2026.
Need a Custom Version of This Report?
Tailor the scope, geography, or segments to your exact requirements.
- Custom geography or segment scope
- Direct access to our analyst team
Mobile networks compete with clinic franchise chains
Competition in mobile drips pits regional nurse networks against storefront franchise chains that add outcall service. Drip Hydration is the largest mobile-first network, with service in more than 100 cities and on-site event teams. Intravene competes on mid-priced menus, launching a $225 banana bag in three metros in March 2026. Storefront chains compete on brand and memberships, as Prime IV Hydration and Wellness had 208 open locations entering 2026 and Restore Hyper Wellness operates more than 220 studios with a nurse practitioner in each. Hydrate IV Bar runs 30 lounges in eight states from Denver, while Hydration Room focuses on California. Buyers also compare drips with concierge medicine memberships that include home visits. As state rules tighten, medical oversight and pharmacy supply are becoming the main points of difference.
How do the leading drip providers position their service?
| Company | Type | Role in the market |
|---|---|---|
| Drip Hydration | Mobile network | Serves more than 100 cities with nurse visits to homes, offices and events |
| Prime IV Hydration & Wellness | Clinic franchise | Entered 2026 with 208 open locations after adding 53 in 2025 |
| Restore Hyper Wellness | Studio chain | Runs more than 220 studios with a nurse practitioner in each |
| Hydrate IV Bar | Clinic franchise | Operates 30 lounges in eight states and sells a $139 monthly membership |
| Intravene | Mobile provider | Launched a $225 banana bag in Denver, Tampa and Dallas in March 2026 |
| Hydration Room | California clinic chain | Launched an NAD+ IV membership in June 2025 and added Bay Area clinics |
Compliance and nurse capacity decide which operators scale
Credence Research's view is that compliance and nurse capacity, rather than menu breadth, will decide which mobile drip operators scale. State boards in California, Oregon, Mississippi and Wisconsin now expect a prescriber order for each customer, and Texas has written elective IV therapy into law. Operators that buy patient-specific bags, document screening and keep a medical director on call can expand into hotels, events and offices. Informal providers that mix drips at the bedside face the highest risk. Memberships and NAD+ menus should lift spending per customer, while nurse pay limits margins.
How mobile drip spending was modeled and checked
The report uses 2025 as the base year and 2035 as the forecast year, with market values taken from the Credence Research model. Drip, setting, payer and regional splits are Credence Research estimates informed by public data and are not reported statistics. Sources for the mobile drip estimate include FDA notices, state nursing and pharmacy board statements, a peer-reviewed secret-shopper study, Census and BLS data, operator websites and trade press. No interviews or surveys were conducted for this edition, so segment shares should be read as modeled ranges.
Event, membership and NAD+ demand carry growth to 2035
From USD 1.09 billion in 2026, the market is expected to reach USD 2.18 billion by 2035 as home, hotel and office visits replace part of storefront drip spending. Memberships should spread across mobile operators, which smooths nurse schedules and lifts value per customer. NAD+ drips gain share fastest, although prices and medical screening rules will shape how widely they sell. More states are likely to follow Texas and Wisconsin with written rules, which favors operators with medical directors and pharmacy supply. Nurse pay and saline supply remain the main limits on margins through 2035.
Frequently Asked Questions
How big is the U.S. mobile IV therapy market?
Which drip type holds the largest share?
Does insurance pay for mobile IV drips?
Which region leads and which grows fastest?
What does Texas HB 3749 require?
Can nurses mix drips at the bedside?
How much does a mobile drip cost?
Who are the leading companies?
Table of Content
Chapter 1 Market Segmentation
- 1.1 Segmentation Framework
- 1.1.1 Product and Service Classification
- 1.1.2 Application and End-Use Classification
- 1.1.3 Technology and Solution Classification
- 1.1.4 Customer and Distribution Channel Classification
- 1.1.5 Geographic Segmentation
- 1.1.6 Market Segment Definitions and Boundaries
- 1.2 By Drip
- 1.2.1 Hydration
- 1.2.2 Vitamin
- 1.2.3 Hangover
- 1.2.4 NAD+
- 1.3 By Setting
- 1.3.1 At-Home
- 1.3.2 Hotel/Event
- 1.3.3 Office
- 1.4 By Payer
- 1.4.1 Cash-Pay Single Visit
- 1.4.2 Cash-Pay Membership
Chapter 2 Introduction
- 2.1 Report Objectives and Scope
- 2.2 Product Definition and Industry Terminology
- 2.3 Market Inclusions and Exclusions
- 2.4 Research Process
- 2.4.1 Primary Research and Expert Interviews
- 2.4.2 Secondary Research and Source Review
- 2.4.3 Top-Down and Bottom-Up Estimation
- 2.4.4 Data Triangulation and Verification
- 2.5 Market Size Measurement Basis
- 2.5.1 2025: USD 1.00 billion → 2035: USD 2.18 billion
- 2.6 Historical and Forecast Reference Periods
- 2.6.1 Historical Period: 2018-2025
- 2.6.2 Base Year: 2025
- 2.6.3 Forecast Period: 2025-2035
- 2.7 Research Assumptions and Limitations
Chapter 3 Executive Summary
- 3.1 Market Snapshot and Key Findings
- 3.2 Base-Year Market Size, 2025
- 3.3 Forecast Market Size, 2035
- 3.4 Revenue and Volume Growth Outlook
- 3.5 Key Demand and Supply Indicators
- 3.6 Leading Market Segments
- 3.7 Fastest-Growing Market Opportunities
- 3.8 Regional Performance Highlights
- 3.9 Technology and Industry Transformation
- 3.10 Competitive Landscape Summary
- 3.11 Analyst View and Strategic Implications
Chapter 4 U.S. Mobile IV Therapy Market Trends and Developments
- 4.1 Historical Industry Development, 2018-2025
- 4.2 Recent Market Trends and Developments
- 4.3 Demand and Customer Behavior Trends
- 4.4 Technology and Product Innovation
- 4.5 Artificial Intelligence, Automation and Digitalization
- 4.6 Local Manufacturing and Supply Chain Realignment
- 4.7 Industry Partnerships, Mergers and Acquisitions
- 4.8 Sustainability and Circular Economy Developments
- 4.9 Government and Private Sector Investment Trends
- 4.10 Emerging Business Models and Commercialization
- 4.11 Industry Developments and Announcements
Chapter 5 U.S. Mobile IV Therapy Market Production, Supply and Demand Analysis
- 5.1 Demand Trend and Consumption Analysis, 2018-2025
- 5.2 Demand Forecast, 2025-2035
- 5.3 Production and Output Trend, 2018-2025
- 5.4 Production and Output Forecast, 2025-2035
- 5.5 Installed Capacity and Capacity Utilization
- 5.6 Company-Wise Production Plants and Statistics
- 5.6.1 Installed Production Capacity
- 5.6.2 Actual Production
- 5.6.3 Planned Capacity and Expansion Targets
- 5.7 Supply Chain Structure and Procurement Trends
- 5.8 Supply-Demand Gap and Bottlenecks
- 5.9 Import Dependence and Sourcing Structure
- 5.10 Contract Manufacturing and Outsourcing
- 5.11 Regional Supply and Demand Concentration
Chapter 6 U.S. Mobile IV Therapy Market Pricing Analysis
- 6.1 Pricing Structure and Measurement
- 6.2 Historical Pricing Trends, 2018-2025
- 6.3 Pricing Outlook, 2025-2035
- 6.4 Average Selling Price and Unit Economics
- 6.5 Pricing by Product and Market Segment
- 6.6 Geographic Pricing Differences
- 6.7 Key Input, Energy, Labor and Logistics Costs
- 6.8 Contract Pricing and Purchasing Models
- 6.9 Pricing Sensitivity and Competitive Positioning
- 6.10 Price, Margin and Profitability Implications
Chapter 7 U.S. Mobile IV Therapy Market Dynamics
- 7.1 Market Growth Drivers
- 7.1.1 Demand-Side Drivers
- 7.1.2 Technology and Innovation Drivers
- 7.1.3 Infrastructure and Investment Drivers
- 7.1.4 Regulatory and Policy Drivers
- 7.2 Market Restraints
- 7.2.1 Cost and Affordability Constraints
- 7.2.2 Technology and Adoption Barriers
- 7.2.3 Supply Chain and Operational Constraints
- 7.3 Market Challenges
- 7.3.1 Competitive Pressure and Margin Erosion
- 7.3.2 Skills, Infrastructure and Implementation Gaps
- 7.4 Emerging Market Opportunities
- 7.5 Market Dynamics Impact and Time-Horizon Assessment
Chapter 8 U.S. Mobile IV Therapy Value Chain Analysis
- 8.1 Industry Value Chain Overview
- 8.2 Upstream Suppliers and Critical Inputs
- 8.3 Technology and Component Providers
- 8.4 Manufacturing or Service Delivery
- 8.5 Distribution, Channel Partners and Integrators
- 8.6 Downstream Applications and End Users
- 8.7 Value Addition and Profit Pools
- 8.8 Vertical Integration and Outsourcing
- 8.9 Supplier Concentration and Risk
- 8.10 Supply Chain Localization and Resilience
Chapter 9 U.S. Mobile IV Therapy Market Regulations and Policies
- 9.1 Relevant Laws, Standards and Compliance Frameworks
- 9.2 Product, Service, Safety and Quality Requirements
- 9.3 Government Policies, Incentives and Subsidies
- 9.4 Imports, Exports and Trade Barriers
- 9.5 Public Procurement and Local Content Requirements
- 9.6 Environmental and Sustainability Compliance
- 9.7 Upcoming Policy Changes and Market Implications
Chapter 10 U.S. Mobile IV Therapy Market Hotspots and Opportunities
- 10.1 Market Opportunity Mapping and Growth Hotspots
- 10.2 High-Growth Applications and Customer Groups
- 10.3 Underserved Markets and White-Space Opportunities
- 10.4 Emerging Technology and Product Opportunities
- 10.5 New Capacity and Investment Hotspots
- 10.6 Market Entry and Expansion Opportunities
- 10.7 Distribution and Partnership Opportunities
- 10.8 Near-Term and Long-Term Commercial Potential
- 10.9 Opportunity Attractiveness and Execution Risks
Chapter 11 U.S. Mobile IV Therapy Market Outlook, 2025-2035
- 11.1 Market Size and Analysis
- 11.1.1 Revenue (Market Measurement: 2025: USD 1.00 billion → 2035: USD 2.18 billion)
- 11.1.2 Market Volume and Quantity Sold
- 11.1.3 Historical Market Size, 2018-2025
- 11.1.4 Base-Year Market Size, 2025
- 11.2 Market Forecast, 2025-2035
- 11.2.1 Revenue Forecast to 2035
- 11.2.2 Volume Forecast to 2035
- 11.2.3 CAGR and Year-on-Year Growth
- 11.2.4 Incremental Revenue Opportunity
- 11.3 Forecast Assumptions and Scenario Analysis
- 11.3.1 Base-Case Forecast
- 11.3.2 Optimistic and Conservative Scenarios
- 11.3.3 Technology, Pricing and Policy Sensitivities
- 11.4 Market Attractiveness and Growth Outlook
Chapter 12 U.S. Mobile IV Therapy Market Segmentation and Outlook
- 12.1 Segmentation Summary and Market Shares, 2025
- 12.2 Largest and Fastest-Growing Segments
- 12.3 By Drip - Market Size and Forecast, 2025-2035
- 12.3.1 Segment Definition and Scope
- 12.3.2 Historical Market Size, 2018-2025
- 12.3.3 Revenue Forecast, 2025-2035
- 12.3.4 Volume Forecast, 2025-2035
- 12.3.5 Base-Year Market Share, 2025
- 12.3.6 Segment CAGR and Growth Drivers
- 12.3.7 Subsegment Market Size and Forecast
- 12.3.7.1 Hydration
- 12.3.7.2 Vitamin
- 12.3.7.3 Hangover
- 12.3.7.4 NAD+
- 12.3.8 Subsegment Pricing and Adoption Trends
- 12.3.9 Leading Suppliers and Competition
- 12.3.10 Regional Demand and Opportunities
- 12.4 By Setting - Market Size and Forecast, 2025-2035
- 12.4.1 Segment Definition and Scope
- 12.4.2 Historical Market Size, 2018-2025
- 12.4.3 Revenue Forecast, 2025-2035
- 12.4.4 Volume Forecast, 2025-2035
- 12.4.5 Base-Year Market Share, 2025
- 12.4.6 Segment CAGR and Growth Drivers
- 12.4.7 Subsegment Market Size and Forecast
- 12.4.7.1 At-Home
- 12.4.7.2 Hotel/Event
- 12.4.7.3 Office
- 12.4.8 Subsegment Pricing and Adoption Trends
- 12.4.9 Leading Suppliers and Competition
- 12.4.10 Regional Demand and Opportunities
- 12.5 By Payer - Market Size and Forecast, 2025-2035
- 12.5.1 Segment Definition and Scope
- 12.5.2 Historical Market Size, 2018-2025
- 12.5.3 Revenue Forecast, 2025-2035
- 12.5.4 Volume Forecast, 2025-2035
- 12.5.5 Base-Year Market Share, 2025
- 12.5.6 Segment CAGR and Growth Drivers
- 12.5.7 Subsegment Market Size and Forecast
- 12.5.7.1 Cash-Pay Single Visit
- 12.5.7.2 Cash-Pay Membership
- 12.5.8 Subsegment Pricing and Adoption Trends
- 12.5.9 Leading Suppliers and Competition
- 12.5.10 Regional Demand and Opportunities
- 12.6 Segment Growth Comparison
- 12.7 Segment Attractiveness and Priority Matrix
Chapter 13 U.S. Mobile IV Therapy Geographic Market Outlook, 2025-2035
- 13.1 Domestic Market Distribution and Demand Clusters
- 13.2 State- or Province-Wise Market Size and Forecast, 2025-2035
- 13.3 City and Metropolitan Market Outlook
- 13.4 Industrial, Manufacturing and Commercial Clusters
- 13.5 Geographic Concentration of Key End Users
- 13.6 Local Pricing and Purchasing Differences
- 13.7 Domestic Production Facilities and Capacity Map
- 13.8 Local Infrastructure and Project Pipeline
- 13.9 State-Level Policy and Incentive Differences
- 13.10 Subnational Investment Hotspots and Opportunities
- 13.11 Distribution and Logistics Networks
- 13.12 Domestic Competitive Footprint
Chapter 14 U.S. Mobile IV Therapy Technology, Innovation and Sustainability Outlook
- 14.1 Technology Landscape and Maturity
- 14.2 Product, Process and Service Innovation
- 14.3 AI, Automation and Digital Tools in the Industry
- 14.4 Technology Adoption and Performance Benchmarking
- 14.5 Innovation Pipeline and R&D Investment
- 14.6 Patent and Intellectual Property Trends
- 14.7 Energy Efficiency and Resource Management
- 14.8 Sustainability, Recycling and Circularity
- 14.9 Technology Roadmap, 2025-2035
- 14.10 Risks of Obsolescence and Technology Substitution
Chapter 15 U.S. Mobile IV Therapy Market Key Strategic Imperatives
- 15.1 Growth and Market Entry Priorities
- 15.2 High-Return Products and Segments
- 15.3 Pricing, Profitability and Cost Optimization
- 15.4 Technology Investment and Product Differentiation
- 15.5 Supply Chain Localization and Resilience
- 15.6 Distribution and Customer Acquisition
- 15.7 Partnership, Acquisition and Capacity Strategy
- 15.8 Regional Expansion Priorities
- 15.9 Short-, Medium- and Long-Term Actions
Chapter 16 Competition Outlook
- 16.1 Industry Competition Characteristics
- 16.2 Market Structure and Concentration
- 16.3 Market Share and Competitive Positioning, 2025
- 16.4 Company-Wise Revenue and Product Benchmarking
- 16.5 Production and Service Capacity Benchmarking
- 16.6 Technology, Pricing and Differentiation
- 16.7 Regional Footprint and Distribution Strength
- 16.8 Mergers, Acquisitions and Strategic Alliances
- 16.9 New Entrants and Competitive Threats
- 16.10 Porter's Five Forces and Industry Attractiveness
- 16.11 Competitive Outlook, 2025-2035
Chapter 17 Company Profiles
- 17.1 Company Coverage and Selection Criteria
- 17.2 Drip Hydration
- 17.2.1 Business Description
- 17.2.2 Company Ownership and Geographic Presence
- 17.2.3 Product and Service Portfolio
- 17.2.4 Manufacturing and Operating Footprint
- 17.2.5 Production Capacity and Expansion Plans
- 17.2.6 Financial Performance and Investment
- 17.2.7 Market Share and Competitive Position
- 17.2.8 Technology and Innovation Capabilities
- 17.2.9 Strategic Alliances or Partnerships
- 17.2.10 Recent Developments
- 17.2.11 Growth Strategy and Outlook
- 17.3 Prime IV Hydration & Wellness
- 17.4 Restore Hyper Wellness
- 17.5 Hydrate IV Bar
- 17.6 Intravene
- 17.7 Hydration Room
- 17.8 Other Relevant Market Participants
Note: Every listed company is profiled on the structure shown under the first company. The company list is preliminary and may change based on research findings, market developments, data availability and client requirements.
Chapter 18 Disclaimer
- 18.1 Research and Forecast Disclaimer
- 18.2 Data Source and Estimation Limitations
Note: The depth of individual sections depends on data availability for this market. Volume, capacity, trade and other unit-based metrics are included where applicable.

