Defense budgets and a delivery recovery set the pace
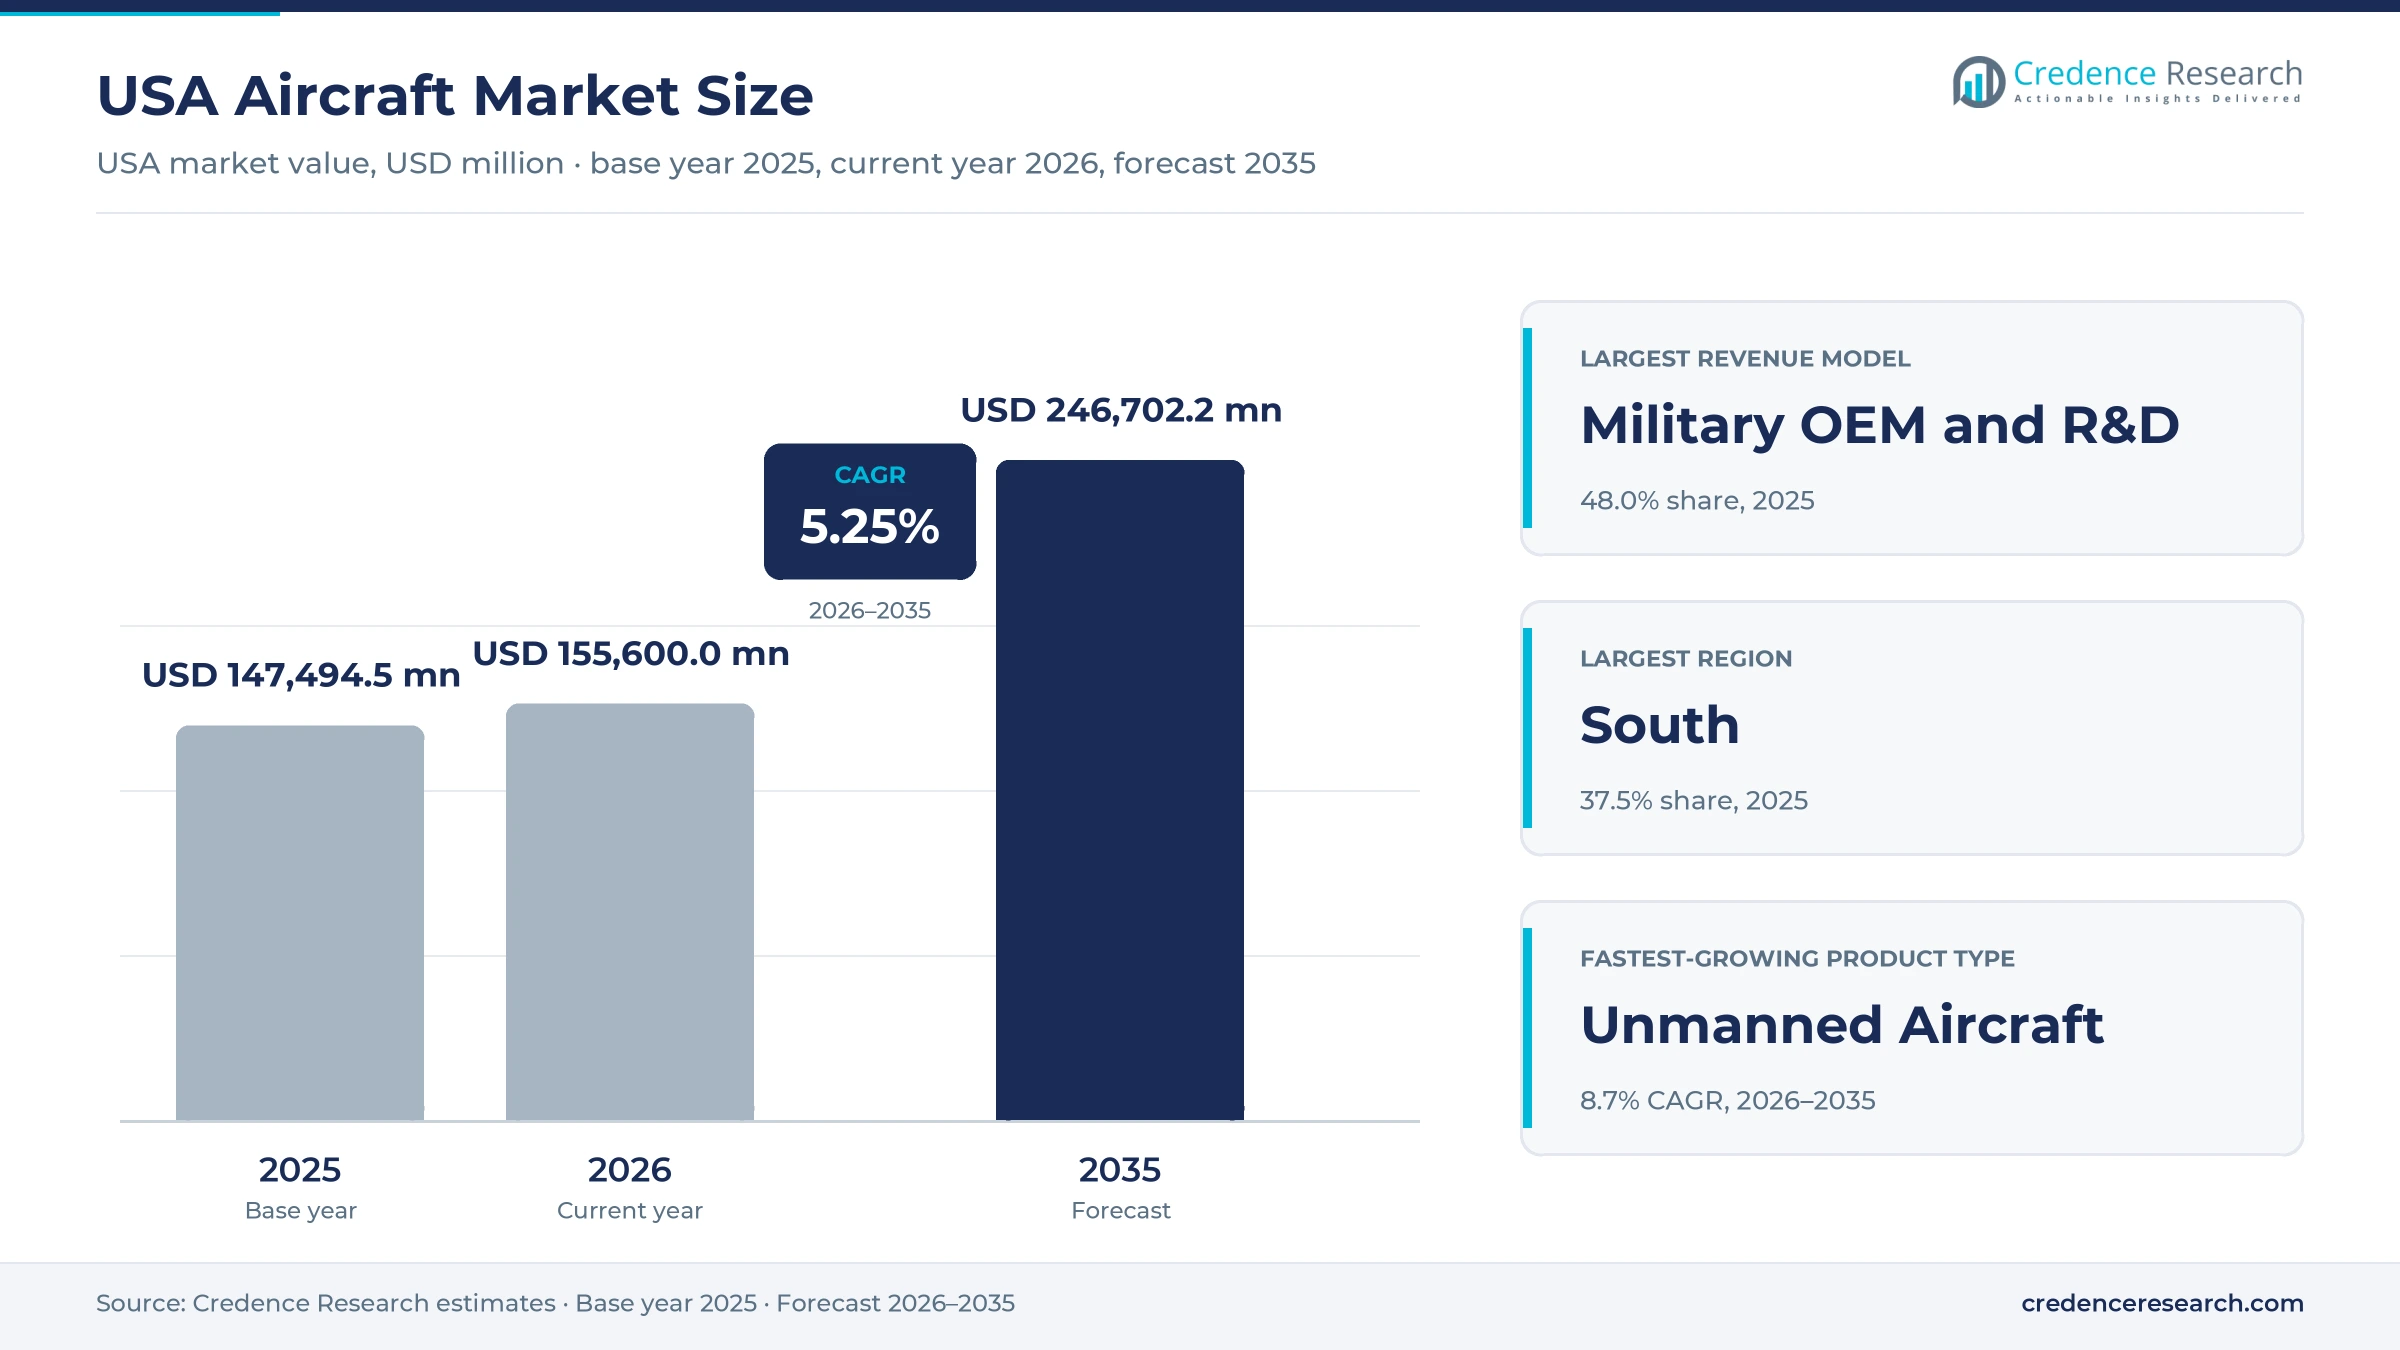
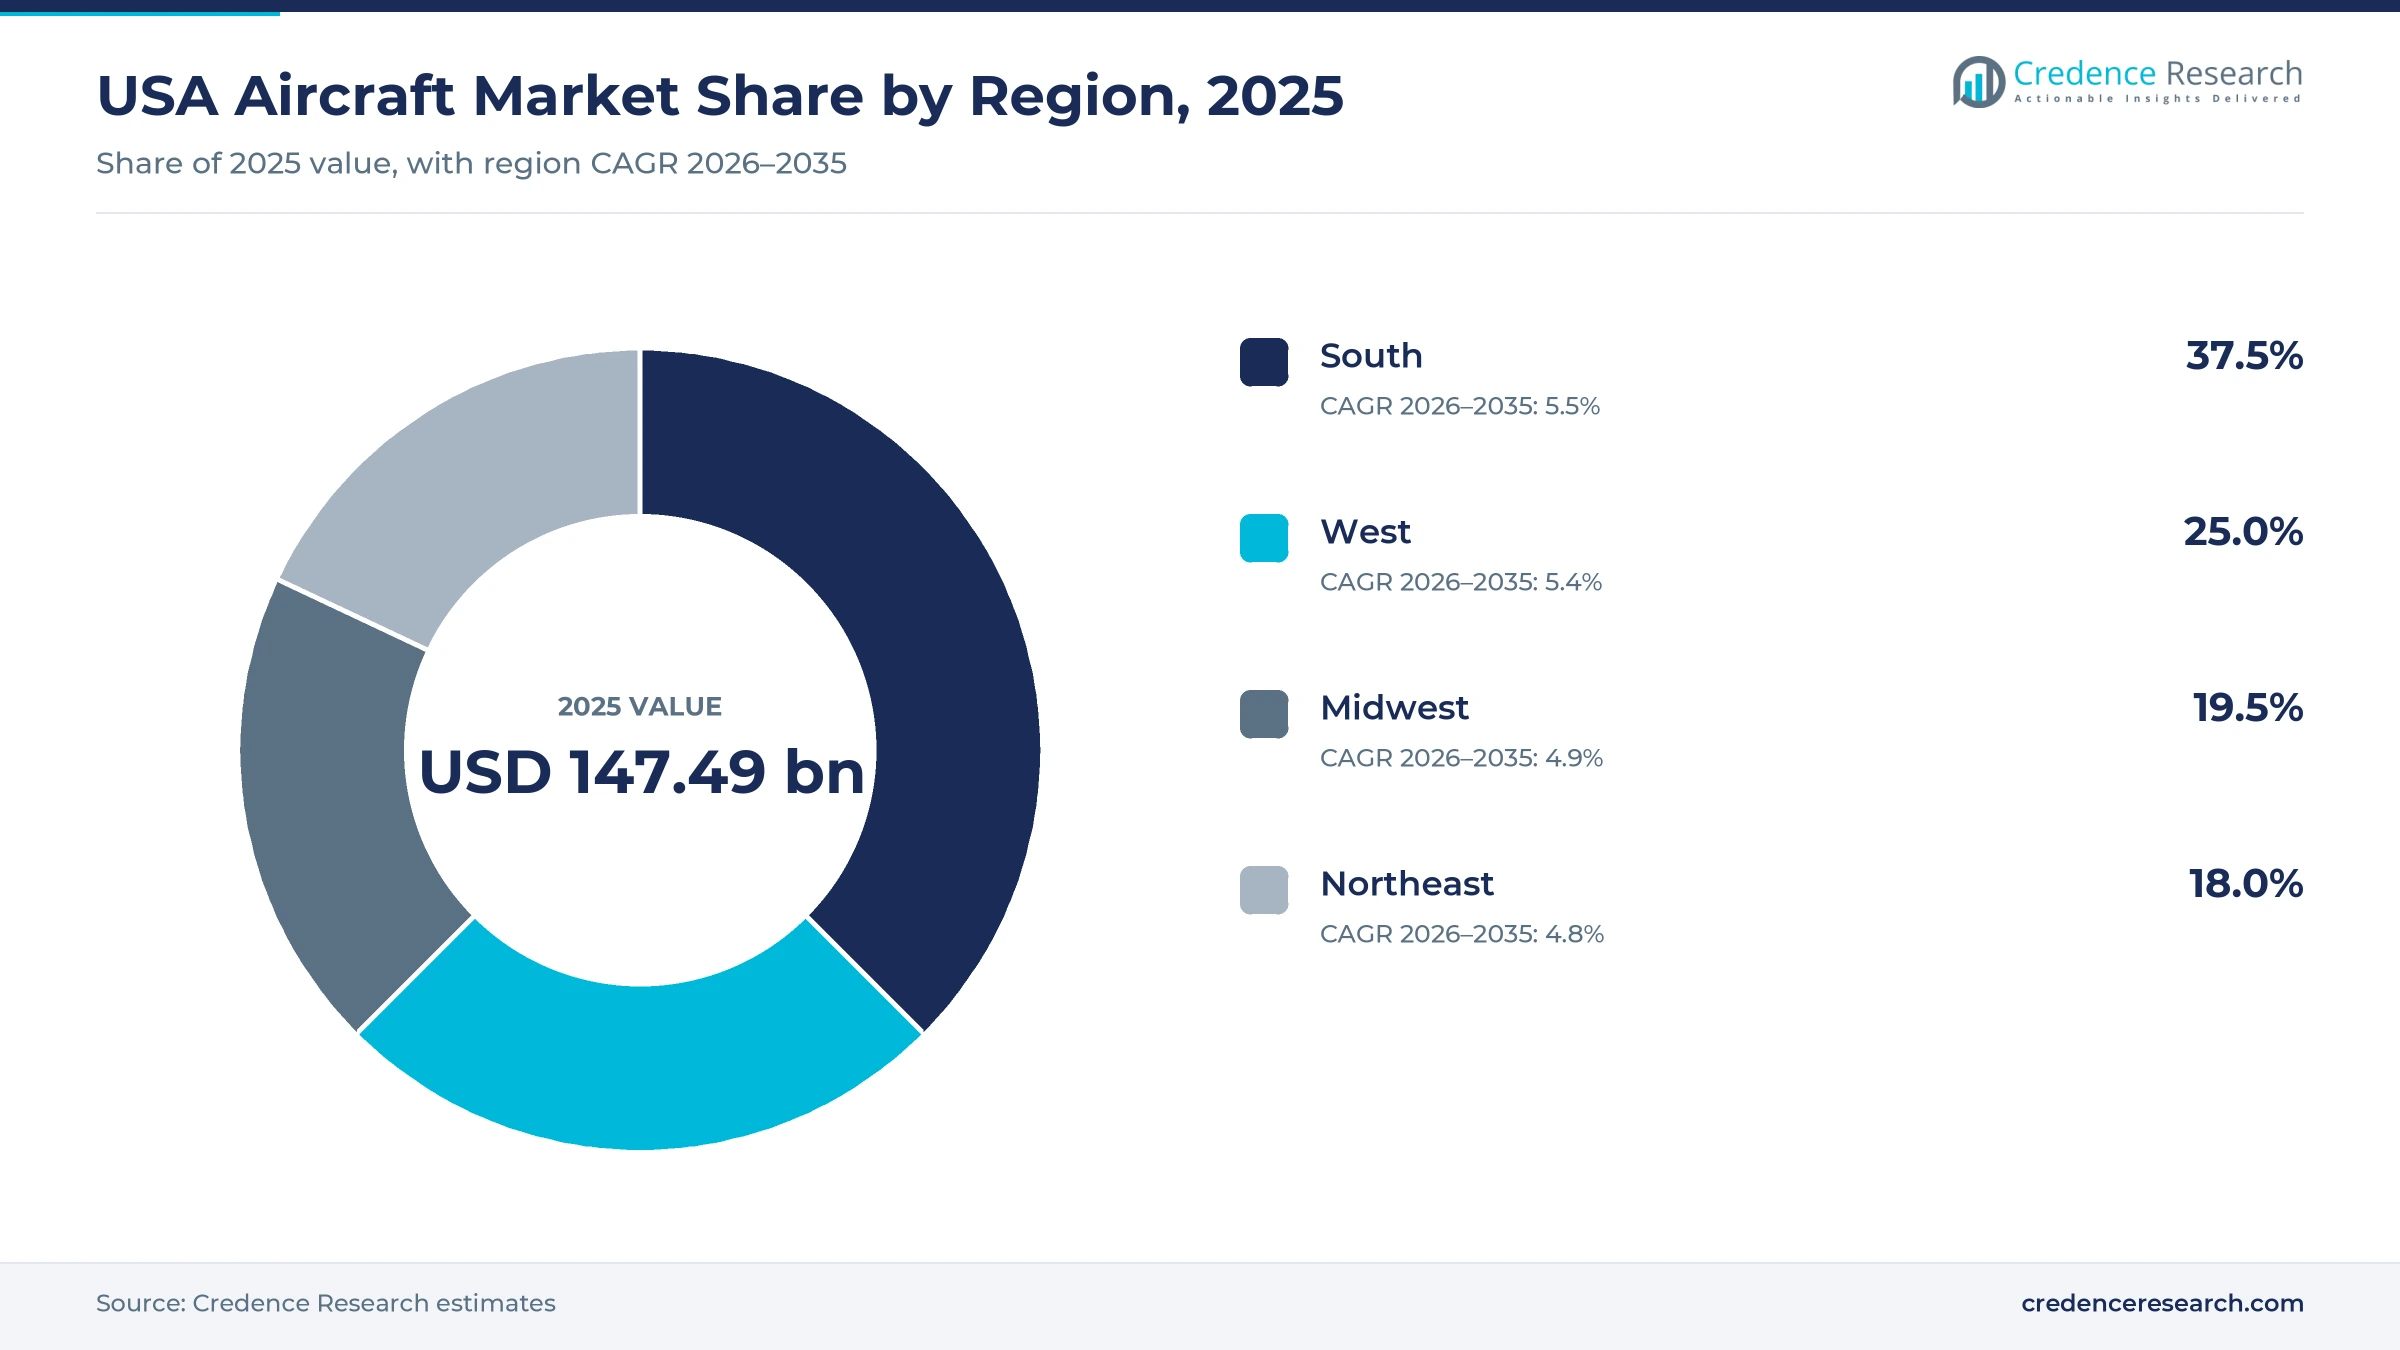
The USA aircraft market was valued at USD 147.49 billion in 2025 and is projected to increase from USD 155.60 billion in 2026 to USD 246.70 billion by 2035, registering a CAGR of 5.25% during 2026–2035. Spending rests on three pillars, the replacement of airline and cargo fleets as Boeing lifts output, multiyear military programs funded through the defense budget, and the maintenance work needed to keep a large, aging fleet flying. The South held the largest regional share, 37.5% in 2025, and it is also the fastest-growing region at 5.5% a year because fighter, business jet and tiltrotor production is concentrated in Texas and Georgia. Military programs account for the largest part of value, while uncrewed platforms grow fastest as the Pentagon shifts money toward drones and collaborative combat aircraft. Federal rules issued in 2025 for light-sport aircraft and drone flights beyond visual line of sight are also widening the civil market for smaller and uncrewed platforms through 2035.
New airframes, military development and fleet upkeep in one market
The market counts the value of new fixed-wing, rotary-wing and uncrewed aircraft delivered to U.S. buyers, military aircraft development funded by U.S. agencies, and maintenance, repair and overhaul of the U.S. fleet. Airlines, lessors, cargo operators, the armed services, federal agencies, corporations and private owners buy through direct contracts with manufacturers, government acquisition programs and authorized dealer and service networks.
Space launch vehicles, satellites, missiles, airport infrastructure and fuel are outside the scope, as are aircraft built in the U.S. for foreign buyers. The value chain runs from engine, avionics and structures suppliers through airframe makers and completion centers to operators, repair stations and parts distributors.
USA Aircraft Market Insights
- The USA aircraft market grows from USD 147.49 billion in 2025 to USD 246.70 billion by 2035 at a 5.25% CAGR as commercial deliveries recover and funded military programs enter production.
- The South held the largest regional share at 37.5% in 2025 and grows fastest at 5.5% a year, led by fighter, business jet and tiltrotor plants in Texas and Georgia.
- Military OEM and R&D led with 48.0% of 2025 value, while commercial OEM is the fastest-growing revenue model at 6.7% a year.
- Boeing delivered 600 commercial jets in 2025, its strongest year since 2018, after the FAA approved a rise in 737 output from 38 to 42 a month.
- The Pentagon finalized a USD 24.3 billion deal for 296 F-35s for U.S. and foreign buyers in September 2025, and the Air Force plans at least 1,000 collaborative combat aircraft.
Military programs lead as uncrewed types grow fastest
Fixed-wing platforms lead as uncrewed types grow fastest
Based on product type, the market is categorized into fixed-wing aircraft, rotary-wing aircraft and unmanned aircraft. Fixed-wing aircraft led with 82.0% of 2025 value because airliners, fighters, bombers and business jets carry the highest unit prices, and the F-35 deal for lots 18 and 19, finalized on Sept. 30, 2025, covers 296 jets for U.S. services and foreign buyers, Breaking Defense reported. Unmanned aircraft grow fastest at 8.7% a year as the FY2026 defense request set aside USD 9.4 billion for uncrewed aerial systems. Rotary-wing demand rests on large military buys such as the CH-53K and on civil operators of commercial helicopters.
Military programs lead while commercial deliveries grow fastest
Based on revenue model, the market is categorized into commercial OEM, business and general aviation OEM, military OEM and R&D, and MRO and aviation services. Military OEM and R&D led with 48.0% of 2025 value because aircraft programs take a large part of the USD 205 billion procurement line in the FY2026 request, which also set aside USD 3.4 billion for F-47 development, Breaking Defense reported. Commercial OEM grows fastest at 6.7% a year as Boeing recovers from a depressed 2024, having delivered 600 jets in 2025 against 1,175 gross orders. Business aviation and maintenance grow close to the market rate on steady utilization.
Defense missions lead as passenger and cargo work grows fastest
Based on application, the market is categorized into passenger and cargo transport, defense and security missions, and business and utility flying. Defense and security missions led with 49.0% of 2025 value because combat, bomber, airlift and rotorcraft programs are bought in multiyear lots, such as the five-year CH-53K contract of September 2025. Passenger and cargo transport grows fastest at 5.8% a year as the FAA expects the U.S. large cargo jet fleet to rise from 894 in 2025 to 1,598 by 2046. Business and utility flying follows business jet deliveries and helicopter utility work.
| Segment Group | Leading Sub-segment | Share, 2025 | Fastest-growing Sub-segment | CAGR, 2026–2035 |
|---|---|---|---|---|
| By Product Type | Fixed-Wing Aircraft | 82.0% | Unmanned Aircraft | 8.7% |
| By Revenue Model | Military OEM and R&D | 48.0% | Commercial OEM | 6.7% |
| By Application | Defense and Security Missions | 49.0% | Passenger and Cargo Transport | 5.8% |
Lot awards and list prices set very different price tiers
Pricing works per airframe for civil buyers and per production lot for the armed services, so the mix of programs moves average value more than list prices do. Civil makers publish list prices only for light aircraft, while airline prices are negotiated with large discounts and escalation clauses tied to delivery year. Military lots are priced through cost-plus development deals that convert to fixed-price production, which is why long lot awards matter to supplier margins. Engines and avionics carry the richest aftermarket, so OEMs that also sell spare parts and support earn more over a fleet life than on the airframe itself.
| Platform or contract | Typical price or fee | Basis |
|---|---|---|
| Four-seat piston airplane, Cirrus SR22 base list | USD 937,900 per aircraft | Cirrus Aircraft North America price list, 2026 |
| Average new civil helicopter, all makes | About USD 5.0 million per unit | Credence Research estimate from GAMA 2025 billings of USD 4.7 billion on 938 units |
| Average new general aviation airplane, all classes | About USD 9.6 million per unit | Credence Research estimate from GAMA 2025 billings of USD 31.0 billion on 3,230 units |
| Narrowbody airliner, realized price after discounts | USD 45-60 million per aircraft | Credence Research estimate from published order values and typical discounts, 2025 |
| F-35, lots 18 and 19 average contract value | About USD 82 million per jet | Credence Research estimate from USD 24.3 billion for 296 jets, Defense News, September 2025 |
| CH-53K heavy-lift helicopter, multiyear contract | About USD 110 million per aircraft | Credence Research estimate from USD 10.9 billion for up to 99 aircraft, NAVAIR, September 2025 |
Request a Free Sample
Fill in your details and we'll send you a free sample report.
- Sample data tables & charts
- Research methodology
Fleet renewal, funded programs and upkeep drive spending
Fleet replacement turns airline orders into deliveries
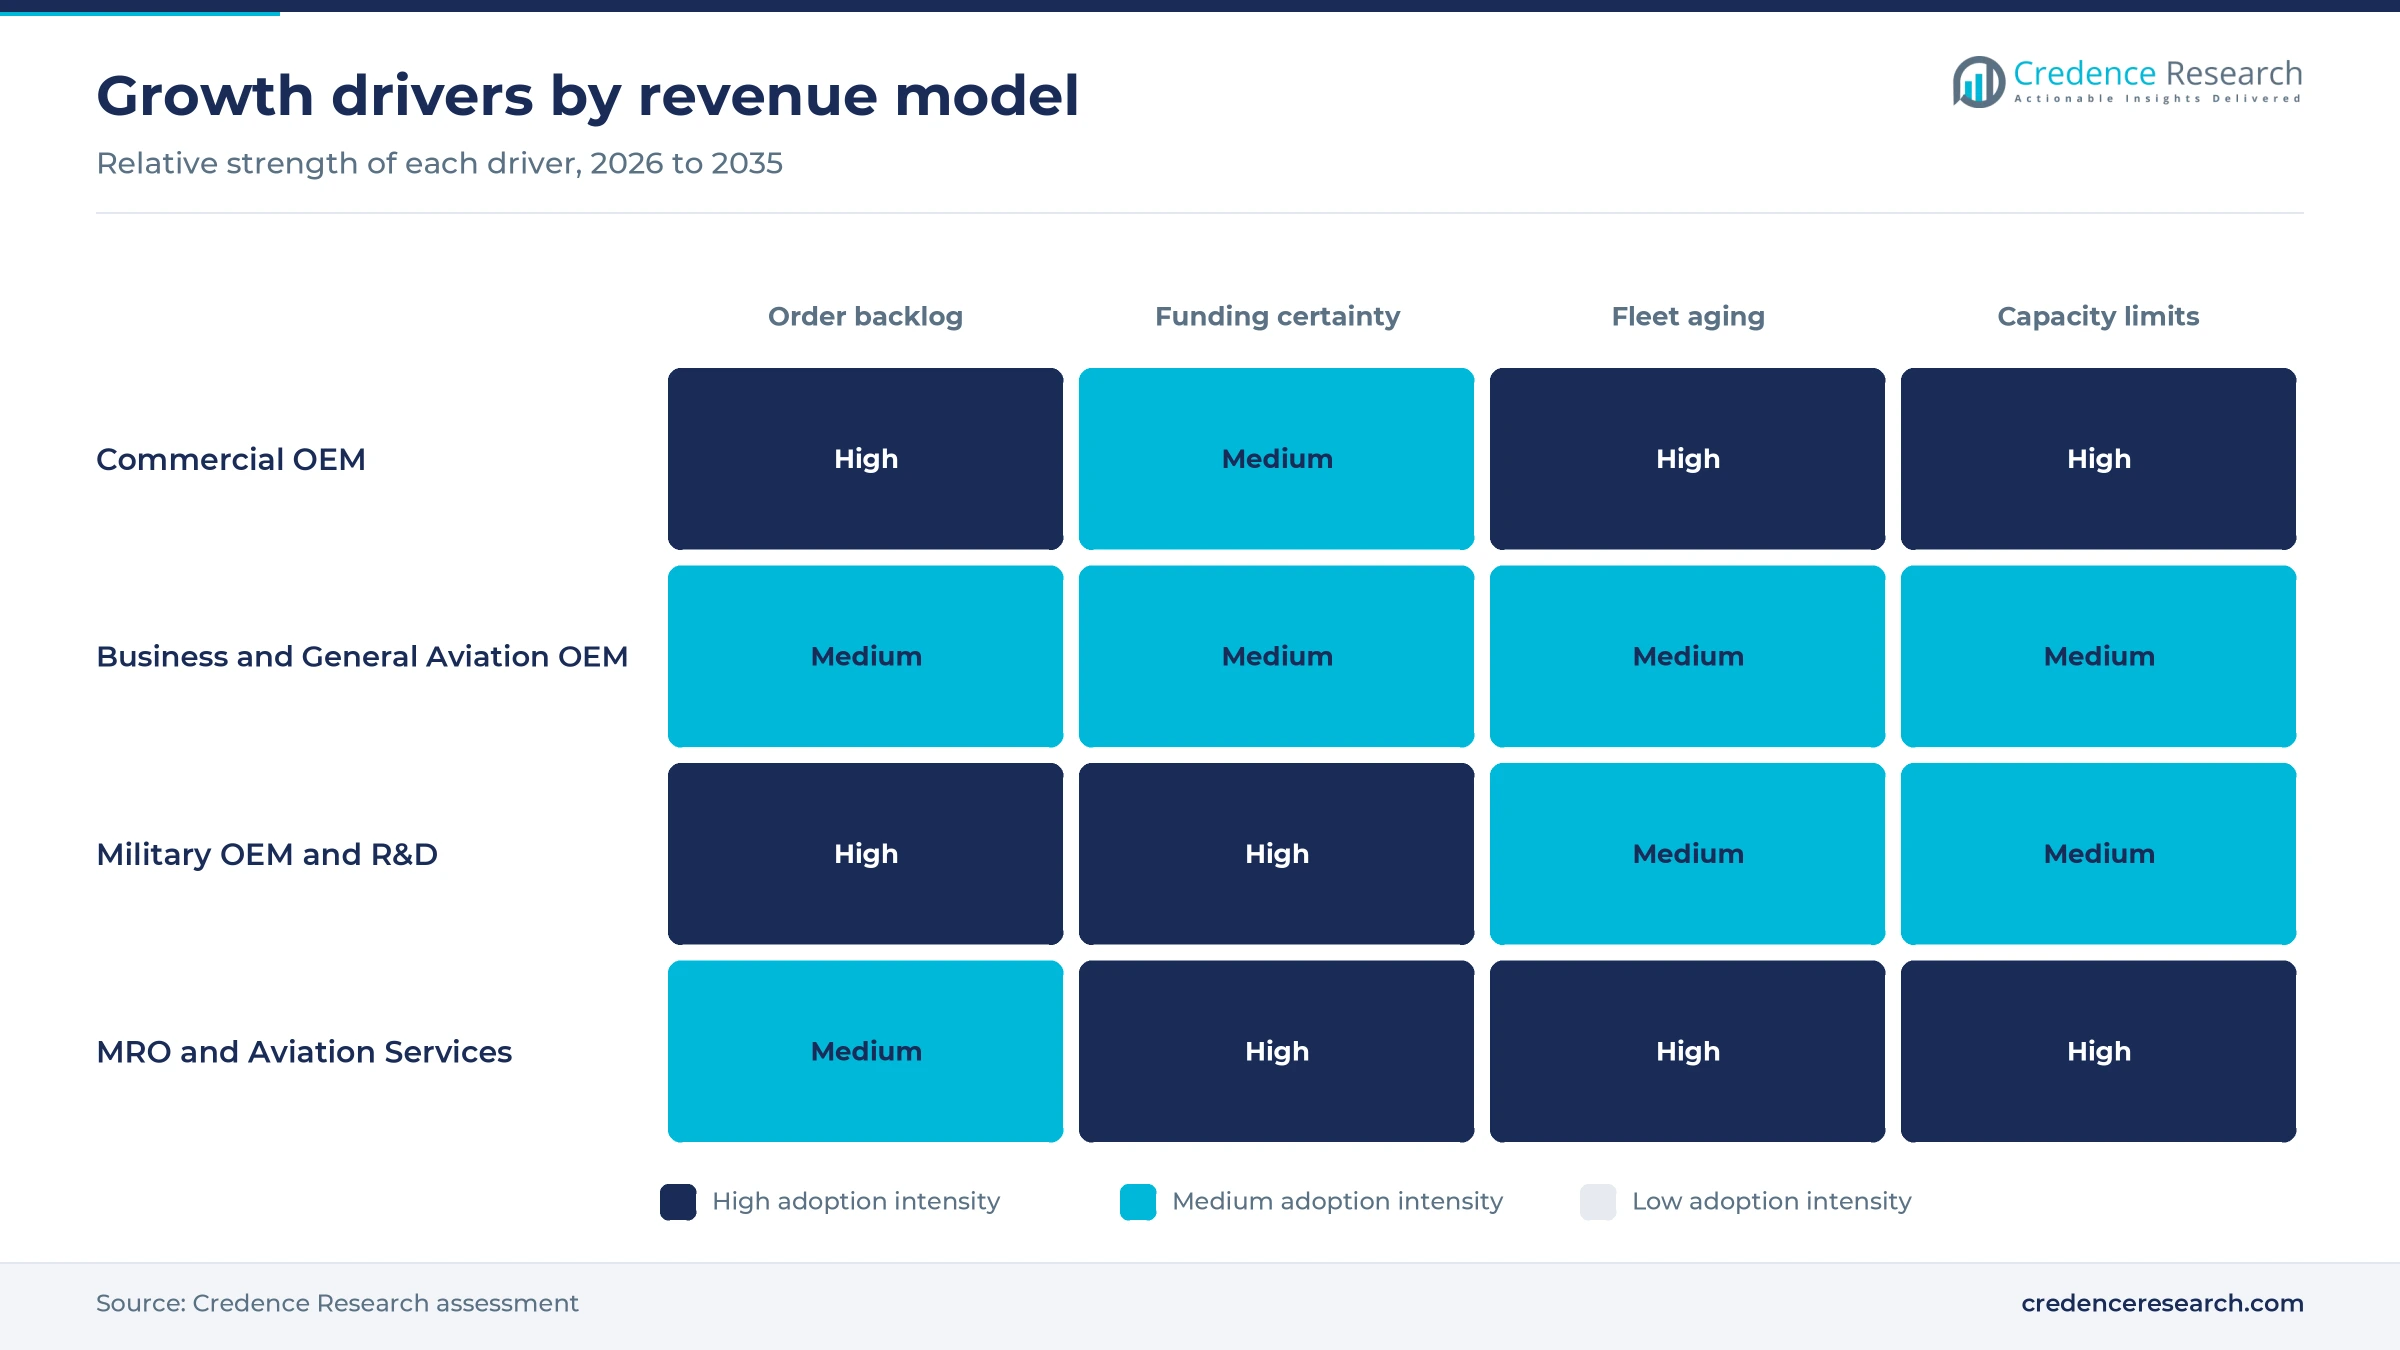
U.S. airlines are converting large order books into deliveries as Boeing raises output after two disrupted years. Boeing delivered 600 commercial jets in 2025, its strongest year since 2018, according to Aviation News, after the FAA approved a higher 737 output rate in October 2025. Alaska Airlines then placed the largest order in its history on Jan. 7, 2026, and Delta followed days later with an order for up to 60 787-10 widebodies. These orders replace older narrowbodies and widebodies rather than only adding capacity, which keeps demand firm even if traffic growth slows. Commercial OEM is the fastest-growing revenue model at 6.7% a year, so suppliers tied to Boeing production rates gain the most from each approved step.
Funded military modernization fills multiyear production lines
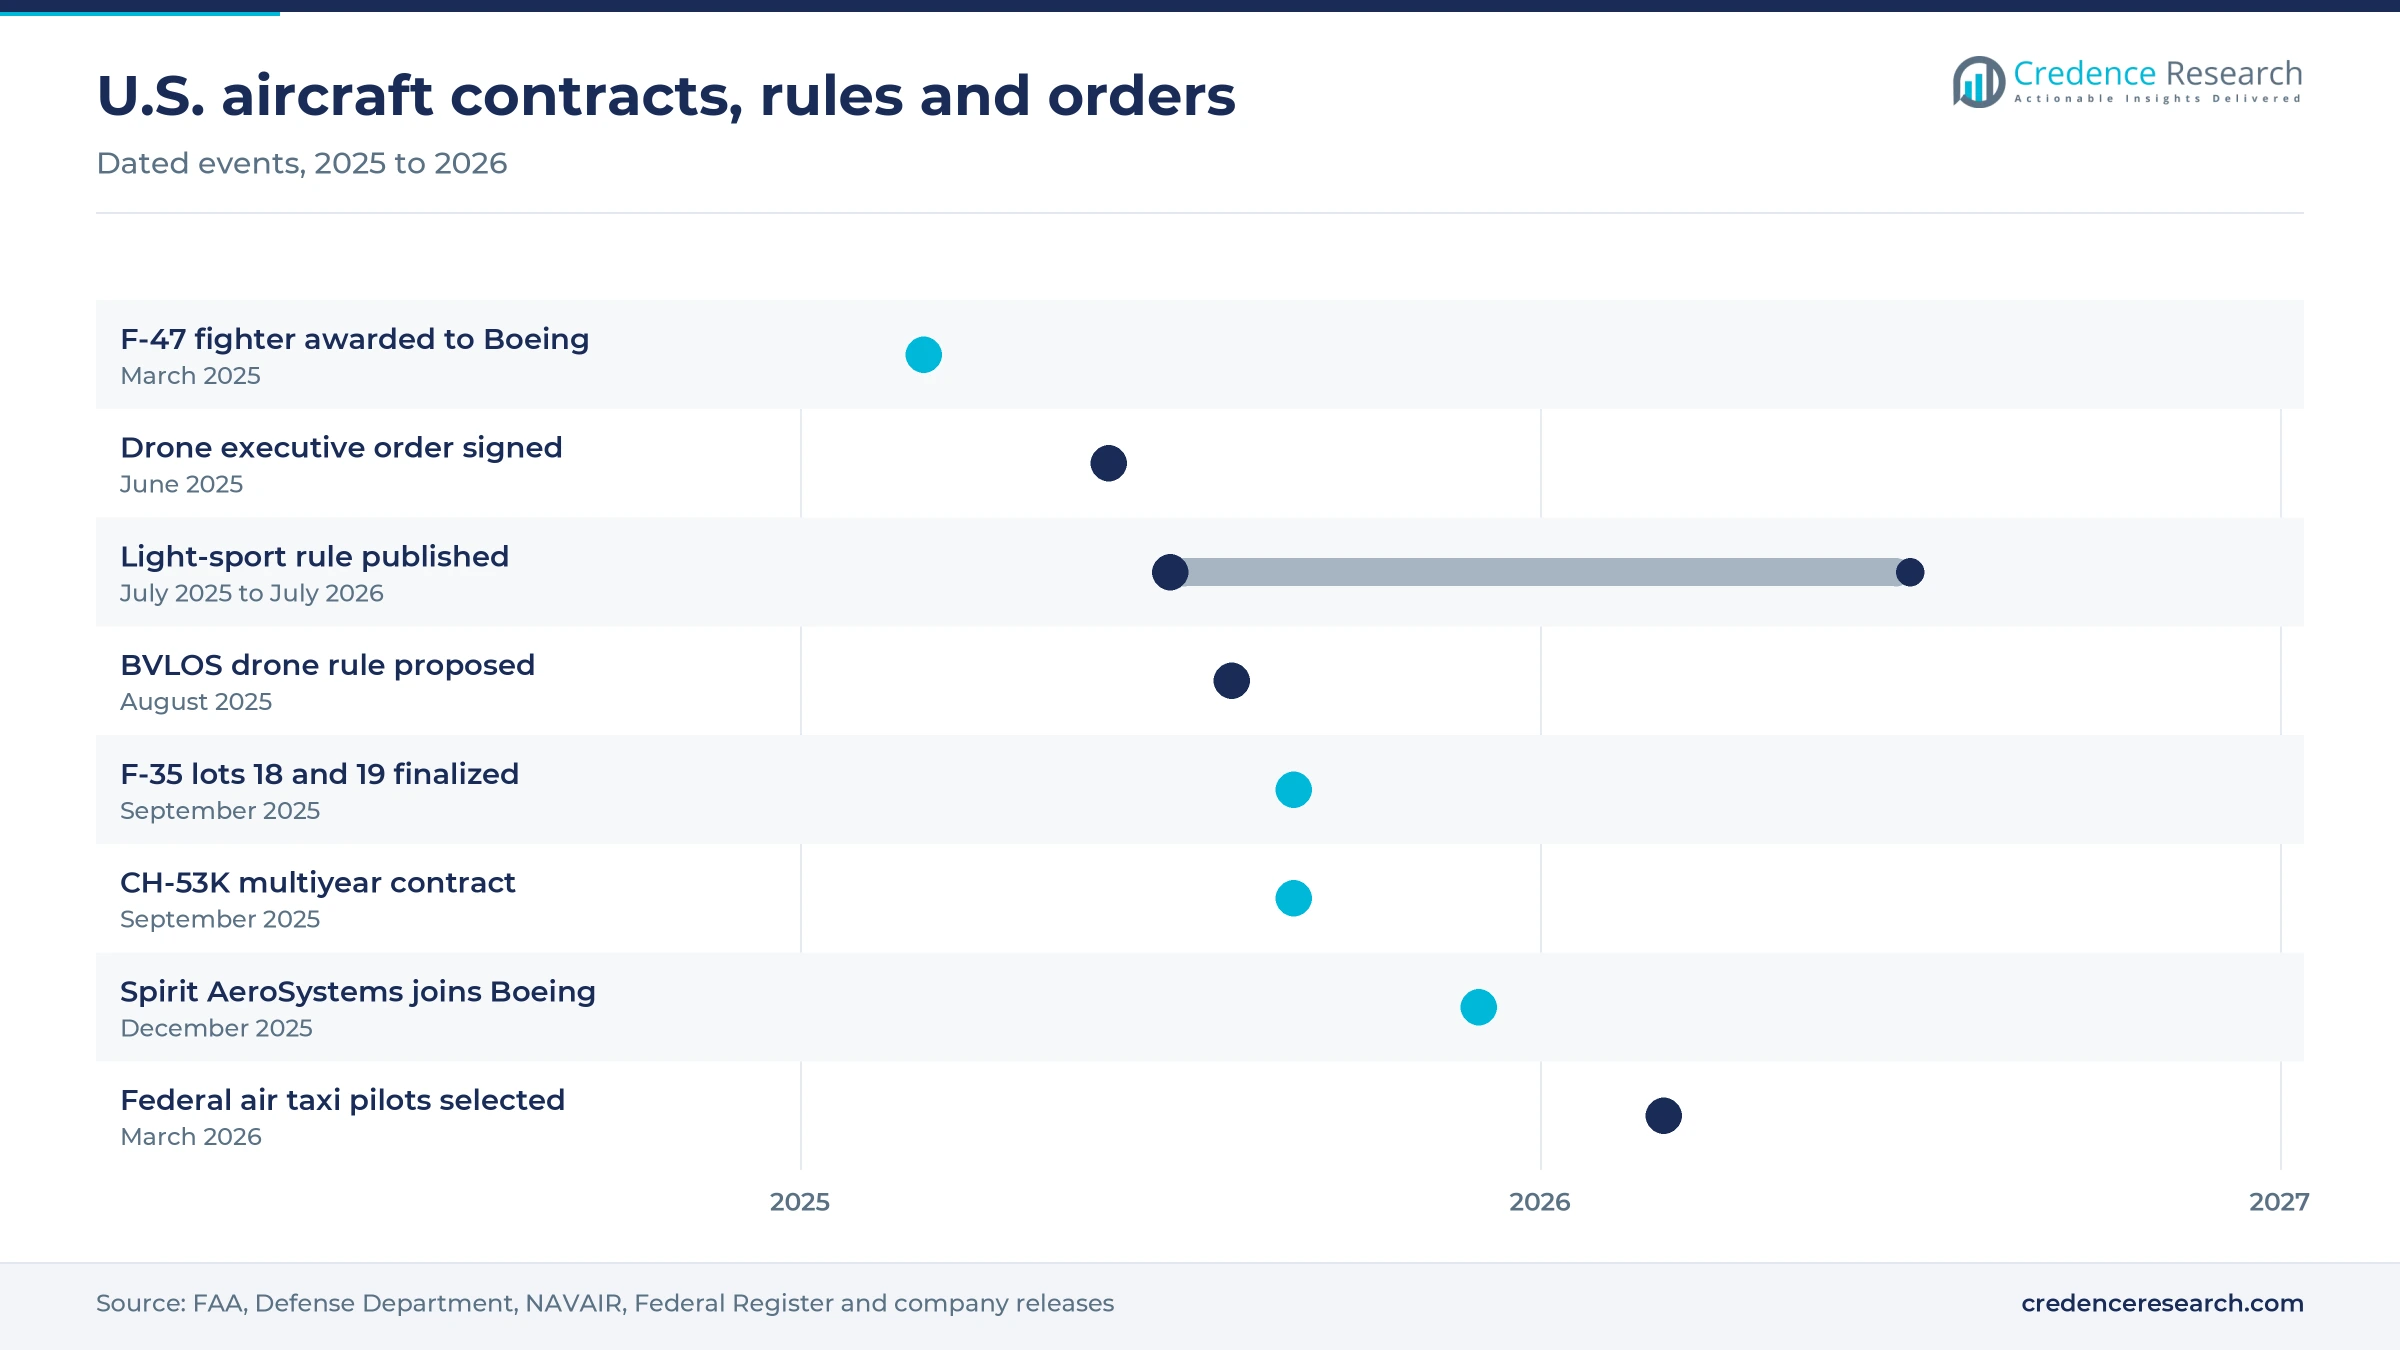
The armed services are replacing fighters, bombers and heavy helicopters at the same time, and Congress has funded the work through multiyear lots. The FY2026 defense request of USD 961.6 billion included 47 F-35s and USD 3.4 billion for the F-47 fighter, which the Air Force awarded to Boeing on March 21, 2025. The F-35 lot deal noted above adds two more production lots, and NAVAIR placed up to 99 CH-53K helicopters on a five-year contract worth about USD 10.9 billion. These awards keep military OEM and R&D the largest revenue model in the market. Suppliers on these programs gain revenue visibility that civil work rarely offers.
Maintenance capacity becomes the key to fleet availability
A large, aging U.S. fleet keeps maintenance spending high even when new deliveries slip, because operators must fly older aircraft longer. The Aeronautical Repair Station Association counts 4,594 FAA-certificated repair stations in the U.S. and nearly 339,000 workers in civil maintenance. The FAA FY2026-2046 Aerospace Forecast sees the U.S. commercial fleet growing from 6,949 aircraft in 2025 to 10,677 by 2046, widening maintenance demand. Each grounded engine or delayed shop visit removes an aircraft from revenue service, so fleet availability falls quickly when shop slots run short. Shops that add engine and component capacity for maintenance, repair and overhaul work can price firmly.
New federal rules open civil markets for small platforms
Washington issued rules in 2025 that widen the civil market for light, electric and uncrewed platforms. Executive Order 14307, signed on June 6, 2025, directed a final rule on drone flights beyond visual line of sight within 240 days, and the FAA proposed that rule on Aug. 5, 2025. The FAA published its light-sport rule on July 24, 2025, adding rotorcraft, powered-lift and electric motors to the category, with certification changes effective July 24, 2026. Unmanned aircraft grow fastest among product types at 8.7% a year. Makers of small airplanes and delivery drones gain buyers that earlier rules excluded.
Drones, air taxis and lighter rules reshape the fleet
Shift toward uncrewed combat aircraft beside crewed fighters
The Air Force is building a new class of uncrewed jets that fly with crewed fighters, which changes how combat airpower is bought. General Atomics flew its YFQ-42A for the first time in August 2025, and the service plans a fleet of at least 1,000 collaborative combat aircraft, according to Defense News. Anduril flew its YFQ-44A in October 2025, and a production decision is planned in fiscal 2026. A Pentagon memo of July 10, 2025, also set the goal that every Army squad carries low-cost military drones by the end of 2026. Newer firms can therefore win prime roles that once went only to the largest contractors.
Rise of supplier integration to stabilize production
Airframe makers are taking control of key suppliers to steady output after quality problems slowed deliveries. Boeing closed its purchase of Spirit AeroSystems on Dec. 8, 2025, bringing about 15,000 workers in Wichita, Dallas, Tulsa and two U.K. sites in-house, including narrowbody fuselage work. Bell opened a USD 632 million plant at AllianceTexas for MV-75 transmissions and rotor blades, and it plans fuselage work in Wichita and final assembly in Amarillo. Gulfstream says its Savannah site has the capacity for 200 deliveries a year by 2030. Integrated makers can promise firmer delivery slots, which matters to airlines planning fleet growth.
Air taxi pilot projects open early commercial routes
Federal pilot projects give electric and hybrid aircraft makers a path to early paid flying before full rules are final. The FAA and the Transportation Department chose eight projects across 26 states on March 9, 2026, with operations expected from summer 2026. Archer, BETA, Electra, Joby, Wisk, Ampaire, Elroy Air and Reliable Robotics take part in projects that include sites in New York, New Jersey, Texas and Florida. The light-sport rule noted above also admits powered-lift aircraft, which lowers the certification bar for smaller electric designs. Early routes are likely to link airports with city centers, where time savings justify higher fares than ground transport. Operators and cities that join early can shape routes for electric air taxis before rivals arrive.
Business jet demand opens room for new models
Business jets are the strongest civil segment outside the airlines, which gives makers room to launch new models. GAMA reported 854 business jet shipments in 2025, up 11.8%, within record industry billings of USD 35.7 billion. Textron Aviation put the Citation Ascend into service in 2025, according to Aviation Week. Gulfstream expects its super-midsize G300 to be certified later in 2027, according to AIN. Makers that bring new cabins and longer range to market can win replacement buyers from the large installed fleet of older business jets. Corporate flight departments and fractional operators tend to replace jets on fixed cycles, which gives makers predictable demand when new models arrive on schedule.
Engine faults, mechanic gaps and output caps limit growth
Engine durability problems ground part of the airline fleet
Engine faults can keep airliners parked for months, which cuts the value airlines get from new aircraft. Pratt & Whitney issued USD 72 million in credits to Spirit Airlines for aircraft on the ground in the second quarter of 2025, and Spirit expected engine removals to continue through at least 2026, according to Aviation Week. Airlines respond by keeping older jets longer, which shifts spending from new airframes to maintenance. Engine makers that add shop capacity and spare engines can limit the damage.
Mechanic shortages limit maintenance throughput
Repair shops cannot add capacity as fast as the fleet grows because certificated mechanics are scarce. The 2025 pipeline report from the Aviation Technical Education Council and Oliver Wyman projected a 10% shortage of airline mechanics in 2025, narrowing to 7%, or about 10,000 mechanics, by 2035. The FAA issued slightly over 9,000 new mechanic certificates in 2024, about 4% below 2023. Shops respond with higher wages and in-house schools, which raises labor rates for fleet operators.
Production oversight keeps output below demand
Regulatory oversight after a 2024 door plug failure still caps how fast Boeing can raise output. The FAA approved only a step from 38 to 42 737s a month in October 2025, and Boeing said it would discuss another increase only after six stable months at that rate, according to Manufacturing Dive. Airlines that ordered early therefore wait longer for jets and extend leases on older aircraft. Suppliers must hold inventory for rates that may arrive later than planned.
Trade reviews add cost risk for imported parts
Tariff reviews add cost risk for a supply chain that depends on imported engines and parts. The Commerce Department opened a Section 232 comment period on commercial aircraft, jet engines and parts on May 13, 2025, and ARSA reported USD 15.3 billion of U.S. aircraft parts imports in its comments. A U.S.-EU framework restored zero tariffs on aircraft and parts from Sept. 1, 2025, but Swiss parts stay outside it. Buyers therefore face uneven landed costs depending on the supplier country.
The South leads on fighter, jet and rotorcraft plants
| Region | Value, 2025 (USD billion) | Share, 2025 | CAGR, 2026–2035 |
|---|---|---|---|
| South | 55.31 | 37.5% | 5.5% |
| West | 36.87 | 25.0% | 5.4% |
| Midwest | 28.76 | 19.5% | 4.9% |
| Northeast | 26.55 | 18.0% | 4.8% |
The South leads on fighter, business jet and tiltrotor plants
The South held 37.5% of 2025 value and grows at 5.5% a year, the fastest of the four regions. Lockheed Martin builds most F-35s at its Fort Worth, Texas, factory, where deliveries from the lots noted above begin in 2026. Bell will assemble the MV-75 tiltrotor in Amarillo after the Army moved its target to 2028 from 2030, and Gulfstream plans 200 deliveries a year from Savannah, Georgia, by 2030. These programs give the region a larger share of new production value than its share of airline traffic alone would suggest.
The West grows on bomber production and drone testing
The West held 25.0% of 2025 value and grows at 5.4% a year. Northrop Grumman builds the B-21 in Palmdale, California and the Air Force agreed in February 2026 to expand production with USD 4.5 billion of reconciliation funding, targeting a first delivery to Ellsworth Air Force Base in 2027. The YFQ-42A first flew from a California site in August 2025. Large Western airline fleets also feed steady demand for new narrowbodies and maintenance work.
The Midwest relies on structures, fuselages and light aircraft
The Midwest held 19.5% of 2025 value and grows at 4.9% a year. Wichita, Kansas, is the center of the region's airframe work, and its former Spirit AeroSystems plants, now part of Boeing, build narrowbody fuselages. Bell also plans to build MV-75 fuselages at a site in Wichita for the Army program. Growth is slower than in the South because the region builds more structures and light aircraft, which carry less value per unit than finished fighters or bombers.
The Northeast grows on heavy helicopters and urban air pilots
The Northeast held 18.0% of 2025 value and grows at 4.8% a year, the slowest of the four regions. Stratford-based Sikorsky, a Lockheed Martin company, builds the CH-53K under the multiyear contract noted above, which gives Connecticut years of heavy-lift production work. Projects in New York and New Jersey are among the eight federal air taxi pilots selected in March 2026. Dense airline hubs keep maintenance demand steady across the region.
Contracts, orders and rules that moved demand, 2025 to 2026
| Development | Status and market relevance |
|---|---|
| In March 2025, the Air Force awarded Boeing the F-47 next-generation fighter development contract. | Awarded; sixth-generation fighter program |
| In September 2025, the Pentagon and Lockheed Martin finalized F-35 lots 18 and 19 for 296 jets. | Finalized; deliveries from 2026 |
| In September 2025, NAVAIR placed up to 99 CH-53K helicopters on a five-year multiyear contract with Sikorsky. | Awarded; heavy-lift rotorcraft |
| In December 2025, Boeing completed its purchase of Spirit AeroSystems and its Wichita fuselage plants. | Completed; supplier integration |
| In January 2026, Alaska Airlines ordered 105 737-10s and five 787s from Boeing. | Ordered; largest order in its history |
Stealth, autonomy and new propulsion set the build agenda
- Stealth and sixth-generation design shapes the F-47 and B-21, whose low-observable airframes and open systems carry the highest development budgets in the market.
- Autonomy software lets collaborative combat aircraft and delivery drones fly with less direct control, and it moves value from airframes to mission software.
- Electric and hybrid propulsion powers the air taxi and light aircraft entering federal pilot projects, and it depends on battery energy density for range.
- Digital upgrades on crewed fleets add new avionics, sensors and engines to existing airframes, which extends service lives as operators wait for delayed new jets and adopt sustainable aviation fuel blends.
Need a Custom Version of This Report?
Tailor the scope, geography, or segments to your exact requirements.
- Custom geography or segment scope
- Direct access to our analyst team
A few prime contractors hold most U.S. airframe value
Competition turns on delivery reliability, program awards and aftermarket reach rather than on list prices. Boeing competes in commercial jets, the F-47 and military derivatives, and it now controls its main fuselage supplier. Lockheed Martin leads fighters with the F-35 and heavy helicopters through Sikorsky, while Northrop Grumman holds the B-21 bomber. Textron competes through Bell in tiltrotors and helicopters and through Textron Aviation in business jets and turboprops. Gulfstream builds large-cabin business jets in Savannah, and Cirrus sells four-seat piston airplanes at published list prices. General Atomics and Anduril compete for collaborative combat aircraft production, and Joby is among the electric air taxi makers in the federal pilots. Pratt & Whitney shapes airline costs through engine availability and credits. Winning firms pair long production lots with service contracts that run for the life of each fleet.
Prime contractors, specialist builders and repair networks
The supply side is concentrated at the top, with a handful of prime contractors holding most airliner, fighter, bomber and heavy helicopter value. Boeing leads large commercial jets, while Lockheed Martin, Northrop Grumman and Boeing lead combat aircraft. Gulfstream, Textron Aviation and Cirrus build business and light aircraft, and newer firms such as Anduril and Joby are entering uncrewed and electric niches. Entry barriers are highest for certified transport and combat types, which need years of testing, while repair stations form a fragmented layer of several thousand shops where engine and component work earns the widest margins.
Companies profiled and their roles in this market
| Company | Type | Role in the market |
|---|---|---|
| The Boeing Company | Commercial and military prime | 737 and 787 jets, F-47 fighter, Spirit AeroSystems fuselage plants |
| Lockheed Martin Corporation | Military prime | F-35 production in Fort Worth; Sikorsky CH-53K in Stratford |
| Northrop Grumman Corporation | Military prime | B-21 Raider production in Palmdale |
| General Dynamics (Gulfstream Aerospace) | Business jet maker | Large-cabin jets built in Savannah, G300 due 2027 |
| Textron Inc. (Textron Aviation and Bell) | Business, light and rotorcraft maker | Citation Ascend; Bell MV-75 tiltrotor for the Army |
| General Atomics Aeronautical Systems | Uncrewed aircraft maker | YFQ-42A collaborative combat aircraft |
| Anduril Industries | Uncrewed aircraft maker | YFQ-44A collaborative combat aircraft |
| RTX Corporation (Pratt & Whitney) | Engine maker | Geared turbofan engines and airline credits for grounded aircraft |
| Cirrus Aircraft | Light aircraft maker | SR22 four-seat piston airplanes |
| Joby Aviation | Electric aircraft developer | Participant in the federal eVTOL integration pilot program |
Delivery rates, not order books, decide the next decade
Credence Research's view is that USA aircraft market value to 2035 depends more on delivery rates than on orders, because airline and military order books already exceed what plants can build each year. The near-term upside sits in commercial jets, where each approved narrowbody rate step adds deliveries that buyers have already paid deposits for. Military spending gives the market a floor, as military OEM and R&D held 48.0% of 2025 demand and fighter, bomber and heavy helicopter lots now run for several years. Suppliers should plan around production stability, mechanic supply and engine availability, which are the constraints most likely to move the forecast.
Fleet counts, budgets and billings anchor the estimate
The report uses 2025 as the base year and forecasts to 2035. Market values come from the Credence Research model, which combines aircraft deliveries and typical prices for civil platforms, defense budget lines for military procurement and development, and fleet size for maintenance spending. Inputs come from FAA fleet forecasts, GAMA shipment data, Defense Department budget documents, NAVAIR and Air Force releases, trade association filings and company announcements. Segment and regional shares in this report are Credence Research estimates. No interviews or surveys were conducted for this edition of the report.
Value rises by more than half as output recovers to 2035
The USA aircraft market is expected to reach USD 246.70 billion by 2035 as commercial output recovers, funded military programs enter full production and the fleet grows. Airline deliveries should rise in steps as the FAA approves higher Boeing rates, while the F-35, B-21, F-47 and CH-53K give military work long visibility. Uncrewed aircraft will take a growing share as collaborative combat aircraft and drones move into production. Maintenance demand will stay firm as long as engine faults and mechanic shortages keep older aircraft flying, so firms with shop capacity are well placed through 2035.
Delivery rates and defense budgets set the 2035 range
The range of outcomes depends on how fast Boeing raises narrowbody and widebody output and on whether defense budgets keep funding several new programs at once. A downside case assumes output stalls near 42 jets a month and Congress trims aircraft procurement. The base case assumes gradual rate increases and steady funding for the F-47, B-21 and collaborative combat aircraft. An upside case adds faster rate approvals and early drone and air taxi production at scale.
| Scenario | CAGR, 2026–2035 | Value, 2035 | What has to hold |
|---|---|---|---|
| Downside | 3.8% | USD 216.72 billion | Boeing output stalls near 42 a month and Congress trims aircraft procurement each year |
| Base | 5.25% | USD 246.70 billion | Rates rise gradually and F-47, B-21 and combat drone funding holds steady |
| Upside | 6.5% | USD 273.10 billion | Faster rate approvals arrive and drone and air taxi production scales before 2030 |
Frequently Asked Questions
How big is the USA aircraft market?
Which revenue model leads the market?
Which region holds the largest share?
How many commercial jets did Boeing deliver in 2025?
Which product type grows fastest?
What rules are opening the civil market?
What are the main challenges for the market?
Which companies lead the market?
Table of Content
Chapter 1 Market Segmentation
- 1.1 Segmentation Framework
- 1.1.1 Product and Service Classification
- 1.1.2 Application and End-Use Classification
- 1.1.3 Technology and Solution Classification
- 1.1.4 Customer and Distribution Channel Classification
- 1.1.5 Geographic Segmentation
- 1.1.6 Market Segment Definitions and Boundaries
- 1.2 By Product Type
- 1.2.1 Fixed-Wing Aircraft
- 1.2.2 Rotary-Wing Aircraft
- 1.2.3 Unmanned Aircraft
- 1.3 By Revenue Model
- 1.3.1 Commercial OEM
- 1.3.2 Business and General Aviation OEM
- 1.3.3 Military OEM and R&D
- 1.3.4 MRO and Aviation Services
- 1.4 By Application
- 1.4.1 Passenger and Cargo Transport
- 1.4.2 Defense and Security Missions
- 1.4.3 Business and Utility Flying
Chapter 2 Introduction
- 2.1 Report Objectives and Scope
- 2.2 Product Definition and Industry Terminology
- 2.3 Market Inclusions and Exclusions
- 2.4 Research Process
- 2.4.1 Primary Research and Expert Interviews
- 2.4.2 Secondary Research and Source Review
- 2.4.3 Top-Down and Bottom-Up Estimation
- 2.4.4 Data Triangulation and Verification
- 2.5 Market Size Measurement Basis
- 2.5.1 2025: USD 147.49 billion → 2035: USD 246.70 billion
- 2.6 Historical and Forecast Reference Periods
- 2.6.1 Historical Period: 2018-2025
- 2.6.2 Base Year: 2025
- 2.6.3 Forecast Period: 2025-2035
- 2.7 Research Assumptions and Limitations
Chapter 3 Executive Summary
- 3.1 Market Snapshot and Key Findings
- 3.2 Base-Year Market Size, 2025
- 3.3 Forecast Market Size, 2035
- 3.4 Revenue and Volume Growth Outlook
- 3.5 Key Demand and Supply Indicators
- 3.6 Leading Market Segments
- 3.7 Fastest-Growing Market Opportunities
- 3.8 Regional Performance Highlights
- 3.9 Technology and Industry Transformation
- 3.10 Competitive Landscape Summary
- 3.11 Analyst View and Strategic Implications
Chapter 4 USA Aircraft Market Trends and Developments
- 4.1 Historical Industry Development, 2018-2025
- 4.2 Recent Market Trends and Developments
- 4.3 Demand and Customer Behavior Trends
- 4.4 Technology and Product Innovation
- 4.5 Artificial Intelligence, Automation and Digitalization
- 4.6 Local Manufacturing and Supply Chain Realignment
- 4.7 Industry Partnerships, Mergers and Acquisitions
- 4.8 Sustainability and Circular Economy Developments
- 4.9 Government and Private Sector Investment Trends
- 4.10 Emerging Business Models and Commercialization
- 4.11 Industry Developments and Announcements
Chapter 5 USA Aircraft Market Production, Supply and Demand Analysis
- 5.1 Demand Trend and Consumption Analysis, 2018-2025
- 5.2 Demand Forecast, 2025-2035
- 5.3 Production and Output Trend, 2018-2025
- 5.4 Production and Output Forecast, 2025-2035
- 5.5 Installed Capacity and Capacity Utilization
- 5.6 Company-Wise Production Plants and Statistics
- 5.6.1 Installed Production Capacity
- 5.6.2 Actual Production
- 5.6.3 Planned Capacity and Expansion Targets
- 5.7 Supply Chain Structure and Procurement Trends
- 5.8 Supply-Demand Gap and Bottlenecks
- 5.9 Import Dependence and Sourcing Structure
- 5.10 Contract Manufacturing and Outsourcing
- 5.11 Regional Supply and Demand Concentration
Chapter 6 USA Aircraft Market Pricing Analysis
- 6.1 Pricing Structure and Measurement
- 6.2 Historical Pricing Trends, 2018-2025
- 6.3 Pricing Outlook, 2025-2035
- 6.4 Average Selling Price and Unit Economics
- 6.5 Pricing by Product and Market Segment
- 6.6 Geographic Pricing Differences
- 6.7 Key Input, Energy, Labor and Logistics Costs
- 6.8 Contract Pricing and Purchasing Models
- 6.9 Pricing Sensitivity and Competitive Positioning
- 6.10 Price, Margin and Profitability Implications
Chapter 7 USA Aircraft Market Dynamics
- 7.1 Market Growth Drivers
- 7.1.1 Demand-Side Drivers
- 7.1.2 Technology and Innovation Drivers
- 7.1.3 Infrastructure and Investment Drivers
- 7.1.4 Regulatory and Policy Drivers
- 7.2 Market Restraints
- 7.2.1 Cost and Affordability Constraints
- 7.2.2 Technology and Adoption Barriers
- 7.2.3 Supply Chain and Operational Constraints
- 7.3 Market Challenges
- 7.3.1 Competitive Pressure and Margin Erosion
- 7.3.2 Skills, Infrastructure and Implementation Gaps
- 7.4 Emerging Market Opportunities
- 7.5 Market Dynamics Impact and Time-Horizon Assessment
Chapter 8 USA Aircraft Value Chain Analysis
- 8.1 Industry Value Chain Overview
- 8.2 Upstream Suppliers and Critical Inputs
- 8.3 Technology and Component Providers
- 8.4 Manufacturing or Service Delivery
- 8.5 Distribution, Channel Partners and Integrators
- 8.6 Downstream Applications and End Users
- 8.7 Value Addition and Profit Pools
- 8.8 Vertical Integration and Outsourcing
- 8.9 Supplier Concentration and Risk
- 8.10 Supply Chain Localization and Resilience
Chapter 9 USA Aircraft Market Regulations and Policies
- 9.1 Relevant Laws, Standards and Compliance Frameworks
- 9.2 Product, Service, Safety and Quality Requirements
- 9.3 Government Policies, Incentives and Subsidies
- 9.4 Imports, Exports and Trade Barriers
- 9.5 Public Procurement and Local Content Requirements
- 9.6 Environmental and Sustainability Compliance
- 9.7 Upcoming Policy Changes and Market Implications
Chapter 10 USA Aircraft Market Hotspots and Opportunities
- 10.1 Market Opportunity Mapping and Growth Hotspots
- 10.2 High-Growth Applications and Customer Groups
- 10.3 Underserved Markets and White-Space Opportunities
- 10.4 Emerging Technology and Product Opportunities
- 10.5 New Capacity and Investment Hotspots
- 10.6 Market Entry and Expansion Opportunities
- 10.7 Distribution and Partnership Opportunities
- 10.8 Near-Term and Long-Term Commercial Potential
- 10.9 Opportunity Attractiveness and Execution Risks
Chapter 11 USA Aircraft Market Outlook, 2025-2035
- 11.1 Market Size and Analysis
- 11.1.1 Revenue (Market Measurement: 2025: USD 147.49 billion → 2035: USD 246.70 billion)
- 11.1.2 Market Volume and Quantity Sold
- 11.1.3 Historical Market Size, 2018-2025
- 11.1.4 Base-Year Market Size, 2025
- 11.2 Market Forecast, 2025-2035
- 11.2.1 Revenue Forecast to 2035
- 11.2.2 Volume Forecast to 2035
- 11.2.3 CAGR and Year-on-Year Growth
- 11.2.4 Incremental Revenue Opportunity
- 11.3 Forecast Assumptions and Scenario Analysis
- 11.3.1 Base-Case Forecast
- 11.3.2 Optimistic and Conservative Scenarios
- 11.3.3 Technology, Pricing and Policy Sensitivities
- 11.4 Market Attractiveness and Growth Outlook
Chapter 12 USA Aircraft Market Segmentation and Outlook
- 12.1 Segmentation Summary and Market Shares, 2025
- 12.2 Largest and Fastest-Growing Segments
- 12.3 By Product Type - Market Size and Forecast, 2025-2035
- 12.3.1 Segment Definition and Scope
- 12.3.2 Historical Market Size, 2018-2025
- 12.3.3 Revenue Forecast, 2025-2035
- 12.3.4 Volume Forecast, 2025-2035
- 12.3.5 Base-Year Market Share, 2025
- 12.3.6 Segment CAGR and Growth Drivers
- 12.3.7 Subsegment Market Size and Forecast
- 12.3.7.1 Fixed-Wing Aircraft
- 12.3.7.2 Rotary-Wing Aircraft
- 12.3.7.3 Unmanned Aircraft
- 12.3.8 Subsegment Pricing and Adoption Trends
- 12.3.9 Leading Suppliers and Competition
- 12.3.10 Regional Demand and Opportunities
- 12.4 By Revenue Model - Market Size and Forecast, 2025-2035
- 12.4.1 Segment Definition and Scope
- 12.4.2 Historical Market Size, 2018-2025
- 12.4.3 Revenue Forecast, 2025-2035
- 12.4.4 Volume Forecast, 2025-2035
- 12.4.5 Base-Year Market Share, 2025
- 12.4.6 Segment CAGR and Growth Drivers
- 12.4.7 Subsegment Market Size and Forecast
- 12.4.7.1 Commercial OEM
- 12.4.7.2 Business and General Aviation OEM
- 12.4.7.3 Military OEM and R&D
- 12.4.7.4 MRO and Aviation Services
- 12.4.8 Subsegment Pricing and Adoption Trends
- 12.4.9 Leading Suppliers and Competition
- 12.4.10 Regional Demand and Opportunities
- 12.5 By Application - Market Size and Forecast, 2025-2035
- 12.5.1 Segment Definition and Scope
- 12.5.2 Historical Market Size, 2018-2025
- 12.5.3 Revenue Forecast, 2025-2035
- 12.5.4 Volume Forecast, 2025-2035
- 12.5.5 Base-Year Market Share, 2025
- 12.5.6 Segment CAGR and Growth Drivers
- 12.5.7 Subsegment Market Size and Forecast
- 12.5.7.1 Passenger and Cargo Transport
- 12.5.7.2 Defense and Security Missions
- 12.5.7.3 Business and Utility Flying
- 12.5.8 Subsegment Pricing and Adoption Trends
- 12.5.9 Leading Suppliers and Competition
- 12.5.10 Regional Demand and Opportunities
- 12.6 Segment Growth Comparison
- 12.7 Segment Attractiveness and Priority Matrix
Chapter 13 USA Aircraft End-Use and Application Market Outlook
- 13.1 End-Use Industry and Customer Demand Structure
- 13.2 Leading Applications and Customer Groups
- 13.3 End-Use Market Size, Share and Forecast
- 13.4 Major End-Use Industry Deep Dives
- 13.4.1 Customer Requirements and Use Cases
- 13.4.2 Demand and Replacement Cycles
- 13.4.3 Technical and Regulatory Considerations
- 13.4.4 Purchasing and Procurement Models
- 13.4.5 Leading Vendors and Distribution Channels
- 13.4.6 Forecast and Commercial Opportunities
- 13.5 Emerging Applications and Cross-Segment Demand
- 13.6 End-Use Industry Investment Priorities
Chapter 14 USA Aircraft Geographic Market Outlook, 2025-2035
- 14.1 Domestic Market Distribution and Demand Clusters
- 14.2 State- or Province-Wise Market Size and Forecast, 2025-2035
- 14.3 City and Metropolitan Market Outlook
- 14.4 Industrial, Manufacturing and Commercial Clusters
- 14.5 Geographic Concentration of Key End Users
- 14.6 Local Pricing and Purchasing Differences
- 14.7 Domestic Production Facilities and Capacity Map
- 14.8 Local Infrastructure and Project Pipeline
- 14.9 State-Level Policy and Incentive Differences
- 14.10 Subnational Investment Hotspots and Opportunities
- 14.11 Distribution and Logistics Networks
- 14.12 Domestic Competitive Footprint
Chapter 15 USA Aircraft Technology, Innovation and Sustainability Outlook
- 15.1 Technology Landscape and Maturity
- 15.2 Product, Process and Service Innovation
- 15.3 AI, Automation and Digital Tools in the Industry
- 15.4 Technology Adoption and Performance Benchmarking
- 15.5 Innovation Pipeline and R&D Investment
- 15.6 Patent and Intellectual Property Trends
- 15.7 Energy Efficiency and Resource Management
- 15.8 Sustainability, Recycling and Circularity
- 15.9 Technology Roadmap, 2025-2035
- 15.10 Risks of Obsolescence and Technology Substitution
Chapter 16 USA Aircraft Market Key Strategic Imperatives
- 16.1 Growth and Market Entry Priorities
- 16.2 High-Return Products and Segments
- 16.3 Pricing, Profitability and Cost Optimization
- 16.4 Technology Investment and Product Differentiation
- 16.5 Supply Chain Localization and Resilience
- 16.6 Distribution and Customer Acquisition
- 16.7 Partnership, Acquisition and Capacity Strategy
- 16.8 Regional Expansion Priorities
- 16.9 Short-, Medium- and Long-Term Actions
Chapter 17 Competition Outlook
- 17.1 Industry Competition Characteristics
- 17.2 Market Structure and Concentration
- 17.3 Market Share and Competitive Positioning, 2025
- 17.4 Company-Wise Revenue and Product Benchmarking
- 17.5 Production and Service Capacity Benchmarking
- 17.6 Technology, Pricing and Differentiation
- 17.7 Regional Footprint and Distribution Strength
- 17.8 Mergers, Acquisitions and Strategic Alliances
- 17.9 New Entrants and Competitive Threats
- 17.10 Porter's Five Forces and Industry Attractiveness
- 17.11 Competitive Outlook, 2025-2035
Chapter 18 Company Profiles
- 18.1 Company Coverage and Selection Criteria
- 18.2 The Boeing Company
- 18.2.1 Business Description
- 18.2.2 Company Ownership and Geographic Presence
- 18.2.3 Product and Service Portfolio
- 18.2.4 Manufacturing and Operating Footprint
- 18.2.5 Production Capacity and Expansion Plans
- 18.2.6 Financial Performance and Investment
- 18.2.7 Market Share and Competitive Position
- 18.2.8 Technology and Innovation Capabilities
- 18.2.9 Strategic Alliances or Partnerships
- 18.2.10 Recent Developments
- 18.2.11 Growth Strategy and Outlook
- 18.3 Lockheed Martin Corporation
- 18.4 Northrop Grumman Corporation
- 18.5 General Dynamics (Gulfstream Aerospace)
- 18.6 Textron Inc. (Textron Aviation and Bell)
- 18.7 General Atomics Aeronautical Systems
- 18.8 Anduril Industries
- 18.9 RTX Corporation (Pratt & Whitney)
- 18.10 Cirrus Aircraft
- 18.11 Joby Aviation
- 18.12 Other Relevant Market Participants
Note: Every listed company is profiled on the structure shown under the first company. The company list is preliminary and may change based on research findings, market developments, data availability and client requirements.
Chapter 19 Disclaimer
- 19.1 Research and Forecast Disclaimer
- 19.2 Data Source and Estimation Limitations
Note: The depth of individual sections depends on data availability for this market. Volume, capacity, trade and other unit-based metrics are included where applicable.