USA air traffic management enters a funded rebuild
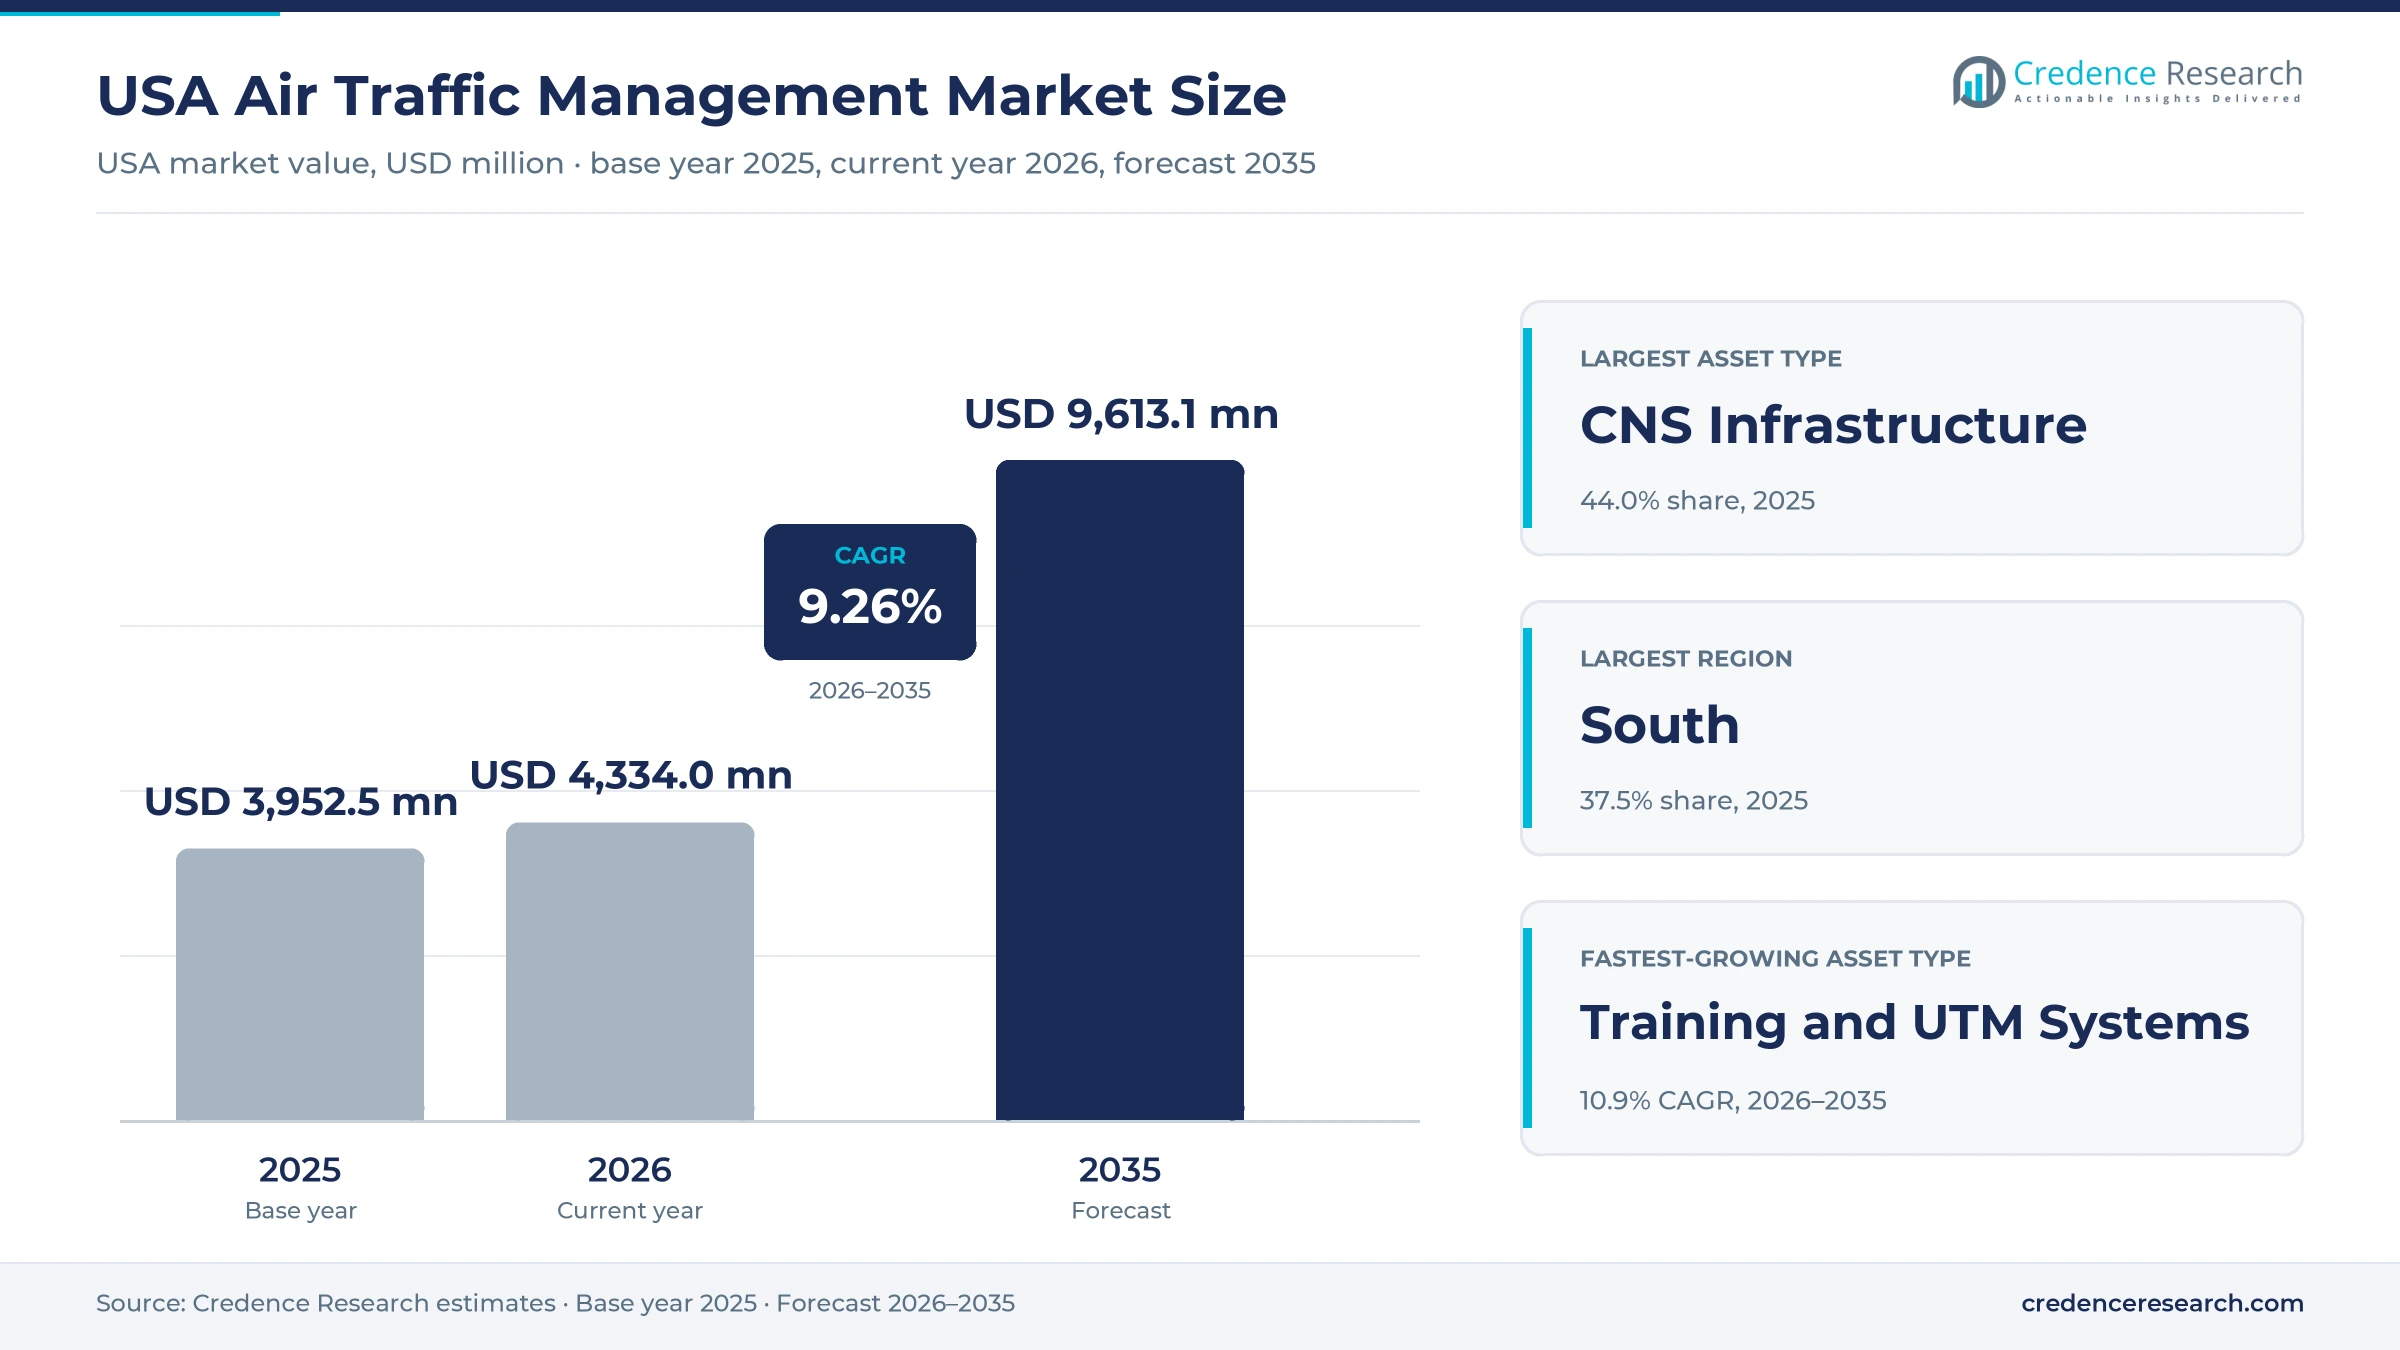
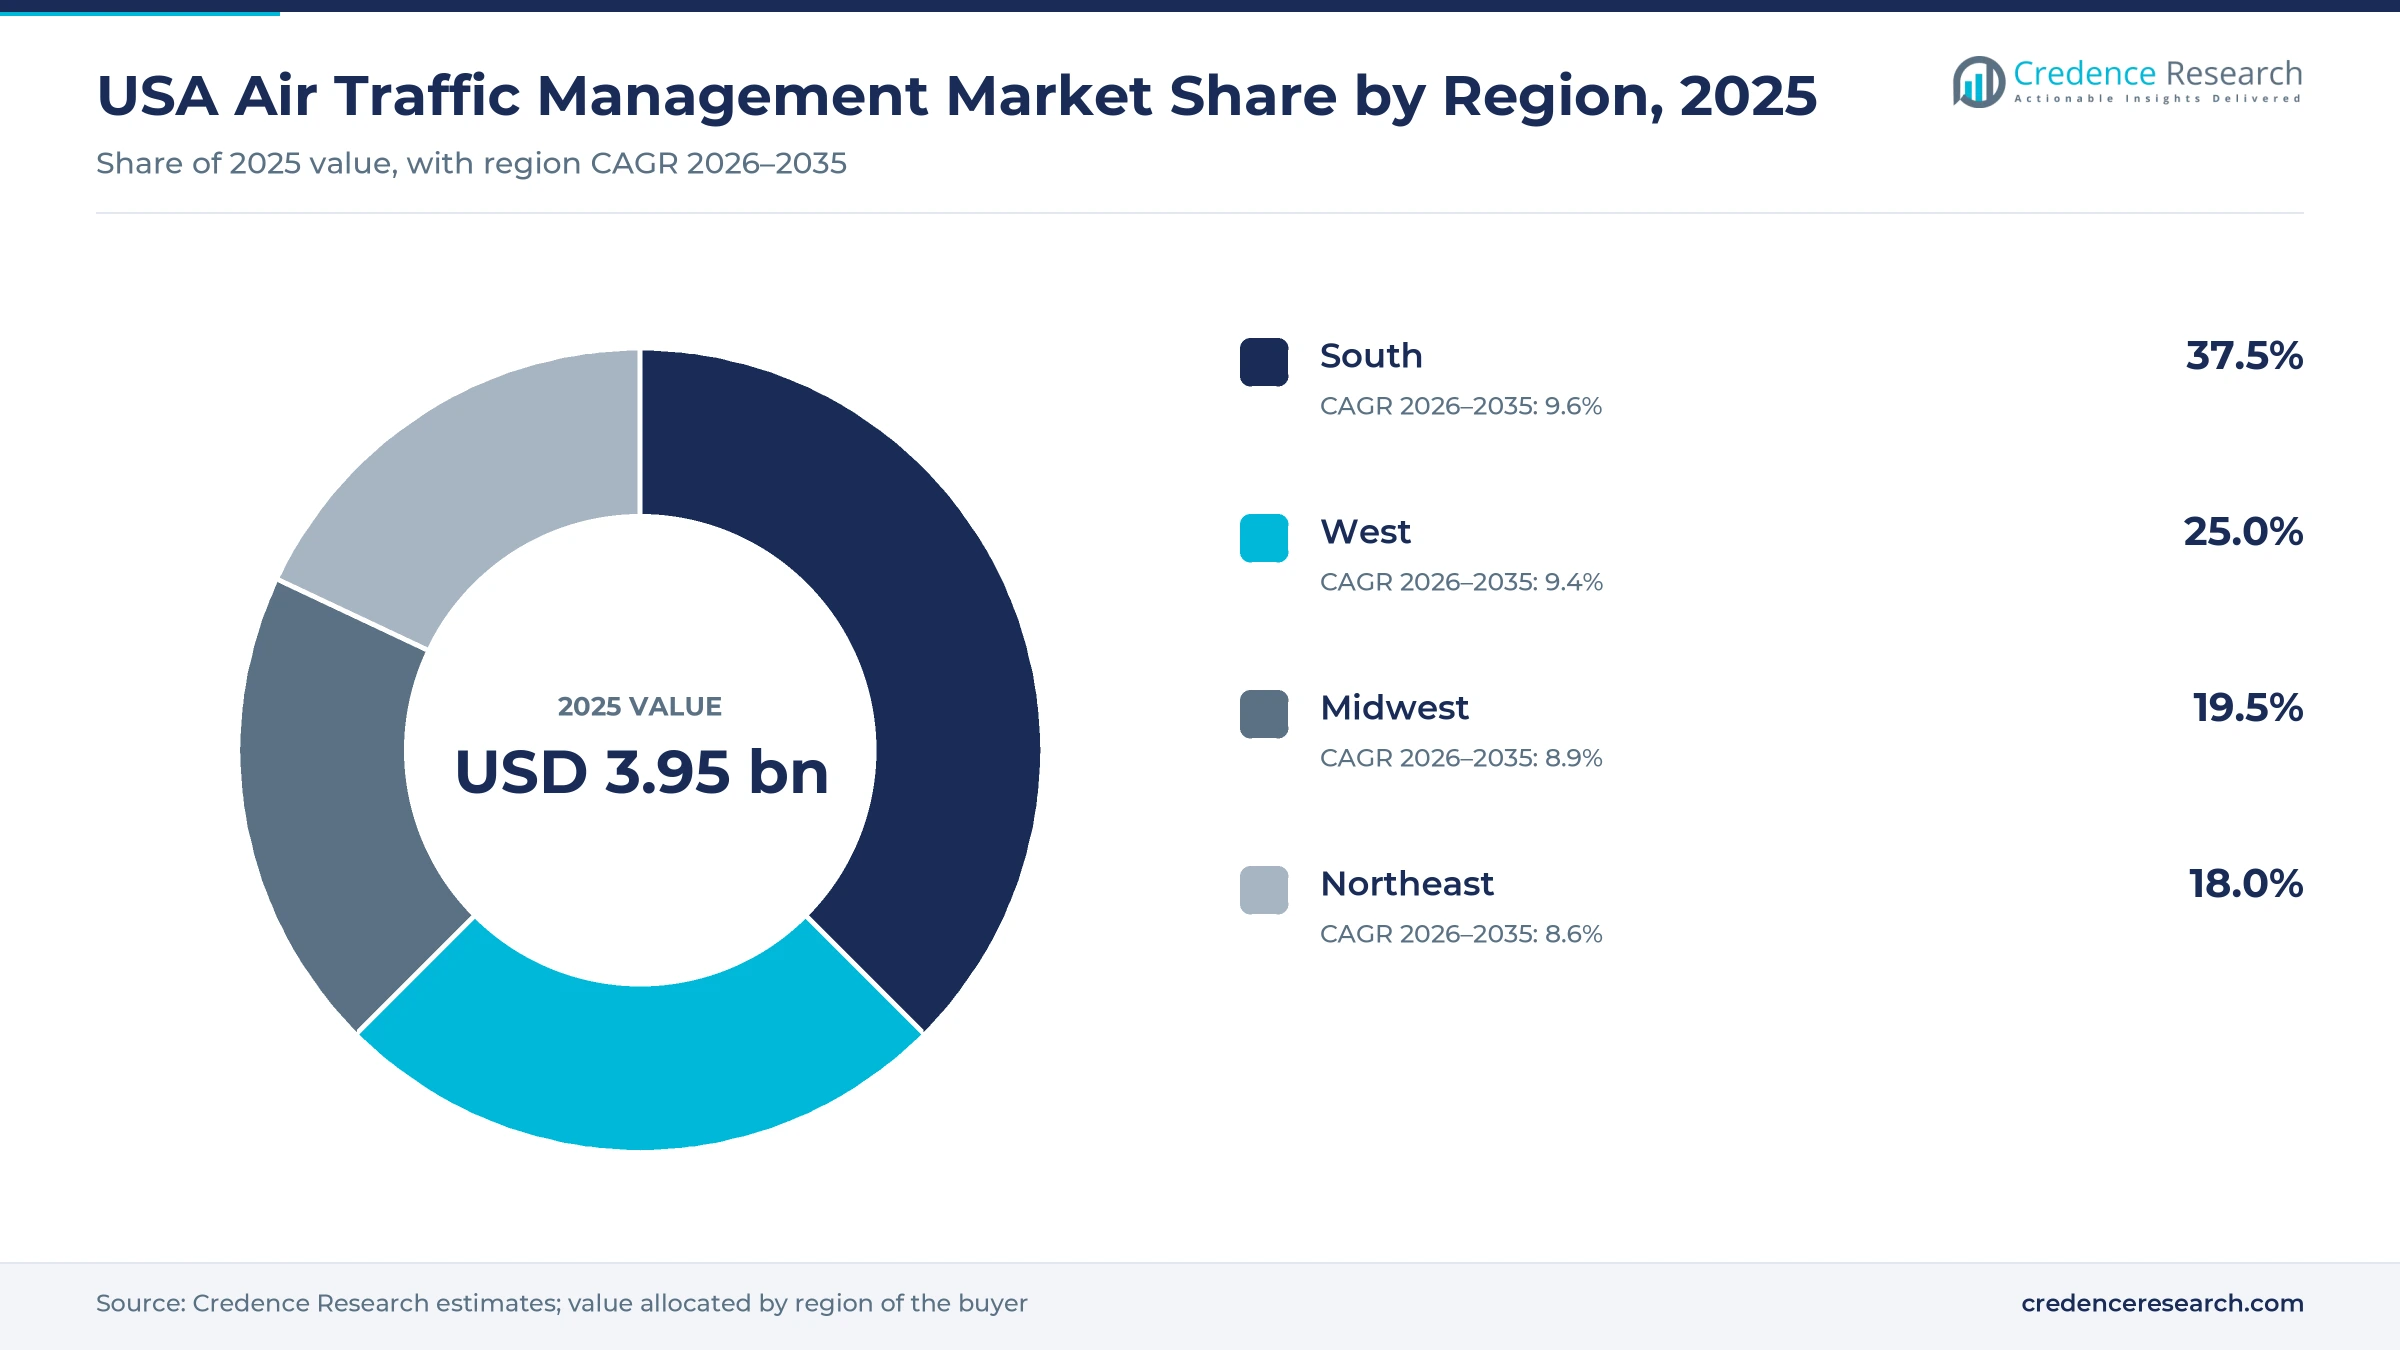
The USA air traffic management market was valued at USD 3.95 billion in 2025 and is projected to increase from USD 4.33 billion in 2026 to USD 9.61 billion by 2035, registering a CAGR of 9.26% during 2026–2035. Demand comes from the Federal Aviation Administration, which is replacing radars, radios, voice switches and copper circuits that it can no longer sustain, and from airports, contract tower operators and drone service providers that buy their own systems. The South held the largest regional share, 37.5% in 2025, because it hosts the most towers, hub airports and en route facilities. The South is also the fastest-growing region at 9.6% a year, as its population and traffic expand faster than elsewhere. The main commercial change is the move to a single prime integrator that manages dozens of equipment suppliers under performance-based fees.
Which systems and services the U.S. figures include
The market covers equipment, software and services used to separate and sequence aircraft in U.S. airspace. It includes tower, terminal and en route automation, surveillance radars, radios, voice switches, telecommunications links, flow and aeronautical information systems, controller simulators and drone traffic management services, plus integration and sustainment contracts.
Controller salaries, airport construction, aircraft avionics sold to airlines and military command systems are excluded. The value chain runs from component makers and radar, radio and software specialists to network carriers, system integrators and the FAA technicians and contract staff who run the National Airspace System.
USA Air Traffic Management Market Insights
- The USA air traffic management market grows from USD 3.95 billion in 2025 to USD 9.61 billion by 2035 at a 9.26% CAGR, as federal funds replace aging radars, radios and networks.
- The South held 37.5% of 2025 value, the largest regional share, backed by its hub airports, towers and fast population growth.
- CNS infrastructure led asset types with 44.0% of 2025 value, while training and UTM systems grow fastest at 10.9% a year.
- The FAA named Peraton prime integrator of the new air traffic control system on Dec. 4, 2025, with performance-based fees.
- Rohde & Schwarz USA won a USD 4.9 billion award in April 2026 to install up to 462 digital voice switches.
CNS hardware leads while training and UTM grow fastest
Why CNS hardware leads and training systems grow fastest
Based on asset type, the market is categorized into ATC systems, CNS infrastructure, flow and information systems, and training and UTM systems. CNS Infrastructure led with 44.0% of 2025 value because about USD 4.75 billion of the 2025 reconciliation money goes to telecommunications and USD 3 billion to radar replacement, according to Holland & Knight. Training and UTM Systems grow fastest at 10.9% a year, as the Transportation Department plans Tower Simulation Systems at 113 control towers. Hardware absorbs the first wave, and simulators and drone services follow as new systems need trained staff.
Why the FAA dominates and contract towers grow fastest
Based on customer type, the market is categorized into FAA ATO, contract tower operators, airport owners and airline and UTM operators. FAA ATO led with 74.0% of 2025 value because the agency owns the network of about 4,600 round-the-clock facilities that AT&T is now preparing to connect, Nextgov reported in August 2026. Contract Tower Operators grow fastest at 10.6% a year, as the final FY2026 bill gave the program USD 279.2 million, USD 23.2 million more than before, enough to fund all 266 towers and add new ones, according to AAAE. Small airports gain staffed towers without waiting for federal hiring.
Why modernization leads and new systems grow fastest
Based on project type, the market is categorized into new system deployment, system modernization and lifecycle support. System Modernization led with 49.0% of 2025 value because most current spending replaces assets in place, and the FAA is swapping old radars for commercially available models by June 2028, AIN reported in January 2026. New System Deployment grows fastest at 10.1% a year, as the plan includes one new consolidated air route traffic control center, the first since the 1960s, and one new consolidated TRACON. Greenfield facilities carry larger and longer contracts than like-for-like swaps.
Why equipment contracts lead and managed services grow
Based on contracting model, the market is categorized into prime integration contracts, specialist equipment contracts and managed service contracts. Specialist Equipment Contracts led with 42.0% of 2025 value because the FAA still buys radars, radios and voice switches through separate awards to Collins Aerospace, Indra and Rohde & Schwarz. Managed Service Contracts grow fastest at 10.3% a year, as L3Harris announced on July 1, 2026 that its new surveillance contract covers more than 700 ground stations through 2045. Long service terms turn one-off equipment sales into recurring revenue for the winners.
| Segment Group | Leading Sub-segment | Share, 2025 | Fastest-growing Sub-segment | CAGR, 2026–2035 |
|---|---|---|---|---|
| By Asset Type | CNS Infrastructure | 44.0% | Training and UTM Systems | 10.9% |
| By Customer Type | FAA ATO | 74.0% | Contract Tower Operators | 10.6% |
| By Project Type | System Modernization | 49.0% | New System Deployment | 10.1% |
| By Contracting Model | Specialist Equipment Contracts | 42.0% | Managed Service Contracts | 10.3% |
Unit prices show where the federal money goes
Pricing in this market is set contract by contract, with the FAA paying for equipment, installation, testing and years of sustainment in one award, so unit values include far more than hardware. Voice switches carry the highest value per unit because each replaces a facility-wide analog system and comes with cutover support. Radar prices are lower per unit since the FAA asked for commercially available models rather than custom designs. For suppliers, margins depend on hitting schedules, because the prime integrator fee rises or falls with delivery.
| System or contract | Typical price or fee | Basis |
|---|---|---|
| Digital voice switch replacement | About USD 10.6 mn per switch, including lifecycle support | Credence Research estimate from the USD 4.9 bn award for up to 462 switches |
| Terminal and en route surveillance radar | About USD 1.3 mn per radar | Credence Research estimate from USD 780 mn of Collins and Indra awards for up to 612 radars |
| Contract tower operation | About USD 1.0 mn per tower a year | Credence Research estimate from USD 279.2 mn for 266 towers, FY2026 |
| New physical tower at a small airport | USD 17.8 mn total project cost | Town of Leesburg, Va., tower plan, June 2026 |
| Prime integrator fee | 3% fixed profit plus up to 6% incentive, 3% holdback | Holland & Knight summary, April 2026 |
Request a Free Sample
Fill in your details and we'll send you a free sample report.
- Sample data tables & charts
- Research methodology
Appropriations, fiber and staffing push orders forward
Funded systems modernization releases multiyear orders
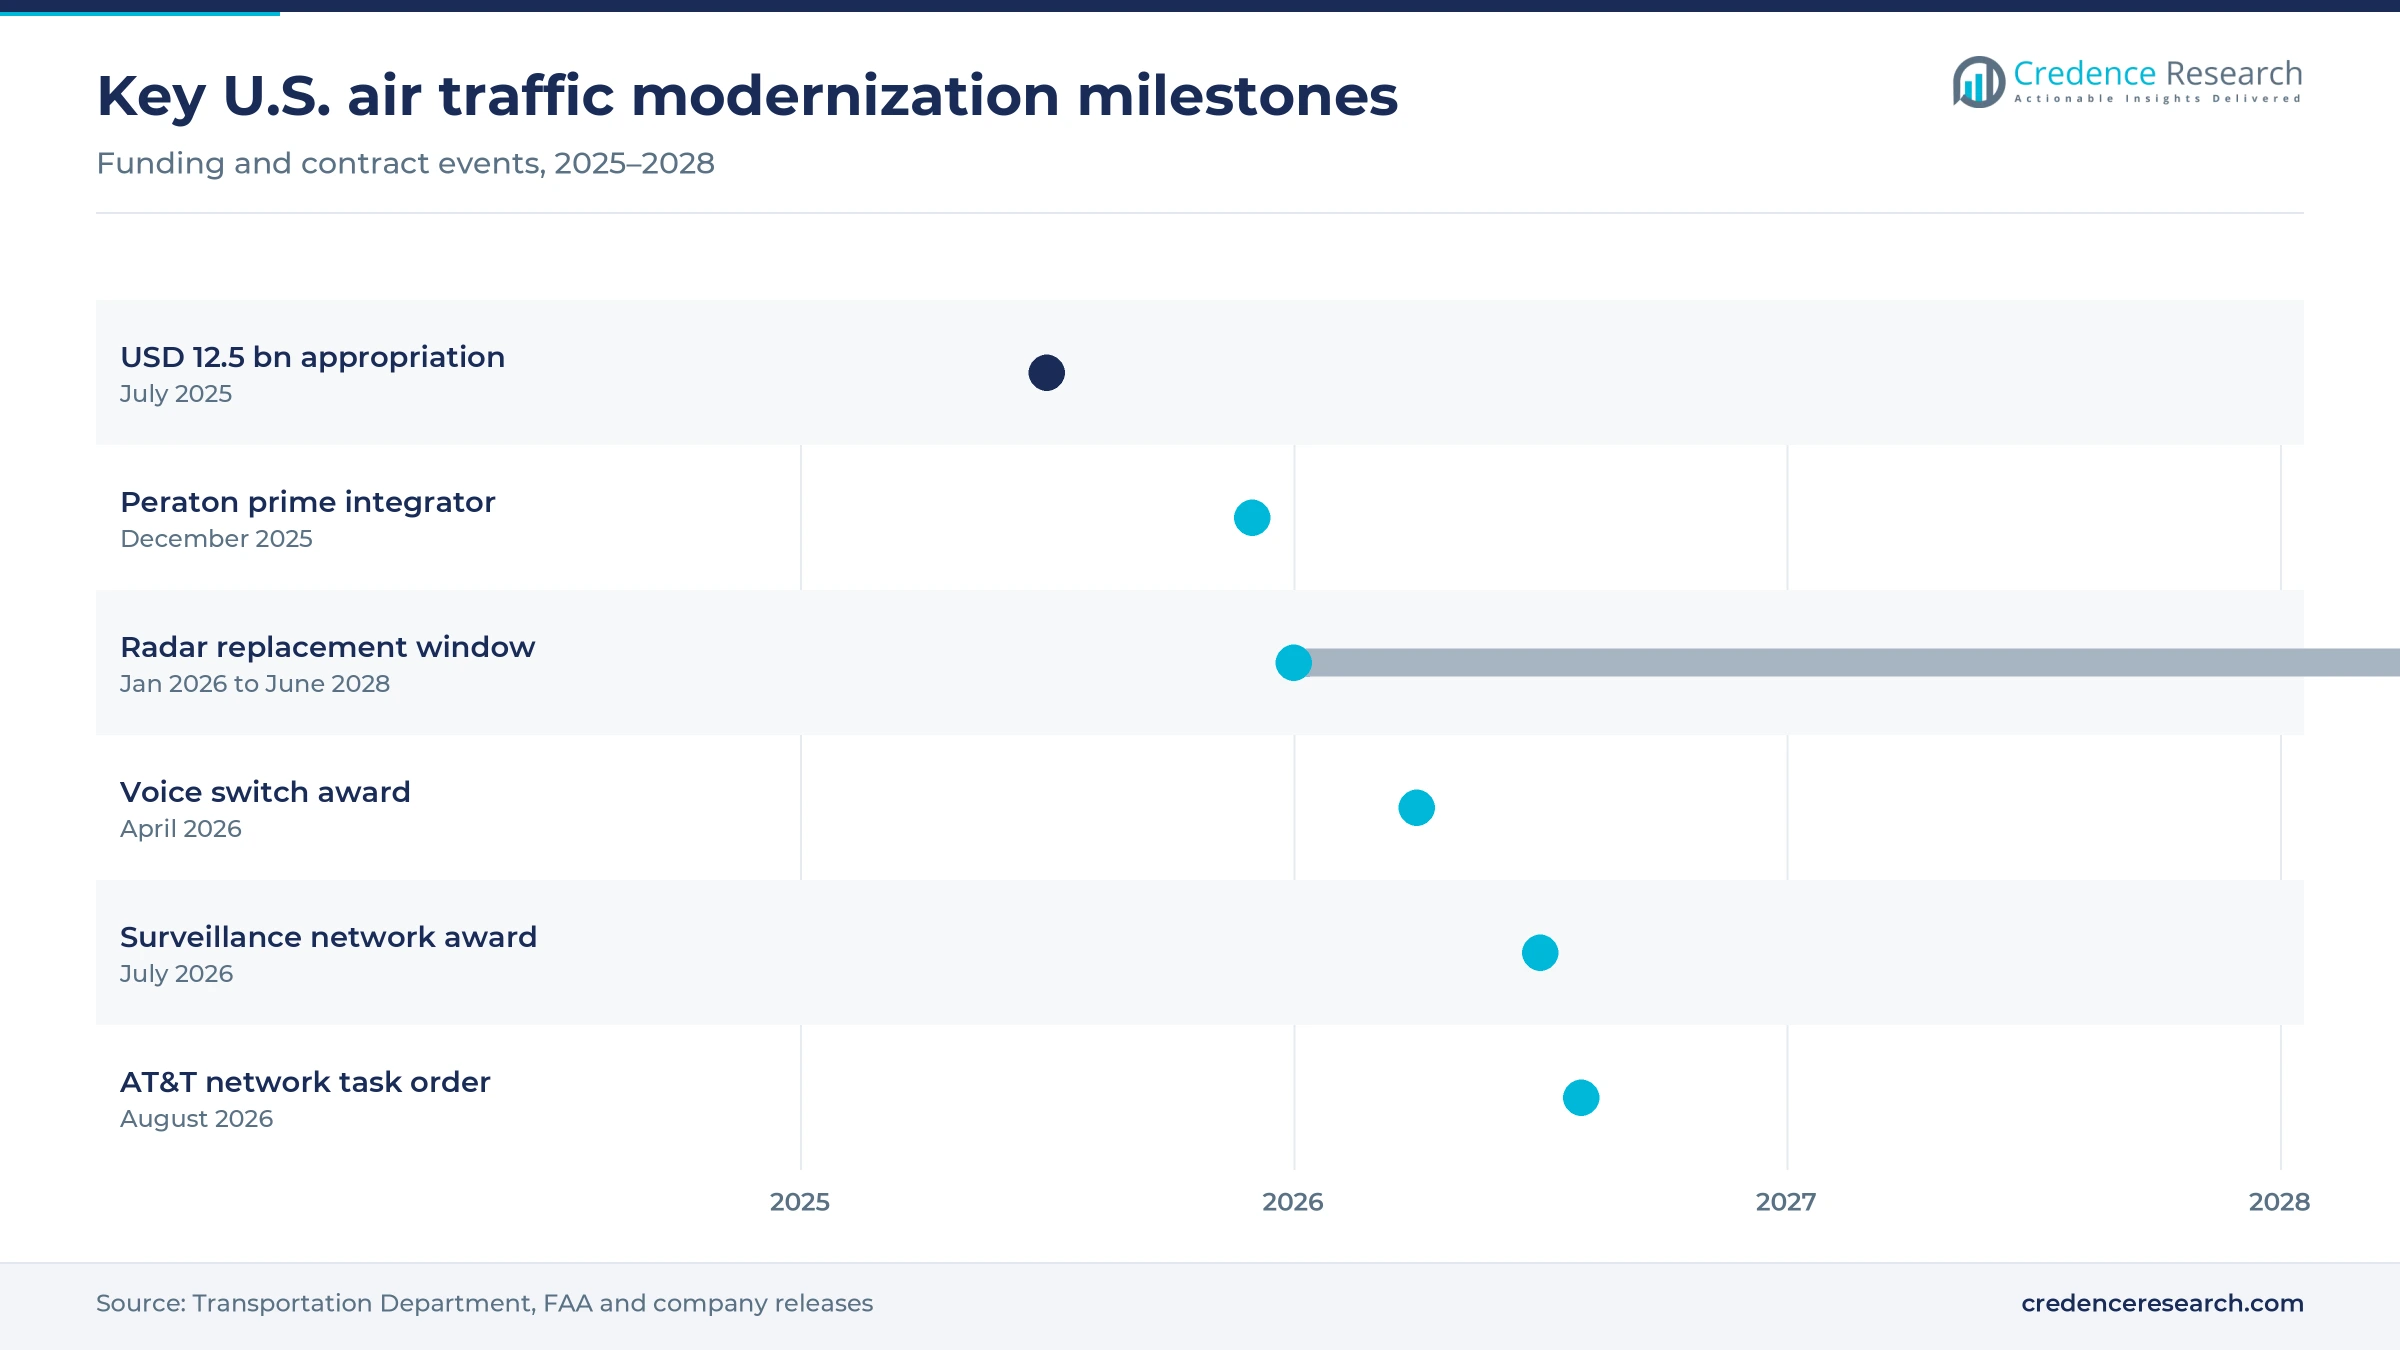
Funded systems modernization is the core reason orders are rising, because Congress has moved from studies to appropriated money. The reconciliation act signed on July 4, 2025 provided USD 12.5 billion for air traffic control, and officials say about USD 20 billion more is needed to finish the job, according to Holland & Knight. The final FY2026 spending bill also set Facilities and Equipment at USD 4 billion, USD 823.7 million above the prior level, AAAE reported in January 2026. Washington Technology reported that the department put the full estimate at USD 31.5 billion in July 2025. Suppliers therefore see firm demand through 2028, while the size of later phases still depends on new appropriations.
Digital communications migration replaces copper and analog
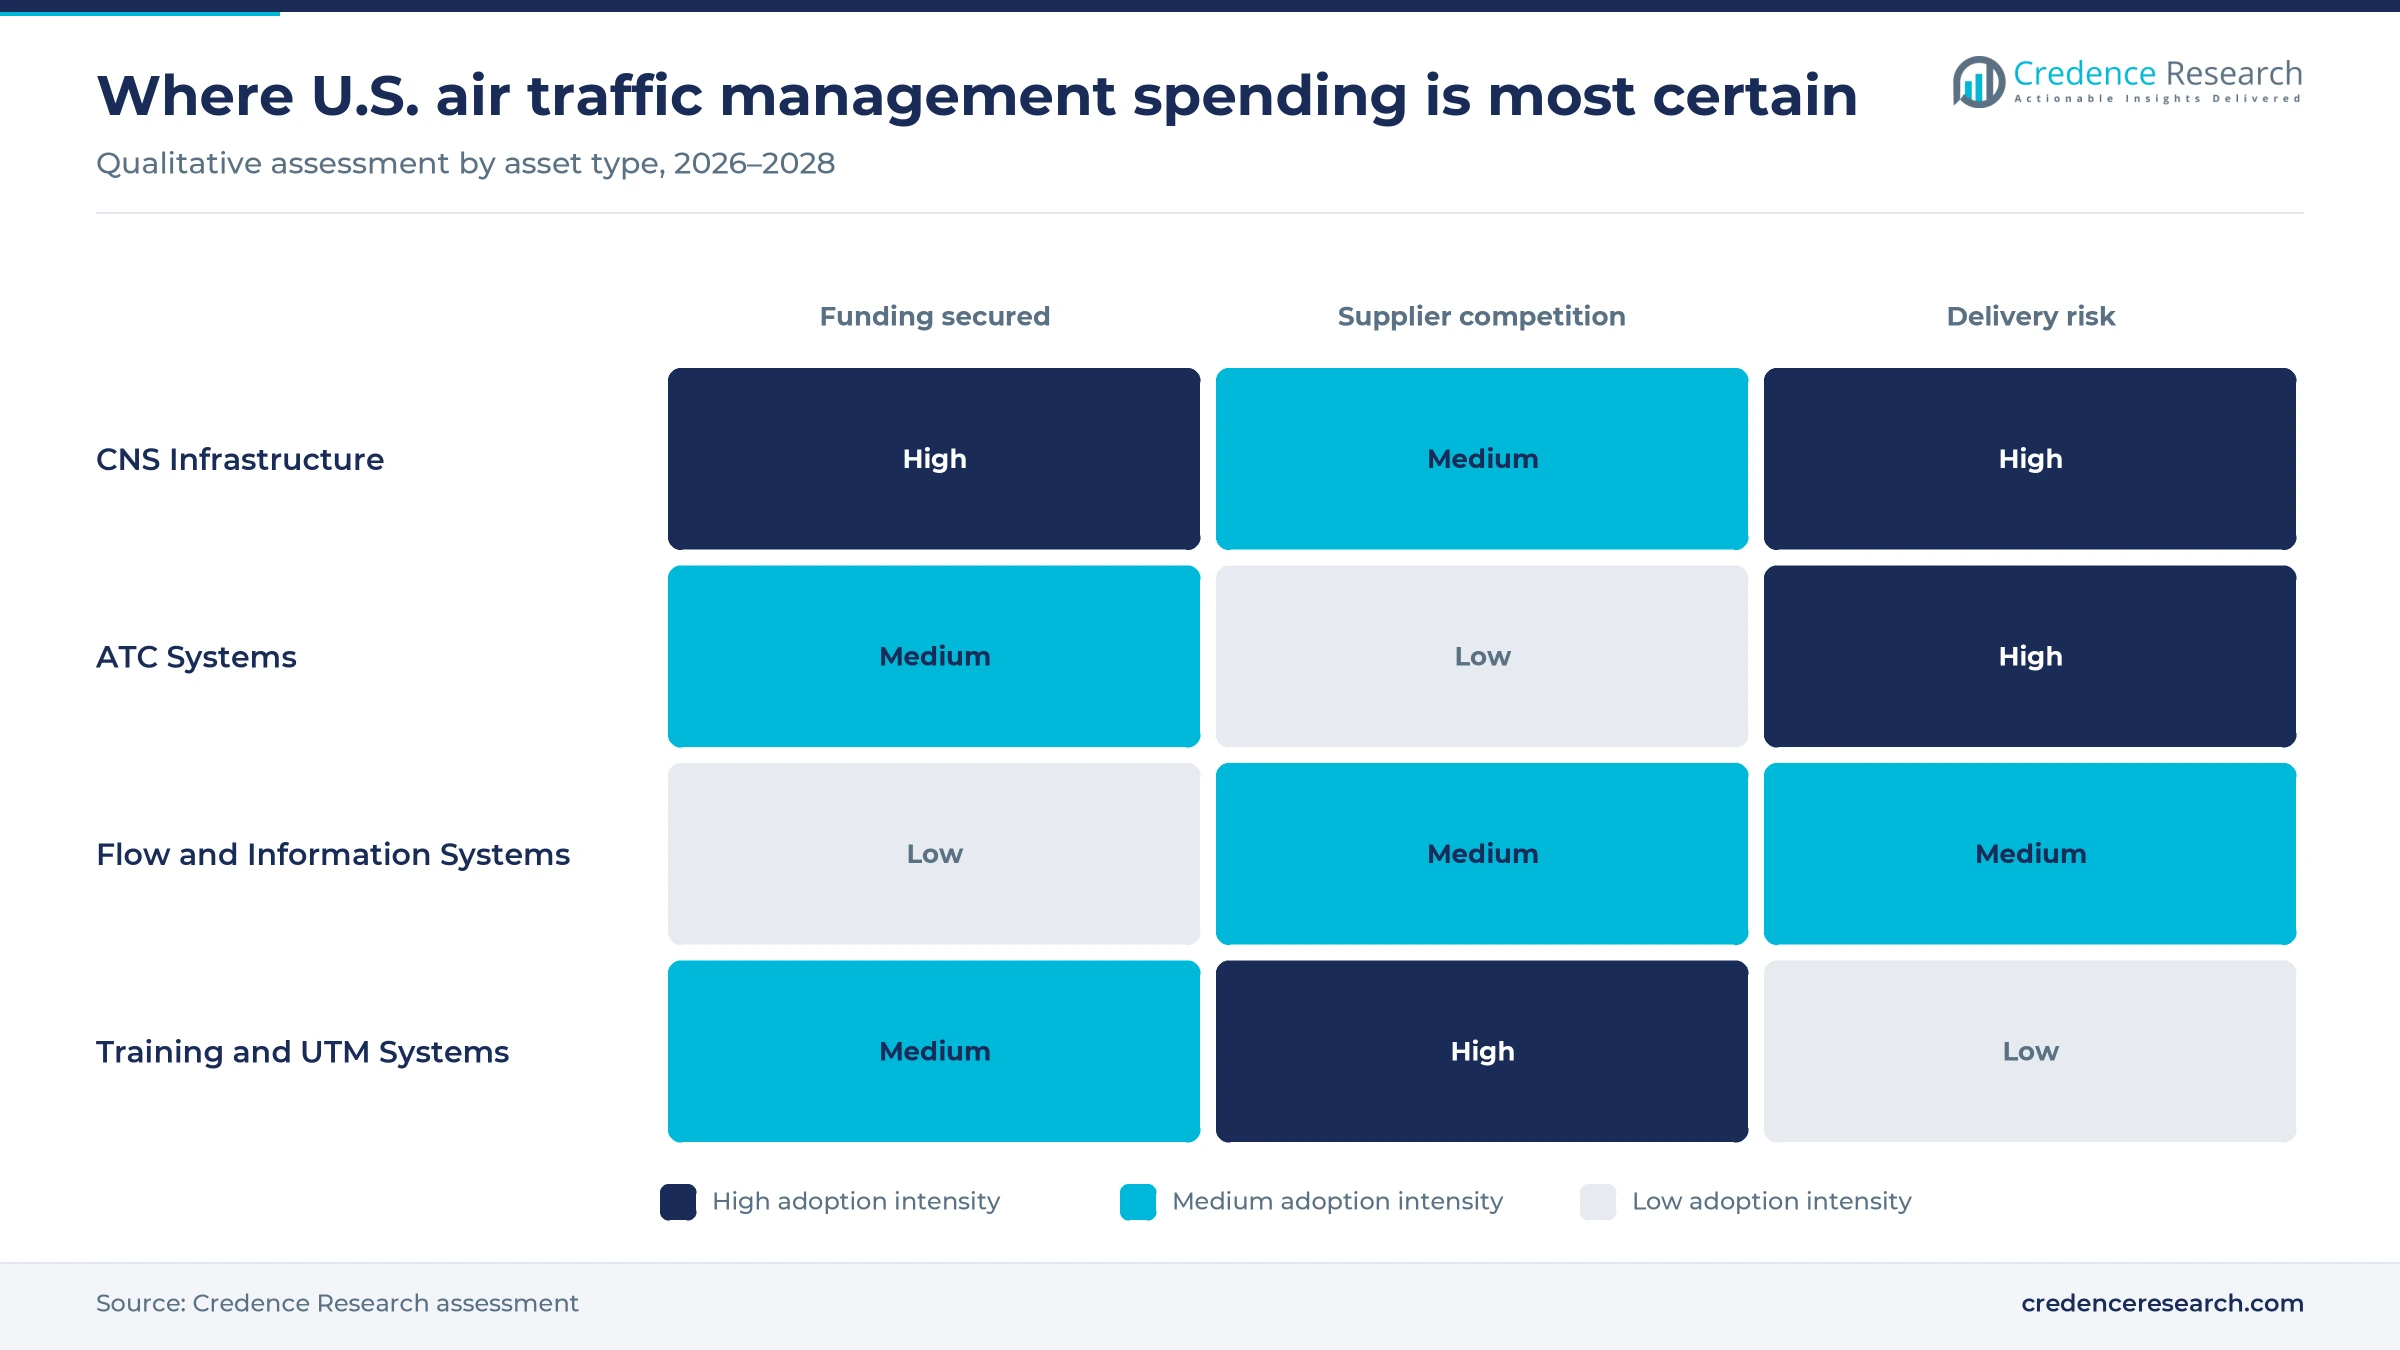
Digital communications migration is the largest single work stream, because copper circuits and analog radios link every tower, approach facility and en route center. The Transportation Department plans 27,625 new radios and 5,170 high-speed network connections across the system, using fiber, satellite and wireless links. L3Harris says 70% of sites in the FAA network had been upgraded as of Nov. 2, 2026, across more than 4,400 facilities and 29,000 services. Rohde & Schwarz USA announced on April 21, 2026 that it had won the voice switch contract, with more than 40 switches already installed. Once networks and switches are digital, the FAA can buy software and data services that copper could not support.
Operational capacity and training expand the controller base
Operational capacity and training spending rises because new systems are useless without enough qualified controllers to run them. The FAA hired a record 2,235 controller trainees in the latest fiscal year, and its workforce plan keeps hiring high through the end of the decade. The latest spending bill funds about 2,500 more controllers, according to AAAE. The FAA says it handles 44,360 flights a day, so every added controller position supports scarce peak capacity at busy facilities. More trainees mean more simulator hours, academy contracts and training software, and they allow the agency to open capacity that equipment alone cannot add.
Aging-system failures turn risk into spending urgency
Aging-system failures have turned modernization from a planning goal into a political priority. A GAO review published on Sept. 23, 2024 found that 105 of 138 FAA systems were unsustainable or potentially unsustainable, and 51 were rated unsustainable. The Transportation Department says delay minutes caused by equipment problems in 2025 ran about 300% above the 2010 to 2024 average. In May 2025, CNN reported that controllers handling Newark traffic lost radar and radio contact for 90 seconds, a repeat of an earlier outage. Each failure strengthens the case for replacement funding and shortens procurement timelines for suppliers.
Prime integration and surface data reshape procurement
Shift to a single prime integrator for the rebuild
Procurement is shifting from many separate FAA programs to one prime integrator that manages dozens of suppliers. The department announced Peraton as its choice on Dec. 4, 2025, after a competition in which Parsons, teamed with IBM, was the only other bidder, Washington Technology reported. The fee terms shown in the price table above pay Peraton more for on-time and on-budget delivery and let the FAA hold back part of the fee for damages. Holland & Knight's April 2026 summary counts about 50 vendors, roughly 4,600 sites and some 10 million labor hours. Equipment makers now sell through the integrator schedule, so delivery records weigh as heavily as price in each award.
Rise of surface awareness and digital tower data
Airport surface awareness and digital tower data are rising fast, because controllers at many airports still lack a live picture of aircraft and vehicles on the ground. AVweb reported on Dec. 1, 2025 that the FAA added 55 towers to the uAvionix Surface Awareness Initiative, on top of 14 airports already using it. By April 2026, new surface systems were deployed at 54 airports and 17 towers had moved to electronic flight strips, according to Holland & Knight. The Transportation Department plans Terminal Flight Data Manager tools at 89 airports, replacing paper strips with shared digital data. Tower software is becoming the part of the system that controllers touch most, alongside wider smart airport programs run by airport owners.
Opportunity in remote towers for small airports
Remote towers are an opening for small airports that cannot justify a staffed building, because cameras and displays can cost far less than a new structure. The FAA issued a request for proposals in April 2026 for up to 50 remote tower units over five years, with responses due June 26, 2026, Military and Aerospace Electronics reported. Town of Leesburg, Va., records say about USD 50 million is available for deployments and that a Frequentis system is in testing at the FAA Technical Center. Leesburg still prefers a physical tower, showing that certification and cost proof will decide uptake. Suppliers with a certified system can address hundreds of untowered airports.
Opportunity in drone traffic and data services
Drone traffic management is an opening for software and data firms, because routine beyond-visual-line-of-sight flights need automated deconfliction that the FAA will not run itself. The proposed Part 108 rule, published in the Federal Register on Aug. 7, 2025, pairs a new Part 146 that would certify automated data service providers. L3Harris said its July 2026 surveillance contract adds tracking of emerging entrants in the National Airspace System. Growth in commercial drone fleets for delivery and inspection will widen that customer base. Providers that win early certificates can lock in airline, drone operator and airport customers before rivals arrive.
A funding gap and a 2028 deadline strain delivery
A USD 20 billion gap clouds later phases
The funding gap is the largest risk, because the money provided so far covers mainly hardware and not the software phase. Holland & Knight noted in April 2026 that the FY2027 budget request contains no extra funding for the program through regular appropriations, and many lawmakers want proof of progress first. Software and automation suppliers face the most uncertainty about later orders. Clear milestone reporting to Congress is the main way the FAA and its integrator can protect later funding.
The 2028 deadline compresses every schedule
The 2028 deadline compresses procurement, testing and installation into a short window. The FAA said a new network competition would take at least 22 months, making the deadline impossible, so it moved AT&T into the program with a USD 74.3 million task order in August 2026, Nextgov reported. Faster awards reduce competition and raise the risk of rework when systems meet live operations. Suppliers with certified, ready products gain, while new entrants struggle to qualify in time.
Cutovers depend on a thin controller pipeline
Every new switch, radar and display must be cut over while controllers keep traffic moving, and staffing remains thin. The FAA said more than 1,300 trainees had graduated from its academy partway through fiscal 2026, well short of the record hiring class noted above, so many hires are still years from certification. Facilities short of certified staff cannot release controllers for training on new equipment. Integrators must therefore plan night cutovers, simulator time and phased transitions around local staffing.
Factory capacity limits the pace of radar swaps
Supplier capacity limits how quickly hundreds of radars and thousands of radios can be built and installed. Indra opened a 118,000-square-foot plant in Olathe, Kansas on April 20, 2026, to build FAA surveillance radars and more than 20,000 Park Air radios. A single factory ramping toward that output exposes the schedule to supply and labor shortfalls. Second-source plans and early component orders are the main protection for the FAA.
The South holds the deepest base of facilities and traffic
| Region | Value, 2025 (USD billion) | Share, 2025 | CAGR, 2026–2035 |
|---|---|---|---|
| South | 1.48 | 37.5% | 9.6% |
| West | 0.99 | 25.0% | 9.4% |
| Midwest | 0.77 | 19.5% | 8.9% |
| Northeast | 0.71 | 18.0% | 8.6% |
The South leads on hubs, towers and population growth
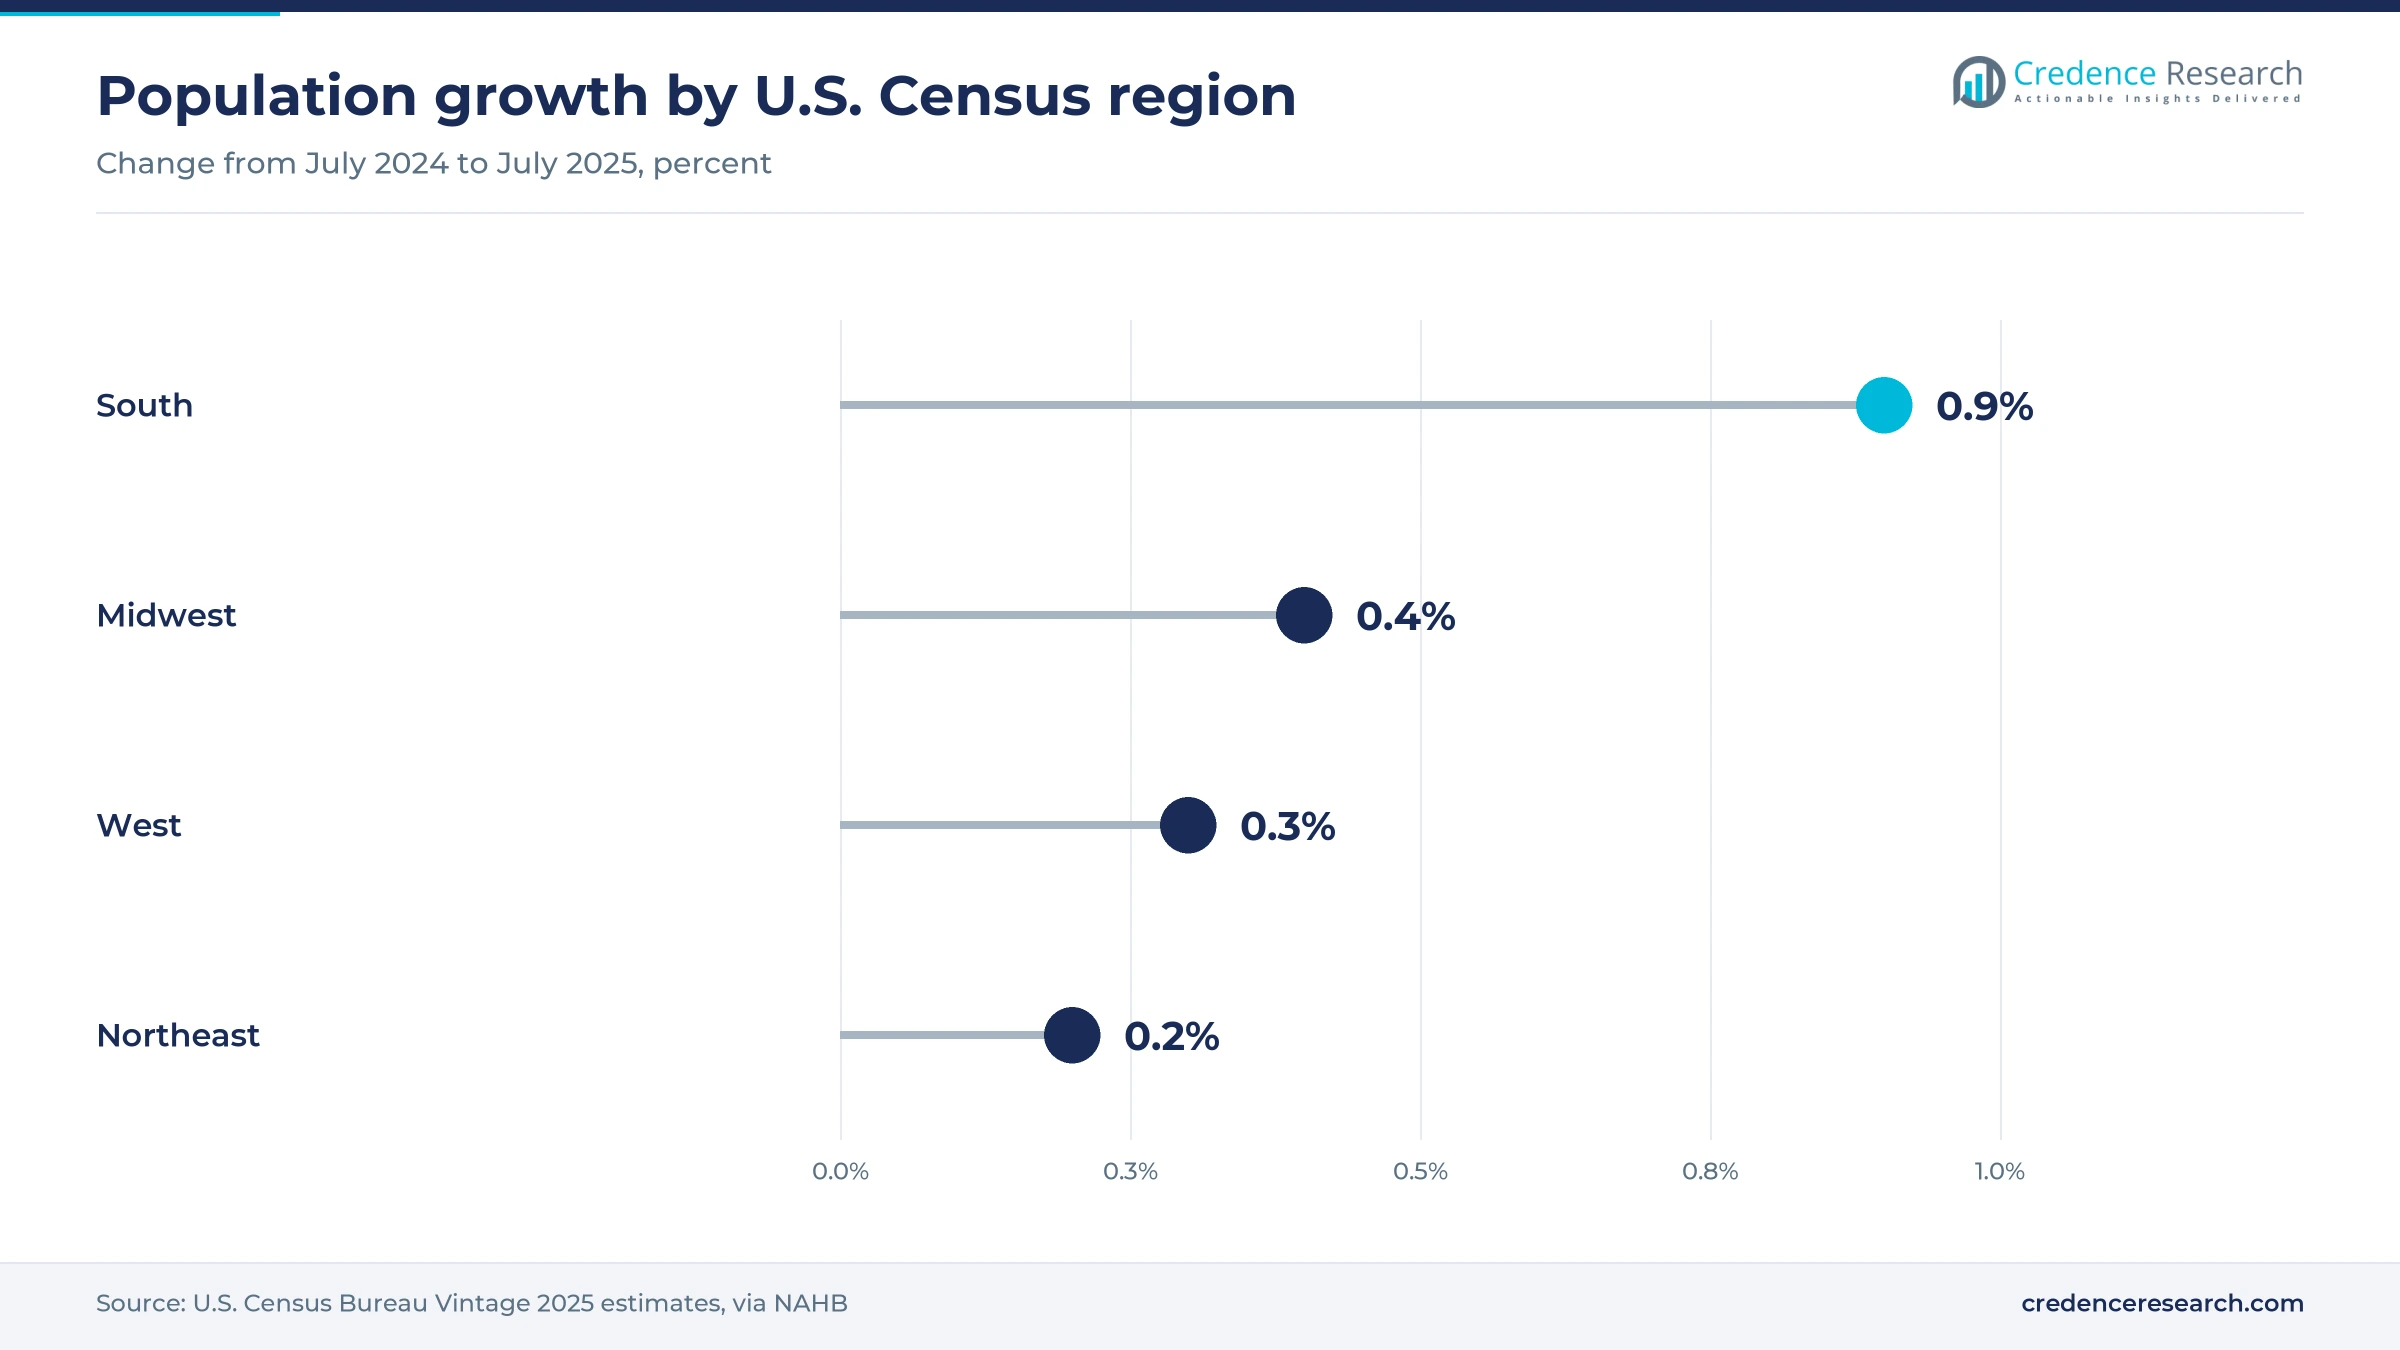
The South held 37.5% of 2025 value and is the fastest-growing region at 9.6% a year. The Census Bureau says the South grew 6% between April 2020 and July 2025, nearly double the national 3.1%, and that growth feeds traffic at its hub and secondary airports. The FAA began deploying Leidos tower software at Reagan National in June 2025, and AIN reported new surface radars at Reagan National and Newark in August 2026. Large hubs, many contract towers and several en route centers keep the South first in spending.
The West spreads spending over vast and remote airspace
The West held 25.0% of 2025 value and grows at 9.4% a year. Demand in the West rests more on airspace size and remote coverage than on new residents. The Transportation Department plans 110 more weather stations and 64 weather camera sites in Alaska, where many airports lack radar coverage. Mountain terrain and long distances also make the West the main market for satellite links and surveillance ground stations.
The Midwest gains from radar and radio manufacturing
The Midwest held 19.5% of 2025 value and grows at 8.9% a year. The region's weight in the market comes from supply as much as from airport demand. Indra expects more than 200 jobs over three years at its Olathe plant, which will triple its local workforce. Chicago and other hubs need en route and terminal upgrades, while the plant gives the region a share of supplier spending as well as buyer spending.
The Northeast concentrates complex terminal airspace
The Northeast held 18.0% of 2025 value and grows at 8.6% a year. Its slower pace reflects a mature network where most spending replaces equipment rather than adding facilities. The region still carries some of the busiest terminal airspace, and the Newark outages of 2025 made New York area facilities a priority for new radars, radios and fiber. The FAA Technical Center in Atlantic City, New Jersey, also tests new systems before national deployment.
Five federal awards since late 2025 set the rebuild moving
| Development | Status and market relevance |
|---|---|
| In December 2025, the FAA selected Peraton as prime integrator of the Brand New Air Traffic Control System. | Places one firm in charge of subcontractors, schedules and risk |
| In January 2026, the FAA awarded radar replacement contracts to Collins Aerospace and Indra Group USA. | Covers up to 612 radars to be replaced by June 2028 |
| In April 2026, Rohde & Schwarz USA announced its award for up to 462 digital voice switches. | Replaces analog voice systems at facilities nationwide |
| In July 2026, L3Harris won an FAA contract to upgrade the airspace surveillance network. | Extends operation of more than 700 ground stations through 2045 |
| In August 2026, the FAA issued AT&T its first task order for the FAA Enterprise Network Services program. | Starts design and transition for the future telecom backbone |
Three technology layers decide how the airspace is run
- Fixed hardware platforms such as radars, radios and voice switches still take the largest share of current spending, because they must be replaced site by site.
- Networked digital platforms link facilities over fiber, satellite and wireless circuits, which lets the FAA move voice and data between centers.
- Distributed cloud platforms host flow, flight data and drone services, and the FAA is asking vendors for a common automation platform to replace older systems.
- Surface surveillance tools give tower controllers a live view of aircraft and vehicles on runways and taxiways at airports without full radar coverage.
Need a Custom Version of This Report?
Tailor the scope, geography, or segments to your exact requirements.
- Custom geography or segment scope
- Direct access to our analyst team
Integration depth and FAA certification decide awards
Competition in the U.S. market is shaped by the FAA itself, which sets requirements, tests every product and decides how contracts are bundled. Peraton now sits above most hardware awards as prime integrator, which means equipment makers compete for its schedule as well as for FAA approval. Collins Aerospace and Indra split the radar replacement, Rohde & Schwarz holds voice switching, and L3Harris runs the legacy network and the surveillance ground stations. Leidos remains the main supplier of tower flight data software and of many automation systems. Newer firms such as uAvionix win where they can deploy fast at low cost. Price matters, but proven delivery at live facilities, cleared staff and the ability to support systems for decades decide most awards. Surveillance integration also matters for airports adding drone detection radar, because those tracks must reach the same tower displays that controllers use.
A few integrators and many specialists share the work
The U.S. supply side is organized in two clear tiers of firms. A small group of large federal integrators, Peraton, Leidos and L3Harris, holds the prime, automation and network roles, while specialists such as Collins Aerospace, Indra, Rohde & Schwarz and uAvionix supply radars, radios, switches and surface systems. Entry barriers are high, because every product must pass FAA testing and security review and suppliers need cleared field staff at thousands of sites. Margins sit mainly in software, integration and long service contracts, while hardware is priced competitively.
Companies profiled and their roles in this market
| Company | Type | Role in the market |
|---|---|---|
| Peraton | Prime integrator | Selected in December 2025 to manage subcontractors, schedules and risk for the new system |
| RTX Corporation / Collins Aerospace | Radar supplier | Supplies Condor Mk3 and ASR-XM radars under a USD 438 mn award |
| Indra Group USA | Radar and radio maker | Builds FAA radars and Park Air radios at its Olathe, Kansas plant |
| L3Harris Technologies | Network and surveillance operator | Upgrades the FAA telecom network and over 700 surveillance ground stations |
| Leidos Holdings | Automation and tower software | Deployed Terminal Flight Data Manager at Reagan National in 2025 |
| Rohde & Schwarz USA | Voice switch supplier | Installs up to 462 Certium digital voice switches |
| AT&T | Network carrier | Received the first FAA Enterprise Network Services task order in August 2026 |
| uAvionix | Surface awareness supplier | Equips 55 more towers with Surface Awareness Initiative systems |
The rebuild shifts value from parts to integration
Credence Research's view is that the U.S. market is moving from buying parts to buying outcomes. The first wave of federal money goes mostly to radars, radios, switches and fiber, but the lasting value will sit with the firms that integrate and run those assets for decades. Buyers should judge suppliers on certified delivery at live facilities, not only on unit price. Investors should watch whether Congress funds the software phase, because that decision separates a short hardware cycle from a decade of steady growth.
Federal budgets and contract awards anchor the model
The report uses 2025 as the base year and forecasts to 2035. Market values come from the Credence Research model, built from federal budgets and appropriations, FAA and Transportation Department program documents, published contract awards, company releases, GAO reviews and Census Bureau population data. Regional, segment and price estimates are Credence Research estimates derived from facility locations, contract scopes and award values. The report does not claim any primary interviews or buyer surveys.
Software funding after 2028 sets the upper range
The outlook to 2035 points to steady growth at a 9.26% CAGR, reaching USD 9.61 billion, with spending front-loaded into hardware through 2028 and then shifting toward software, data and managed services. The South should stay the largest region, while training and UTM systems gain share as new controllers and drone services scale. The main swing factor is congressional funding for the remaining program. Suppliers that prove delivery on the current wave will be best placed for the automation and cloud contracts that follow.
Congressional funding for software sets the range to 2035
The range of outcomes depends mainly on whether Congress funds the software and facilities phase after the first appropriation is spent. A downside case combines a funding pause after 2028 with schedule slips at the new en route center. The upside requires full funding of the remaining program and early certification of remote towers and drone data services.
| Scenario | CAGR, 2026–2035 | Value, 2035 | What has to hold |
|---|---|---|---|
| Downside | 6.8% | USD 7.81 billion | No new appropriations after 2028 and delays at new consolidated facilities |
| Base | 9.26% | USD 9.61 billion | Hardware finished near 2028 and software funded gradually through annual budgets |
| Upside | 11.1% | USD 11.14 billion | Remaining program funded in full and remote towers and drone services certified early |
Frequently Asked Questions
How big is the USA air traffic management market?
What is driving growth in U.S. air traffic management?
Which asset type leads the market?
Which region holds the largest share?
Who is the prime integrator of the new FAA system?
Which companies supply the new radars?
What is the biggest risk to the market?
Which segment grows fastest?
Table of Content
Chapter 1 Market Segmentation
- 1.1 Segmentation Framework
- 1.1.1 Product and Service Classification
- 1.1.2 Application and End-Use Classification
- 1.1.3 Technology and Solution Classification
- 1.1.4 Customer and Distribution Channel Classification
- 1.1.5 Geographic Segmentation
- 1.1.6 Market Segment Definitions and Boundaries
- 1.2 By Asset Type
- 1.2.1 CNS Infrastructure
- 1.2.2 ATC Systems
- 1.2.3 Flow and Information Systems
- 1.2.4 Training and UTM Systems
- 1.3 By Customer Type
- 1.3.1 FAA ATO
- 1.3.2 Contract Tower Operators
- 1.3.3 Airport Owners
- 1.3.4 Airline and UTM Operators
- 1.4 By Project Type
- 1.4.1 System Modernization
- 1.4.2 New System Deployment
- 1.4.3 Lifecycle Support
- 1.5 By Contracting Model
- 1.5.1 Specialist Equipment Contracts
- 1.5.2 Prime Integration Contracts
- 1.5.3 Managed Service Contracts
Chapter 2 Introduction
- 2.1 Report Objectives and Scope
- 2.2 Product Definition and Industry Terminology
- 2.3 Market Inclusions and Exclusions
- 2.4 Research Process
- 2.4.1 Primary Research and Expert Interviews
- 2.4.2 Secondary Research and Source Review
- 2.4.3 Top-Down and Bottom-Up Estimation
- 2.4.4 Data Triangulation and Verification
- 2.5 Market Size Measurement Basis
- 2.5.1 2025: USD 3.95 billion → 2035: USD 9.61 billion
- 2.6 Historical and Forecast Reference Periods
- 2.6.1 Historical Period: 2018-2025
- 2.6.2 Base Year: 2025
- 2.6.3 Forecast Period: 2025-2035
- 2.7 Research Assumptions and Limitations
Chapter 3 Executive Summary
- 3.1 Market Snapshot and Key Findings
- 3.2 Base-Year Market Size, 2025
- 3.3 Forecast Market Size, 2035
- 3.4 Revenue and Volume Growth Outlook
- 3.5 Key Demand and Supply Indicators
- 3.6 Leading Market Segments
- 3.7 Fastest-Growing Market Opportunities
- 3.8 Regional Performance Highlights
- 3.9 Technology and Industry Transformation
- 3.10 Competitive Landscape Summary
- 3.11 Analyst View and Strategic Implications
Chapter 4 USA Air Traffic Management Market Trends and Developments
- 4.1 Historical Industry Development, 2018-2025
- 4.2 Recent Market Trends and Developments
- 4.3 Demand and Customer Behavior Trends
- 4.4 Technology and Product Innovation
- 4.5 Artificial Intelligence, Automation and Digitalization
- 4.6 Local Manufacturing and Supply Chain Realignment
- 4.7 Industry Partnerships, Mergers and Acquisitions
- 4.8 Sustainability and Circular Economy Developments
- 4.9 Government and Private Sector Investment Trends
- 4.10 Emerging Business Models and Commercialization
- 4.11 Industry Developments and Announcements
Chapter 5 USA Air Traffic Management Market Production, Supply and Demand Analysis
- 5.1 Demand Trend and Consumption Analysis, 2018-2025
- 5.2 Demand Forecast, 2025-2035
- 5.3 Production and Output Trend, 2018-2025
- 5.4 Production and Output Forecast, 2025-2035
- 5.5 Installed Capacity and Capacity Utilization
- 5.6 Company-Wise Production Plants and Statistics
- 5.6.1 Installed Production Capacity
- 5.6.2 Actual Production
- 5.6.3 Planned Capacity and Expansion Targets
- 5.7 Supply Chain Structure and Procurement Trends
- 5.8 Supply-Demand Gap and Bottlenecks
- 5.9 Import Dependence and Sourcing Structure
- 5.10 Contract Manufacturing and Outsourcing
- 5.11 Regional Supply and Demand Concentration
Chapter 6 USA Air Traffic Management Market Pricing Analysis
- 6.1 Pricing Structure and Measurement
- 6.2 Historical Pricing Trends, 2018-2025
- 6.3 Pricing Outlook, 2025-2035
- 6.4 Average Selling Price and Unit Economics
- 6.5 Pricing by Product and Market Segment
- 6.6 Geographic Pricing Differences
- 6.7 Key Input, Energy, Labor and Logistics Costs
- 6.8 Contract Pricing and Purchasing Models
- 6.9 Pricing Sensitivity and Competitive Positioning
- 6.10 Price, Margin and Profitability Implications
Chapter 7 USA Air Traffic Management Market Dynamics
- 7.1 Market Growth Drivers
- 7.1.1 Demand-Side Drivers
- 7.1.2 Technology and Innovation Drivers
- 7.1.3 Infrastructure and Investment Drivers
- 7.1.4 Regulatory and Policy Drivers
- 7.2 Market Restraints
- 7.2.1 Cost and Affordability Constraints
- 7.2.2 Technology and Adoption Barriers
- 7.2.3 Supply Chain and Operational Constraints
- 7.3 Market Challenges
- 7.3.1 Competitive Pressure and Margin Erosion
- 7.3.2 Skills, Infrastructure and Implementation Gaps
- 7.4 Emerging Market Opportunities
- 7.5 Market Dynamics Impact and Time-Horizon Assessment
Chapter 8 USA Air Traffic Management Value Chain Analysis
- 8.1 Industry Value Chain Overview
- 8.2 Upstream Suppliers and Critical Inputs
- 8.3 Technology and Component Providers
- 8.4 Manufacturing or Service Delivery
- 8.5 Distribution, Channel Partners and Integrators
- 8.6 Downstream Applications and End Users
- 8.7 Value Addition and Profit Pools
- 8.8 Vertical Integration and Outsourcing
- 8.9 Supplier Concentration and Risk
- 8.10 Supply Chain Localization and Resilience
Chapter 9 USA Air Traffic Management Market Regulations and Policies
- 9.1 Relevant Laws, Standards and Compliance Frameworks
- 9.2 Product, Service, Safety and Quality Requirements
- 9.3 Government Policies, Incentives and Subsidies
- 9.4 Imports, Exports and Trade Barriers
- 9.5 Public Procurement and Local Content Requirements
- 9.6 Environmental and Sustainability Compliance
- 9.7 Upcoming Policy Changes and Market Implications
Chapter 10 USA Air Traffic Management Market Hotspots and Opportunities
- 10.1 Market Opportunity Mapping and Growth Hotspots
- 10.2 High-Growth Applications and Customer Groups
- 10.3 Underserved Markets and White-Space Opportunities
- 10.4 Emerging Technology and Product Opportunities
- 10.5 New Capacity and Investment Hotspots
- 10.6 Market Entry and Expansion Opportunities
- 10.7 Distribution and Partnership Opportunities
- 10.8 Near-Term and Long-Term Commercial Potential
- 10.9 Opportunity Attractiveness and Execution Risks
Chapter 11 USA Air Traffic Management Market Outlook, 2025-2035
- 11.1 Market Size and Analysis
- 11.1.1 Revenue (Market Measurement: 2025: USD 3.95 billion → 2035: USD 9.61 billion)
- 11.1.2 Market Volume and Quantity Sold
- 11.1.3 Historical Market Size, 2018-2025
- 11.1.4 Base-Year Market Size, 2025
- 11.2 Market Forecast, 2025-2035
- 11.2.1 Revenue Forecast to 2035
- 11.2.2 Volume Forecast to 2035
- 11.2.3 CAGR and Year-on-Year Growth
- 11.2.4 Incremental Revenue Opportunity
- 11.3 Forecast Assumptions and Scenario Analysis
- 11.3.1 Base-Case Forecast
- 11.3.2 Optimistic and Conservative Scenarios
- 11.3.3 Technology, Pricing and Policy Sensitivities
- 11.4 Market Attractiveness and Growth Outlook
Chapter 12 USA Air Traffic Management Market Segmentation and Outlook
- 12.1 Segmentation Summary and Market Shares, 2025
- 12.2 Largest and Fastest-Growing Segments
- 12.3 By Asset Type - Market Size and Forecast, 2025-2035
- 12.3.1 Segment Definition and Scope
- 12.3.2 Historical Market Size, 2018-2025
- 12.3.3 Revenue Forecast, 2025-2035
- 12.3.4 Volume Forecast, 2025-2035
- 12.3.5 Base-Year Market Share, 2025
- 12.3.6 Segment CAGR and Growth Drivers
- 12.3.7 Subsegment Market Size and Forecast
- 12.3.7.1 CNS Infrastructure
- 12.3.7.2 ATC Systems
- 12.3.7.3 Flow and Information Systems
- 12.3.7.4 Training and UTM Systems
- 12.3.8 Subsegment Pricing and Adoption Trends
- 12.3.9 Leading Suppliers and Competition
- 12.3.10 Regional Demand and Opportunities
- 12.4 By Customer Type - Market Size and Forecast, 2025-2035
- 12.4.1 Segment Definition and Scope
- 12.4.2 Historical Market Size, 2018-2025
- 12.4.3 Revenue Forecast, 2025-2035
- 12.4.4 Volume Forecast, 2025-2035
- 12.4.5 Base-Year Market Share, 2025
- 12.4.6 Segment CAGR and Growth Drivers
- 12.4.7 Subsegment Market Size and Forecast
- 12.4.7.1 FAA ATO
- 12.4.7.2 Contract Tower Operators
- 12.4.7.3 Airport Owners
- 12.4.7.4 Airline and UTM Operators
- 12.4.8 Subsegment Pricing and Adoption Trends
- 12.4.9 Leading Suppliers and Competition
- 12.4.10 Regional Demand and Opportunities
- 12.5 By Project Type - Market Size and Forecast, 2025-2035
- 12.5.1 Segment Definition and Scope
- 12.5.2 Historical Market Size, 2018-2025
- 12.5.3 Revenue Forecast, 2025-2035
- 12.5.4 Volume Forecast, 2025-2035
- 12.5.5 Base-Year Market Share, 2025
- 12.5.6 Segment CAGR and Growth Drivers
- 12.5.7 Subsegment Market Size and Forecast
- 12.5.7.1 System Modernization
- 12.5.7.2 New System Deployment
- 12.5.7.3 Lifecycle Support
- 12.5.8 Subsegment Pricing and Adoption Trends
- 12.5.9 Leading Suppliers and Competition
- 12.5.10 Regional Demand and Opportunities
- 12.6 By Contracting Model - Market Size and Forecast, 2025-2035
- 12.6.1 Segment Definition and Scope
- 12.6.2 Historical Market Size, 2018-2025
- 12.6.3 Revenue Forecast, 2025-2035
- 12.6.4 Volume Forecast, 2025-2035
- 12.6.5 Base-Year Market Share, 2025
- 12.6.6 Segment CAGR and Growth Drivers
- 12.6.7 Subsegment Market Size and Forecast
- 12.6.7.1 Specialist Equipment Contracts
- 12.6.7.2 Prime Integration Contracts
- 12.6.7.3 Managed Service Contracts
- 12.6.8 Subsegment Pricing and Adoption Trends
- 12.6.9 Leading Suppliers and Competition
- 12.6.10 Regional Demand and Opportunities
- 12.7 Segment Growth Comparison
- 12.8 Segment Attractiveness and Priority Matrix
Chapter 13 USA Air Traffic Management End-Use and Application Market Outlook
- 13.1 End-Use Industry and Customer Demand Structure
- 13.2 Leading Applications and Customer Groups
- 13.3 End-Use Market Size, Share and Forecast
- 13.4 Major End-Use Industry Deep Dives
- 13.4.1 Customer Requirements and Use Cases
- 13.4.2 Demand and Replacement Cycles
- 13.4.3 Technical and Regulatory Considerations
- 13.4.4 Purchasing and Procurement Models
- 13.4.5 Leading Vendors and Distribution Channels
- 13.4.6 Forecast and Commercial Opportunities
- 13.5 Emerging Applications and Cross-Segment Demand
- 13.6 End-Use Industry Investment Priorities
Chapter 14 USA Air Traffic Management Geographic Market Outlook, 2025-2035
- 14.1 Domestic Market Distribution and Demand Clusters
- 14.2 State- or Province-Wise Market Size and Forecast, 2025-2035
- 14.3 City and Metropolitan Market Outlook
- 14.4 Industrial, Manufacturing and Commercial Clusters
- 14.5 Geographic Concentration of Key End Users
- 14.6 Local Pricing and Purchasing Differences
- 14.7 Domestic Production Facilities and Capacity Map
- 14.8 Local Infrastructure and Project Pipeline
- 14.9 State-Level Policy and Incentive Differences
- 14.10 Subnational Investment Hotspots and Opportunities
- 14.11 Distribution and Logistics Networks
- 14.12 Domestic Competitive Footprint
Chapter 15 USA Air Traffic Management Technology, Innovation and Sustainability Outlook
- 15.1 Technology Landscape and Maturity
- 15.2 Product, Process and Service Innovation
- 15.3 AI, Automation and Digital Tools in the Industry
- 15.4 Technology Adoption and Performance Benchmarking
- 15.5 Innovation Pipeline and R&D Investment
- 15.6 Patent and Intellectual Property Trends
- 15.7 Energy Efficiency and Resource Management
- 15.8 Sustainability, Recycling and Circularity
- 15.9 Technology Roadmap, 2025-2035
- 15.10 Risks of Obsolescence and Technology Substitution
Chapter 16 USA Air Traffic Management Market Key Strategic Imperatives
- 16.1 Growth and Market Entry Priorities
- 16.2 High-Return Products and Segments
- 16.3 Pricing, Profitability and Cost Optimization
- 16.4 Technology Investment and Product Differentiation
- 16.5 Supply Chain Localization and Resilience
- 16.6 Distribution and Customer Acquisition
- 16.7 Partnership, Acquisition and Capacity Strategy
- 16.8 Regional Expansion Priorities
- 16.9 Short-, Medium- and Long-Term Actions
Chapter 17 Competition Outlook
- 17.1 Industry Competition Characteristics
- 17.2 Market Structure and Concentration
- 17.3 Market Share and Competitive Positioning, 2025
- 17.4 Company-Wise Revenue and Product Benchmarking
- 17.5 Production and Service Capacity Benchmarking
- 17.6 Technology, Pricing and Differentiation
- 17.7 Regional Footprint and Distribution Strength
- 17.8 Mergers, Acquisitions and Strategic Alliances
- 17.9 New Entrants and Competitive Threats
- 17.10 Porter's Five Forces and Industry Attractiveness
- 17.11 Competitive Outlook, 2025-2035
Chapter 18 Company Profiles
- 18.1 Company Coverage and Selection Criteria
- 18.2 RTX Corporation / Collins Aerospace
- 18.2.1 Business Description
- 18.2.2 Company Ownership and Geographic Presence
- 18.2.3 Product and Service Portfolio
- 18.2.4 Manufacturing and Operating Footprint
- 18.2.5 Production Capacity and Expansion Plans
- 18.2.6 Financial Performance and Investment
- 18.2.7 Market Share and Competitive Position
- 18.2.8 Technology and Innovation Capabilities
- 18.2.9 Strategic Alliances or Partnerships
- 18.2.10 Recent Developments
- 18.2.11 Growth Strategy and Outlook
- 18.3 Leidos Holdings
- 18.4 Peraton
- 18.5 L3Harris Technologies
- 18.6 Honeywell Aerospace Technologies
- 18.7 Indra Group USA
- 18.8 Rohde & Schwarz USA
- 18.9 AT&T
- 18.10 uAvionix
- 18.11 Other Relevant Market Participants
Note: Every listed company is profiled on the structure shown under the first company. The company list is preliminary and may change based on research findings, market developments, data availability and client requirements.
Chapter 19 Disclaimer
- 19.1 Research and Forecast Disclaimer
- 19.2 Data Source and Estimation Limitations
Note: The depth of individual sections depends on data availability for this market. Volume, capacity, trade and other unit-based metrics are included where applicable.