Defense orders and BVLOS rules reshape drone buying
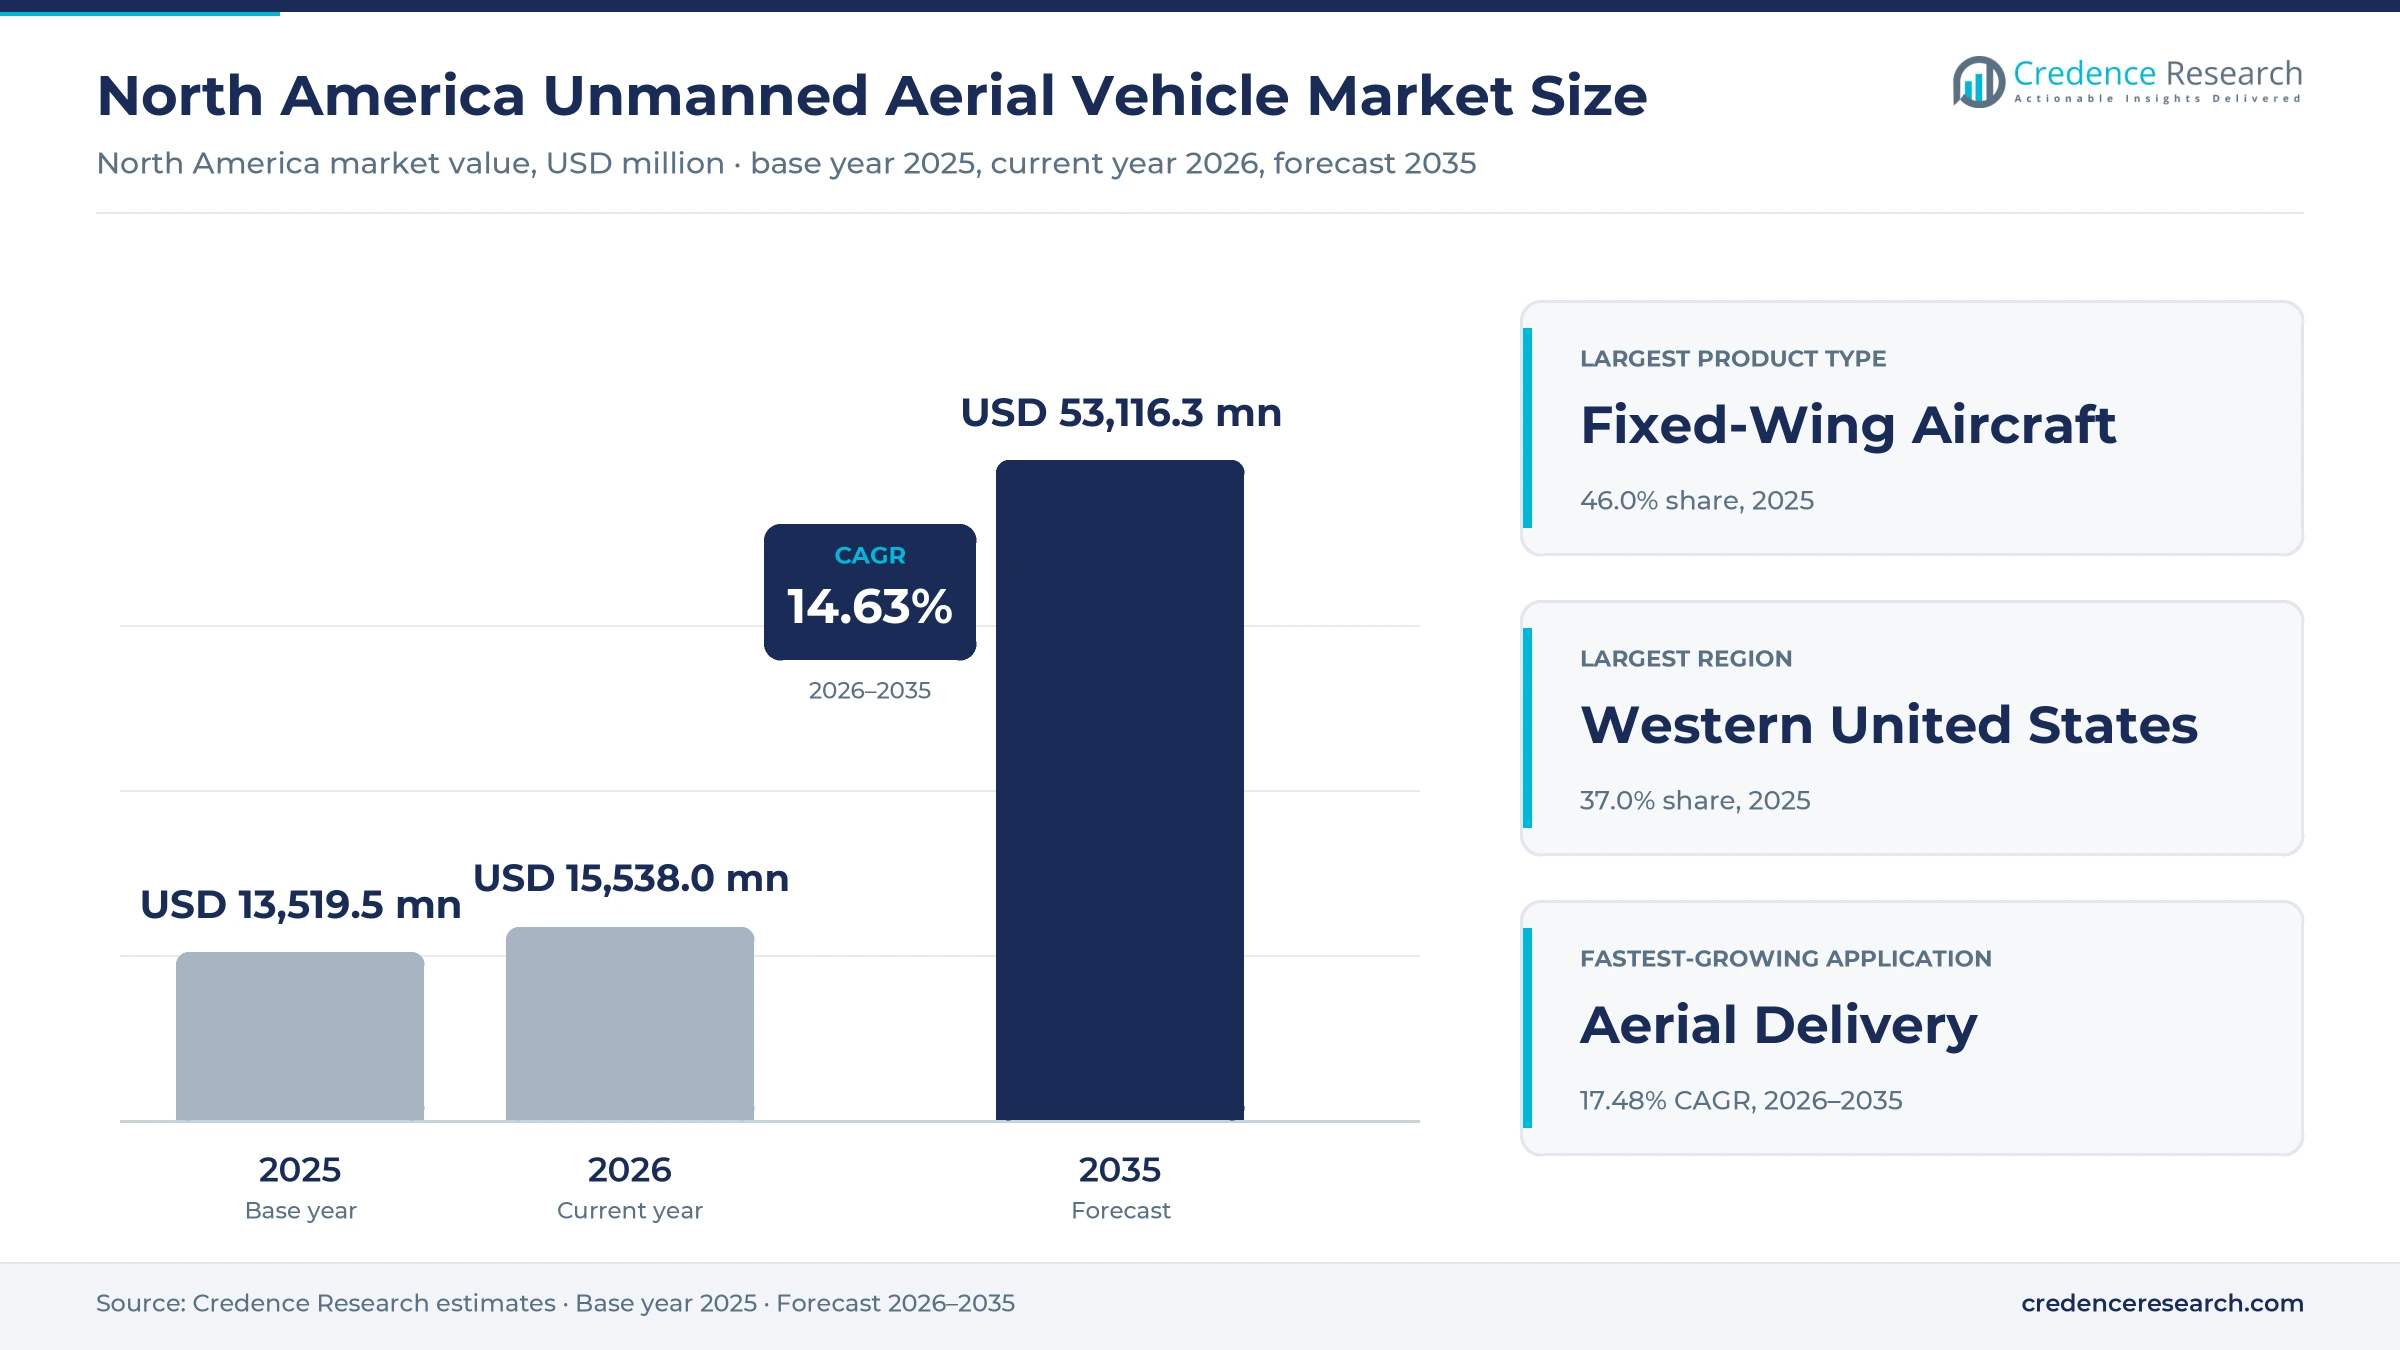
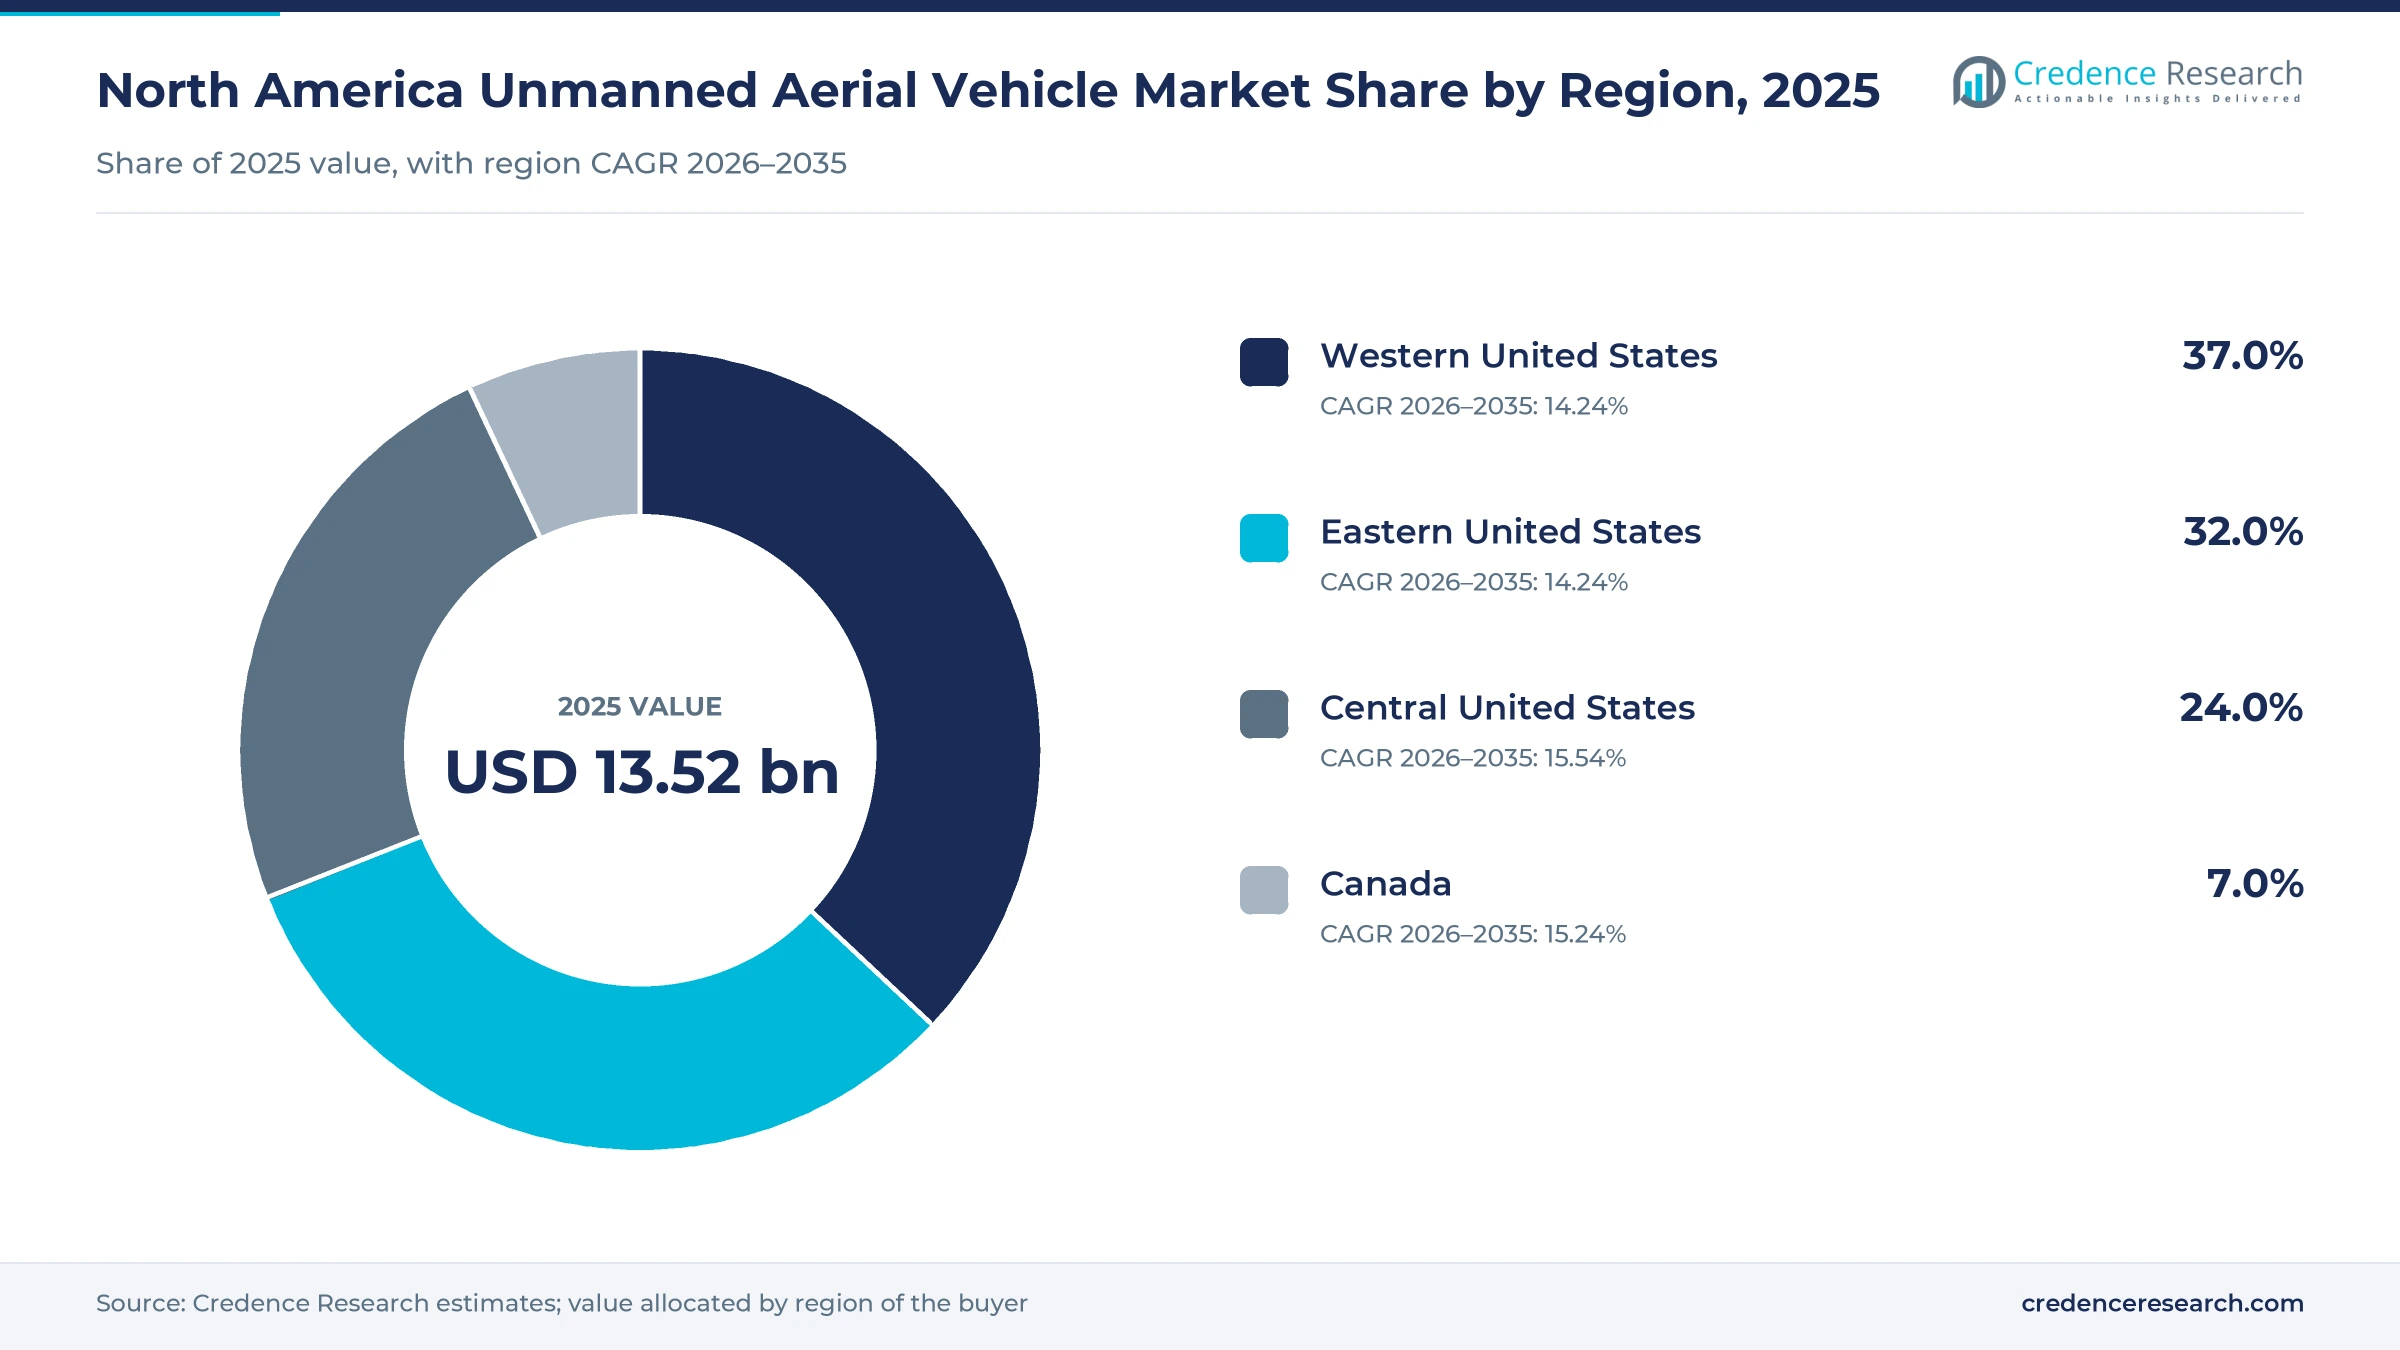
The North America unmanned aerial vehicle market was valued at USD 13.52 billion in 2025 and is projected to increase from USD 15.54 billion in 2026 to USD 53.12 billion by 2035, registering a CAGR of 14.63% during 2026–2035. Demand comes from military buyers that are moving from a few costly aircraft to large fleets of small and autonomous drones, from enterprise operators that run inspection and mapping fleets, and from retailers that now deliver packages by air in several metro areas. Western United States held the largest regional share, 37.0% in 2025, because the zone hosts the main assembly and test sites for large military aircraft. Central United States is the fastest-growing region at 15.54% a year, helped by dense drone delivery in Dallas-Fort Worth and new combat drone production in Ohio. On the regulatory side, the FAA proposal for routine flights beyond visual line of sight and the Canadian rules that took effect in November 2025 are moving commercial work away from case-by-case waivers.
What does the North America drone market include?
This report counts uncrewed aircraft sold in the United States and Canada, covering fixed-wing, multirotor, single-rotor and hybrid vertical takeoff designs together with their payloads, ground control stations and launch and recovery equipment. Buyers range from defense departments that place multiyear program contracts to farmers, utilities and hobby pilots who buy through dealers or online stores.
The scope excludes counter-drone systems sold on their own, drone service fees charged per flight, crewed air taxis and spare parts sold after the first year. The value chain runs from component and sensor suppliers through airframe makers and software developers to integrators, dealers and retail platforms, and values are stated at the price paid by the first buyer.
North America Unmanned Aerial Vehicle Market Insights
- The market grows from USD 13.52 billion in 2025 to USD 53.12 billion by 2035, a 14.63% CAGR, as defense fleets expand and beyond-line-of-sight rules open routine commercial work.
- Western United States led with 37.0% of 2025 value, while Central United States grows fastest at 15.54% a year on delivery hubs and new plants.
- Fixed-Wing Aircraft held 46.0% of 2025 value because long-endurance programs such as the MQ-4C Triton and MQ-9B SkyGuardian buy the most costly airframes.
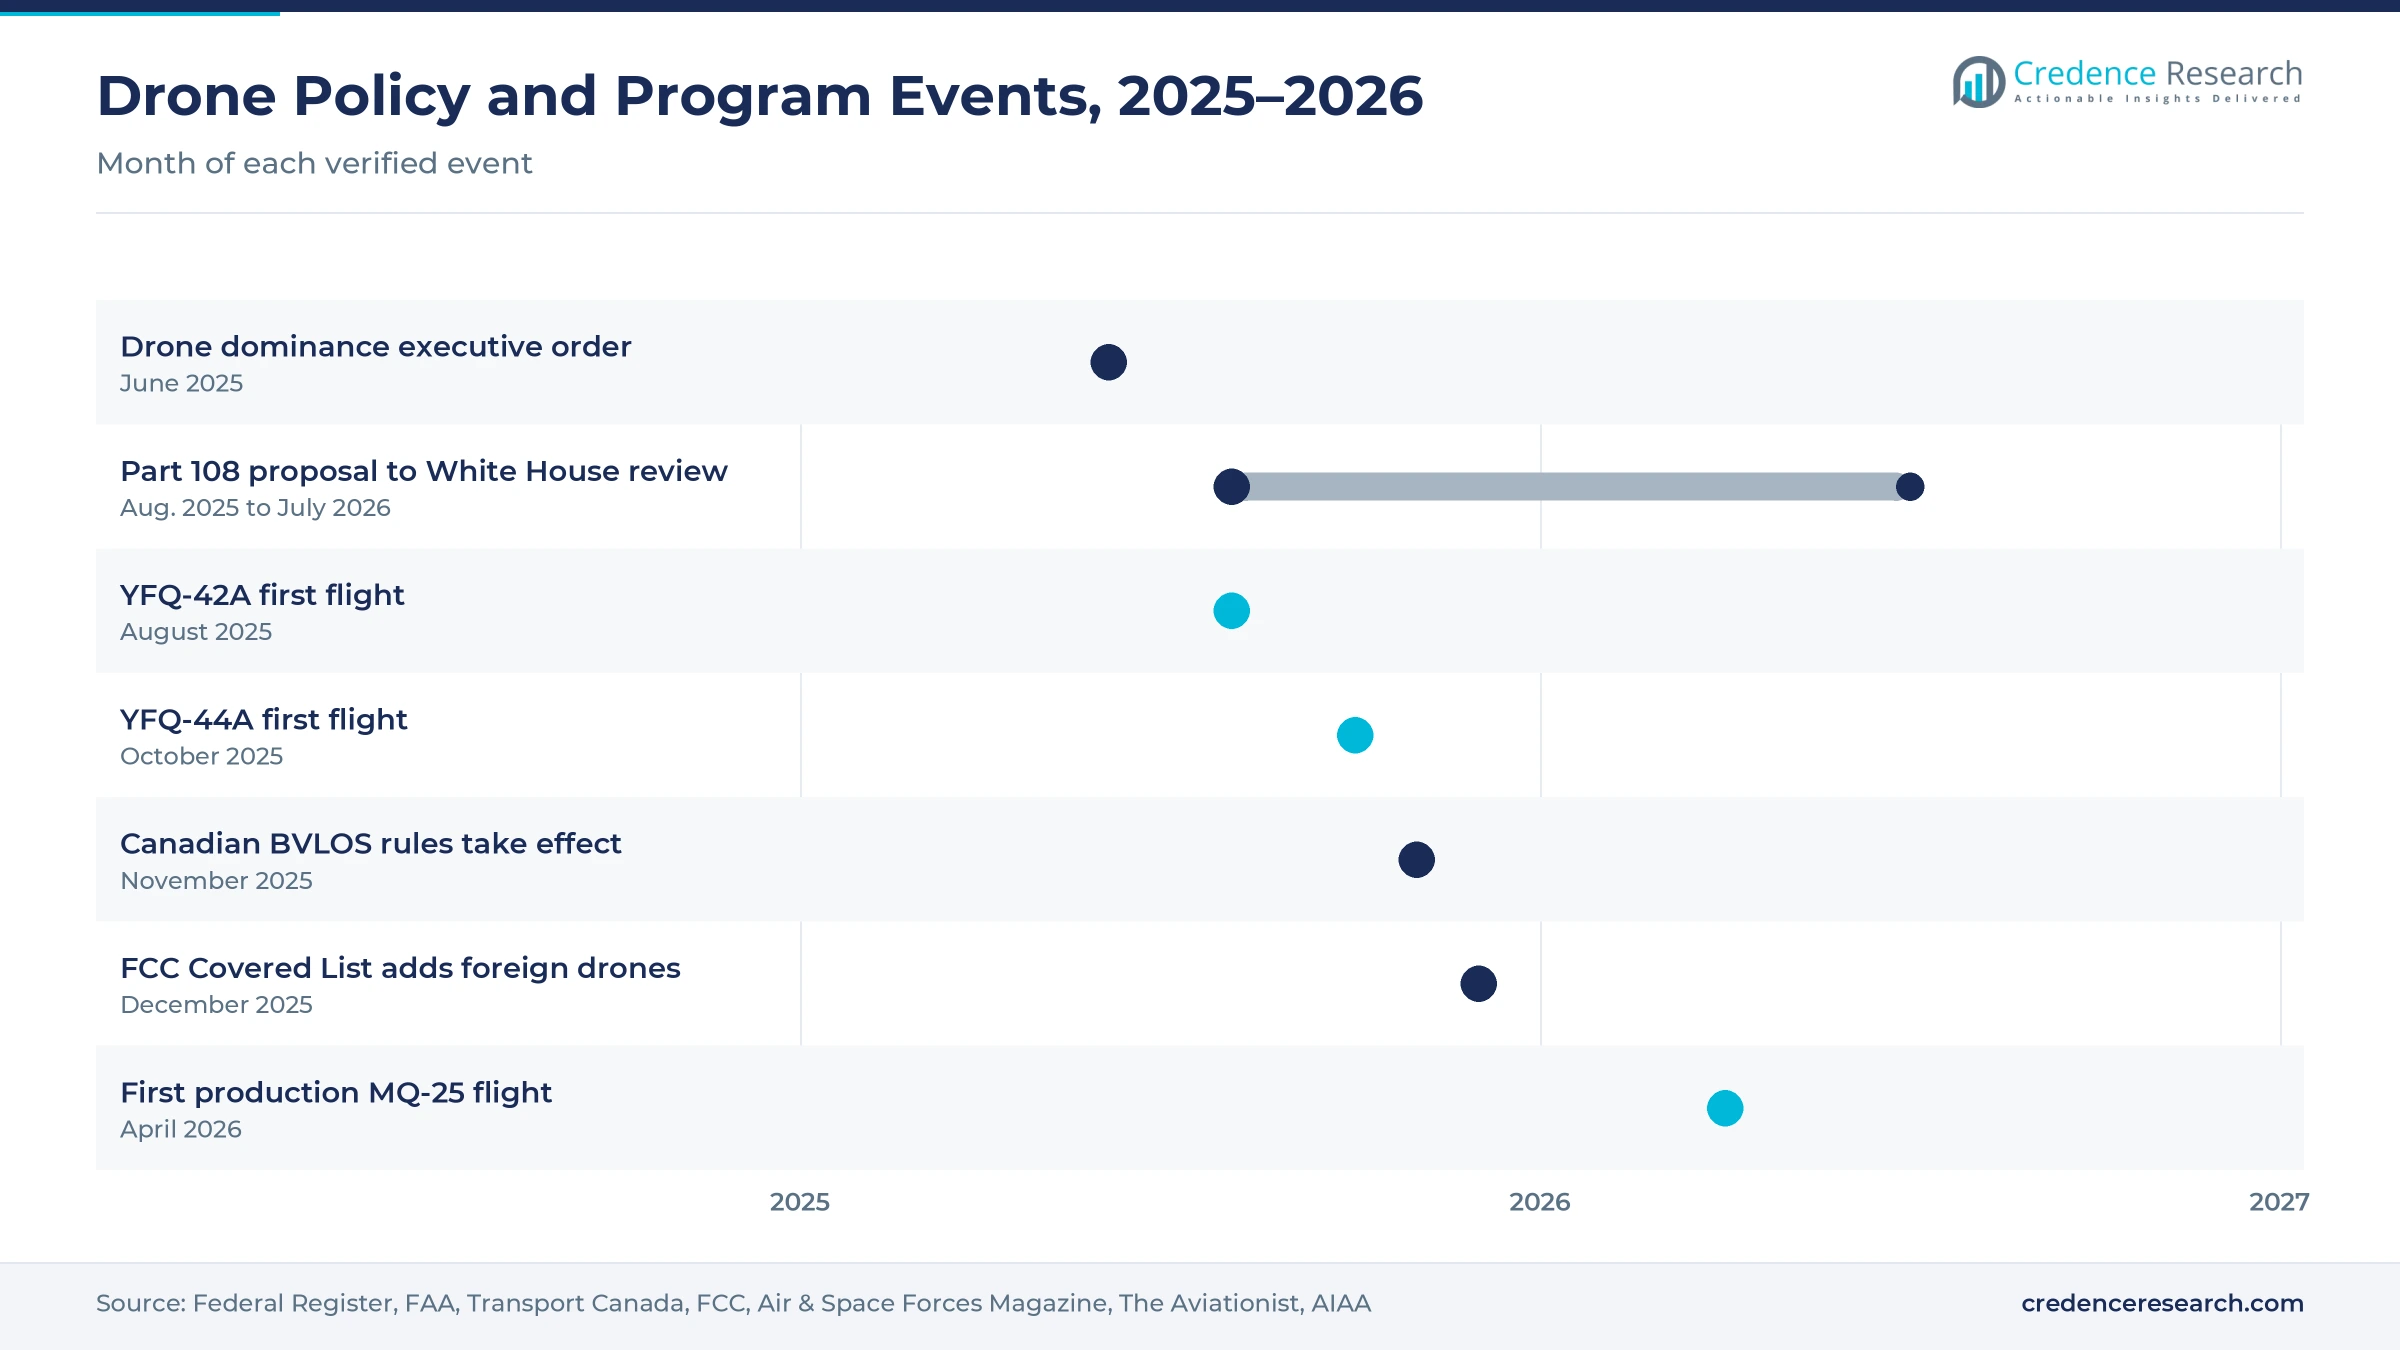
- The Air Force flew both collaborative combat aircraft prototypes in 2025, the General Atomics YFQ-42A on Aug. 27 and the Anduril YFQ-44A on Oct. 31.
- The FCC added foreign-produced drones and critical components to its Covered List on Dec. 22, 2025, which favors makers with domestic supply chains.
Fixed-wing aircraft and reconnaissance hold most value
Why do fixed-wing aircraft lead the product mix?
Based on product type, the market is categorized into fixed-wing aircraft, multirotor aircraft, single-rotor aircraft and hybrid vertical takeoff aircraft. Fixed-Wing Aircraft led with 46.0% of 2025 value because long-endurance military programs buy the most expensive airframes in the region. The Defense Post reported in March 2025 that the Navy ordered two more MQ-4C Triton aircraft for USD 267 million as it builds toward a fleet of 27. Hybrid Vertical Takeoff Aircraft grow fastest at 16.15% a year, as the Army took delivery of the Textron Systems MK 4.8 HQ Aerosonde for its Future Tactical Uncrewed Aircraft Systems program, according to Inside Unmanned Systems.
How does reconnaissance stay the largest application?
Based on application, the market is categorized into intelligence, surveillance and reconnaissance, asset inspection and mapping, aerial delivery and imaging and precision operations. Intelligence, Surveillance and Reconnaissance led with 50.0% of 2025 value because reconnaissance remains the core mission for military and border buyers. In the fiscal 2026 request, the Pentagon set aside USD 9.4 billion for unmanned and remotely operated aerial vehicles, according to DefenseScoop in June 2025. Aerial Delivery grows fastest at 17.48% a year, as Walmart said on June 5, 2025, that Wing drone delivery would launch at 100 more stores across Atlanta, Charlotte, Houston, Orlando and Tampa.
Which customers buy the most drone value?
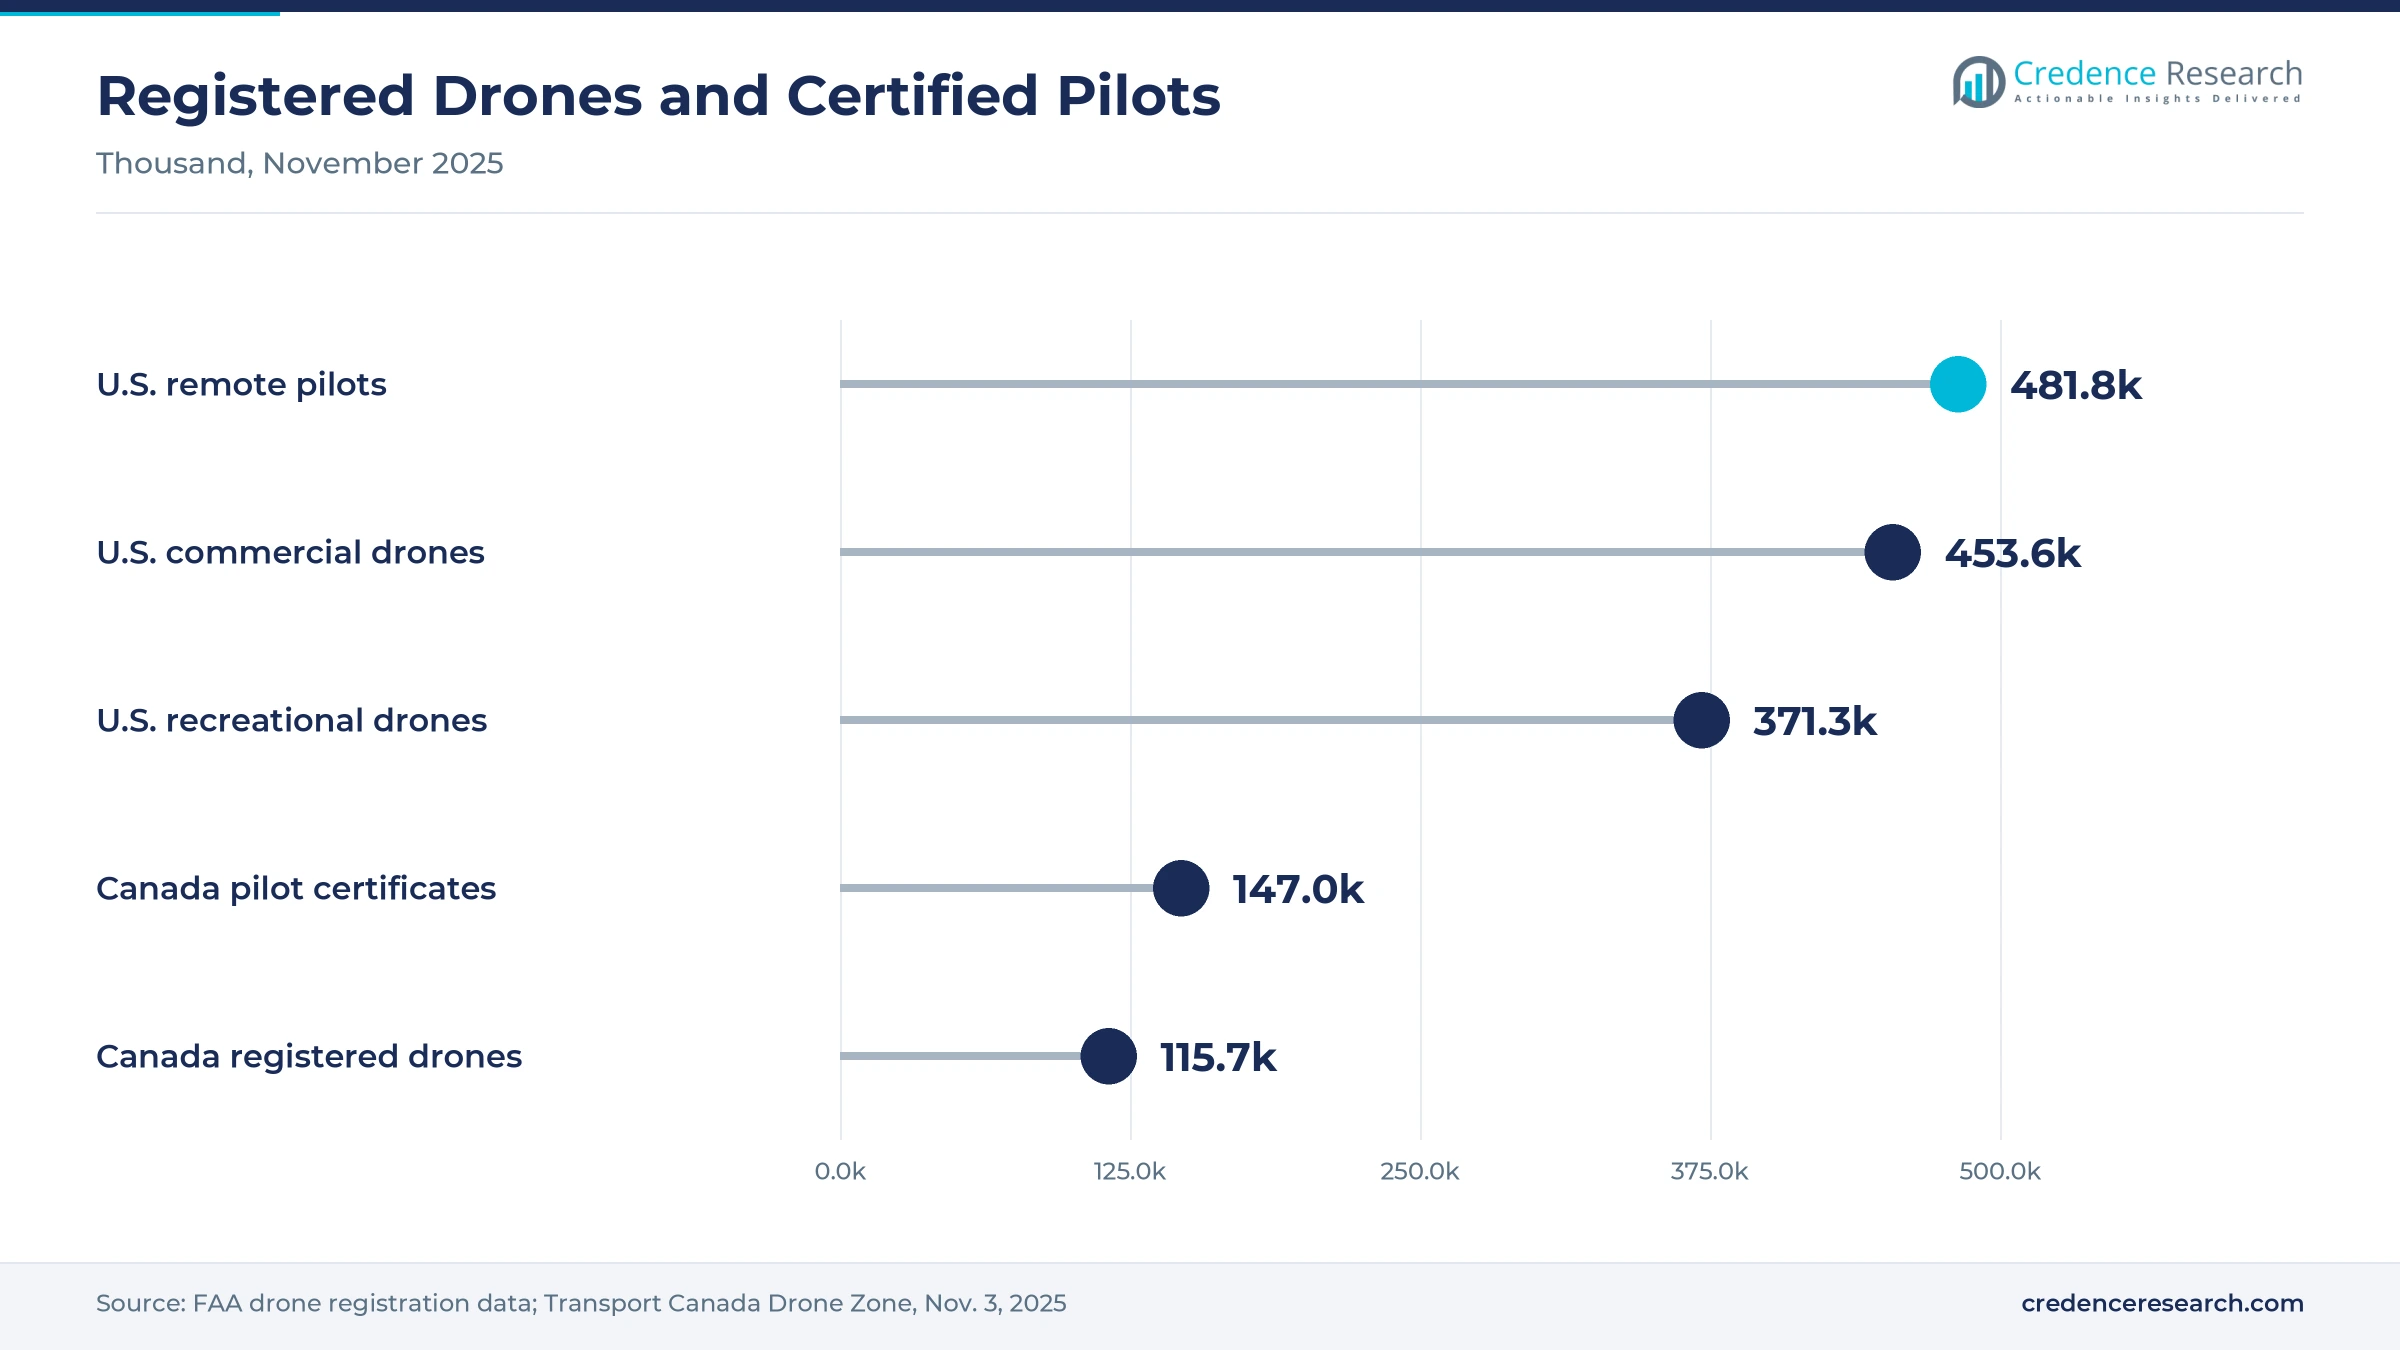
Based on customer type, the market is categorized into defense organizations, enterprise operators, recreational buyers and civilian government agencies. Defense Organizations led with 60.0% of 2025 value because military programs combine high unit prices with fast-rising volumes. Breaking Defense reported in November 2025 that the Army buys roughly 50,000 drones a year and now aims to buy one million within two to three years. Enterprise Operators grow fastest at 15.73% a year, as FAA data for November 2025 list 453,635 registered commercial drones against 371,334 recreational ones, so business fleets already outnumber hobby aircraft.
How far has autonomy moved into drone fleets?
Based on technology, the market is categorized into remotely piloted systems, supervised autonomy and mission autonomy. Remotely Piloted Systems led with 57.0% of 2025 value because most commercial and many military flights still need a certified pilot in control. The FAA counted 481,760 certificated remote pilots in November 2025, while Transport Canada had issued 127,328 basic pilot certificates by Nov. 3, 2025. Mission Autonomy grows fastest at 16.55% a year, as the Air Force flew the General Atomics YFQ-42A and Anduril YFQ-44A collaborative combat aircraft in 2025, according to Air & Space Forces Magazine and The Aviationist.
| Segment Group | Leading Sub-segment | Share, 2025 | Fastest-growing Sub-segment | CAGR, 2026–2035 |
|---|---|---|---|---|
| By Product Type | Fixed-Wing Aircraft | 46.0% | Hybrid Vertical Takeoff Aircraft | 16.15% |
| By Application | Intelligence, Surveillance and Reconnaissance | 50.0% | Aerial Delivery | 17.48% |
| By Customer Type | Defense Organizations | 60.0% | Enterprise Operators | 15.73% |
| By Technology | Remotely Piloted Systems | 57.0% | Mission Autonomy | 16.55% |
Request a Free Sample
Fill in your details and we'll send you a free sample report.
- Sample data tables & charts
- Research methodology
New flight rules and defense programs widen demand
Broader commercial operating permissions open BVLOS work
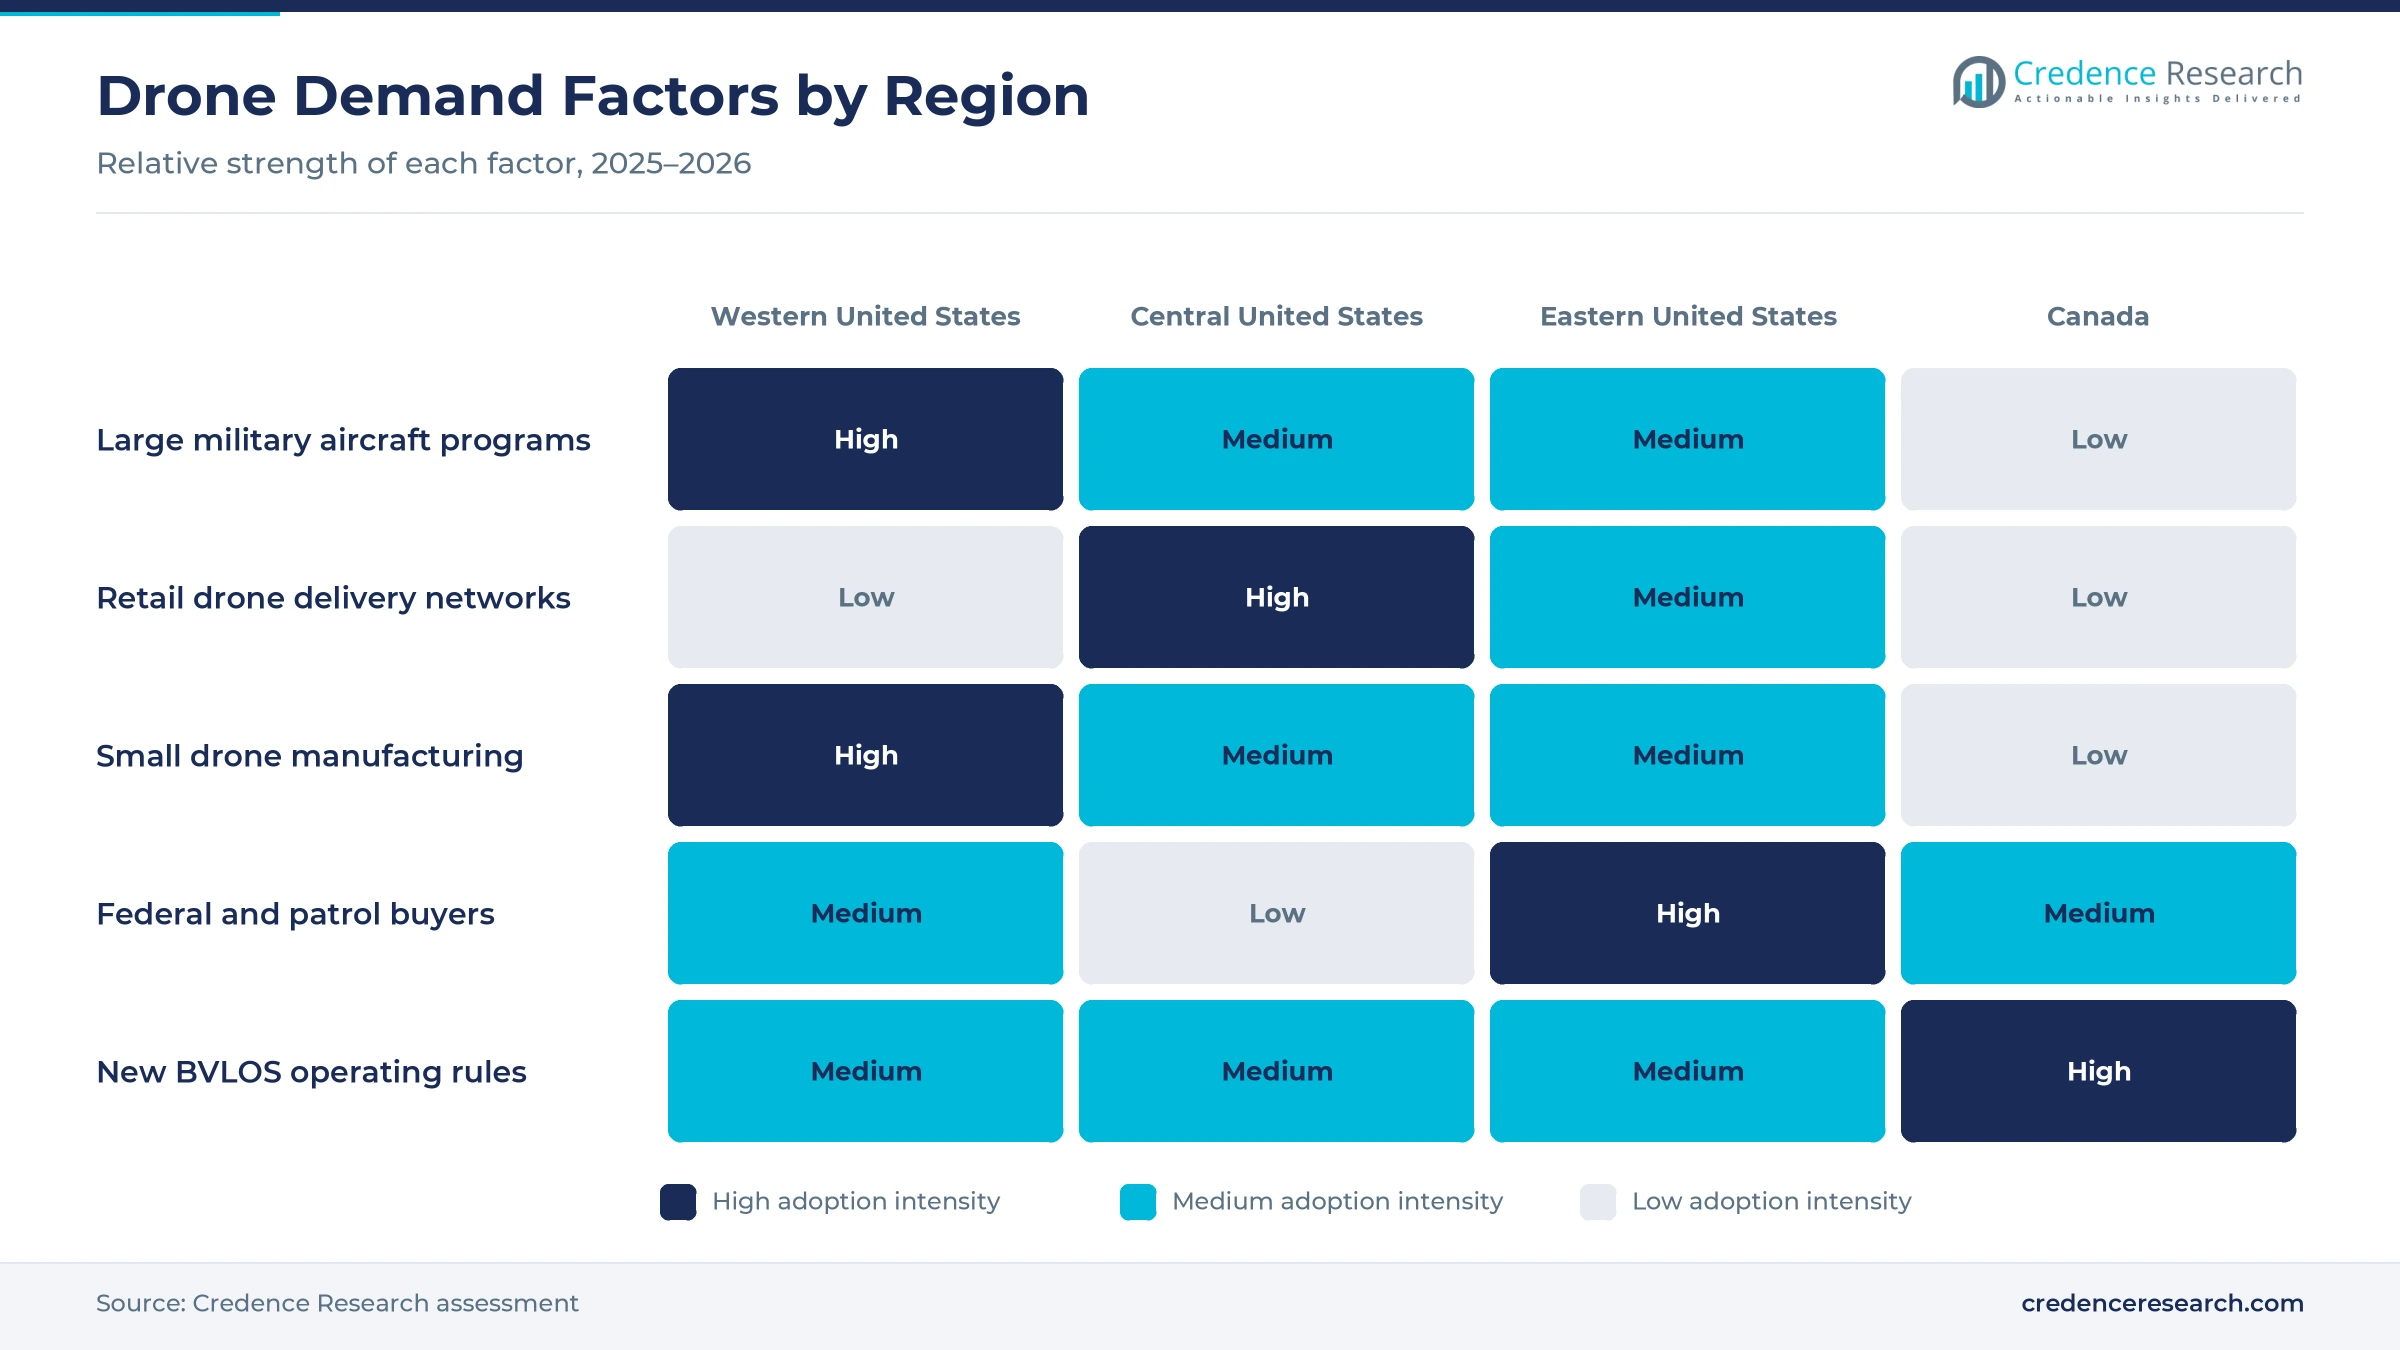
Broader operating permissions are the first driver, because most paid drone work needs flights beyond the pilot's line of sight. The executive order signed on June 6, 2025 told the FAA to propose a rule for routine beyond-visual-line-of-sight flights within 30 days and told agencies to favor U.S.-made drones. The FAA released its Part 108 proposal on Aug. 5, 2025, and DLA Piper noted that it allows aircraft up to 1,320 pounds and delivery fleets of up to 100 aircraft. According to UAV Coach in September 2026, the final rule went to White House review on July 10, 2026. As a result, Aerial Delivery grows at 17.48% a year, the fastest application in the market.
Advanced defense aircraft development lifts program value
Advanced defense aircraft development is the second driver, as new programs pay far more per airframe than small commercial drones. The fiscal 2026 Pentagon request included USD 13.4 billion for autonomy, of which USD 9.4 billion was for unmanned and remotely operated aerial vehicles. The Air Force flew the General Atomics YFQ-42A on Aug. 27, 2025, and expects an Increment 1 production decision in fiscal 2026, according to Air & Space Forces Magazine. Boeing then flew the first production MQ-25 Stingray tanker on April 25, 2026, according to AIAA. Spending on military drones therefore keeps Intelligence, Surveillance and Reconnaissance the largest application across the region.
Repeatable enterprise deployment scales delivery fleets
Repeatable enterprise deployment is the third driver, because operators now copy one working site design across many locations. Walmart said in June 2025 that it had completed more than 150,000 drone deliveries since 2021 and would add Wing service at 100 stores in five metro areas. DroneXL reported that Zipline opened its seventh Dallas-Fort Worth Walmart site in McKinney on Nov. 4, 2025, with both providers aiming to reach about 1.8 million households. The FAA registry listed 453,635 commercial drones in November 2025, ahead of recreational aircraft. This repeatable model helps Enterprise Operators grow at 15.73% a year through 2035.
Small-drone procurement reform multiplies Army volumes
Military procurement reform is the fourth driver, because it treats small drones as expendable equipment bought in large numbers. A July 10, 2025, memo from the Defense Secretary asked for low-cost drones in every squad by the end of 2026, according to the National Guard Association. Breaking Defense reported in November 2025 that the Army plans to buy one million drones in two to three years, up from about 50,000 a year. The Army issued a technical directive on Dec. 15, 2025, under its Short-Range Reconnaissance contract to procure Tranche 2 Skydio X10D systems for platoon-level units. In March 2026, Skydio announced an Army order for more than 2,500 X10D aircraft worth over USD 52 million, according to DroneXL.
Domestic supply and delivery networks shape the market
Shift toward domestic and Blue UAS supply chains
A shift toward domestic supply is the clearest trend, as security rules now steer buyers away from imported aircraft. The FCC added foreign-produced drones and critical components to its Covered List on Dec. 22, 2025, which bars new equipment approvals for those products, according to Wiley Rein. Exemptions issued on Jan. 7, 2026, cover Blue UAS listed items and domestic products with more than 65% U.S. component cost, but they run only to Jan. 1, 2027. Skydio builds its X10D in Hayward, California and DroneXL reported a March 2026 Army order for more than 2,500 units. As a result, American makers with certified parts supply are winning orders that once went to imported multirotor models.
Rise of hybrid vertical takeoff and ship-based aircraft
A rise in hybrid vertical takeoff designs is the second trend, because buyers want runway-free launch with fixed-wing range. Shield AI won a USD 198.1 million Coast Guard contract for V-BAT surveillance services in July 2024, and the company describes the V-BAT as a ducted-fan aircraft that launches from a hover. The Army took delivery of the Textron Systems MK 4.8 HQ Aerosonde for its tactical program, with production proposals due for award in the fourth quarter of fiscal 2025, according to Inside Unmanned Systems. The Navy also flew its first production MQ-25 carrier drone in April 2026. These programs explain why Hybrid Vertical Takeoff Aircraft grow at 16.15% a year.
Opportunity in retail delivery hubs across Sun Belt metros
Retail delivery hubs in Sun Belt metros are a clear opportunity, since one store can serve thousands of nearby homes by air. Walmart said in June 2025 that Wing would fly up to six miles from 100 new store sites in Florida, Georgia, North Carolina and Texas. DroneXL reported that Wing and Zipline together aim to cover about 75% of the Dallas-Fort Worth population, roughly 1.8 million households. Under the Part 108 proposal, DLA Piper noted that delivery operators could fly aircraft of up to 55 pounds in fleets of 100. Makers of delivery drones and dock hardware that can be installed at store parking lots stand to gain the most from this buildout.
Opportunity in Canada's new complex operations certificates
Canada's new complex operations framework is a second opportunity, because the pool of approved commercial operators is still small. Transport Canada counted 115,728 registered drones and 19,707 advanced pilot certificates on Nov. 3, 2025, but only 318 RPAS Operator Certificates, which lower-risk BVLOS work requires. The same rules allow medium drones of 25 to 150 kilograms within visual line of sight from Nov. 4, 2025. Defense demand adds scale, as the Royal Canadian Air Force is buying 11 MQ-9B SkyGuardian aircraft with first deliveries expected by 2028, according to Flying magazine. Suppliers that help operators qualify for certificates can therefore win early fleet orders in mining, pipelines and Arctic patrol.
Import bans, battery supply and rule delays slow buyers
Foreign drone restrictions disrupt existing fleets
The FCC Covered List decision of Dec. 22, 2025, bars new equipment approvals for foreign-produced drones, according to Wiley Rein. Many police departments, farms and commercial drone service firms built fleets around imported models, so new purchases must now shift to approved suppliers. Because the domestic exemptions expire on Jan. 1, 2027, buyers face higher unit prices and retraining costs. Operators are responding by extending older aircraft and testing Blue UAS listed alternatives.
Battery and component dependence on China remains
Component supply from China remains a weak point for domestic makers, even as security rules push buyers toward them. After Beijing sanctioned Skydio in October 2024, the company limited customers to one battery per drone for several months and expected new supply only in spring 2025, according to DroneLife. Smaller makers have less stock to absorb such shocks, so delivery dates slip when cells or motors are cut off. Makers are qualifying new battery sources in allied countries to reduce this exposure.
Final BVLOS rule is still waiting for publication
The FAA sent its final Part 108 rule to White House review on July 10, 2026, and UAV Coach reported in September 2026 that no publication date had been set. Until the rule takes effect, delivery and inspection operators must keep using case-by-case waivers that limit fleet size and routes. Investors therefore wait before funding large networks, and some aircraft orders remain conditional. Operators are preparing compliance programs now so they can scale as soon as the effective date arrives.
Defense production awards carry no guaranteed volumes
Large defense programs promise volume, but the Air Force has guaranteed neither collaborative combat aircraft maker a minimum amount of work, according to Air & Space Forces Magazine in August 2025. The Increment 1 production decision is expected only in fiscal 2026, so suppliers must invest in tooling before orders are firm. This raises financial risk for subcontractors that build engines, sensors and airframe parts. Many are splitting capacity across several programs to protect themselves against a lost competition.
Western states lead while the central zone grows fastest
| Region | Value, 2025 (USD billion) | Share, 2025 | CAGR, 2026–2035 |
|---|---|---|---|
| Western United States | 5.00 | 37.0% | 14.24% |
| Eastern United States | 4.33 | 32.0% | 14.24% |
| Central United States | 3.24 | 24.0% | 15.54% |
| Canada | 0.95 | 7.0% | 15.24% |
Western United States leads on large aircraft assembly
Western United States held 37.0% of 2025 value and grows at 14.24% a year. The zone hosts the main assembly and test sites for large military aircraft, and General Atomics flew its YFQ-42A from a California test location on Aug. 27, 2025, according to Air & Space Forces Magazine. Skydio builds its X10D in Hayward, California and DroneXL reported a March 2026 Army order for more than 2,500 aircraft worth over USD 52 million. Because these programs carry high unit prices, value per aircraft in the zone stays above the regional average.
Eastern United States combines federal buyers and delivery
Eastern United States held 32.0% of 2025 value and grows at 14.24% a year. The zone combines federal and Coast Guard buyers with fast-growing delivery corridors in the Southeast. Walmart said in June 2025 that Wing delivery would reach Atlanta, Charlotte, Orlando and Tampa, with flights up to six miles from each store. Virginia Business reported that AeroVironment completed its acquisition of BlueHalo on May 1, 2025, adding anti-drone systems, space and electronic warfare work to its drone portfolio.
Central United States grows fastest on delivery and plants
Central United States held 24.0% of 2025 value and grows fastest at 15.54% a year. Dallas-Fort Worth is the densest drone delivery market in the region, and DroneXL reported that Zipline opened its seventh Walmart site there in McKinney on Nov. 4, 2025. Anduril plans to start YFQ-44A production at its Arsenal-1 plant in Columbus, Ohio, in the first half of 2026, according to The Aviationist. Boeing also flew the first production MQ-25 from MidAmerica St. Louis Airport on April 25, 2026.
Canada builds demand through new rules and patrol aircraft
Canada held 7.0% of 2025 value and grows at 15.24% a year. Transport Canada rules allowed lower-risk BVLOS flights and medium drones of 25 to 150 kilograms from Nov. 4, 2025. Its November 2025 newsletter counted 115,728 registered drones but only 318 RPAS Operator Certificates, so most commercial operators have not yet moved into complex work. Defense demand adds a second stream, as the Royal Canadian Air Force is buying 11 MQ-9B SkyGuardian aircraft with full operational capability planned by 2033, according to Flying magazine.
Combat drone flights and delivery launches mark 2025
| Development | Status and market relevance |
|---|---|
| In May 2025, AeroVironment completed its acquisition of BlueHalo, adding counter-drone, space and electronic warfare capabilities. | Completed; broadens AeroVironment beyond small tactical drones. |
| In June 2025, Walmart announced Wing drone delivery at 100 more stores in Atlanta, Charlotte, Houston, Orlando and Tampa. | Rolling out; the largest retail drone expansion in the region. |
| In August 2025, General Atomics flew the YFQ-42A, the first collaborative combat aircraft prototype to fly for the Air Force. | In flight test; production decision expected in fiscal 2026. |
| In October 2025, Anduril flew its YFQ-44A collaborative combat aircraft for the first time. | In flight test; production planned at Arsenal-1 in Ohio. |
| In April 2026, Boeing flew the first production MQ-25 Stingray from MidAmerica St. Louis Airport. | Flight test; first carrier-based uncrewed aircraft for the Navy. |
Hybrid lift and autonomy software change aircraft design
- Ducted-fan vertical takeoff lets aircraft such as the Shield AI V-BAT launch and recover from a hover and then fly in wing-borne cruise, which removes the need for runways on ships.
- Modular open systems architecture allows the Textron Systems Aerosonde MK 4.8 HQ to accept new payloads and software quickly, a requirement in the Army tactical program.
- Enabling autonomy software received USD 1.2 billion in the Pentagon fiscal 2026 request, and it lets one operator supervise several aircraft instead of flying each one.
- Store-based delivery docks let Wing aircraft launch from a retail parking lot and reach homes up to six miles away without a pilot at each site.
Need a Custom Version of This Report?
Tailor the scope, geography, or segments to your exact requirements.
- Custom geography or segment scope
- Direct access to our analyst team
Primes and venture-backed makers compete on autonomy
Competition among unmanned aerial vehicle suppliers turns on autonomy software, domestic supply and the ability to scale production for large orders. General Atomics Aeronautical Systems and Northrop Grumman lead in large fixed-wing aircraft, with the MQ-9B program for Canada and the MQ-4C Triton for the Navy. Boeing competes in carrier aviation through the MQ-25, while Anduril Industries and General Atomics compete head to head for collaborative combat aircraft production. AeroVironment, Textron Systems and Shield AI focus on tactical and hybrid vertical takeoff aircraft, and AeroVironment added counter-drone work through BlueHalo. Skydio has become a leading domestic supplier of small reconnaissance drones to the Army. Zipline competes in retail delivery, and DJI remains widespread in existing commercial and hobby fleets even though new foreign models now face FCC limits. Venture-backed entrants therefore gain share wherever buyers value fast iteration and U.S.-built hardware.
Companies profiled and their roles in this market
| Company | Type | Role in the market |
|---|---|---|
| General Atomics Aeronautical Systems | Defense prime | YFQ-42A first flight in August 2025; supplier of 11 MQ-9B aircraft to Canada |
| Northrop Grumman | Defense prime | Two more MQ-4C Triton aircraft ordered by the Navy in March 2025 |
| Anduril Industries | Defense technology maker | YFQ-44A first flight in October 2025; Arsenal-1 plant in Columbus, Ohio |
| AeroVironment | Tactical drone maker | Completed the BlueHalo acquisition in May 2025 |
| Boeing | Defense prime | First production MQ-25 Stingray flew in April 2026 |
| Textron Systems | Tactical drone maker | MK 4.8 HQ Aerosonde delivered for the Army tactical program |
| DJI | Consumer and enterprise maker | New foreign-produced models barred from FCC approvals from December 2025 |
| Shield AI | Autonomy and VTOL maker | V-BAT surveillance services contract with the Coast Guard |
| Skydio | Small drone maker | Army order for more than 2,500 X10D aircraft in March 2026 |
| Zipline | Delivery operator | Seventh Dallas-Fort Worth Walmart site opened in November 2025 |
Autonomy and domestic supply will set the growth pace
Credence Research's view is that autonomy and domestic supply will set the pace of unmanned aerial vehicle growth through 2035. Defense Organizations held 60.0% of 2025 demand, and Army plans for one million small drones should keep that lead. The collaborative combat aircraft program adds high-value demand on top of that volume. On the commercial side, the final Part 108 rule is the swing factor, because delivery and inspection fleets cannot scale on waivers alone. The FCC restrictions on foreign drones open room for American makers, but only those that secure batteries and motors outside China will keep delivery promises. Companies that combine certified domestic parts, autonomy software and fast production should gain the most share.
How Credence Research built this regional estimate
The report uses 2025 as the base year and forecasts to 2035. Market values come from the Credence Research model, and regional and segment splits are Credence Research estimates shaped by defense budget lines, aircraft program locations, registered fleets and delivery network data. Sources used include the FAA, Transport Canada, the Federal Register record of executive orders, the U.S. Army, defense and drone trade press, legal analyses of FCC and FAA rules, and company releases. No interviews or surveys were conducted for this edition, so the estimates reflect published information at the time of research.
Defense volume and BVLOS delivery drive growth to 2035
The North America unmanned aerial vehicle market should reach USD 53.12 billion by 2035, led by defense fleets and routine BVLOS commercial work. Most added value will come from those two sources once the final rule takes effect. Collaborative combat aircraft production and Army small-drone purchases should keep defense buyers in the lead, while retail delivery hubs spread from Texas to more Sun Belt metros. Canada adds a smaller stream at 15.24% a year as complex operations certificates and the 11-aircraft MQ-9B program mature. The main risks are further rule delays, component shortages and uneven defense awards, any of which could slow orders in a given year.
Frequently Asked Questions
How big is the North America unmanned aerial vehicle market?
Which region leads the market?
Which region grows fastest?
What is the largest product type?
What is the FAA Part 108 rule?
Which application grows fastest?
How do FCC rules affect foreign drones?
Which companies operate in this market?
Table of Content
Chapter 1 Market Segmentation
- 1.1 Segmentation Framework
- 1.1.1 Product and Service Classification
- 1.1.2 Application and End-Use Classification
- 1.1.3 Technology and Solution Classification
- 1.1.4 Customer and Distribution Channel Classification
- 1.1.5 Geographic Segmentation
- 1.1.6 Market Segment Definitions and Boundaries
- 1.2 By Product Type
- 1.2.1 Fixed-Wing Aircraft
- 1.2.2 Multirotor Aircraft
- 1.2.3 Single-Rotor Aircraft
- 1.2.4 Hybrid Vertical Takeoff Aircraft
- 1.3 By Application
- 1.3.1 Intelligence, Surveillance and Reconnaissance
- 1.3.2 Asset Inspection and Mapping
- 1.3.3 Aerial Delivery
- 1.3.4 Imaging and Precision Operations
- 1.4 By Customer Type
- 1.4.1 Defense Organizations
- 1.4.2 Enterprise Operators
- 1.4.3 Recreational Buyers
- 1.4.4 Civilian Government Agencies
- 1.5 By Technology
- 1.5.1 Remotely Piloted Systems
- 1.5.2 Supervised Autonomy
- 1.5.3 Mission Autonomy
Chapter 2 Introduction
- 2.1 Report Objectives and Scope
- 2.2 Product Definition and Industry Terminology
- 2.3 Market Inclusions and Exclusions
- 2.4 Research Process
- 2.4.1 Primary Research and Expert Interviews
- 2.4.2 Secondary Research and Source Review
- 2.4.3 Top-Down and Bottom-Up Estimation
- 2.4.4 Data Triangulation and Verification
- 2.5 Market Size Measurement Basis
- 2.5.1 2025: USD 13.52 billion → 2035: USD 53.12 billion
- 2.6 Historical and Forecast Reference Periods
- 2.6.1 Historical Period: 2018-2025
- 2.6.2 Base Year: 2025
- 2.6.3 Forecast Period: 2025-2035
- 2.7 Research Assumptions and Limitations
Chapter 3 Executive Summary
- 3.1 Market Snapshot and Key Findings
- 3.2 Base-Year Market Size, 2025
- 3.3 Forecast Market Size, 2035
- 3.4 Revenue and Volume Growth Outlook
- 3.5 Key Demand and Supply Indicators
- 3.6 Leading Market Segments
- 3.7 Fastest-Growing Market Opportunities
- 3.8 Regional Performance Highlights
- 3.9 Technology and Industry Transformation
- 3.10 Competitive Landscape Summary
- 3.11 Analyst View and Strategic Implications
Chapter 4 North America Unmanned Aerial Vehicle Market Trends and Developments
- 4.1 Historical Industry Development, 2018-2025
- 4.2 Recent Market Trends and Developments
- 4.3 Demand and Customer Behavior Trends
- 4.4 Technology and Product Innovation
- 4.5 Artificial Intelligence, Automation and Digitalization
- 4.6 Local Manufacturing and Supply Chain Realignment
- 4.7 Industry Partnerships, Mergers and Acquisitions
- 4.8 Sustainability and Circular Economy Developments
- 4.9 Government and Private Sector Investment Trends
- 4.10 Emerging Business Models and Commercialization
- 4.11 Industry Developments and Announcements
Chapter 5 North America Unmanned Aerial Vehicle Market Production, Supply and Demand Analysis
- 5.1 Demand Trend and Consumption Analysis, 2018-2025
- 5.2 Demand Forecast, 2025-2035
- 5.3 Production and Output Trend, 2018-2025
- 5.4 Production and Output Forecast, 2025-2035
- 5.5 Installed Capacity and Capacity Utilization
- 5.6 Company-Wise Production Plants and Statistics
- 5.6.1 Installed Production Capacity
- 5.6.2 Actual Production
- 5.6.3 Planned Capacity and Expansion Targets
- 5.7 Supply Chain Structure and Procurement Trends
- 5.8 Supply-Demand Gap and Bottlenecks
- 5.9 Import Dependence and Sourcing Structure
- 5.10 Contract Manufacturing and Outsourcing
- 5.11 Regional Supply and Demand Concentration
Chapter 6 North America Unmanned Aerial Vehicle Market Pricing Analysis
- 6.1 Pricing Structure and Measurement
- 6.2 Historical Pricing Trends, 2018-2025
- 6.3 Pricing Outlook, 2025-2035
- 6.4 Average Selling Price and Unit Economics
- 6.5 Pricing by Product and Market Segment
- 6.6 Geographic Pricing Differences
- 6.7 Key Input, Energy, Labor and Logistics Costs
- 6.8 Contract Pricing and Purchasing Models
- 6.9 Pricing Sensitivity and Competitive Positioning
- 6.10 Price, Margin and Profitability Implications
Chapter 7 North America Unmanned Aerial Vehicle Market Dynamics
- 7.1 Market Growth Drivers
- 7.1.1 Demand-Side Drivers
- 7.1.2 Technology and Innovation Drivers
- 7.1.3 Infrastructure and Investment Drivers
- 7.1.4 Regulatory and Policy Drivers
- 7.2 Market Restraints
- 7.2.1 Cost and Affordability Constraints
- 7.2.2 Technology and Adoption Barriers
- 7.2.3 Supply Chain and Operational Constraints
- 7.3 Market Challenges
- 7.3.1 Competitive Pressure and Margin Erosion
- 7.3.2 Skills, Infrastructure and Implementation Gaps
- 7.4 Emerging Market Opportunities
- 7.5 Market Dynamics Impact and Time-Horizon Assessment
Chapter 8 North America Unmanned Aerial Vehicle Value Chain Analysis
- 8.1 Industry Value Chain Overview
- 8.2 Upstream Suppliers and Critical Inputs
- 8.3 Technology and Component Providers
- 8.4 Manufacturing or Service Delivery
- 8.5 Distribution, Channel Partners and Integrators
- 8.6 Downstream Applications and End Users
- 8.7 Value Addition and Profit Pools
- 8.8 Vertical Integration and Outsourcing
- 8.9 Supplier Concentration and Risk
- 8.10 Supply Chain Localization and Resilience
Chapter 9 North America Unmanned Aerial Vehicle Market Regulations and Policies
- 9.1 Relevant Laws, Standards and Compliance Frameworks
- 9.2 Product, Service, Safety and Quality Requirements
- 9.3 Government Policies, Incentives and Subsidies
- 9.4 Imports, Exports and Trade Barriers
- 9.5 Public Procurement and Local Content Requirements
- 9.6 Environmental and Sustainability Compliance
- 9.7 Upcoming Policy Changes and Market Implications
Chapter 10 North America Unmanned Aerial Vehicle Market Hotspots and Opportunities
- 10.1 Market Opportunity Mapping and Growth Hotspots
- 10.2 High-Growth Applications and Customer Groups
- 10.3 Underserved Markets and White-Space Opportunities
- 10.4 Emerging Technology and Product Opportunities
- 10.5 New Capacity and Investment Hotspots
- 10.6 Market Entry and Expansion Opportunities
- 10.7 Distribution and Partnership Opportunities
- 10.8 Near-Term and Long-Term Commercial Potential
- 10.9 Opportunity Attractiveness and Execution Risks
Chapter 11 North America Unmanned Aerial Vehicle Market Outlook, 2025-2035
- 11.1 Market Size and Analysis
- 11.1.1 Revenue (Market Measurement: 2025: USD 13.52 billion → 2035: USD 53.12 billion)
- 11.1.2 Market Volume and Quantity Sold
- 11.1.3 Historical Market Size, 2018-2025
- 11.1.4 Base-Year Market Size, 2025
- 11.2 Market Forecast, 2025-2035
- 11.2.1 Revenue Forecast to 2035
- 11.2.2 Volume Forecast to 2035
- 11.2.3 CAGR and Year-on-Year Growth
- 11.2.4 Incremental Revenue Opportunity
- 11.3 Forecast Assumptions and Scenario Analysis
- 11.3.1 Base-Case Forecast
- 11.3.2 Optimistic and Conservative Scenarios
- 11.3.3 Technology, Pricing and Policy Sensitivities
- 11.4 Market Attractiveness and Growth Outlook
Chapter 12 North America Unmanned Aerial Vehicle Market Segmentation and Outlook
- 12.1 Segmentation Summary and Market Shares, 2025
- 12.2 Largest and Fastest-Growing Segments
- 12.3 By Product Type - Market Size and Forecast, 2025-2035
- 12.3.1 Segment Definition and Scope
- 12.3.2 Historical Market Size, 2018-2025
- 12.3.3 Revenue Forecast, 2025-2035
- 12.3.4 Volume Forecast, 2025-2035
- 12.3.5 Base-Year Market Share, 2025
- 12.3.6 Segment CAGR and Growth Drivers
- 12.3.7 Subsegment Market Size and Forecast
- 12.3.7.1 Fixed-Wing Aircraft
- 12.3.7.2 Multirotor Aircraft
- 12.3.7.3 Single-Rotor Aircraft
- 12.3.7.4 Hybrid Vertical Takeoff Aircraft
- 12.3.8 Subsegment Pricing and Adoption Trends
- 12.3.9 Leading Suppliers and Competition
- 12.3.10 Regional Demand and Opportunities
- 12.4 By Application - Market Size and Forecast, 2025-2035
- 12.4.1 Segment Definition and Scope
- 12.4.2 Historical Market Size, 2018-2025
- 12.4.3 Revenue Forecast, 2025-2035
- 12.4.4 Volume Forecast, 2025-2035
- 12.4.5 Base-Year Market Share, 2025
- 12.4.6 Segment CAGR and Growth Drivers
- 12.4.7 Subsegment Market Size and Forecast
- 12.4.7.1 Intelligence, Surveillance and Reconnaissance
- 12.4.7.2 Asset Inspection and Mapping
- 12.4.7.3 Aerial Delivery
- 12.4.7.4 Imaging and Precision Operations
- 12.4.8 Subsegment Pricing and Adoption Trends
- 12.4.9 Leading Suppliers and Competition
- 12.4.10 Regional Demand and Opportunities
- 12.5 By Customer Type - Market Size and Forecast, 2025-2035
- 12.5.1 Segment Definition and Scope
- 12.5.2 Historical Market Size, 2018-2025
- 12.5.3 Revenue Forecast, 2025-2035
- 12.5.4 Volume Forecast, 2025-2035
- 12.5.5 Base-Year Market Share, 2025
- 12.5.6 Segment CAGR and Growth Drivers
- 12.5.7 Subsegment Market Size and Forecast
- 12.5.7.1 Defense Organizations
- 12.5.7.2 Enterprise Operators
- 12.5.7.3 Recreational Buyers
- 12.5.7.4 Civilian Government Agencies
- 12.5.8 Subsegment Pricing and Adoption Trends
- 12.5.9 Leading Suppliers and Competition
- 12.5.10 Regional Demand and Opportunities
- 12.6 By Technology - Market Size and Forecast, 2025-2035
- 12.6.1 Segment Definition and Scope
- 12.6.2 Historical Market Size, 2018-2025
- 12.6.3 Revenue Forecast, 2025-2035
- 12.6.4 Volume Forecast, 2025-2035
- 12.6.5 Base-Year Market Share, 2025
- 12.6.6 Segment CAGR and Growth Drivers
- 12.6.7 Subsegment Market Size and Forecast
- 12.6.7.1 Remotely Piloted Systems
- 12.6.7.2 Supervised Autonomy
- 12.6.7.3 Mission Autonomy
- 12.6.8 Subsegment Pricing and Adoption Trends
- 12.6.9 Leading Suppliers and Competition
- 12.6.10 Regional Demand and Opportunities
- 12.7 Segment Growth Comparison
- 12.8 Segment Attractiveness and Priority Matrix
Chapter 13 North America Unmanned Aerial Vehicle End-Use and Application Market Outlook
- 13.1 End-Use Industry and Customer Demand Structure
- 13.2 Leading Applications and Customer Groups
- 13.3 End-Use Market Size, Share and Forecast
- 13.4 Major End-Use Industry Deep Dives
- 13.4.1 Customer Requirements and Use Cases
- 13.4.2 Demand and Replacement Cycles
- 13.4.3 Technical and Regulatory Considerations
- 13.4.4 Purchasing and Procurement Models
- 13.4.5 Leading Vendors and Distribution Channels
- 13.4.6 Forecast and Commercial Opportunities
- 13.5 Emerging Applications and Cross-Segment Demand
- 13.6 End-Use Industry Investment Priorities
Chapter 14 North America Unmanned Aerial Vehicle Geographic Market Outlook, 2025-2035
- 14.1 Regional Market Size and Country-Level Shares, 2025
- 14.2 Country Market Size Comparison, 2025
- 14.3 Country Market Forecasts, 2025-2035
- 14.4 Subregional Industrial and Demand Clusters
- 14.5 Intra-Regional Pricing and Cost Differences
- 14.6 Cross-Border Trade and Supply Networks
- 14.7 Regional Supply and Demand Balances
- 14.8 Country Opportunity Comparison and Prioritization
Note: Every listed country is covered on the structure shown under the first country.
Chapter 15 North America Unmanned Aerial Vehicle Technology, Innovation and Sustainability Outlook
- 15.1 Technology Landscape and Maturity
- 15.2 Product, Process and Service Innovation
- 15.3 AI, Automation and Digital Tools in the Industry
- 15.4 Technology Adoption and Performance Benchmarking
- 15.5 Innovation Pipeline and R&D Investment
- 15.6 Patent and Intellectual Property Trends
- 15.7 Energy Efficiency and Resource Management
- 15.8 Sustainability, Recycling and Circularity
- 15.9 Technology Roadmap, 2025-2035
- 15.10 Risks of Obsolescence and Technology Substitution
Chapter 16 North America Unmanned Aerial Vehicle Market Key Strategic Imperatives
- 16.1 Growth and Market Entry Priorities
- 16.2 High-Return Products and Segments
- 16.3 Pricing, Profitability and Cost Optimization
- 16.4 Technology Investment and Product Differentiation
- 16.5 Supply Chain Localization and Resilience
- 16.6 Distribution and Customer Acquisition
- 16.7 Partnership, Acquisition and Capacity Strategy
- 16.8 Regional Expansion Priorities
- 16.9 Short-, Medium- and Long-Term Actions
Chapter 17 Competition Outlook
- 17.1 Industry Competition Characteristics
- 17.2 Market Structure and Concentration
- 17.3 Market Share and Competitive Positioning, 2025
- 17.4 Company-Wise Revenue and Product Benchmarking
- 17.5 Production and Service Capacity Benchmarking
- 17.6 Technology, Pricing and Differentiation
- 17.7 Regional Footprint and Distribution Strength
- 17.8 Mergers, Acquisitions and Strategic Alliances
- 17.9 New Entrants and Competitive Threats
- 17.10 Porter's Five Forces and Industry Attractiveness
- 17.11 Competitive Outlook, 2025-2035
Chapter 18 Company Profiles
- 18.1 Company Coverage and Selection Criteria
- 18.2 General Atomics Aeronautical Systems
- 18.2.1 Business Description
- 18.2.2 Company Ownership and Geographic Presence
- 18.2.3 Product and Service Portfolio
- 18.2.4 Manufacturing and Operating Footprint
- 18.2.5 Production Capacity and Expansion Plans
- 18.2.6 Financial Performance and Investment
- 18.2.7 Market Share and Competitive Position
- 18.2.8 Technology and Innovation Capabilities
- 18.2.9 Strategic Alliances or Partnerships
- 18.2.10 Recent Developments
- 18.2.11 Growth Strategy and Outlook
- 18.3 Northrop Grumman
- 18.4 Anduril Industries
- 18.5 AeroVironment
- 18.6 Boeing
- 18.7 Textron Systems
- 18.8 DJI
- 18.9 Shield AI
- 18.10 Skydio
- 18.11 Zipline
- 18.12 Other Relevant Market Participants
Note: Every listed company is profiled on the structure shown under the first company. The company list is preliminary and may change based on research findings, market developments, data availability and client requirements.
Chapter 19 Disclaimer
- 19.1 Research and Forecast Disclaimer
- 19.2 Data Source and Estimation Limitations
Note: The depth of individual sections depends on data availability for this market. Volume, capacity, trade and other unit-based metrics are included where applicable.