
Price and premium mix lift value as volume keeps falling
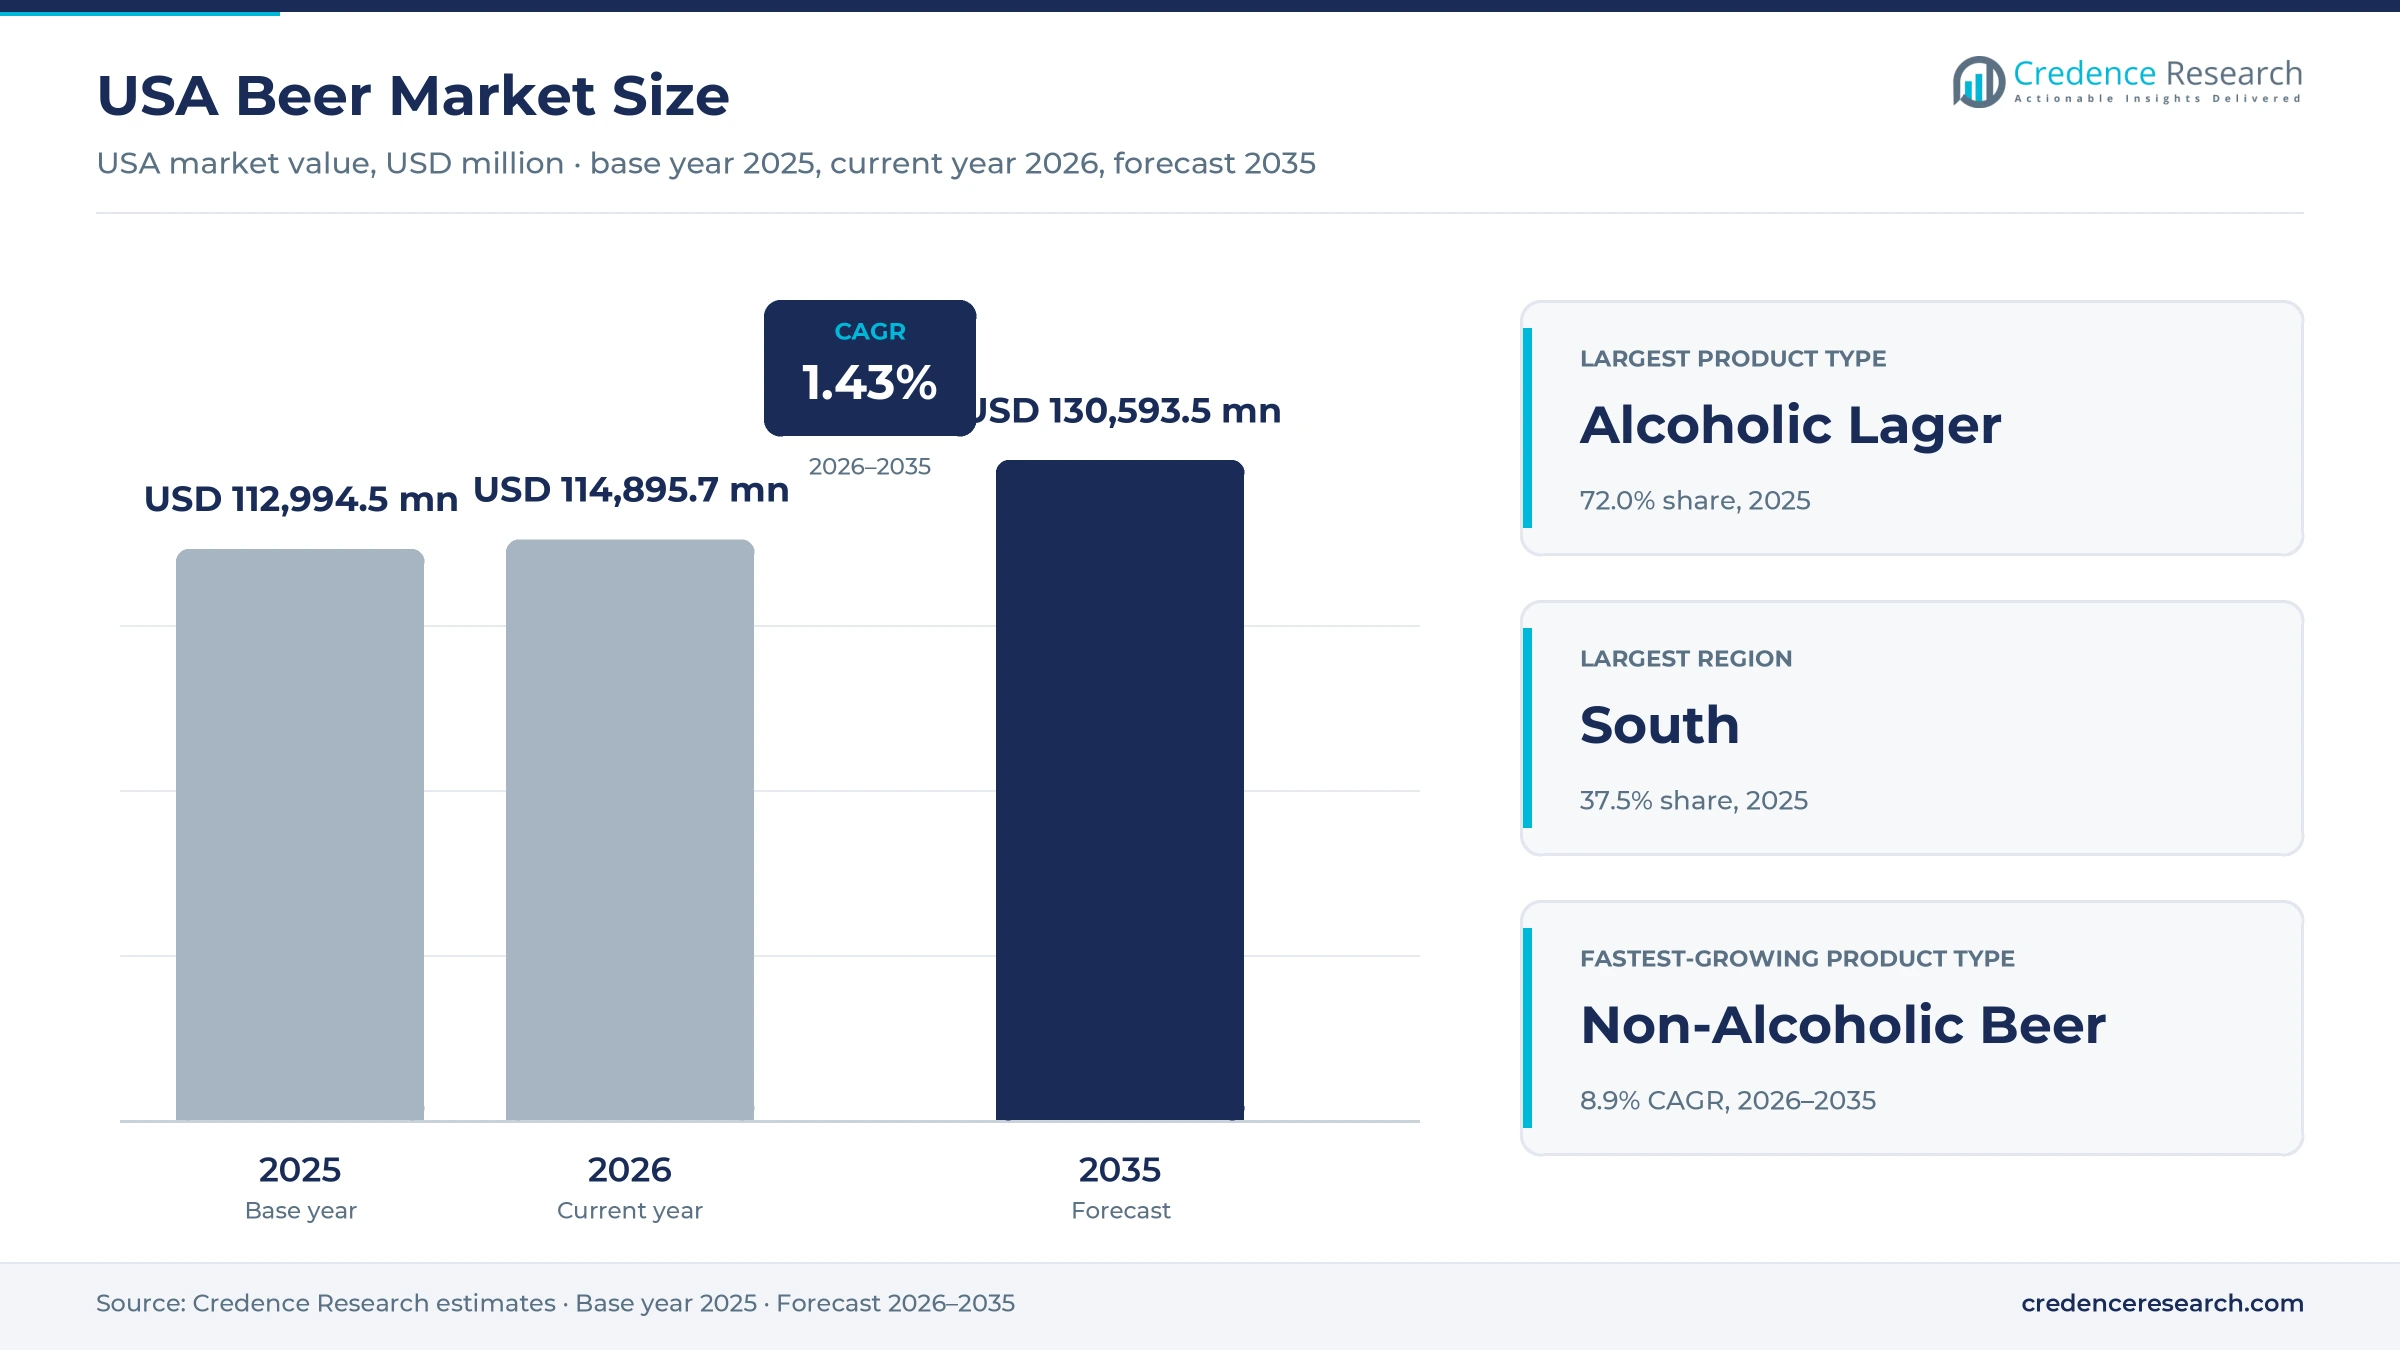
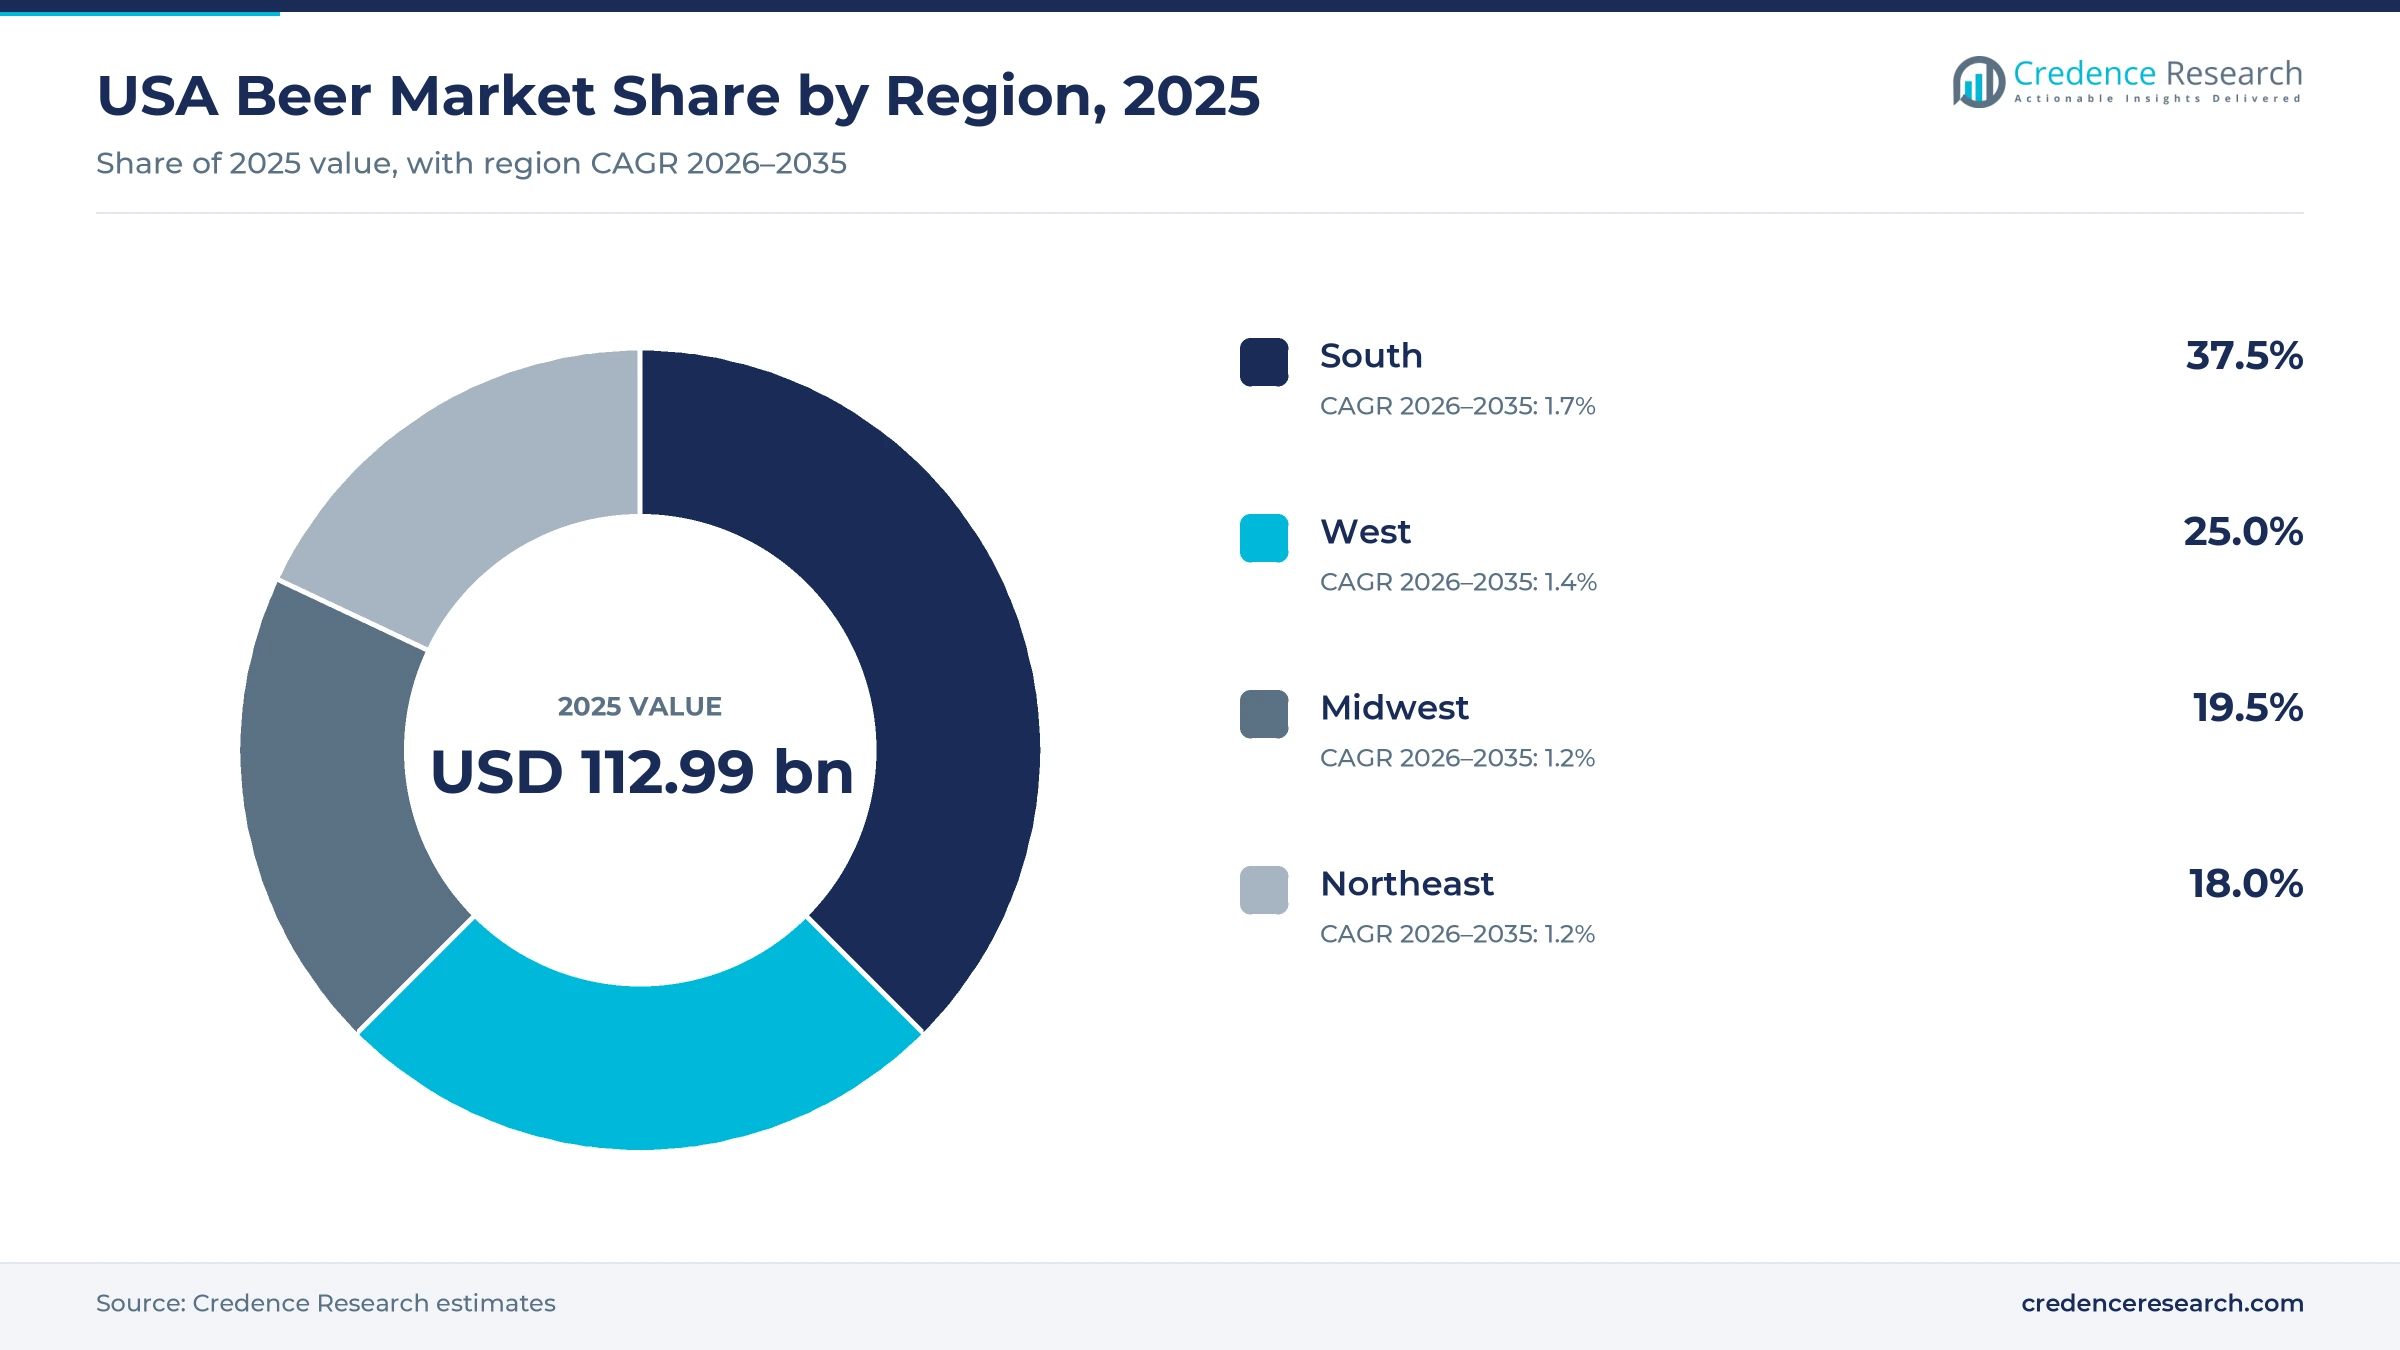
The USA beer market was valued at USD 112.99 billion in 2025 and is projected to increase from USD 114.90 billion in 2026 to USD 130.59 billion by 2035, registering a CAGR of 1.43% during 2026–2035. Value holds up while volume falls because drinkers keep trading up to super-premium light lagers, Mexican imports and non-alcoholic brews, and because shelf prices keep rising. The South held the largest regional share, 37.5% in 2025, and it is also the fastest-growing region at 1.7% a year as its population grows faster than the rest of the country. Alcoholic lager accounts for most of the value, while non-alcoholic beer is the fastest-growing product type. Brewers are spending to modernize their best plants and packaging lines even as they close capacity and cut overhead. Leadership at the top also changed in September 2025, when Circana data showed Michelob Ultra passing Modelo Especial as the best-selling beer in the country by volume.
Lager, ale, specialty and alcohol-free beer sold to adult drinkers
The market counts retail spending on alcoholic lager, alcoholic ale and specialty beer, and non-alcoholic beer bought by adults in the United States. Value is measured at the price drinkers pay, including federal and state excise taxes, whether the beer is bought from grocery, convenience and liquor stores, poured in bars and restaurants, or sold in a brewery taproom.
Flavored malt beverages, hard seltzers, hard cider and ready-to-drink cocktails are outside the scope even when brewers make them, as are homebrewing supplies and exported beer. The value chain runs from hop and barley growers and maltsters through domestic brewers, importers and can and glass suppliers to the licensed wholesalers of the three-tier system, and from them to retailers and hospitality outlets.
USA Beer Market Insights
- The USA beer market grows from USD 112.99 billion in 2025 to USD 130.59 billion by 2035 at a 1.43% CAGR, as higher prices and premium brands offset falling volumes.
- The South held the largest regional share at 37.5% in 2025 and grows fastest at 1.7% a year, helped by the fastest population growth of any Census region.
- Alcoholic lager led with 72.0% of 2025 value, while non-alcoholic beer grows fastest at 8.9% a year as moderation spreads among adult drinkers.
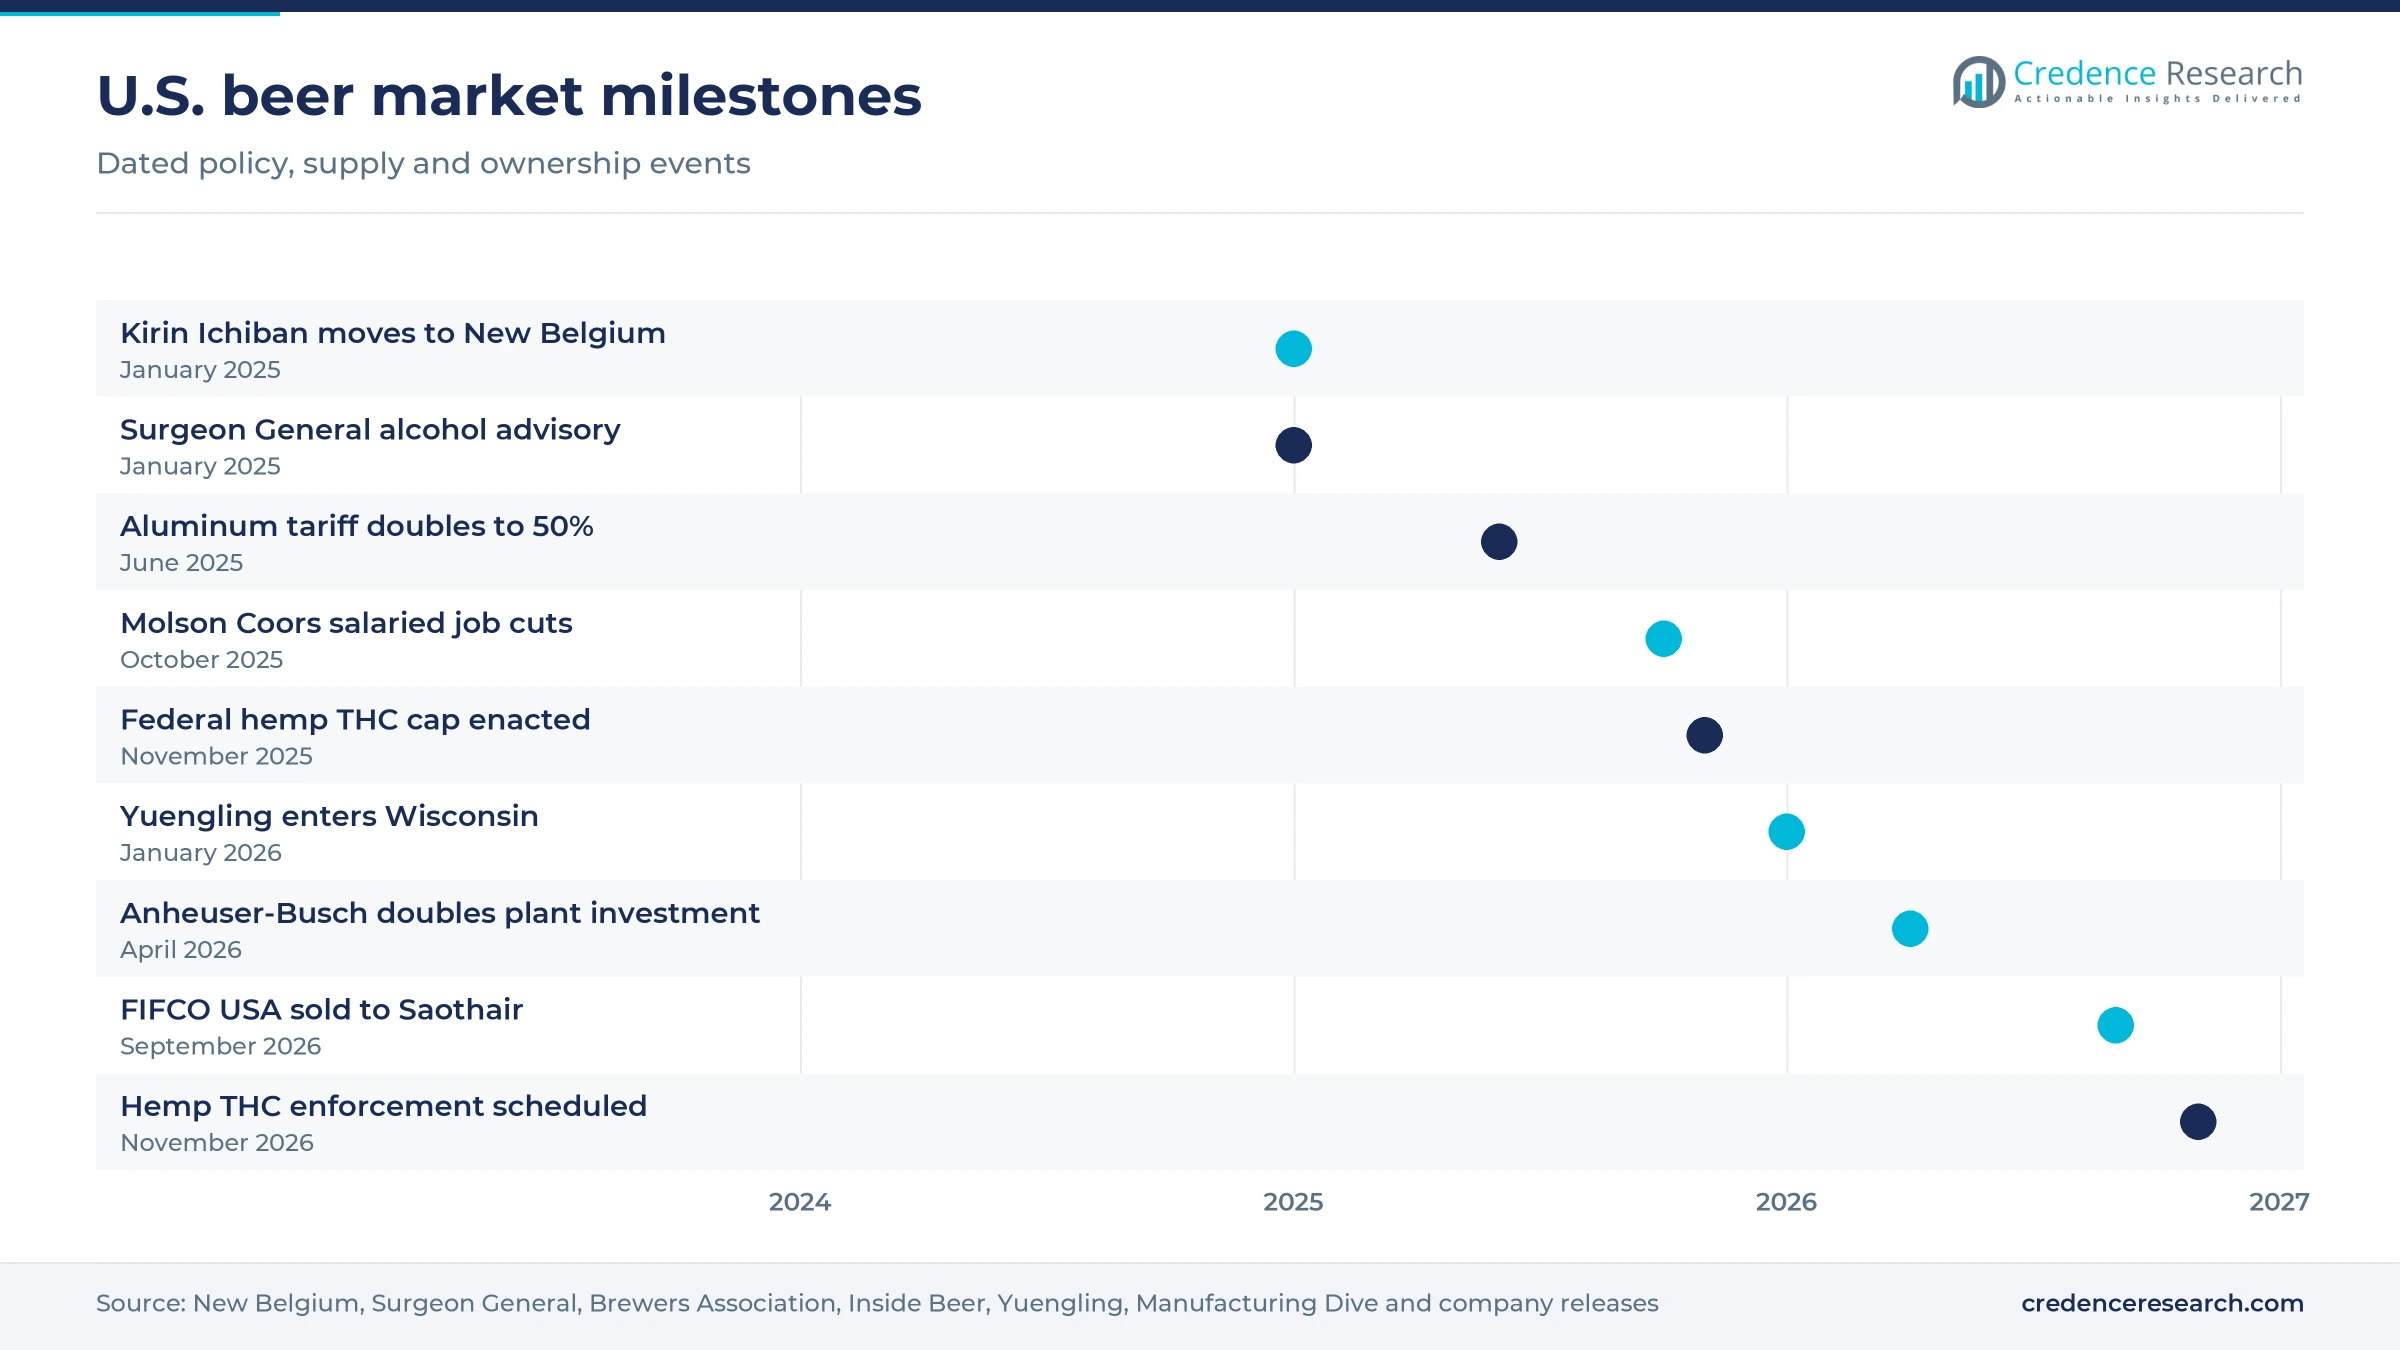
- U.S. tariffs on aluminum rose to 50% on June 4, 2025, raising can costs for an industry that sells about 76% of its packaged beer in cans.
- Anheuser-Busch raised its U.S. manufacturing investment to USD 600 million in April 2026, while rivals cut salaried jobs and closed breweries to protect margins.
Lager leads value as alcohol-free brews grow fastest
Lager holds most value as alcohol-free beer grows fastest
Based on product type, the market is categorized into alcoholic lager, alcoholic ale and specialty beer, and non-alcoholic beer. Alcoholic lager led with 72.0% of 2025 value because pale lager dominates everyday drinking, and the Brewers Association reports that it makes up about 82% of off-premise volume and 63% of on-premise volume. Non-alcoholic beer grows fastest at 8.9% a year as alcohol-free options reach bars and stores, and Heineken USA says it has sold more than 13 million cases of Heineken 0.0 since its 2019 launch. Ale and specialty beer keeps a higher price per serving, but craft ales are losing drinkers to lagers and alternatives.
Premium brands lead and gain as drinkers trade up
Based on price tier, the market is categorized into value, mainstream and premium. Premium led with 55.0% of 2025 value because imports, super-premium light lagers and craft sit in this tier, and Circana data reported by Beverage Industry put imported beer sales alone at USD 11.1 billion in 2025, about twice the sub-premium domestic total of USD 5.2 billion. Premium also grows fastest at 2.0% a year as import prices per case rose slightly faster in 2025 than the 1.6% rise for all beer. Mainstream domestic brands lose the most share as drinkers either trade up or drink less.
Off-premise chains lead as hospitality outlets grow fastest
Based on distribution channel, the market is categorized into off-premise chains, independent off-premise retailers, hospitality outlets and brewery-direct outlets. Off-premise chains led with 52.0% of 2025 value because grocery, mass, club and convenience chains sell the take-home packs most drinkers buy, and NIQ measured USD 110 billion of off-premise sales across all beverage alcohol, not beer alone, in the 52 weeks to Jan. 3, 2026. Hospitality outlets grow fastest at 1.9% a year as draft gains weight, since the Brewers Association reports that draft reached 49% of beer volume at drinking places in 2025. Independent stores lose ground, and Census Bureau data show beer, wine and liquor store sales slipping 2.8% in 2025.
Cans lead and grow as brewers add faster lines
Based on packaging format, the market is categorized into cans, glass bottles and kegs. Cans led with 66.0% of 2025 value because they are light, chill quickly and suit multipacks, and the Brewers Association says about 76% of U.S. packaged beer comes in cans. Cans also grow fastest at 1.8% a year as brewers add high-speed lines, such as the canning line of about 1,500 cans per minute at the Genesee Brewery in Rochester, New York, reported by Inside Beer. Glass bottles keep a place in imports and gift packs but lose share each year.
| Segment Group | Leading Sub-segment | Share, 2025 | Fastest-growing Sub-segment | CAGR, 2026–2035 |
|---|---|---|---|---|
| By Product Type | Alcoholic lager | 72.0% | Non-alcoholic beer | 8.9% |
| By Price Tier | Premium | 55.0% | Premium | 2.0% |
| By Distribution Channel | Off-premise chains | 52.0% | Hospitality outlets | 1.9% |
| By Packaging Format | Cans | 66.0% | Cans | 1.8% |
Excise tiers and trade-up set what drinkers pay per pint
Pricing is set per package or per pour, and the shelf price stacks brewer cost, federal and state excise, the wholesaler margin under the three-tier system and the retailer markup. Federal excise is small per can but favors small brewers, since TTB charges USD 3.50 a barrel on a small brewer's first 60,000 barrels. Trade-up, however, moves the average price paid by drinkers more than tax does. The Brewers Association reports that craft brewers held 24.8% of 2025 beer retail dollars with 13.4% of volume, which implies a craft price per unit about 1.85 times the market average. Brand owners with premium labels can pass on aluminum and freight costs more easily than value brands can.
| Item or tier | Typical price or fee | Basis |
|---|---|---|
| Small domestic brewer, first 60,000 barrels a year | USD 3.50 per barrel federal excise | TTB tax and fee rates, November 2026 |
| Domestic brewer above 2 million barrels, first 6 million barrels | USD 16.00 per barrel federal excise | TTB tax and fee rates, November 2026 |
| General federal rate, including importers without an assigned rate | USD 18.00 per barrel federal excise | TTB tax and fee rates, November 2026 |
| Average retail price, malt beverages of all types | USD 1.899 per 16 ounces, October 2026 | Bureau of Labor Statistics average price data |
| Craft price per unit against the market average | About 1.85 times | Credence Research estimate from Brewers Association 2025 dollar and volume shares |
Request a Free Sample
Fill in your details and we'll send you a free sample report.
- Sample data tables & charts
- Research methodology
Premium brands, plant upgrades and bars carry value growth
Premium brand monetization lifts value per case
Brewers earn more from each case when drinkers move up to super-premium and imported brands, which explains why value holds up better than volume. Circana data reported by Beverage Industry show domestic super-premium dollar sales rising 3% to just under USD 4.5 billion in 2025, while domestic premium brands fell 6%. Michelob Ultra became the top-selling beer by volume in the 52 weeks to Sept. 14, 2025, according to Circana. Constellation Brands said Modelo Especial remained the No. 1 U.S. beer brand by dollar sales in fiscal 2026, while Pacifico depletions grew more than 15%. Premium tiers already hold 55.0% of value, so brand owners will keep moving marketing money toward these labels.
Plant and packaging modernization cuts cost per barrel
Brewers are modernizing plants and packaging lines to lower cost per barrel as volume shrinks. Anheuser-Busch doubled its planned U.S. manufacturing investment to USD 600 million for 2026, with upgrades at breweries in Los Angeles, St. Louis and Baldwinsville, New York, according to Manufacturing Dive, and it estimates that 99% of the beer it sells in the country is brewed domestically. Pabst began contract brewing Lone Star at the Anheuser-Busch plant in Houston in the first quarter of 2025, after shipping 3.2 million barrels in 2023, according to the Brewers Association. New Belgium, a subsidiary of Kirin Holdings through Lion, took over production of Kirin Ichiban at its own breweries in January 2025. Shared capacity keeps plants full, so contract brewing is likely to spread further.
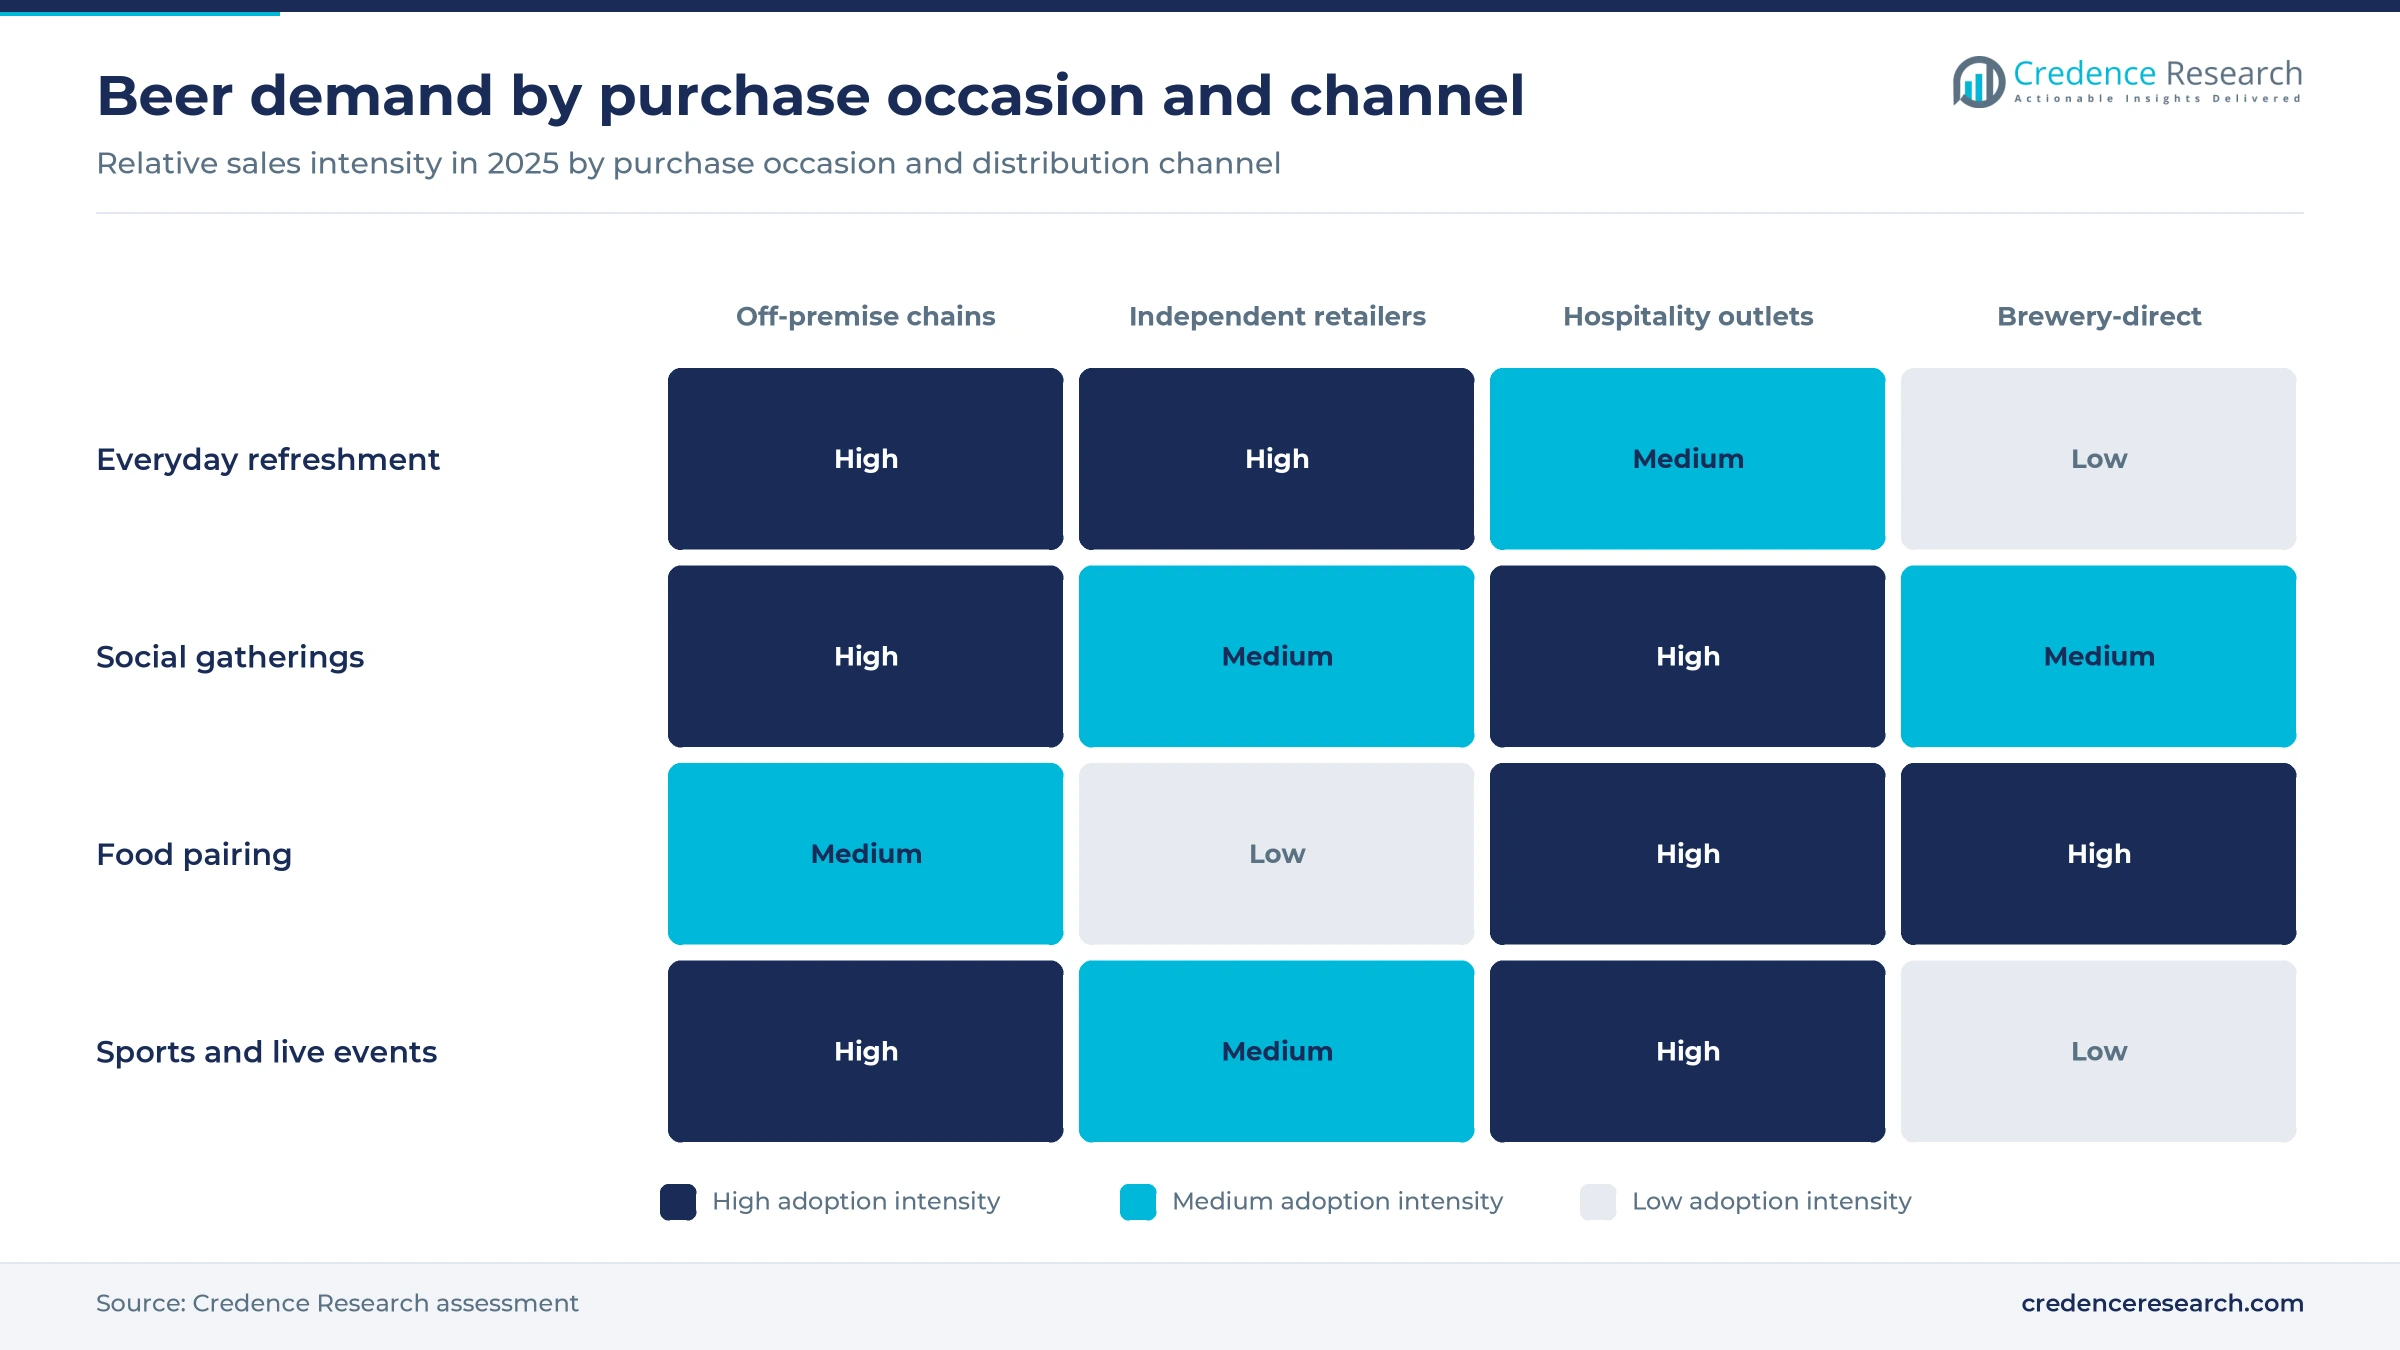
Hospitality-led differentiation keeps draft ahead of package
Bars, restaurants and venues give brewers a stage that a store shelf cannot, which matters when total demand is falling. BeerBoard data for the third quarter of 2025 show on-premise draft volume down only 1.8%, while packaged beer served in the same outlets fell 5.1%. Yuengling led with draft when it entered Wisconsin, with taps flowing in bars and restaurants on Jan. 26, 2026, and packaged beer following statewide on March 2. During the 2026 World Cup, Stella Artois offered to reimburse fans up to USD 100,000 for drinks bought at their local bar during weekday matches. Hospitality outlets grow at 1.9% a year, and brands that win draft handles first tend to win shelf space later.
Steady price increases keep value rising as volume falls
Price, not volume, carries value growth through 2035, and retail data show the increases continuing. Bureau of Labor Statistics data put the average price of malt beverages at USD 1.899 per 16 ounces in October 2026, up from USD 1.813 in January 2025, a gain of about 4.7% over 21 months that roughly keeps pace with general inflation. Craft brewers show the same pattern, since the Brewers Association reports that their retail dollars fell 2.8% in 2025 against a 4% volume decline. Constellation Brands reported Modelo Especial depletions down about 3% in fiscal 2026 even as the brand held the top spot by dollar sales. Brewers that push price too far, however, risk losing occasional buyers to cheaper packs or to other drinks.
Alcohol-free lines and new import origins reshape shelves
Rise of non-alcoholic beer into the mainstream range
Non-alcoholic beer is moving from a niche to a regular line on mainstream shelves. Circana data reported by Beverage Industry show non-alcoholic beer sales of nearly USD 583.4 million in the 52 weeks to Dec. 28, 2025, up 22.1% in dollars and 23.9% in cases. Heineken USA launched Heineken 0.0 Ultimate, a zero-calorie and zero-sugar brew, in select states including Florida, New York and Texas in March 2026. Constellation Brands added Modelo Chelada Limón y Sal Non-Alcoholic, the first alcohol-free offering under the Modelo name. Large brewers now treat alcohol-free extensions as a way to keep moderating drinkers inside their brands rather than losing them to other categories.
Shift in import demand toward new origins
Import demand is shifting beyond the Mexican lagers that dominate the category. Circana data reported by Beverage Industry show Mexican imports slipping in dollars in 2025, while they still accounted for more than 84% of imported beer dollars. Japanese imports grew 15.5% over the same period, a sign that drinkers who trade up look for distinct origins. Within Mexican brands the mix is moving too, since Constellation Brands reported Corona Extra depletions down about 7% in fiscal 2026 while Victoria grew about 16%. Importers with brands outside the largest Mexican labels have room to gain shelf space as retailers rebalance their import sets.
Brewpubs and festivals open a steadier brewery-direct model
Brewery-direct sales are shrinking overall, but formats that pair beer with food and events hold up best, which points to an opening for operators. The Brewers Association counted 3,525 brewpubs in 2025, and their production fell by less than 2%, against a 3.9% drop at taprooms. Sierra Nevada staged The Hazy Hideaway, a two-day music festival at its Mills River, North Carolina, brewery, on Aug. 21 and 22, 2026, with a special taproom menu. Events of this kind turn a brewery into a destination for social gatherings and food pairing. Brewers that add kitchens, events and draft-only releases can lift spending per visit even as visits flatten.
Hemp THC limits can return drinking occasions to beer
Federal limits on intoxicating hemp products could return some drinking occasions to beer and alcohol-free brews. The Continuing Appropriations and Extensions Act of 2026, enacted on Nov. 12, 2025, caps finished hemp products at 0.4 milligrams of total THC per container, according to the Brewers Association, a level far below what most hemp beverages now contain. Enforcement of the new cap is scheduled to begin on Nov. 12, 2026. Brewers that also sell hemp drinks lose a growth line, but lager and non-alcoholic brands can win back social occasions those drinks shared with hard seltzers. Pending bills could delay enforcement to Nov. 12, 2028, so the gain is not certain.
Falling volume, tariffs and health warnings squeeze brewers
Volume decline erodes plant use and delivery economics
Falling volume is the main brake on the market, because fixed brewery and distribution costs are spread over fewer barrels. Beer Institute estimates put 2025 domestic taxable removals at 139.1 million barrels, down 5.9% from 2024. The Brewers Association reports that overall production and imports fell 5.7% in the same year. Large brewers have responded by closing capacity, and wholesalers carry thinner loads per delivery. Brewers that cannot raise price or improve mix will see margins compress fastest.
Moderation and health warnings shrink the drinking population
Fewer adults drink, and more of them see moderate drinking as a health risk. Gallup found in August 2026 that 54% of U.S. adults drink, matching the 2025 record low, and only 50% of adults aged 18 to 34 do. Beer remains the most preferred drink at 36%, but liquor now ties it among younger drinkers. The Surgeon General's advisory of Jan. 3, 2025, called for cancer warnings on alcohol labels, which have not changed since 1988. Brewers are answering this shift with lighter, lower-calorie and alcohol-free brands.
Aluminum tariffs keep can costs high
Aluminum tariffs keep packaging costs high because cans carry most of the volume. The Brewers Association reports that U.S. tariffs on aluminum doubled to 50% on June 4, 2025, and a restructuring announced on April 2, 2026, kept finished cans at that rate while cutting lids to 25%. Constellation Brands cited aluminum tariffs as a margin pressure in its fiscal 2026 results. Small brewers buy cans in smaller lots and have the least power to pass these costs on to drinkers.
Hispanic consumer pullback hits import and lager brands
Weaker spending by Hispanic consumers in 2025 hit some of the largest import and lager brands. Heineken said its U.S. business was disproportionately affected by lower consumption among Hispanic drinkers, and Circana data show its off-premise dollar sales falling 8.7% in 2025, according to VinePair. Constellation Brands reported the same cohort weakness in its fiscal 2026 results. Brands with heavy exposure to these buyers face a slower recovery, so suppliers are widening their marketing toward younger and moderating drinkers.
The South leads on population growth and import demand
| Region | Value, 2025 (USD billion) | Share, 2025 | CAGR, 2026–2035 |
|---|---|---|---|
| South | 42.37 | 37.5% | 1.7% |
| West | 28.25 | 25.0% | 1.4% |
| Midwest | 22.03 | 19.5% | 1.2% |
| Northeast | 20.34 | 18.0% | 1.2% |
The South leads as its population grows fastest
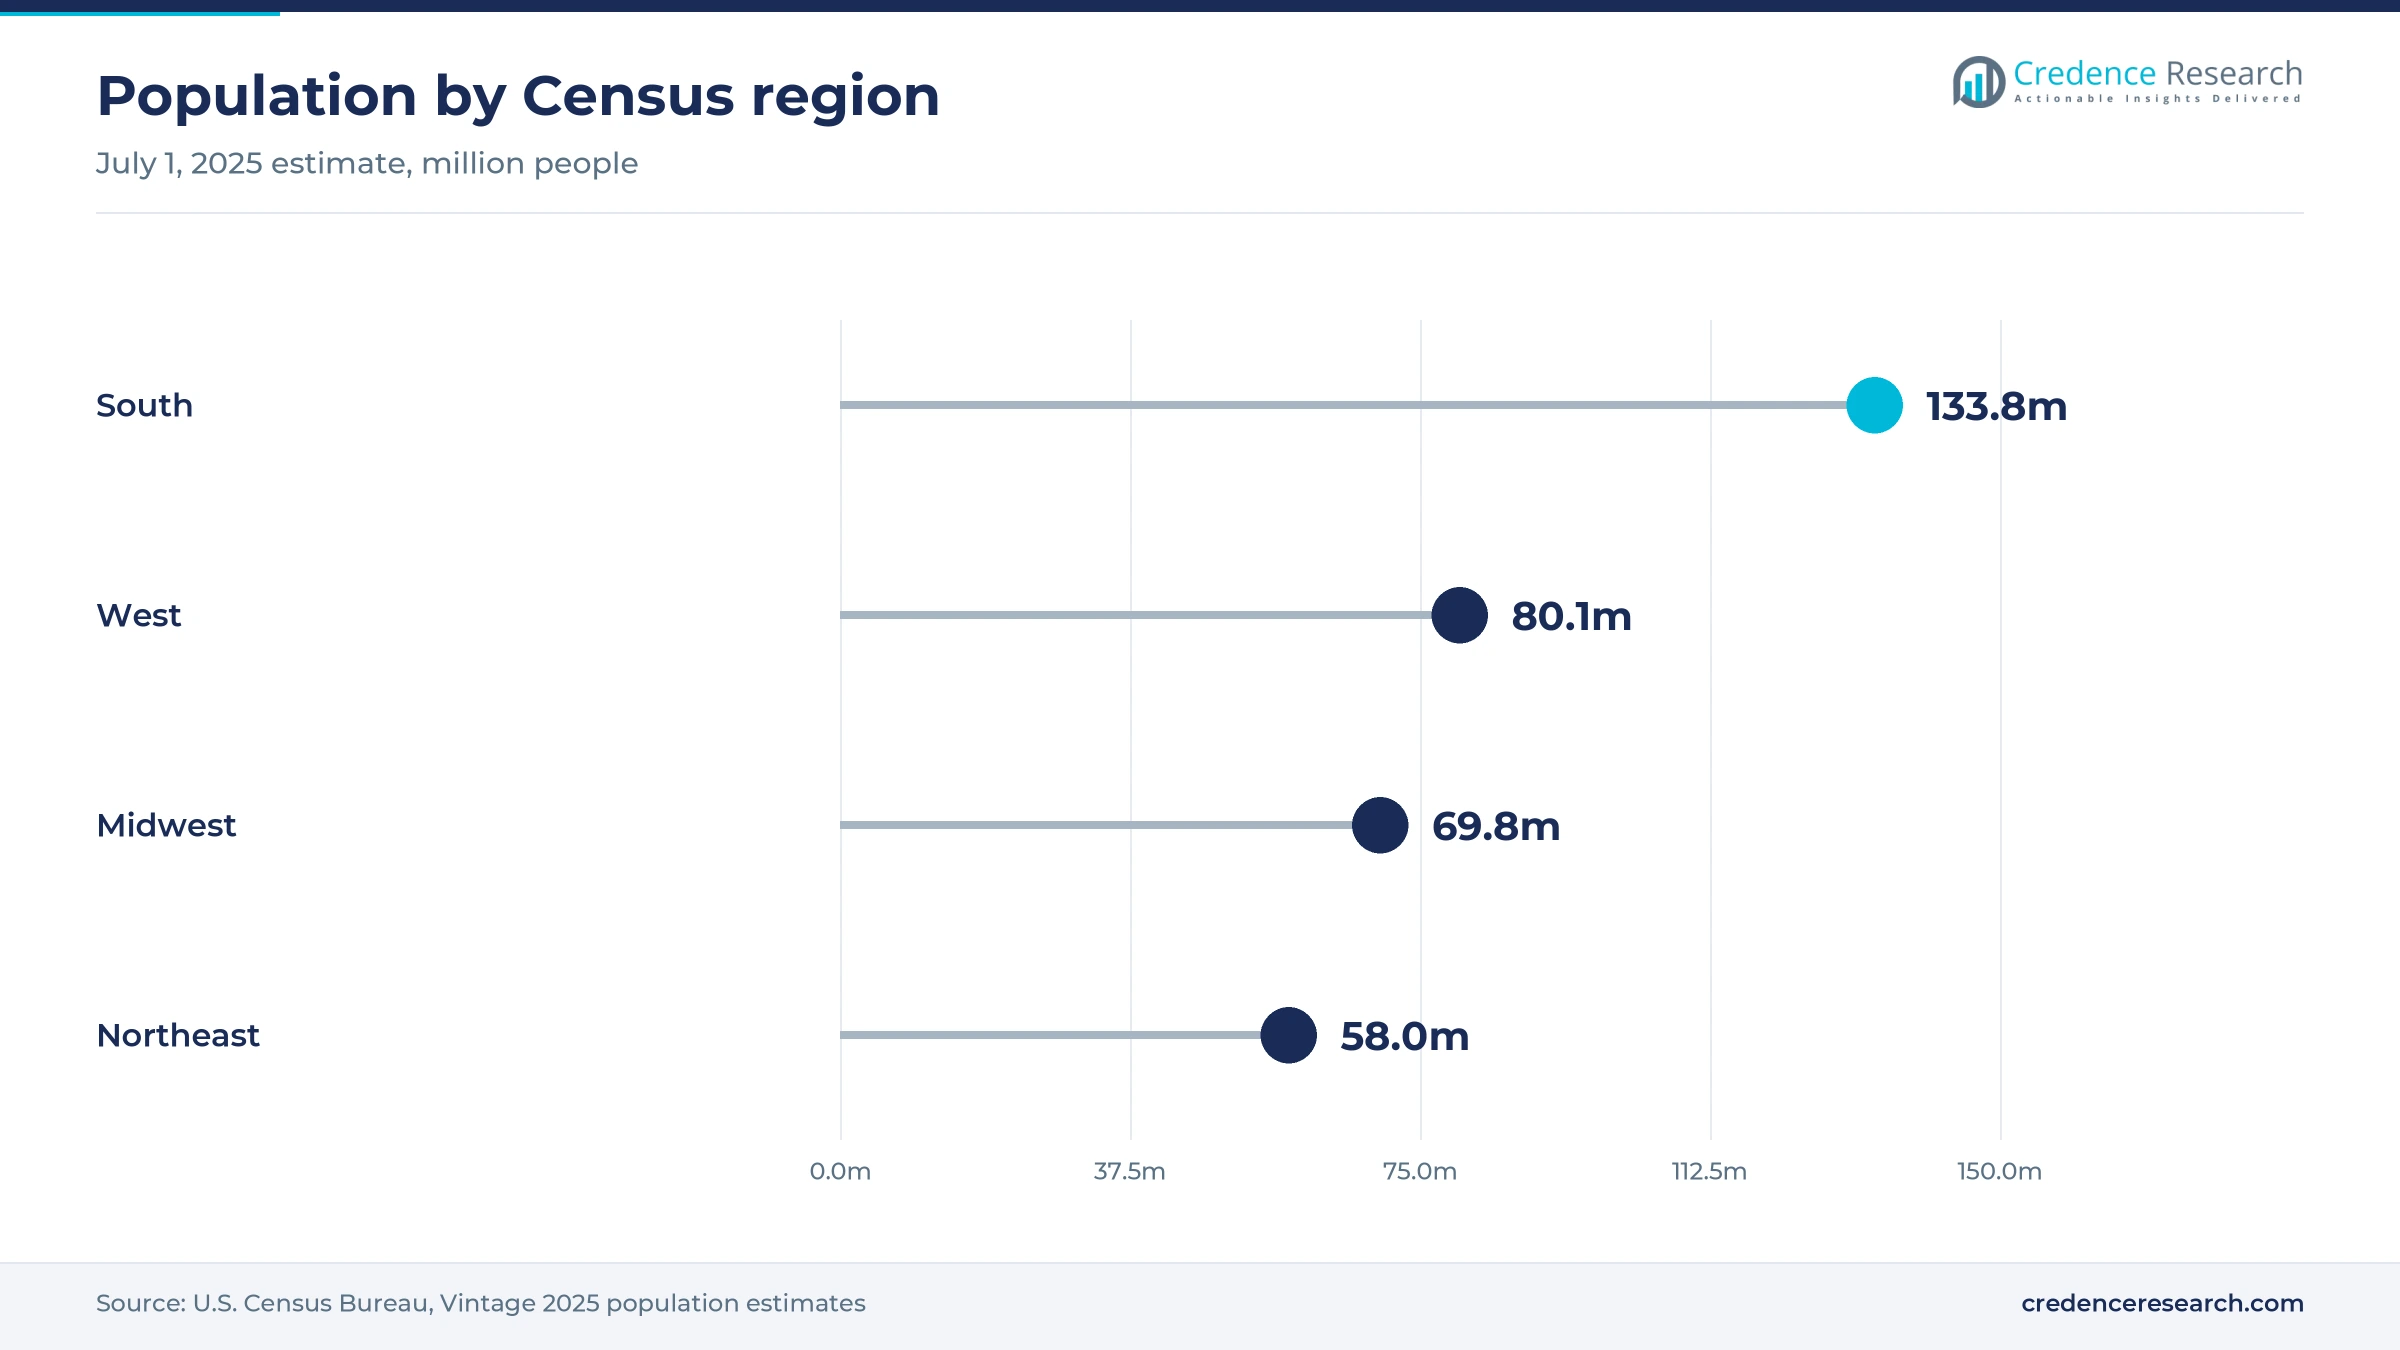
The South held 37.5% of 2025 value and grows at 1.7% a year, the fastest of the four regions. The Census Bureau puts its July 1, 2025, population at 133.8 million, after adding about 1.2 million people in a year, well ahead of every other region. Texas and Florida anchor import and light lager demand, and both were among the first states to receive the new zero-calorie alcohol-free Heineken brew. Maryland loses a brewery destination, since Diageo will close the Guinness Open Gate Brewery in Baltimore by the end of 2026.
The west pairs premium spending with hop supply
The West held 25.0% of 2025 value and grows at 1.4% a year. Its population reached 80.1 million in 2025, according to Census Bureau estimates, and high incomes in coastal metros support craft, import and premium light lager spending. The region also grows most of the country's hops, and a Brewers Association summary of the USDA hop report shows 2025 output from Washington, Oregon and Idaho falling 5% to 83 million pounds, which tightens hop and malt supply for ale brewers.
The Midwest relies on price and mix more than new drinkers
The Midwest held 19.5% of 2025 value and grows at 1.2% a year. Its population of 69.8 million rose only about 0.35% in 2025, according to Census Bureau estimates, so growth depends on price and mix more than on new drinkers. The region keeps major brewing capacity, including the Anheuser-Busch brewery in St. Louis and the Guinness brewery in Chicago that opened in 2023. Yuengling's 2026 entry into Wisconsin added a new lager option for regional bars and stores.
The Northeast grows slowly around historic breweries
The Northeast held 18.0% of 2025 value and grows at 1.2% a year. Its population of 58.0 million grew just 0.18% in 2025, the slowest of the four regions, according to Census Bureau estimates. The region is home to the Yuengling brewery in Pottsville, Pennsylvania and the Genesee Brewery in Rochester, New York, which Saothair Capital Partners bought in September 2026 with the rest of FIFCO USA. Dense cities and a strong bar trade support spending on draft tap systems in the region.
Plant, sponsorship and ownership moves in 2026
| Development | Status and market relevance |
|---|---|
| In January 2026, Yuengling began pouring draft in Wisconsin, with packaged beer following statewide in March 2026. | Launched; Midwest expansion |
| In April 2026, Anheuser-Busch doubled its U.S. manufacturing investment to USD 600 million for 2026. | Committed; brewery upgrades and training |
| In June 2026, AB InBev launched World Cup bar programs for Michelob Ultra, Budweiser and Stella Artois. | Running; on-premise sports occasions |
| In September 2026, Saothair Capital Partners bought FIFCO USA from Heineken and renamed it North American Breweries. | Completed; Genesee Brewery ownership change |
| In October 2026, Diageo said it would close the Guinness Open Gate Brewery in Baltimore by the end of 2026. | Announced; brewery closure |
Canning, modular tanks and dealcoholization set costs
- High-speed canning lines fill and seam cans at hundreds of units a minute, which lowers cost per case for brewers that keep plants full with their own and contract volume.
- Modular brewing capacity lets brewers add tanks in smaller steps, and Constellation Brands says it keeps investing in modular capacity for its beer business.
- Dealcoholization systems remove alcohol after fermentation or limit it during brewing, which lets large brewers build alcohol-free versions of their existing brands.
- Draft monitoring systems track pours and line performance in bars, which helps venues cut waste and gives brewers pour-level data on how their brands perform.
Need a Custom Version of This Report?
Tailor the scope, geography, or segments to your exact requirements.
- Custom geography or segment scope
- Direct access to our analyst team
National brewers, importers and contract plants compete
Competition turns on brand strength in light lager and Mexican imports, on wholesaler attention and on the cost of keeping plants full. Anheuser-Busch leads with Michelob Ultra and Budweiser, and it backs them with sports marketing such as its official World Cup sponsorship. Constellation Brands competes almost entirely in high-end Mexican imports through Modelo, Corona and Pacifico. Molson Coors relies on its national lagers and Blue Moon, and it cut about 400 salaried jobs in its Americas unit in October 2025. Heineken USA, Diageo with Guinness and Kirin with New Belgium compete in imports and specialty beer, while Pabst and North American Breweries run value and regional brands largely through contract capacity. Yuengling uses its joint venture with Molson Coors to move west, and independent craft brewers such as Sierra Nevada compete mainly through local draft, taprooms and events.
Big brewers and contract plants top a shrinking craft base
The supply side is concentrated at the top and fragmented underneath. Anheuser-Busch, Constellation Brands, Molson Coors and Heineken USA carry most national lager and import volume, while the Brewers Association counted 9,578 craft breweries in 2025, with 300 openings against 481 closings. Contract brewing links the two tiers, as Pabst, Kirin and North American Breweries rely on shared or third-party capacity. Entry barriers rise with scale, because the three-tier system requires licensed wholesalers and national shelf space is hard to win. Margins sit highest with brand owners of premium lagers and imports.
Companies profiled and their roles in this market
| Company | Type | Role in the market |
|---|---|---|
| Anheuser-Busch | National brewer | Doubled 2026 U.S. manufacturing investment; Michelob Ultra leads by volume |
| Constellation Brands | Mexican import brand owner | Modelo Especial leads by dollar sales; Pacifico and Victoria growing |
| Molson Coors Beverage Company | National brewer | Cut about 400 salaried jobs in October 2025; Yuengling joint venture partner |
| Heineken USA | Importer | Launched Heineken 0.0 Ultimate in March 2026 |
| Diageo | Importer and brewer of Guinness | Closing its Baltimore brewery and keeping its Chicago brewery |
| Pabst Brewing Company | Brand owner using contract brewing | Lone Star brewed at the Anheuser-Busch Houston plant from 2025 |
| D.G. Yuengling & Son | Family-owned brewer | Entered Wisconsin in January 2026 |
| Kirin Holdings | Owner of New Belgium and Bell's through Lion | New Belgium brews Kirin Ichiban from January 2025 |
| FIFCO USA (North American Breweries) | Regional brewer and contract manufacturer | Sold to Saothair Capital Partners in September 2026 |
| Sierra Nevada Brewing Co. | Independent craft brewer | Held The Hazy Hideaway festival at Mills River in August 2026 |
Value per barrel, not barrel count, drives growth
Credence Research's view is that the USA beer market will grow through price and mix rather than through more drinkers. Volume is falling and the share of adults who drink sits at a record low, so gains in value have to come from premium brands, alcohol-free extensions and better hospitality occasions. Tariffs and plant costs press on margins, which is why large brewers are consolidating capacity while investing in their best plants. The strongest positions belong to brand owners with growing super-premium or import labels and the scale to share capacity with smaller brands.
Removals, price points and retail dollars anchor the model
The report uses 2025 as the base year and 2026 to 2035 as the forecast period. Market values come from the Credence Research model, which builds retail value from domestic taxable removals and imports, off-premise and on-premise price points, and published retail dollar totals for the category. Segment and regional splits are Credence Research estimates built from Brewers Association, Beer Institute, Bureau of Labor Statistics, Census Bureau, TTB and USDA data, retail scan data published in trade media, and company releases and filings. No interviews or primary surveys were conducted for this edition.
Fewer barrels earn more per barrel through 2035
The USA beer market is expected to grow from USD 114.90 billion in 2026 to USD 130.59 billion by 2035 at a 1.43% CAGR. Non-alcoholic beer grows fastest at 8.9% a year from a small base, while premium brands hold the largest share of value. Cans will remain the main package, and hospitality outlets will gain as draft holds up better than package sales. The South will add the most value as its population grows. By 2035, fewer barrels are likely to be sold, but each one should earn more than it does today.
Price discipline and moderation decide the 2035 range
The range of outcomes depends on whether brewers can keep raising prices while fewer adults drink. A downside case assumes volume keeps falling at the 2025 pace, tariffs stay high and price increases stall. The base case assumes slower volume declines offset by steady trade-up to premium and imported brands. An upside case needs non-alcoholic beer to scale quickly, hemp limits to return occasions to beer and the 2026 World Cup to lift hospitality sales beyond the tournament.
| Scenario | CAGR, 2026–2035 | Value, 2035 | What has to hold |
|---|---|---|---|
| Downside | -0.1% | USD 114.17 billion | Volume keeps falling near the 2025 pace, tariffs persist and brewers lose pricing power |
| Base | 1.43% | USD 130.59 billion | Volume declines ease and premium and imported brands keep lifting value per case |
| Upside | 2.4% | USD 142.61 billion | Alcohol-free beer scales, hemp limits return occasions and hospitality sales stay strong |
Frequently Asked Questions
How big is the USA beer market?
Which product type leads U.S. beer spending?
Which U.S. region leads the market?
Why is U.S. beer volume falling?
How fast is non-alcoholic beer growing?
How do aluminum tariffs affect U.S. brewers?
Who are the key companies in the USA beer market?
What do U.S. drinkers pay for beer?
Table of Content
Chapter 1 Market Segmentation
- 1.1 Segmentation Framework
- 1.1.1 Product and Service Classification
- 1.1.2 Application and End-Use Classification
- 1.1.3 Technology and Solution Classification
- 1.1.4 Customer and Distribution Channel Classification
- 1.1.5 Geographic Segmentation
- 1.1.6 Market Segment Definitions and Boundaries
- 1.2 By Product Type
- 1.2.1 Alcoholic lager
- 1.2.2 Alcoholic ale and specialty beer
- 1.2.3 Non-alcoholic beer
- 1.3 By Price Tier
- 1.3.1 Value
- 1.3.2 Mainstream
- 1.3.3 Premium
- 1.4 By Packaging Format
- 1.4.1 Cans
- 1.4.2 Glass bottles
- 1.4.3 Kegs
Chapter 2 Introduction
- 2.1 Report Objectives and Scope
- 2.2 Product Definition and Industry Terminology
- 2.3 Market Inclusions and Exclusions
- 2.4 Research Process
- 2.4.1 Primary Research and Expert Interviews
- 2.4.2 Secondary Research and Source Review
- 2.4.3 Top-Down and Bottom-Up Estimation
- 2.4.4 Data Triangulation and Verification
- 2.5 Market Size Measurement Basis
- 2.5.1 2025: USD 112.99 billion → 2035: USD 130.59 billion
- 2.6 Historical and Forecast Reference Periods
- 2.6.1 Historical Period: 2018-2025
- 2.6.2 Base Year: 2025
- 2.6.3 Forecast Period: 2025-2035
- 2.7 Research Assumptions and Limitations
Chapter 3 Executive Summary
- 3.1 Market Snapshot and Key Findings
- 3.2 Base-Year Market Size, 2025
- 3.3 Forecast Market Size, 2035
- 3.4 Revenue and Volume Growth Outlook
- 3.5 Key Demand and Supply Indicators
- 3.6 Leading Market Segments
- 3.7 Fastest-Growing Market Opportunities
- 3.8 Regional Performance Highlights
- 3.9 Technology and Industry Transformation
- 3.10 Competitive Landscape Summary
- 3.11 Analyst View and Strategic Implications
Chapter 4 USA Beer Market Trends and Developments
- 4.1 Historical Industry Development, 2018-2025
- 4.2 Recent Market Trends and Developments
- 4.3 Demand and Customer Behavior Trends
- 4.4 Technology and Product Innovation
- 4.5 Artificial Intelligence, Automation and Digitalization
- 4.6 Local Manufacturing and Supply Chain Realignment
- 4.7 Industry Partnerships, Mergers and Acquisitions
- 4.8 Sustainability and Circular Economy Developments
- 4.9 Government and Private Sector Investment Trends
- 4.10 Emerging Business Models and Commercialization
- 4.11 Industry Developments and Announcements
Chapter 5 USA Beer Market Production, Supply and Demand Analysis
- 5.1 Demand Trend and Consumption Analysis, 2018-2025
- 5.2 Demand Forecast, 2025-2035
- 5.3 Production and Output Trend, 2018-2025
- 5.4 Production and Output Forecast, 2025-2035
- 5.5 Installed Capacity and Capacity Utilization
- 5.6 Company-Wise Production Plants and Statistics
- 5.6.1 Installed Production Capacity
- 5.6.2 Actual Production
- 5.6.3 Planned Capacity and Expansion Targets
- 5.7 Supply Chain Structure and Procurement Trends
- 5.8 Supply-Demand Gap and Bottlenecks
- 5.9 Import Dependence and Sourcing Structure
- 5.10 Contract Manufacturing and Outsourcing
- 5.11 Regional Supply and Demand Concentration
Chapter 6 USA Beer Market Pricing Analysis
- 6.1 Pricing Structure and Measurement
- 6.2 Historical Pricing Trends, 2018-2025
- 6.3 Pricing Outlook, 2025-2035
- 6.4 Average Selling Price and Unit Economics
- 6.5 Pricing by Product and Market Segment
- 6.6 Geographic Pricing Differences
- 6.7 Key Input, Energy, Labor and Logistics Costs
- 6.8 Contract Pricing and Purchasing Models
- 6.9 Pricing Sensitivity and Competitive Positioning
- 6.10 Price, Margin and Profitability Implications
Chapter 7 USA Beer Market Dynamics
- 7.1 Market Growth Drivers
- 7.1.1 Demand-Side Drivers
- 7.1.2 Technology and Innovation Drivers
- 7.1.3 Infrastructure and Investment Drivers
- 7.1.4 Regulatory and Policy Drivers
- 7.2 Market Restraints
- 7.2.1 Cost and Affordability Constraints
- 7.2.2 Technology and Adoption Barriers
- 7.2.3 Supply Chain and Operational Constraints
- 7.3 Market Challenges
- 7.3.1 Competitive Pressure and Margin Erosion
- 7.3.2 Skills, Infrastructure and Implementation Gaps
- 7.4 Emerging Market Opportunities
- 7.5 Market Dynamics Impact and Time-Horizon Assessment
Chapter 8 USA Beer Value Chain Analysis
- 8.1 Industry Value Chain Overview
- 8.2 Upstream Suppliers and Critical Inputs
- 8.3 Technology and Component Providers
- 8.4 Manufacturing or Service Delivery
- 8.5 Distribution, Channel Partners and Integrators
- 8.6 Downstream Applications and End Users
- 8.7 Value Addition and Profit Pools
- 8.8 Vertical Integration and Outsourcing
- 8.9 Supplier Concentration and Risk
- 8.10 Supply Chain Localization and Resilience
Chapter 9 USA Beer Market Regulations and Policies
- 9.1 Relevant Laws, Standards and Compliance Frameworks
- 9.2 Product, Service, Safety and Quality Requirements
- 9.3 Government Policies, Incentives and Subsidies
- 9.4 Imports, Exports and Trade Barriers
- 9.5 Public Procurement and Local Content Requirements
- 9.6 Environmental and Sustainability Compliance
- 9.7 Upcoming Policy Changes and Market Implications
Chapter 10 USA Beer Market Hotspots and Opportunities
- 10.1 Market Opportunity Mapping and Growth Hotspots
- 10.2 High-Growth Applications and Customer Groups
- 10.3 Underserved Markets and White-Space Opportunities
- 10.4 Emerging Technology and Product Opportunities
- 10.5 New Capacity and Investment Hotspots
- 10.6 Market Entry and Expansion Opportunities
- 10.7 Distribution and Partnership Opportunities
- 10.8 Near-Term and Long-Term Commercial Potential
- 10.9 Opportunity Attractiveness and Execution Risks
Chapter 11 USA Beer Market Outlook, 2025-2035
- 11.1 Market Size and Analysis
- 11.1.1 Revenue (Market Measurement: 2025: USD 112.99 billion → 2035: USD 130.59 billion)
- 11.1.2 Market Volume and Quantity Sold
- 11.1.3 Historical Market Size, 2018-2025
- 11.1.4 Base-Year Market Size, 2025
- 11.2 Market Forecast, 2025-2035
- 11.2.1 Revenue Forecast to 2035
- 11.2.2 Volume Forecast to 2035
- 11.2.3 CAGR and Year-on-Year Growth
- 11.2.4 Incremental Revenue Opportunity
- 11.3 Forecast Assumptions and Scenario Analysis
- 11.3.1 Base-Case Forecast
- 11.3.2 Optimistic and Conservative Scenarios
- 11.3.3 Technology, Pricing and Policy Sensitivities
- 11.4 Market Attractiveness and Growth Outlook
Chapter 12 USA Beer Market Segmentation and Outlook
- 12.1 Segmentation Summary and Market Shares, 2025
- 12.2 Largest and Fastest-Growing Segments
- 12.3 By Product Type - Market Size and Forecast, 2025-2035
- 12.3.1 Segment Definition and Scope
- 12.3.2 Historical Market Size, 2018-2025
- 12.3.3 Revenue Forecast, 2025-2035
- 12.3.4 Volume Forecast, 2025-2035
- 12.3.5 Base-Year Market Share, 2025
- 12.3.6 Segment CAGR and Growth Drivers
- 12.3.7 Subsegment Market Size and Forecast
- 12.3.7.1 Alcoholic lager
- 12.3.7.2 Alcoholic ale and specialty beer
- 12.3.7.3 Non-alcoholic beer
- 12.3.8 Subsegment Pricing and Adoption Trends
- 12.3.9 Leading Suppliers and Competition
- 12.3.10 Regional Demand and Opportunities
- 12.4 By Price Tier - Market Size and Forecast, 2025-2035
- 12.4.1 Segment Definition and Scope
- 12.4.2 Historical Market Size, 2018-2025
- 12.4.3 Revenue Forecast, 2025-2035
- 12.4.4 Volume Forecast, 2025-2035
- 12.4.5 Base-Year Market Share, 2025
- 12.4.6 Segment CAGR and Growth Drivers
- 12.4.7 Subsegment Market Size and Forecast
- 12.4.7.1 Value
- 12.4.7.2 Mainstream
- 12.4.7.3 Premium
- 12.4.8 Subsegment Pricing and Adoption Trends
- 12.4.9 Leading Suppliers and Competition
- 12.4.10 Regional Demand and Opportunities
- 12.5 By Packaging Format - Market Size and Forecast, 2025-2035
- 12.5.1 Segment Definition and Scope
- 12.5.2 Historical Market Size, 2018-2025
- 12.5.3 Revenue Forecast, 2025-2035
- 12.5.4 Volume Forecast, 2025-2035
- 12.5.5 Base-Year Market Share, 2025
- 12.5.6 Segment CAGR and Growth Drivers
- 12.5.7 Subsegment Market Size and Forecast
- 12.5.7.1 Cans
- 12.5.7.2 Glass bottles
- 12.5.7.3 Kegs
- 12.5.8 Subsegment Pricing and Adoption Trends
- 12.5.9 Leading Suppliers and Competition
- 12.5.10 Regional Demand and Opportunities
- 12.6 Segment Growth Comparison
- 12.7 Segment Attractiveness and Priority Matrix
Chapter 13 USA Beer Geographic Market Outlook, 2025-2035
- 13.1 Domestic Market Distribution and Demand Clusters
- 13.2 State- or Province-Wise Market Size and Forecast, 2025-2035
- 13.3 City and Metropolitan Market Outlook
- 13.4 Industrial, Manufacturing and Commercial Clusters
- 13.5 Geographic Concentration of Key End Users
- 13.6 Local Pricing and Purchasing Differences
- 13.7 Domestic Production Facilities and Capacity Map
- 13.8 Local Infrastructure and Project Pipeline
- 13.9 State-Level Policy and Incentive Differences
- 13.10 Subnational Investment Hotspots and Opportunities
- 13.11 Distribution and Logistics Networks
- 13.12 Domestic Competitive Footprint
Chapter 14 USA Beer Technology, Innovation and Sustainability Outlook
- 14.1 Technology Landscape and Maturity
- 14.2 Product, Process and Service Innovation
- 14.3 AI, Automation and Digital Tools in the Industry
- 14.4 Technology Adoption and Performance Benchmarking
- 14.5 Innovation Pipeline and R&D Investment
- 14.6 Patent and Intellectual Property Trends
- 14.7 Energy Efficiency and Resource Management
- 14.8 Sustainability, Recycling and Circularity
- 14.9 Technology Roadmap, 2025-2035
- 14.10 Risks of Obsolescence and Technology Substitution
Chapter 15 USA Beer Market Key Strategic Imperatives
- 15.1 Growth and Market Entry Priorities
- 15.2 High-Return Products and Segments
- 15.3 Pricing, Profitability and Cost Optimization
- 15.4 Technology Investment and Product Differentiation
- 15.5 Supply Chain Localization and Resilience
- 15.6 Distribution and Customer Acquisition
- 15.7 Partnership, Acquisition and Capacity Strategy
- 15.8 Regional Expansion Priorities
- 15.9 Short-, Medium- and Long-Term Actions
Chapter 16 Competition Outlook
- 16.1 Industry Competition Characteristics
- 16.2 Market Structure and Concentration
- 16.3 Market Share and Competitive Positioning, 2025
- 16.4 Company-Wise Revenue and Product Benchmarking
- 16.5 Production and Service Capacity Benchmarking
- 16.6 Technology, Pricing and Differentiation
- 16.7 Regional Footprint and Distribution Strength
- 16.8 Mergers, Acquisitions and Strategic Alliances
- 16.9 New Entrants and Competitive Threats
- 16.10 Porter's Five Forces and Industry Attractiveness
- 16.11 Competitive Outlook, 2025-2035
Chapter 17 Company Profiles
- 17.1 Company Coverage and Selection Criteria
- 17.2 Anheuser-Busch
- 17.2.1 Business Description
- 17.2.2 Company Ownership and Geographic Presence
- 17.2.3 Product and Service Portfolio
- 17.2.4 Manufacturing and Operating Footprint
- 17.2.5 Production Capacity and Expansion Plans
- 17.2.6 Financial Performance and Investment
- 17.2.7 Market Share and Competitive Position
- 17.2.8 Technology and Innovation Capabilities
- 17.2.9 Strategic Alliances or Partnerships
- 17.2.10 Recent Developments
- 17.2.11 Growth Strategy and Outlook
- 17.3 Constellation Brands
- 17.4 Molson Coors Beverage Company
- 17.5 Heineken USA
- 17.6 Diageo
- 17.7 Pabst Brewing Company
- 17.8 D.G. Yuengling & Son
- 17.9 Kirin Holdings
- 17.10 FIFCO USA
- 17.11 Sierra Nevada Brewing Co.
- 17.12 Other Relevant Market Participants
Note: Every listed company is profiled on the structure shown under the first company. The company list is preliminary and may change based on research findings, market developments, data availability and client requirements.
Chapter 18 Disclaimer
- 18.1 Research and Forecast Disclaimer
- 18.2 Data Source and Estimation Limitations
Note: The depth of individual sections depends on data availability for this market. Volume, capacity, trade and other unit-based metrics are included where applicable.

