
Half of U.S. dog owners now buy supplements every year
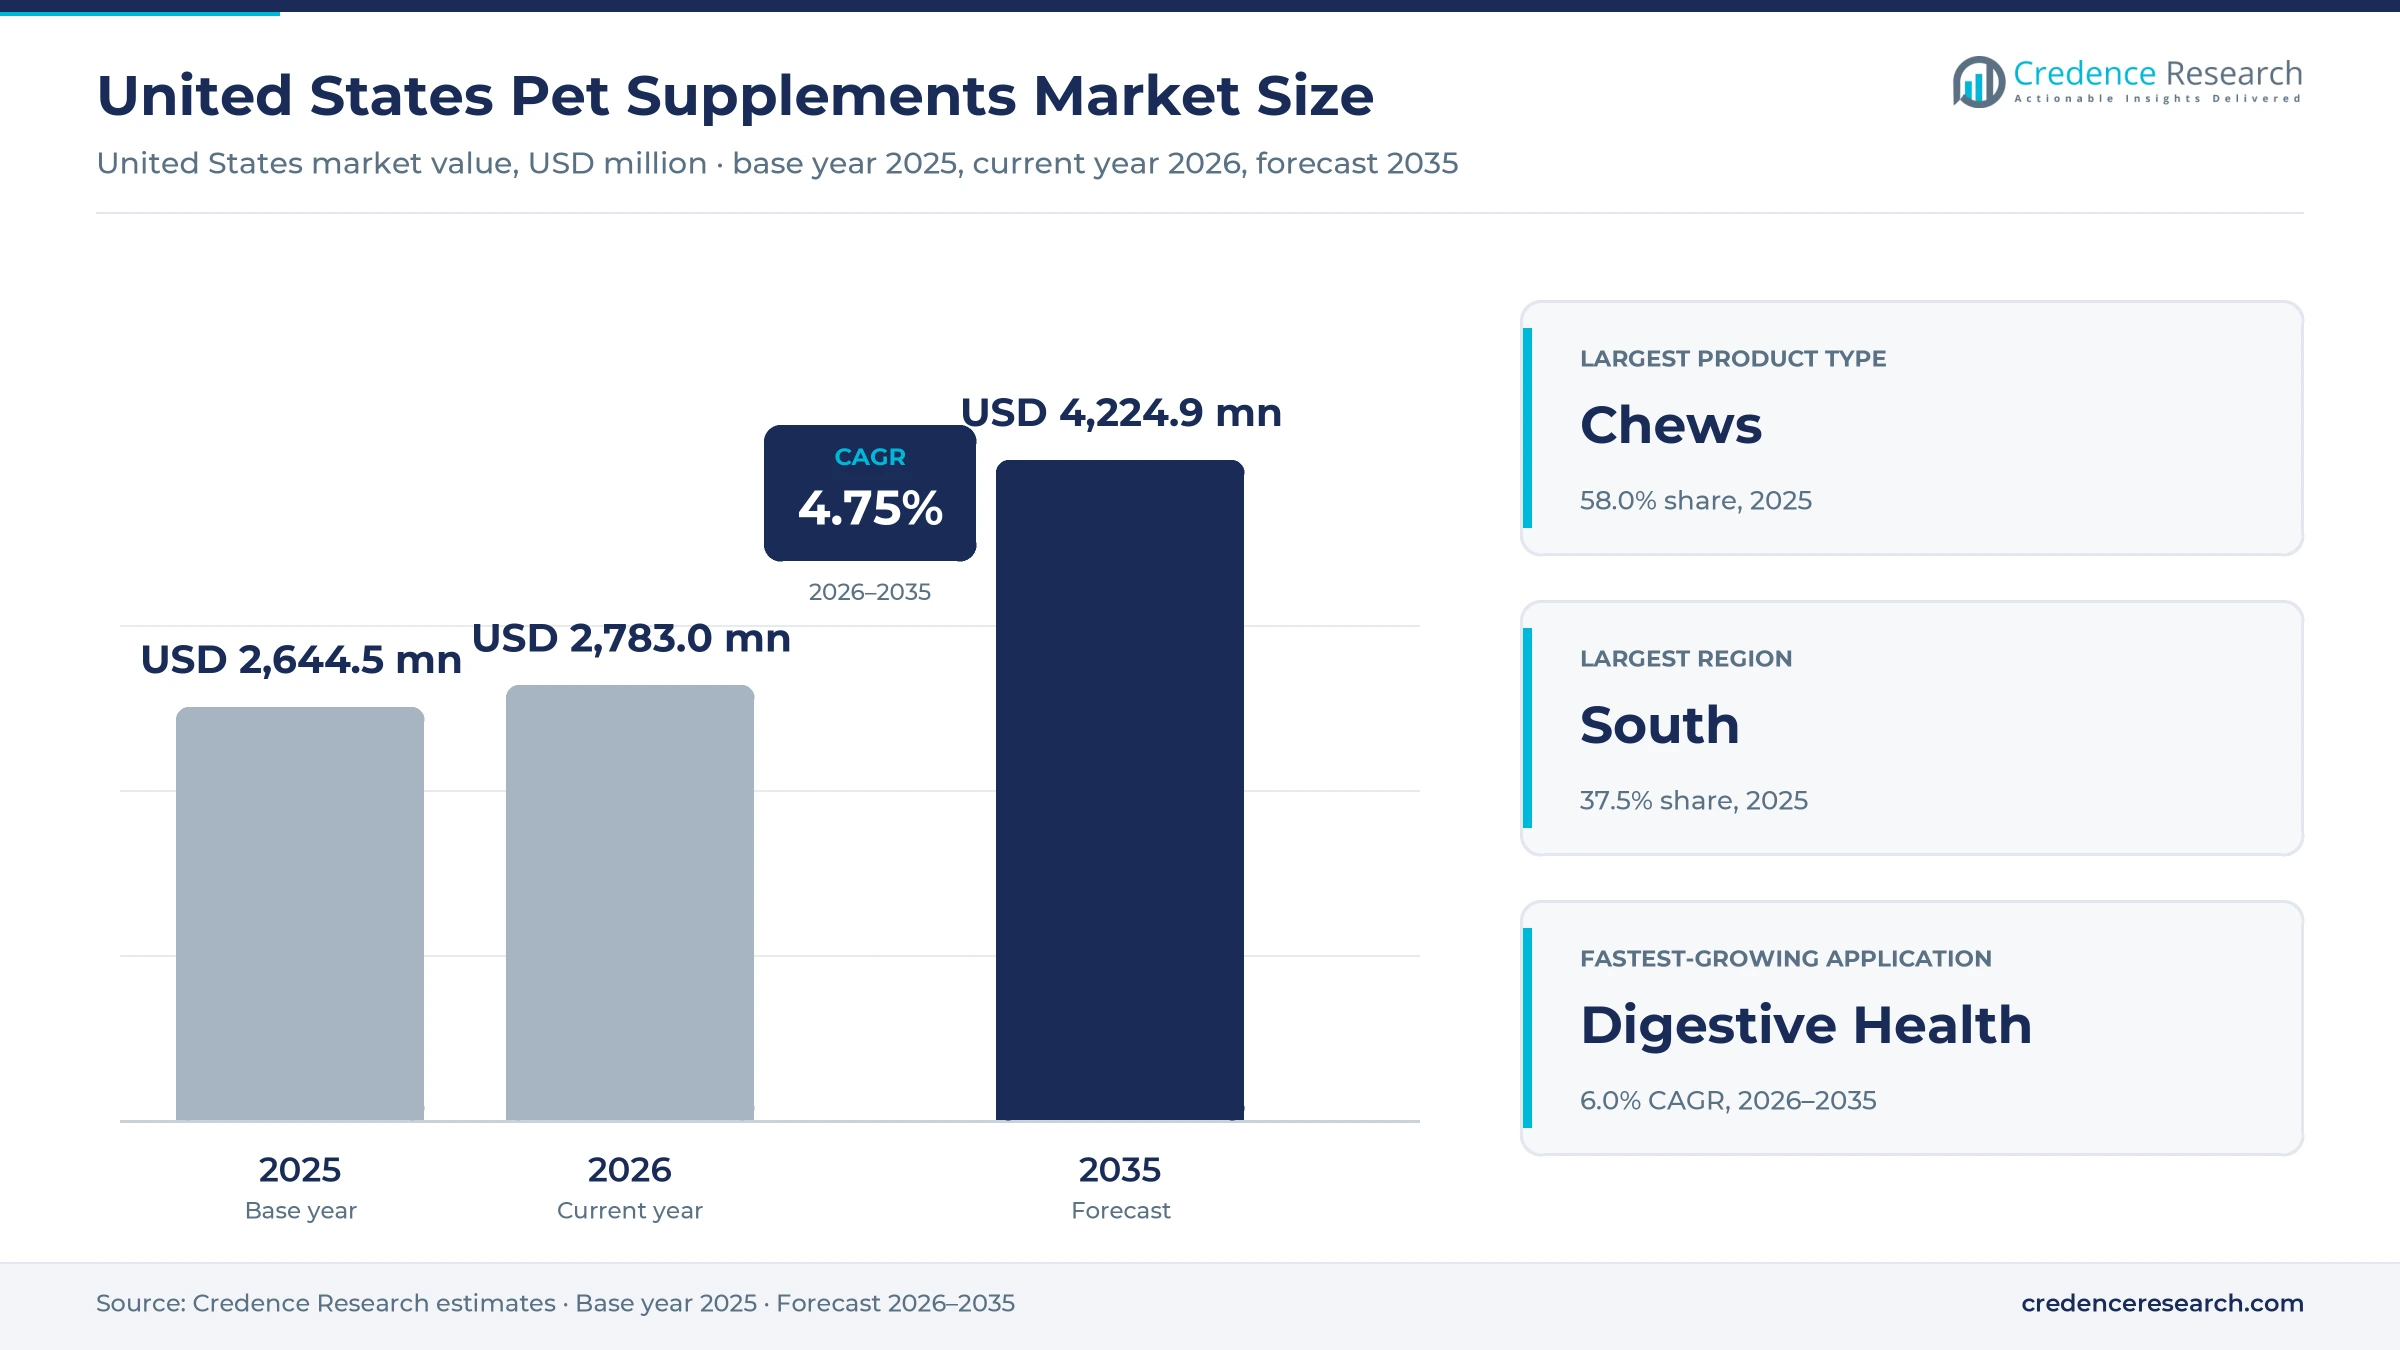
The United States pet supplements market was valued at USD 2.64 billion in 2025 and is projected to increase from USD 2.78 billion in 2026 to USD 4.22 billion by 2035, registering a CAGR of 4.75% during 2026–2035. Spending is driven by dog and cat owners who treat joint, gut and skin support as routine care, by subscription delivery that turns a single purchase into a monthly order, and by veterinarians who recommend audited brands. The South held the largest regional share, 37.5% in 2025, and it is also the fastest-growing region at 5.1% a year as households keep moving there. Soft chews take most of the value because owners accept them as treats, while digestive products gain share as probiotic use spreads. Federal rules for gut-acting ingredients remain unsettled, and the Innovative FEED Act introduced in March 2025 would create a food additive pathway for them.
Chews, powders and oils bought for routine care make up the market
The market counts spending on non-drug supplements for dogs, cats and other companion animals, including soft chews, tablets, capsules, softgels, powders, sachets, oils and functional topicals that support joints, skin and coat, digestion and general wellness. Owners buy them through online retailers with subscription delivery, pet specialty chains, veterinary clinics and their distributors, and mass, club, farm and drug stores.
Prescription veterinary drugs, flea, tick and heartworm products, complete diets and therapeutic foods, and supplements for horses and livestock are outside the scope. The value chain runs from ingredient makers and contract manufacturers through brand owners and quality auditors to distributors, retailers and clinics, and finally to households.
United States Pet Supplements Market Insights
- The United States pet supplements market grows from USD 2.64 billion in 2025 to USD 4.22 billion by 2035 at a 4.75% CAGR as routine supplement use spreads among dog and cat owners.
- The South held the largest regional share at 37.5% in 2025 and grows fastest, as its population rose 6.0% between 2020 and 2025.
- Chews led product types with 58.0% in 2025, while Digestive Health is the fastest-growing application at 6.0% a year to 2035.
- Fifty-three percent of U.S. dog owners gave their dogs supplements in 2024, up from 34% a year earlier, according to the American Pet Products Association.
- Autoship customers generated 83.3% of Chewy net sales in fiscal 2025, which makes subscription replenishment the main route for repeat supplement orders.
Joint chews lead while gut health and cats grow fastest
Chews hold the largest share as powders grow fastest
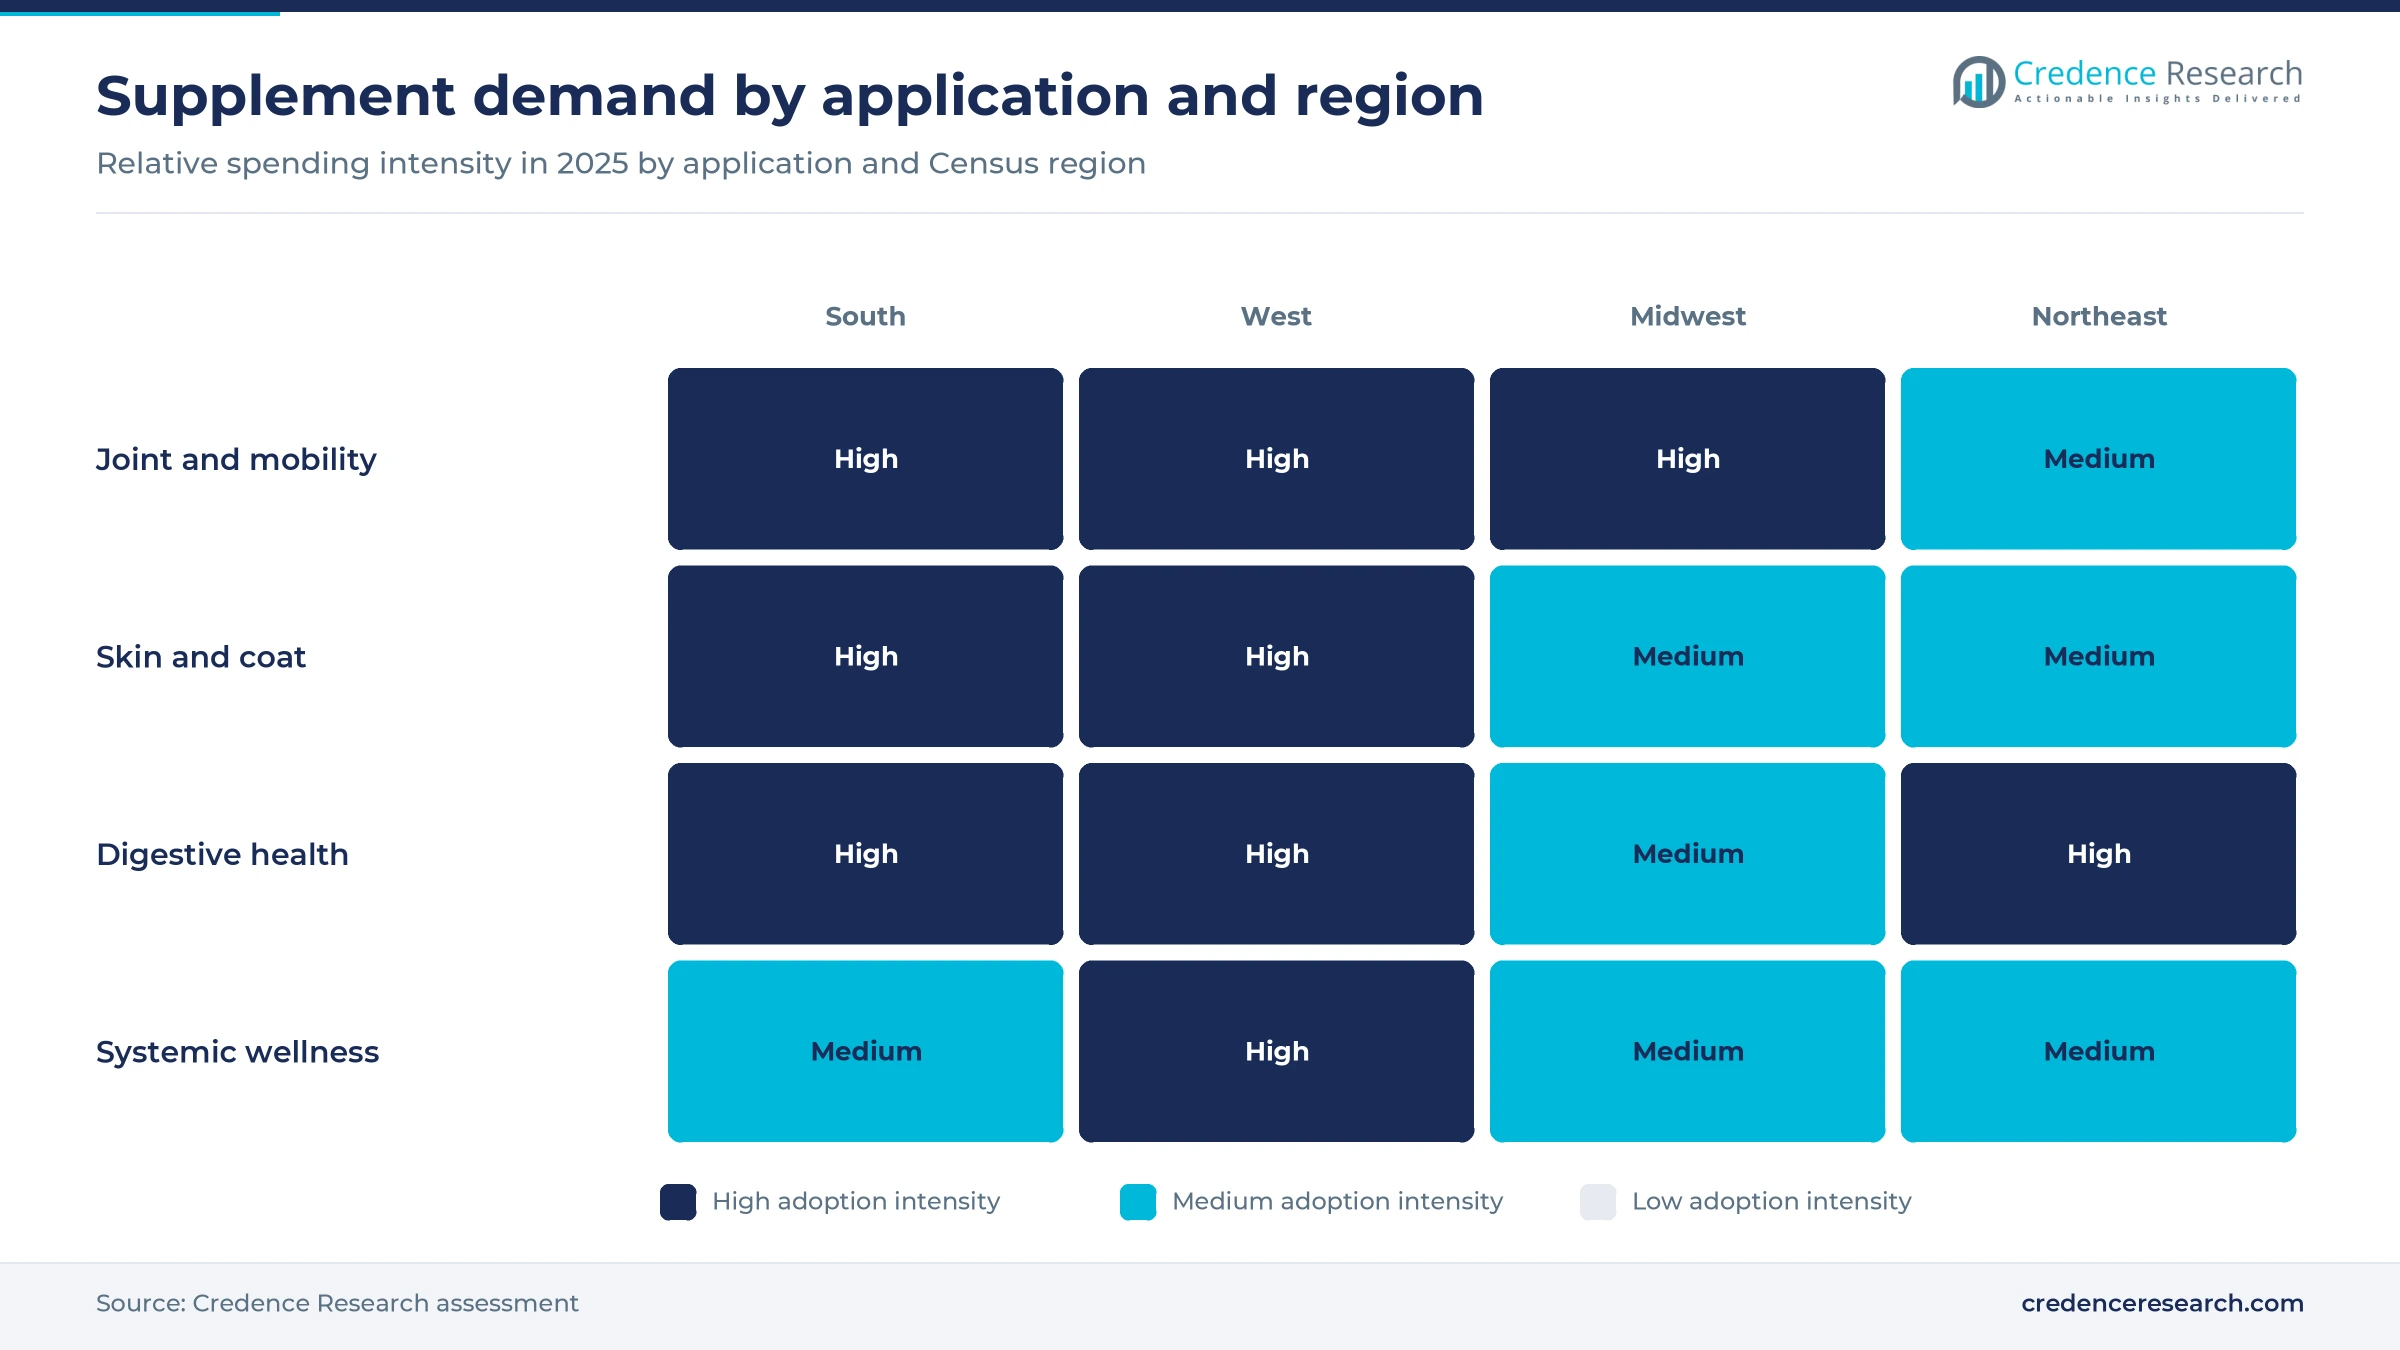
Based on product type, the market is categorized into chews, capsules and softgels, powders and granules, and liquids and functional topicals. Chews led with 58.0% of 2025 value because owners give them like treats, and the National Animal Supplement Council extended its audit program to treats and large-format chewables in 2025, according to Animal Health Digest. Powders & Granules grow fastest at 5.7% a year as probiotic sachets spread, with Zesty Paws dosing its Native Canine Probiotic at 6 million CFUs per packet in January 2026. Liquid formats are also widening, as NaturVet launched lickable pump supplements for cats in October 2025.
Joint support leads while digestive products grow fastest
Based on application, the market is categorized into joint and mobility, skin and coat, digestive health and systemic wellness. Joint & Mobility led with 38.0% of 2025 value because 43% of supplement-giving dog owners bought joint products in 2024, the most of any type, according to the American Pet Products Association. Digestive Health grows fastest at 6.0% a year as use of pre- and probiotics reached 22% of those owners, up from 10% in 2018, and Purina added a FortiFlora Diarrhea Response Kit in August 2026. Gut products also pull buyers toward probiotic products with named strains.
Dogs dominate spending while cats grow fastest
Based on end user, the market is categorized into dogs, cats and other companion animals. Dogs led with 74.0% of 2025 value because dogs are larger, eat more chews per day and face more joint wear, and AVMA counted 89.7 million dogs in 2024, a new peak. Cats grow fastest at 5.8% a year as the American Pet Products Association counted 49 million cat-owning households in its June 2025 report, up from 40 million in 2023, while 34% of cat owners gave supplements. Multivitamins and digestive products lead cat demand, so brands now launch cat-specific formats.
Online orders lead as veterinary channels grow fastest
Based on distribution channel, the market is categorized into e-commerce, specialty pet retail, veterinary professional and general retail. E-Commerce led with 44.0% of 2025 value because supplements are small, repeat items that suit scheduled delivery, and H&H Group named Amazon and Chewy as the key online channels for Zesty Paws in its 2025 results. Veterinary Professional grows fastest at 5.5% a year as Zesty Paws entered clinics in January 2026 with a veterinary-only line distributed by epiq Animal Health and Durvet. General retail is widening too, with PetHonesty entering almost 13,000 Walmart stores in spring 2026.
| Segment Group | Leading Sub-segment | Share, 2025 | Fastest-growing Sub-segment | CAGR, 2026–2035 |
|---|---|---|---|---|
| By Product Type | Chews | 58.0% | Powders & Granules | 5.7% |
| By Application | Joint & Mobility | 38.0% | Digestive Health | 6.0% |
| By End User | Dogs | 74.0% | Cats | 5.8% |
| By Distribution Channel | E-Commerce | 44.0% | Veterinary Professional | 5.5% |
Shelf prices split value chews from vet-strength formulas
U.S. supplement pricing works per pack, typically a 30- to 90-day supply, so the real price is the cost per daily dose. A mainstream mobility chew works out to about USD 0.22 a chew on Chewy, while vet-strength joint formulas at PetSmart cost about USD 0.56 to USD 0.71 a chew because they carry higher doses of glucosamine, chondroitin and newer actives. Online retailers cut the first subscription order by half and then take about 5% off each repeat order, which trades margin for a monthly customer. Ingredient tariffs, covered in the challenges, push costs up, but brands with veterinary endorsements hold prices better than value labels.
| Product | Typical price or fee | Basis |
|---|---|---|
| Zesty Paws Mussel Mobility Bites, 90 chews | USD 19.97, or USD 18.97 on Autoship | Chewy lists, November 2026 |
| Nordic Naturals Omega-3 Pet liquid, 16 fl oz | USD 39.91, list price USD 46.95 | Chewy lists, November 2026 |
| Zesty Paws Vet Strength Mobility Bites, 90 chews | USD 49.99 | PetSmart lists, November 2026 |
| Nutramax Dasuquin for large dogs, 84 soft chews | USD 59.99 | PetSmart lists, November 2026 |
| Purina FortiFlora Diarrhea Response Kit | USD 34.99 to USD 42.99 by pet size | Purina suggested retail, August 2026 |
Request a Free Sample
Fill in your details and we'll send you a free sample report.
- Sample data tables & charts
- Research methodology
Wellness habits, autoship and vet evidence lift sales
Preventive wellness turns supplements into routine care
Owners increasingly give supplements before problems appear, which turns an occasional purchase into a daily habit. Fifty-three percent of dog owners gave their dogs supplements in 2024, up from 34% the year before, according to the American Pet Products Association report summarized by GlobalPETS. Multivitamins reached 39% of those owners and skin, coat and nail products 27%, so most buyers now use more than one type. AVMA reported that 45.5% of U.S. households owned a dog in 2024, up from 31.6% in 1996, which widens the base for daily products. Brands that sell a routine rather than a remedy gain the most from this shift.
Autoship and marketplaces lock in repeat orders
Subscription delivery has become the main replenishment route because a supplement that runs out every month suits an automatic order. Autoship customers accounted for 83.3% of Chewy net sales in fiscal 2025, up from 79.2% a year earlier, with 21.3 million active customers, so most repeat demand now arrives without a new purchase decision. Swedencare brought NaturVet sales on Amazon in-house from April 2025 and reported 12% organic growth in North America for the year. H&H Group said its pet supplements grew 14.7% in 2025, mainly through Zesty Paws. Online subscriptions therefore reward brands that manage ratings, search ranking and pricing directly on each marketplace.
Audited quality and veterinary evidence separate brands
Because no federal premarket review applies to most pet supplements, buyers rely on audits and veterinary backing to judge quality. The National Animal Supplement Council lets only audited members display its Quality Seal, and FoodScience became the first member of its new treat program in July 2026, according to NASC. Virbac introduced URSOLYX soft chews with sage-derived ursolic acid for canine muscle health on Jan. 10, 2025, developed with Emmyon. Zesty Paws says its clinic-only Native Canine Probiotic, launched in January 2026, supports healthy fecal scores within seven days at 6 million CFUs per packet, based on preclinical trials. Brands with clinical data and veterinary distribution can therefore charge more and keep shelf space.
Insurance growth signals wider spending on pet health
Rising enrollment in insurance for dogs and cats shows that more households budget for pet health, which supports routine spending on supplements as well. About 6.98 million U.S. pets were insured in 2025, up 9% in a year, according to the North American Pet Health Insurance Association report covered by dvm360. Gross written premium rose 19.7% to about USD 5.68 billion in 2025, which outpaced growth in insured pets. More than 95% of dogs and cats still have no coverage, so most owners pay for prevention themselves. Supplement brands that market prevention as a cheaper alternative to later treatment fit that budget.
Native-strain probiotics and aging formulas gain shelf space
Native-strain probiotics shift gut care toward science
Gut products are moving from generic strains to microbes isolated from healthy dogs, which gives brands a stronger story for veterinarians and links supplements to research on intestinal health in animals. Native Microbials and Zesty Paws announced on Nov. 4, 2025 an exclusive partnership on canine probiotics built from strains taken from the guts of healthy dogs. The deal planned a daily maintenance product and a higher-concentration product sold through clinics, both for the first half of 2026. The strains are meant to support bile acid metabolism and short-chain fatty acid production, according to Pet Food Industry. Purina still relies on the single strain Enterococcus lactis SF68 in FortiFlora, which shows how far proven strains anchor the category. Suppliers that publish strain-level data will win the veterinary recommendation first.
Healthy aging formulas rise as dogs live longer
Aging-focused formulas are rising because owners want to keep older dogs active rather than treat decline. Zesty Paws added a Healthy Aging NAD+ Precursor made with Niagen nicotinamide riboside to its veterinary line in January 2026, distributed by Durvet. Virbac positioned its URSOLYX chews, noted in the drivers, for aging, active or recovering dogs. AVMA counted a record 89.7 million dogs in 2024, up from 80.1 million in 2023, so the number of older dogs will grow as that cohort ages and owners spend more on animal healthcare for them. Muscle, cognition and cellular energy claims now sit beside joint support, and brands can charge more for these newer actives.
Cat-specific formats open an underserved segment
Cats are an opening because owner numbers are rising while most supplement formats were built for dogs. The cat-owning household count reported by the American Pet Products Association rose by 9 million in two years, and cat supplement purchases were up 70% since 2018. NaturVet launched calming, multivitamin and hip and joint lickables in 3-ounce pump bottles in October 2025. PetHonesty took cat multivitamin, dental, immune lysine, calming and hairball products into Walmart in 2026, giving cat formats national mass-retail reach. Brands that solve palatability for cats can win a segment that dog-first competitors have neglected.
Veterinary-exclusive lines open higher-margin shelves
Clinics are an opening for brands that built their names in retail, because veterinarians influence the most valuable, long-term buyers. Zesty Paws, already sold in more than 20,000 U.S. stores, launched its first veterinary-exclusive line, Zesty Paws Professional, on Jan. 13, 2026. Purina sells its FortiFlora kit over the counter on Amazon, Chewy and VetDirect.com as well as through clinics, linking the two channels. Growth in companion animal health services keeps more owners in contact with clinics, as Chewy clinic openings in Austin and Chandler show. Suppliers that offer distinct clinic-only formulas avoid price matching with their own retail products.
Tariffs, unclear claim rules and thin margins test brands
Tariffs raise costs for imported ingredients
Most basic supplement ingredients, such as vitamin C, B vitamins, many amino acids and CoQ10, come from China, according to NutraIngredients. The United States raised tariffs on Chinese goods several times from February 2025, and the duty-free de minimis exemption for orders under USD 800 ended for Chinese-origin goods on May 2, 2025, according to law firm Morgan Lewis. Brands must now import directly and pay duty, which hits small direct-to-consumer sellers hardest. Larger firms can spread the cost or qualify other suppliers.
Unsettled claim rules slow new ingredients
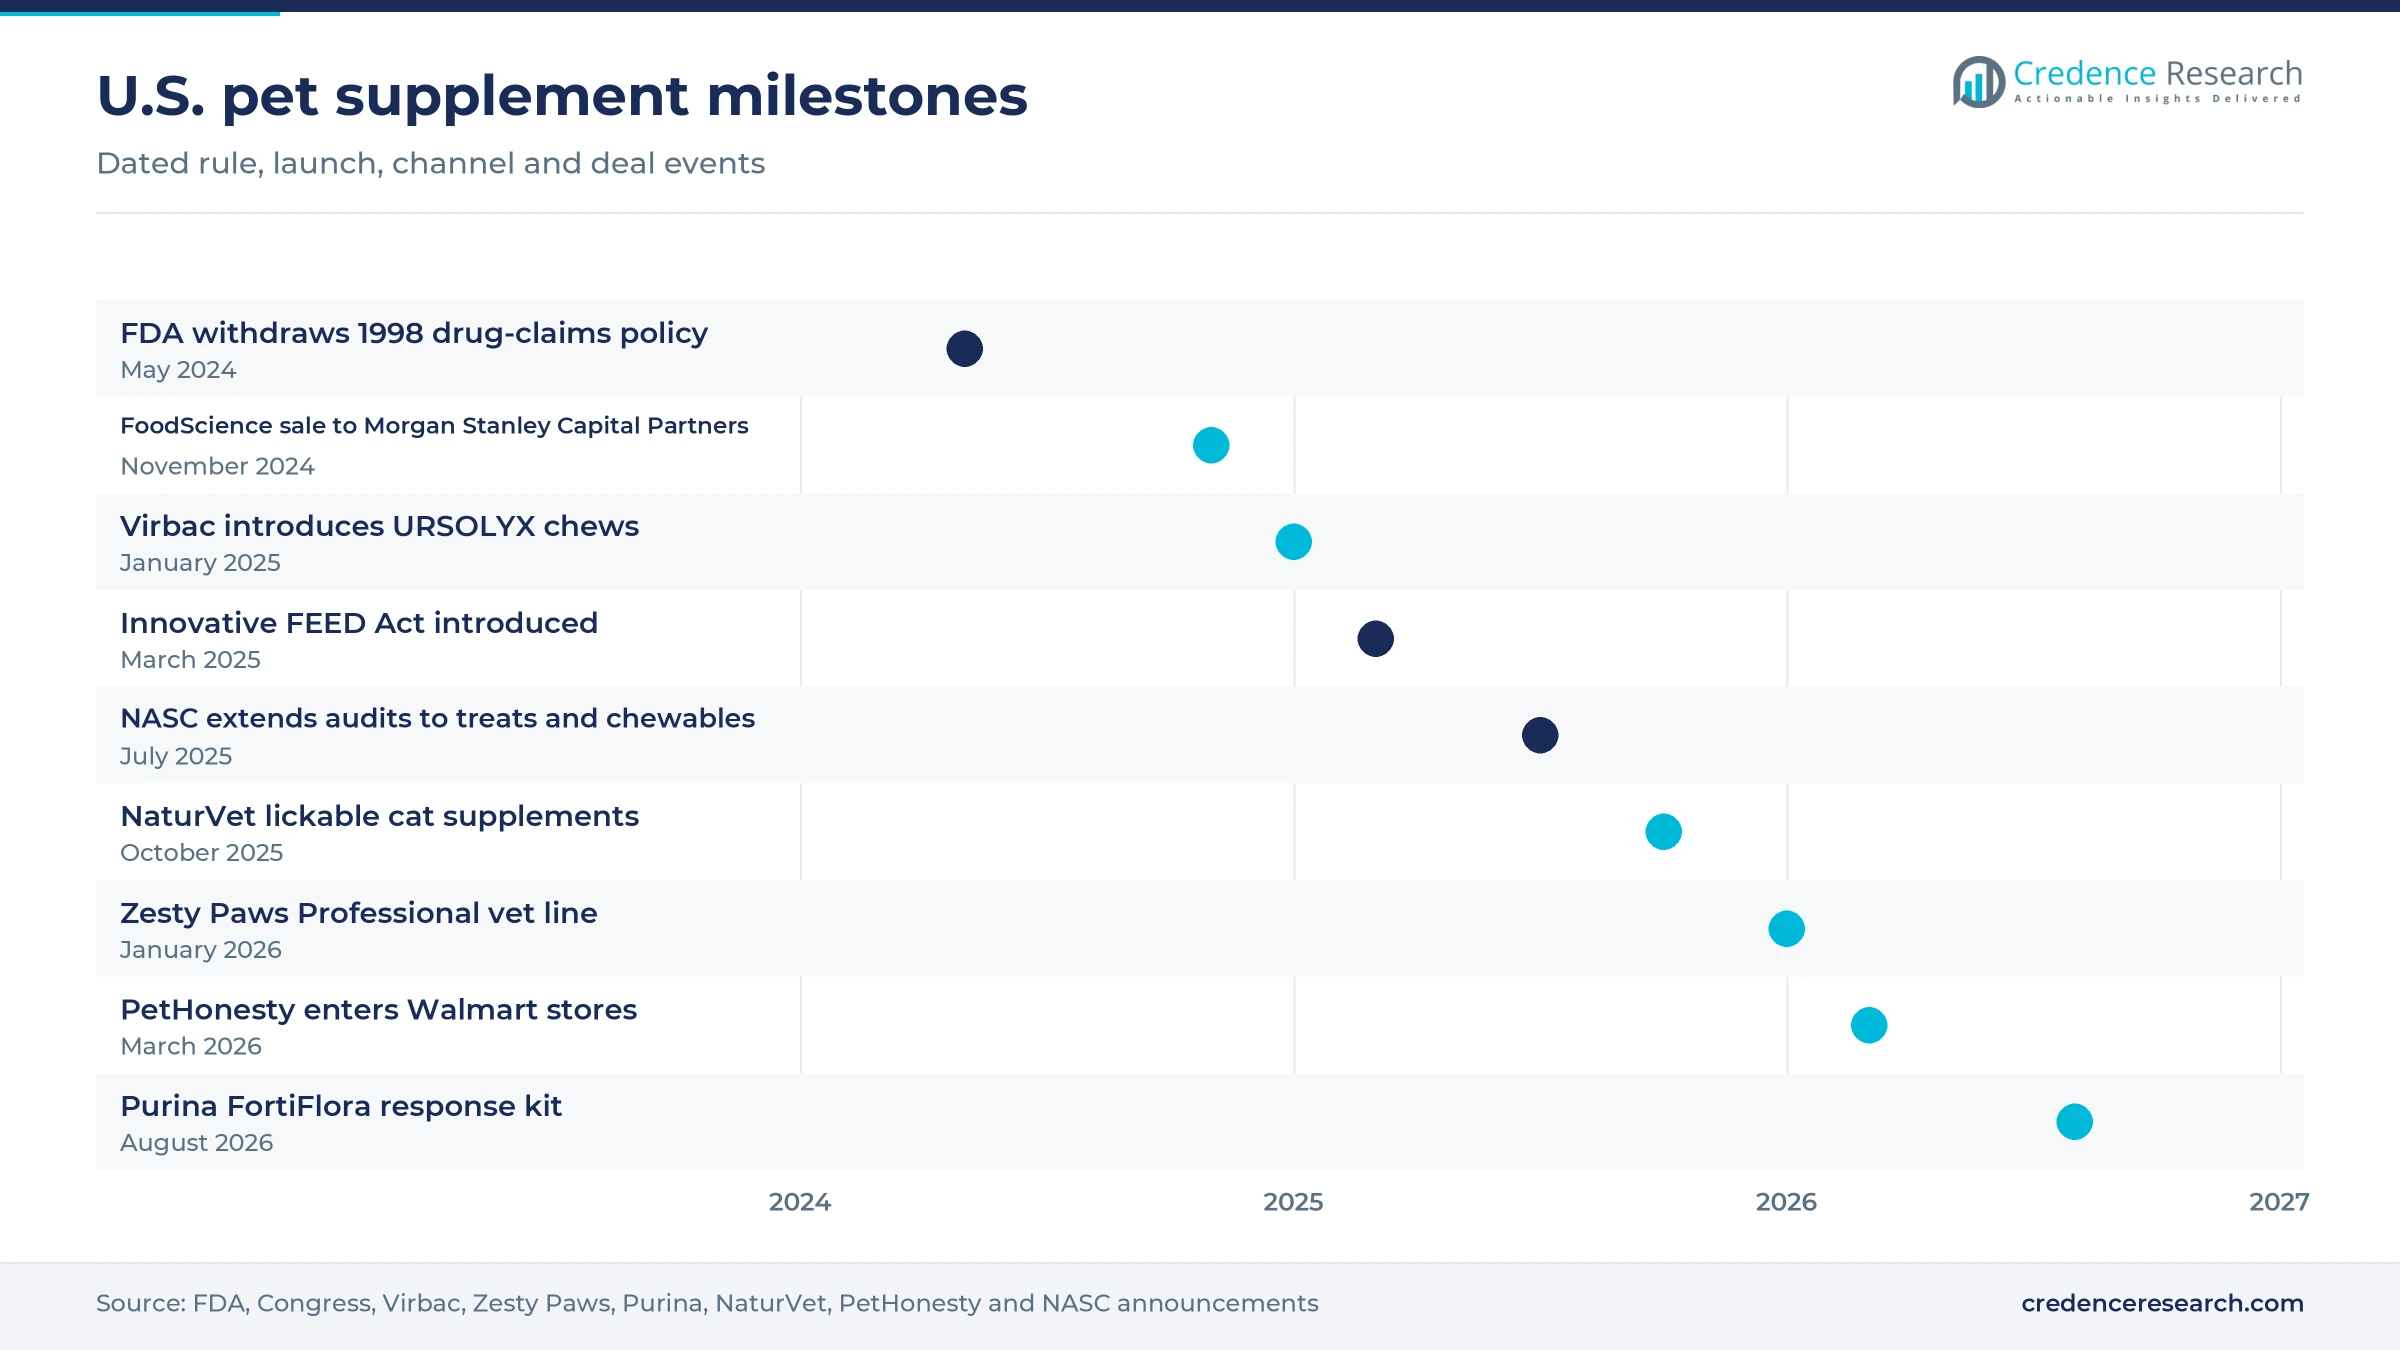
Federal rules for gut-acting ingredients remain unsettled, which delays launches and raises legal costs. FDA withdrew its 1998 policy on animal foods with drug claims on May 20, 2024 and asked firms with novel gut-acting products to contact the agency early. The Innovative FEED Act, introduced in the House on March 18, 2025 and in the Senate on May 22, 2025, has not passed either chamber. Until it does, brands rely on state feed regulators and cautious structure and function claims.
Brand margins shrink under promotion costs
Growth in sales has not translated into wider margins for some leading brands. H&H Group reported that adjusted EBITDA margin in its pet nutrition and care segment fell by 1.7 percentage points to 3.1% in 2025, even as pet supplements grew. First subscription orders discounted by half on Chewy, shown in the pricing table, add to the promotional load. Brands that depend on paid search and discounts face margin pressure, which favors firms with their own manufacturing.
Household pet budgets face price sensitivity
Average veterinary spending per household fell 4% from 2023 to 2024, according to AVMA, with dog-owning households spending 7% less at an average of USD 580. When owners cut clinic visits, fewer pets receive a professional recommendation for joint or gut products. Price-sensitive buyers also trade down to value chews or skip refills. Brands respond with smaller packs, subscription discounts and value lines in mass retail.
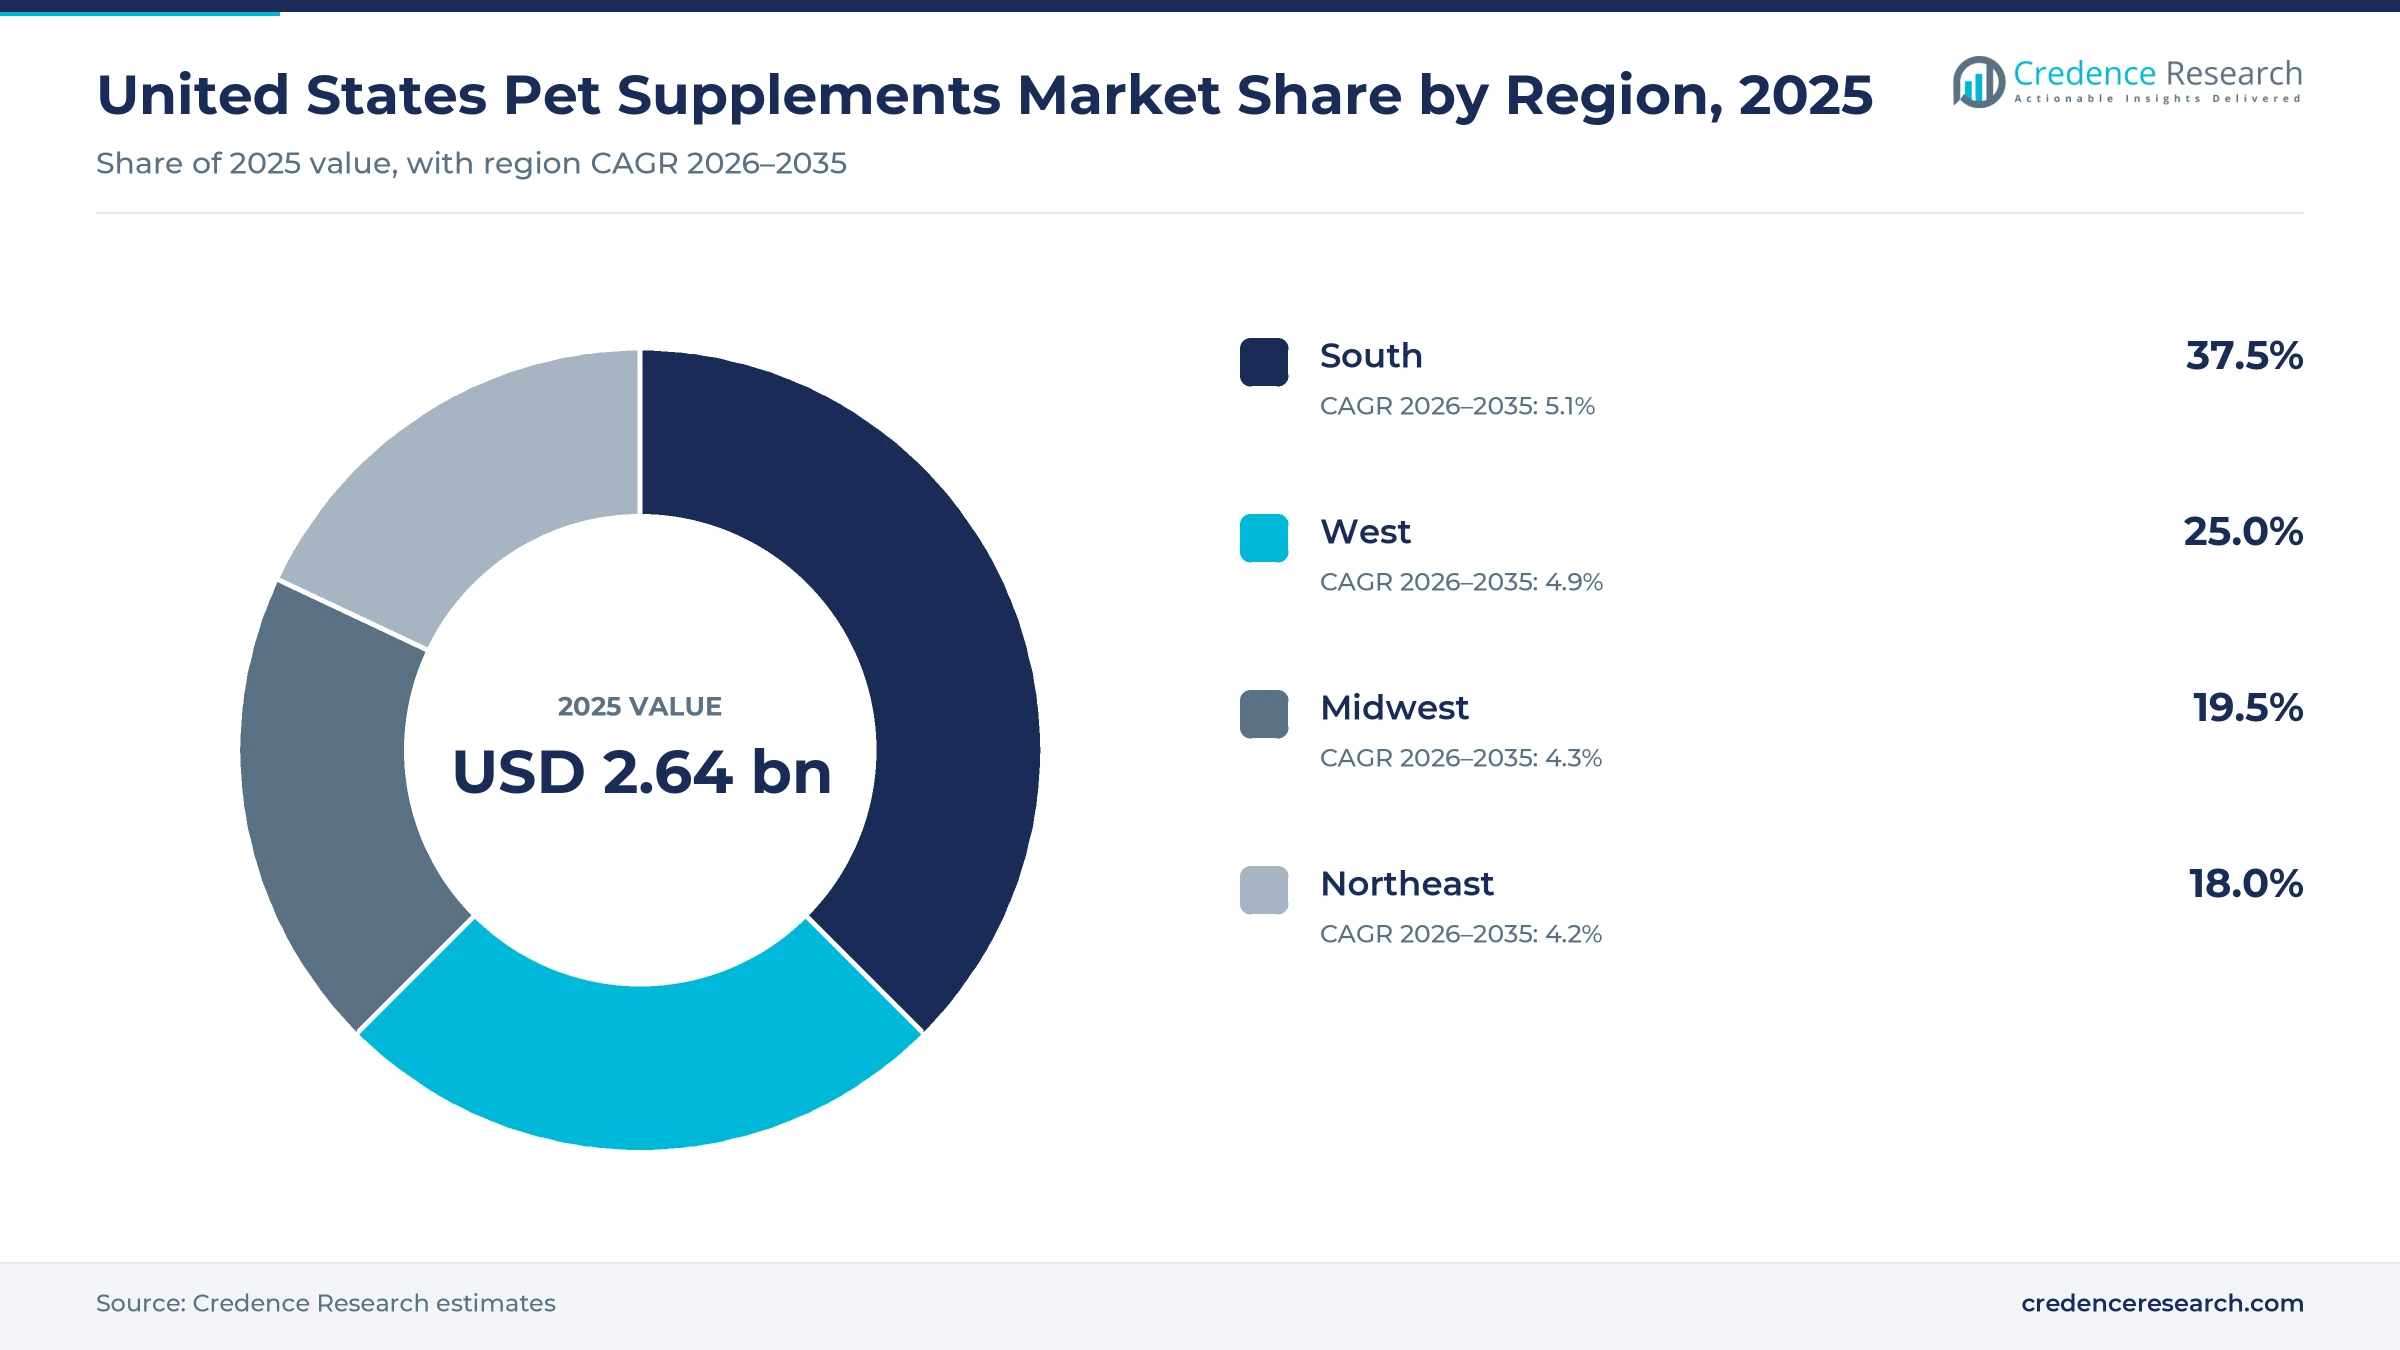
The South leads as households and dogs shift there
| Region | Value, 2025 (USD billion) | Share, 2025 | CAGR, 2026–2035 |
|---|---|---|---|
| South | 0.99 | 37.5% | 5.1% |
| West | 0.66 | 25.0% | 4.9% |
| Midwest | 0.52 | 19.5% | 4.3% |
| Northeast | 0.48 | 18.0% | 4.2% |
The South holds the largest share as households move there
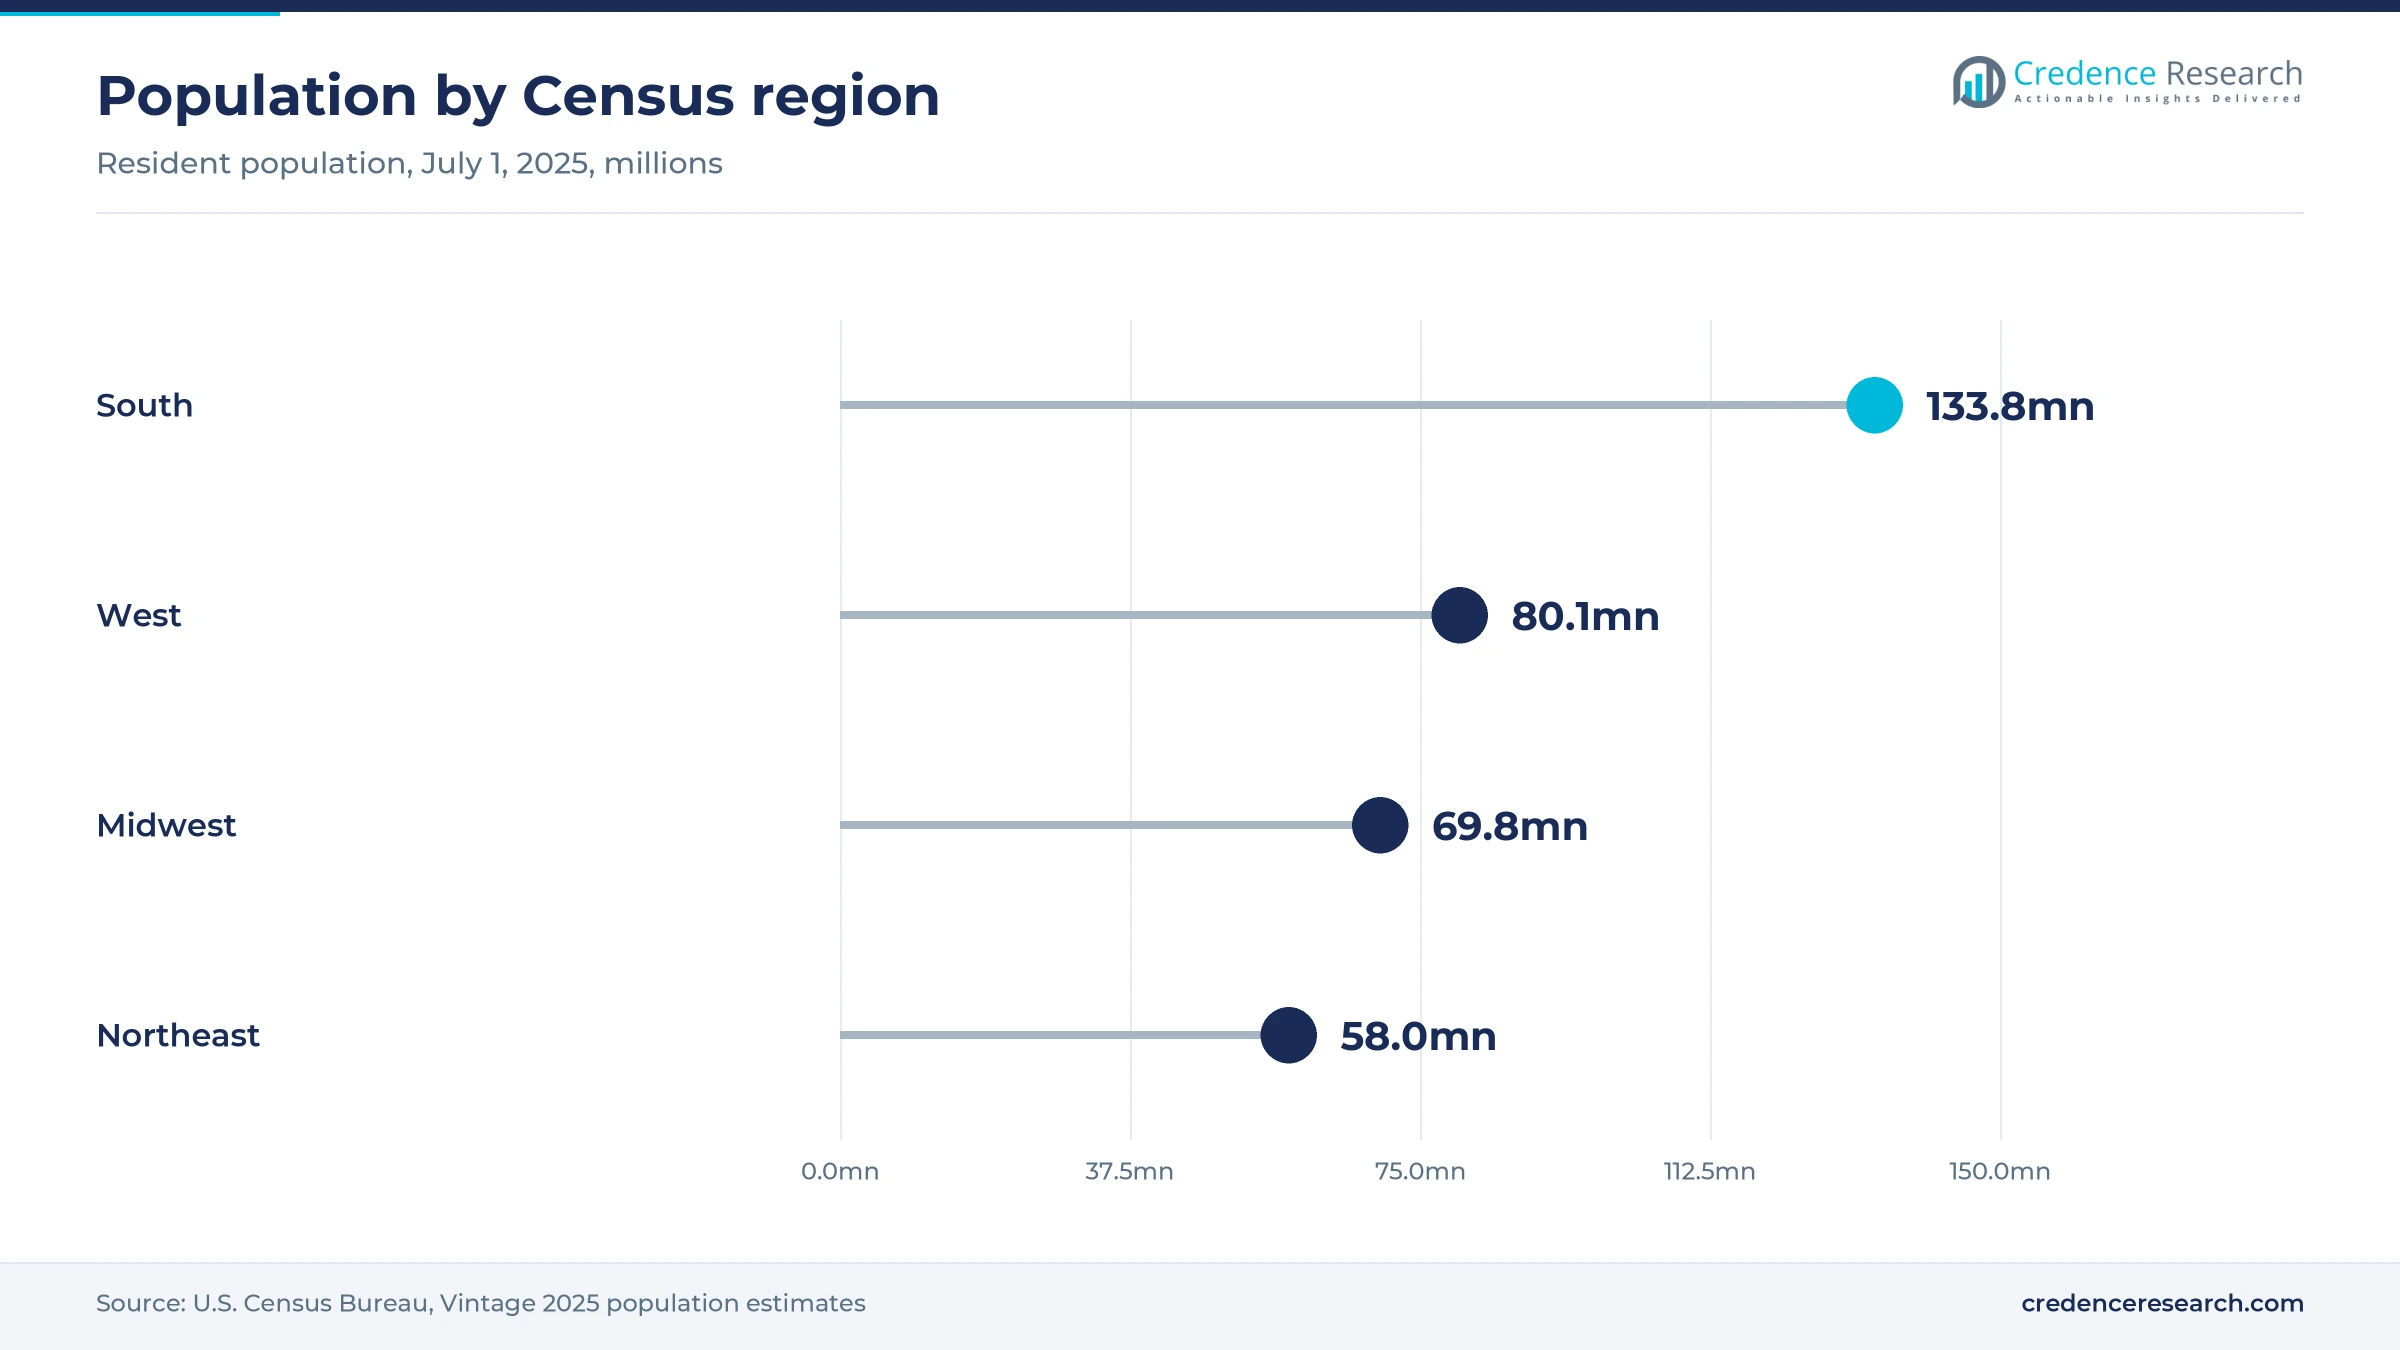
The South held 37.5% of 2025 value and grows at 5.1% a year, the fastest of the four regions. Census Bureau estimates put its population at 133.8 million on July 1, 2025, up 6.0% since 2020 and nearly twice the national rate of 3.1%. New suburban households with yards and larger dogs buy joint and mobility chews early, and farm and ranch stores reach rural owners. Chewy Vet Care opened a clinic in Austin, Texas in January 2025, adding a clinic route for supplement recommendations in the region.
The West pays more for premium and natural formulas
The West held a 25.0% share of 2025 value and grows at 4.9% a year. Its population reached 80.1 million in 2025, up 1.9% since 2020, according to the Census Bureau. Owners in large coastal metros lean toward premium, clean-label and omega-3 products, and Chewy opened a clinic in Chandler, Arizona in 2025. Higher prices per pack offset slower household growth, so premium brands find their strongest regional base here.
The Midwest relies on mass and farm retail
The Midwest held a 19.5% share of 2025 value and grows at 4.3% a year. Its population rose 1.1% from 2020 to 69.8 million in 2025, according to the Census Bureau, so growth comes from more spending per pet rather than more households. Mass merchants, farm stores and home improvement chains, including Menards, carry Zesty Paws in the region. Value and mainstream tiers therefore take a larger share here than on the coasts.
The Northeast buys through clinics and online orders
The Northeast held an 18.0% share of 2025 value and grows at 4.2% a year, the slowest of the four regions. Its population of 58.0 million in 2025 was only 0.7% above the 2020 level, according to the Census Bureau. Dense cities with smaller homes favor cats and small dogs, and owners rely on veterinary advice and delivery to apartments. Growth here depends on cat formats and on clinic-recommended products.
Vet lines, gut kits and retail rollouts marked 2025 and 2026
| Development | Status and market relevance |
|---|---|
| In November 2024, Morgan Stanley Capital Partners agreed to acquire FoodScience, maker of VetriScience, from Wind Point Partners. | Announced; new owner for a vertically integrated supplement maker |
| In January 2025, Virbac introduced URSOLYX soft chews for canine muscle health in the United States. | Launched; adds a new active to veterinary supplements |
| In November 2025, Native Microbials and Zesty Paws agreed to develop canine-native probiotics. | Announced; products planned for the first half of 2026 |
| In January 2026, Zesty Paws launched its veterinary-exclusive Zesty Paws Professional line. | Launched; first clinic channel entry for the brand |
| In August 2026, Purina launched the FortiFlora Diarrhea Response Kit for dogs and cats. | Launched; sold through clinics and online retailers |
Canine-native strains and new actives reshape formulas
- Live-microbial formulations carry named strains such as Enterococcus lactis SF68, and the value depends on keeping enough live organisms per dose through shelf life.
- Canine-native strains come from the guts of healthy dogs, which gives brands strain data that veterinarians can compare.
- Combination formulations pair probiotics or joint actives with vitamins and omega-3s, which lets one chew replace two or three products.
- Non-microbial actives such as glucosamine, ursolic acid and nicotinamide riboside, extend claims from joints to muscle and cellular energy.
Need a Custom Version of This Report?
Tailor the scope, geography, or segments to your exact requirements.
- Custom geography or segment scope
- Direct access to our analyst team
Omnichannel brands and vet-led labels split the shelf
Competition turns on who owns the repeat order and who owns the veterinary recommendation. Zesty Paws sells in more than 20,000 U.S. stores and through Amazon and Chewy, and now adds a clinic-only line. Nutramax builds on Dasuquin and Cosequin joint brands that veterinarians have recommended for years and that appear in pet chains and mass retail. Purina uses FortiFlora to link its veterinary diets with gut support products sold online. PetHonesty and NaturVet compete for mass and marketplace shoppers with broad lines at value and mainstream prices. Nordic Naturals sells omega-3 products from its human nutrition base, and Virbac brings novel actives through clinics. Price competition is sharpest online, while clinic channels are won on evidence and veterinary education.
Contract makers, omnichannel brands and vet labels form three tiers
The U.S. supply side splits into three tiers with different economics. Omnichannel brands such as Zesty Paws, PetHonesty, NaturVet and Ark Naturals, which Antelope acquired in 2022, compete on marketplace ranking, flavor and price, and many rely on contract manufacturers. Veterinary-led labels such as Nutramax, Purina Pro Plan Veterinary Supplements, Virbac and VetriScience earn higher margins from clinic recommendations and clinical data. Integrated makers such as FoodScience own their production plants and also make products for other brands. Entry is easy online, but the NASC audit, retailer quality checks and veterinary trust are real barriers for brands that want shelf space in clinics and chains.
Companies profiled and their roles in this market
| Company | Type | Role in the market |
|---|---|---|
| Nestlé Purina PetCare | Pet food and veterinary supplement maker | Launched the FortiFlora Diarrhea Response Kit in August 2026 |
| H&H Group / Zesty Paws | Omnichannel supplement brand | Launched Zesty Paws Professional in January 2026 and partnered with Native Microbials in November 2025 |
| Nutramax Laboratories | Veterinary-recommended joint brand | Sells Dasuquin and Cosequin through pet chains, mass retail and clinics |
| PetHonesty | Omnichannel supplement brand | Entered almost 13,000 Walmart stores in 2026 |
| Virbac USA | Veterinary animal health company | Introduced URSOLYX soft chews in January 2025 |
| VetriScience / FoodScience | Integrated supplement maker | Acquired by Morgan Stanley Capital Partners in November 2024 and first member of the NASC treat program |
| NaturVet / Garmon | Mass and marketplace supplement brand | Launched lickable cat supplements in October 2025 and took Amazon sales in-house in April 2025 |
| Ark Naturals | Wellness brand on the Antelope platform | Acquired by Antelope in September 2022 |
| Nordic Naturals | Omega-3 specialist | Sells Omega-3 Pet liquid and softgels through Chewy and other retailers |
Repeat purchase economics, not new buyers, carry growth
Credence Research's view is that the U.S. market will grow mainly through repeat orders from existing buyers rather than through new households. Half of dog owners already buy supplements, so the next gains come from more products per pet, higher-value formulas and cats. Subscription retailers give brands a steady base, but discounts and paid search eat into margins. The strongest positions belong to suppliers that combine audited quality, strain or clinical data and a veterinary route, because those brands keep their prices when owners compare packs online.
Household counts and shelf prices anchor the estimate
The report uses 2025 as the base year and 2026 to 2035 as the forecast period. Market values come from the Credence Research model, which builds spending from counts of dog- and cat-owning households, the share that gives supplements and typical yearly outlays from published shelf prices. Segment and regional splits are Credence Research estimates built from Census Bureau population data, AVMA and American Pet Products Association ownership figures, FDA notices, company announcements and filings, and retailer price lists. No interviews or primary surveys were conducted for this edition.
Supplements become a routine line in pet health budgets
The United States pet supplements market is expected to grow from USD 2.78 billion in 2026 to USD 4.22 billion by 2035 at a 4.75% CAGR. Digestive products and cat formats will gain the most share, and the veterinary channel will grow faster than retail as more brands add clinic-only lines. Chews will stay the main format, while live-microbial products rise with strain-level evidence. The South will add the most new buyers as its population grows. By 2035, most owners are likely to buy supplements on subscription as a fixed part of pet health spending.
Subscription loyalty and claim rules set the 2035 range
The range of outcomes depends on whether owners keep refilling supplements when household budgets tighten and on how federal rules for gut-acting ingredients settle. A downside case assumes higher ingredient tariffs, more trading down to value chews and a stalled Innovative FEED Act. The base case assumes steady subscription renewals and gradual growth in cat and digestive products. An upside case needs a clear federal pathway for gut-acting ingredients and faster growth of clinic-recommended lines, which would lift spending per pet.
| Scenario | CAGR, 2026–2035 | Value, 2035 | What has to hold |
|---|---|---|---|
| Downside | 3.2% | USD 3.70 billion | Tariffs rise again, owners trade down and gut ingredient rules stay unclear |
| Base | 4.75% | USD 4.22 billion | Subscription renewals hold and cat and digestive products keep gaining share |
| Upside | 6.0% | USD 4.70 billion | A federal pathway for gut-acting ingredients passes and clinic lines grow quickly |
Frequently Asked Questions
How big is the United States pet supplements market?
Which product type leads U.S. supplement spending?
Which U.S. region leads the market?
How many U.S. dog owners give supplements?
Which application grows fastest?
How are pet supplements regulated in the United States?
Who are the key companies in the United States pet supplements market?
What does a dog joint supplement cost in the United States?
Table of Content
Chapter 1 Market Segmentation
- 1.1 Segmentation Framework
- 1.1.1 Product and Service Classification
- 1.1.2 Application and End-Use Classification
- 1.1.3 Technology and Solution Classification
- 1.1.4 Customer and Distribution Channel Classification
- 1.1.5 Geographic Segmentation
- 1.1.6 Market Segment Definitions and Boundaries
- 1.2 By Product Type
- 1.2.1 Chews
- 1.2.2 Capsules & Softgels
- 1.2.3 Powders & Granules
- 1.2.4 Liquids & Functional Topicals
- 1.3 By Application
- 1.3.1 Joint & Mobility
- 1.3.2 Skin & Coat
- 1.3.3 Digestive Health
- 1.3.4 Systemic Wellness
- 1.4 By End User
- 1.4.1 Dogs
- 1.4.2 Cats
- 1.4.3 Other Companion Animals
Chapter 2 Introduction
- 2.1 Report Objectives and Scope
- 2.2 Product Definition and Industry Terminology
- 2.3 Market Inclusions and Exclusions
- 2.4 Research Process
- 2.4.1 Primary Research and Expert Interviews
- 2.4.2 Secondary Research and Source Review
- 2.4.3 Top-Down and Bottom-Up Estimation
- 2.4.4 Data Triangulation and Verification
- 2.5 Market Size Measurement Basis
- 2.5.1 2025: USD 2.64 billion → 2035: USD 4.22 billion
- 2.6 Historical and Forecast Reference Periods
- 2.6.1 Historical Period: 2018-2025
- 2.6.2 Base Year: 2025
- 2.6.3 Forecast Period: 2025-2035
- 2.7 Research Assumptions and Limitations
Chapter 3 Executive Summary
- 3.1 Market Snapshot and Key Findings
- 3.2 Base-Year Market Size, 2025
- 3.3 Forecast Market Size, 2035
- 3.4 Revenue and Volume Growth Outlook
- 3.5 Key Demand and Supply Indicators
- 3.6 Leading Market Segments
- 3.7 Fastest-Growing Market Opportunities
- 3.8 Regional Performance Highlights
- 3.9 Technology and Industry Transformation
- 3.10 Competitive Landscape Summary
- 3.11 Analyst View and Strategic Implications
Chapter 4 United States Pet Supplements Market Trends and Developments
- 4.1 Historical Industry Development, 2018-2025
- 4.2 Recent Market Trends and Developments
- 4.3 Demand and Customer Behavior Trends
- 4.4 Technology and Product Innovation
- 4.5 Artificial Intelligence, Automation and Digitalization
- 4.6 Local Manufacturing and Supply Chain Realignment
- 4.7 Industry Partnerships, Mergers and Acquisitions
- 4.8 Sustainability and Circular Economy Developments
- 4.9 Government and Private Sector Investment Trends
- 4.10 Emerging Business Models and Commercialization
- 4.11 Industry Developments and Announcements
Chapter 5 United States Pet Supplements Market Production, Supply and Demand Analysis
- 5.1 Demand Trend and Consumption Analysis, 2018-2025
- 5.2 Demand Forecast, 2025-2035
- 5.3 Production and Output Trend, 2018-2025
- 5.4 Production and Output Forecast, 2025-2035
- 5.5 Installed Capacity and Capacity Utilization
- 5.6 Company-Wise Production Plants and Statistics
- 5.6.1 Installed Production Capacity
- 5.6.2 Actual Production
- 5.6.3 Planned Capacity and Expansion Targets
- 5.7 Supply Chain Structure and Procurement Trends
- 5.8 Supply-Demand Gap and Bottlenecks
- 5.9 Import Dependence and Sourcing Structure
- 5.10 Contract Manufacturing and Outsourcing
- 5.11 Regional Supply and Demand Concentration
Chapter 6 United States Pet Supplements Market Pricing Analysis
- 6.1 Pricing Structure and Measurement
- 6.2 Historical Pricing Trends, 2018-2025
- 6.3 Pricing Outlook, 2025-2035
- 6.4 Average Selling Price and Unit Economics
- 6.5 Pricing by Product and Market Segment
- 6.6 Geographic Pricing Differences
- 6.7 Key Input, Energy, Labor and Logistics Costs
- 6.8 Contract Pricing and Purchasing Models
- 6.9 Pricing Sensitivity and Competitive Positioning
- 6.10 Price, Margin and Profitability Implications
Chapter 7 United States Pet Supplements Market Dynamics
- 7.1 Market Growth Drivers
- 7.1.1 Demand-Side Drivers
- 7.1.2 Technology and Innovation Drivers
- 7.1.3 Infrastructure and Investment Drivers
- 7.1.4 Regulatory and Policy Drivers
- 7.2 Market Restraints
- 7.2.1 Cost and Affordability Constraints
- 7.2.2 Technology and Adoption Barriers
- 7.2.3 Supply Chain and Operational Constraints
- 7.3 Market Challenges
- 7.3.1 Competitive Pressure and Margin Erosion
- 7.3.2 Skills, Infrastructure and Implementation Gaps
- 7.4 Emerging Market Opportunities
- 7.5 Market Dynamics Impact and Time-Horizon Assessment
Chapter 8 United States Pet Supplements Value Chain Analysis
- 8.1 Industry Value Chain Overview
- 8.2 Upstream Suppliers and Critical Inputs
- 8.3 Technology and Component Providers
- 8.4 Manufacturing or Service Delivery
- 8.5 Distribution, Channel Partners and Integrators
- 8.6 Downstream Applications and End Users
- 8.7 Value Addition and Profit Pools
- 8.8 Vertical Integration and Outsourcing
- 8.9 Supplier Concentration and Risk
- 8.10 Supply Chain Localization and Resilience
Chapter 9 United States Pet Supplements Market Regulations and Policies
- 9.1 Relevant Laws, Standards and Compliance Frameworks
- 9.2 Product, Service, Safety and Quality Requirements
- 9.3 Government Policies, Incentives and Subsidies
- 9.4 Imports, Exports and Trade Barriers
- 9.5 Public Procurement and Local Content Requirements
- 9.6 Environmental and Sustainability Compliance
- 9.7 Upcoming Policy Changes and Market Implications
Chapter 10 United States Pet Supplements Market Hotspots and Opportunities
- 10.1 Market Opportunity Mapping and Growth Hotspots
- 10.2 High-Growth Applications and Customer Groups
- 10.3 Underserved Markets and White-Space Opportunities
- 10.4 Emerging Technology and Product Opportunities
- 10.5 New Capacity and Investment Hotspots
- 10.6 Market Entry and Expansion Opportunities
- 10.7 Distribution and Partnership Opportunities
- 10.8 Near-Term and Long-Term Commercial Potential
- 10.9 Opportunity Attractiveness and Execution Risks
Chapter 11 United States Pet Supplements Market Outlook, 2025-2035
- 11.1 Market Size and Analysis
- 11.1.1 Revenue (Market Measurement: 2025: USD 2.64 billion → 2035: USD 4.22 billion)
- 11.1.2 Market Volume and Quantity Sold
- 11.1.3 Historical Market Size, 2018-2025
- 11.1.4 Base-Year Market Size, 2025
- 11.2 Market Forecast, 2025-2035
- 11.2.1 Revenue Forecast to 2035
- 11.2.2 Volume Forecast to 2035
- 11.2.3 CAGR and Year-on-Year Growth
- 11.2.4 Incremental Revenue Opportunity
- 11.3 Forecast Assumptions and Scenario Analysis
- 11.3.1 Base-Case Forecast
- 11.3.2 Optimistic and Conservative Scenarios
- 11.3.3 Technology, Pricing and Policy Sensitivities
- 11.4 Market Attractiveness and Growth Outlook
Chapter 12 United States Pet Supplements Market Segmentation and Outlook
- 12.1 Segmentation Summary and Market Shares, 2025
- 12.2 Largest and Fastest-Growing Segments
- 12.3 By Product Type - Market Size and Forecast, 2025-2035
- 12.3.1 Segment Definition and Scope
- 12.3.2 Historical Market Size, 2018-2025
- 12.3.3 Revenue Forecast, 2025-2035
- 12.3.4 Volume Forecast, 2025-2035
- 12.3.5 Base-Year Market Share, 2025
- 12.3.6 Segment CAGR and Growth Drivers
- 12.3.7 Subsegment Market Size and Forecast
- 12.3.7.1 Chews
- 12.3.7.2 Capsules & Softgels
- 12.3.7.3 Powders & Granules
- 12.3.7.4 Liquids & Functional Topicals
- 12.3.8 Subsegment Pricing and Adoption Trends
- 12.3.9 Leading Suppliers and Competition
- 12.3.10 Regional Demand and Opportunities
- 12.4 By Application - Market Size and Forecast, 2025-2035
- 12.4.1 Segment Definition and Scope
- 12.4.2 Historical Market Size, 2018-2025
- 12.4.3 Revenue Forecast, 2025-2035
- 12.4.4 Volume Forecast, 2025-2035
- 12.4.5 Base-Year Market Share, 2025
- 12.4.6 Segment CAGR and Growth Drivers
- 12.4.7 Subsegment Market Size and Forecast
- 12.4.7.1 Joint & Mobility
- 12.4.7.2 Skin & Coat
- 12.4.7.3 Digestive Health
- 12.4.7.4 Systemic Wellness
- 12.4.8 Subsegment Pricing and Adoption Trends
- 12.4.9 Leading Suppliers and Competition
- 12.4.10 Regional Demand and Opportunities
- 12.5 By End User - Market Size and Forecast, 2025-2035
- 12.5.1 Segment Definition and Scope
- 12.5.2 Historical Market Size, 2018-2025
- 12.5.3 Revenue Forecast, 2025-2035
- 12.5.4 Volume Forecast, 2025-2035
- 12.5.5 Base-Year Market Share, 2025
- 12.5.6 Segment CAGR and Growth Drivers
- 12.5.7 Subsegment Market Size and Forecast
- 12.5.7.1 Dogs
- 12.5.7.2 Cats
- 12.5.7.3 Other Companion Animals
- 12.5.8 Subsegment Pricing and Adoption Trends
- 12.5.9 Leading Suppliers and Competition
- 12.5.10 Regional Demand and Opportunities
- 12.6 Segment Growth Comparison
- 12.7 Segment Attractiveness and Priority Matrix
Chapter 13 United States Pet Supplements End-Use and Application Market Outlook
- 13.1 End-Use Industry and Customer Demand Structure
- 13.2 Leading Applications and Customer Groups
- 13.3 End-Use Market Size, Share and Forecast
- 13.4 Major End-Use Industry Deep Dives
- 13.4.1 Customer Requirements and Use Cases
- 13.4.2 Demand and Replacement Cycles
- 13.4.3 Technical and Regulatory Considerations
- 13.4.4 Purchasing and Procurement Models
- 13.4.5 Leading Vendors and Distribution Channels
- 13.4.6 Forecast and Commercial Opportunities
- 13.5 Emerging Applications and Cross-Segment Demand
- 13.6 End-Use Industry Investment Priorities
Chapter 14 United States Pet Supplements Geographic Market Outlook, 2025-2035
- 14.1 Domestic Market Distribution and Demand Clusters
- 14.2 State- or Province-Wise Market Size and Forecast, 2025-2035
- 14.3 City and Metropolitan Market Outlook
- 14.4 Industrial, Manufacturing and Commercial Clusters
- 14.5 Geographic Concentration of Key End Users
- 14.6 Local Pricing and Purchasing Differences
- 14.7 Domestic Production Facilities and Capacity Map
- 14.8 Local Infrastructure and Project Pipeline
- 14.9 State-Level Policy and Incentive Differences
- 14.10 Subnational Investment Hotspots and Opportunities
- 14.11 Distribution and Logistics Networks
- 14.12 Domestic Competitive Footprint
Chapter 15 United States Pet Supplements Technology, Innovation and Sustainability Outlook
- 15.1 Technology Landscape and Maturity
- 15.2 Product, Process and Service Innovation
- 15.3 AI, Automation and Digital Tools in the Industry
- 15.4 Technology Adoption and Performance Benchmarking
- 15.5 Innovation Pipeline and R&D Investment
- 15.6 Patent and Intellectual Property Trends
- 15.7 Energy Efficiency and Resource Management
- 15.8 Sustainability, Recycling and Circularity
- 15.9 Technology Roadmap, 2025-2035
- 15.10 Risks of Obsolescence and Technology Substitution
Chapter 16 United States Pet Supplements Market Key Strategic Imperatives
- 16.1 Growth and Market Entry Priorities
- 16.2 High-Return Products and Segments
- 16.3 Pricing, Profitability and Cost Optimization
- 16.4 Technology Investment and Product Differentiation
- 16.5 Supply Chain Localization and Resilience
- 16.6 Distribution and Customer Acquisition
- 16.7 Partnership, Acquisition and Capacity Strategy
- 16.8 Regional Expansion Priorities
- 16.9 Short-, Medium- and Long-Term Actions
Chapter 17 Competition Outlook
- 17.1 Industry Competition Characteristics
- 17.2 Market Structure and Concentration
- 17.3 Market Share and Competitive Positioning, 2025
- 17.4 Company-Wise Revenue and Product Benchmarking
- 17.5 Production and Service Capacity Benchmarking
- 17.6 Technology, Pricing and Differentiation
- 17.7 Regional Footprint and Distribution Strength
- 17.8 Mergers, Acquisitions and Strategic Alliances
- 17.9 New Entrants and Competitive Threats
- 17.10 Porter's Five Forces and Industry Attractiveness
- 17.11 Competitive Outlook, 2025-2035
Chapter 18 Company Profiles
- 18.1 Company Coverage and Selection Criteria
- 18.2 Nestlé Purina PetCare
- 18.2.1 Business Description
- 18.2.2 Company Ownership and Geographic Presence
- 18.2.3 Product and Service Portfolio
- 18.2.4 Manufacturing and Operating Footprint
- 18.2.5 Production Capacity and Expansion Plans
- 18.2.6 Financial Performance and Investment
- 18.2.7 Market Share and Competitive Position
- 18.2.8 Technology and Innovation Capabilities
- 18.2.9 Strategic Alliances or Partnerships
- 18.2.10 Recent Developments
- 18.2.11 Growth Strategy and Outlook
- 18.3 H&H Group / Zesty Paws
- 18.4 Nutramax Laboratories
- 18.5 PetHonesty
- 18.6 Virbac USA
- 18.7 VetriScience / FoodScience
- 18.8 NaturVet / Garmon
- 18.9 Ark Naturals
- 18.10 Nordic Naturals
- 18.11 Other Relevant Market Participants
Note: Every listed company is profiled on the structure shown under the first company. The company list is preliminary and may change based on research findings, market developments, data availability and client requirements.
Chapter 19 Disclaimer
- 19.1 Research and Forecast Disclaimer
- 19.2 Data Source and Estimation Limitations
Note: The depth of individual sections depends on data availability for this market. Volume, capacity, trade and other unit-based metrics are included where applicable.

