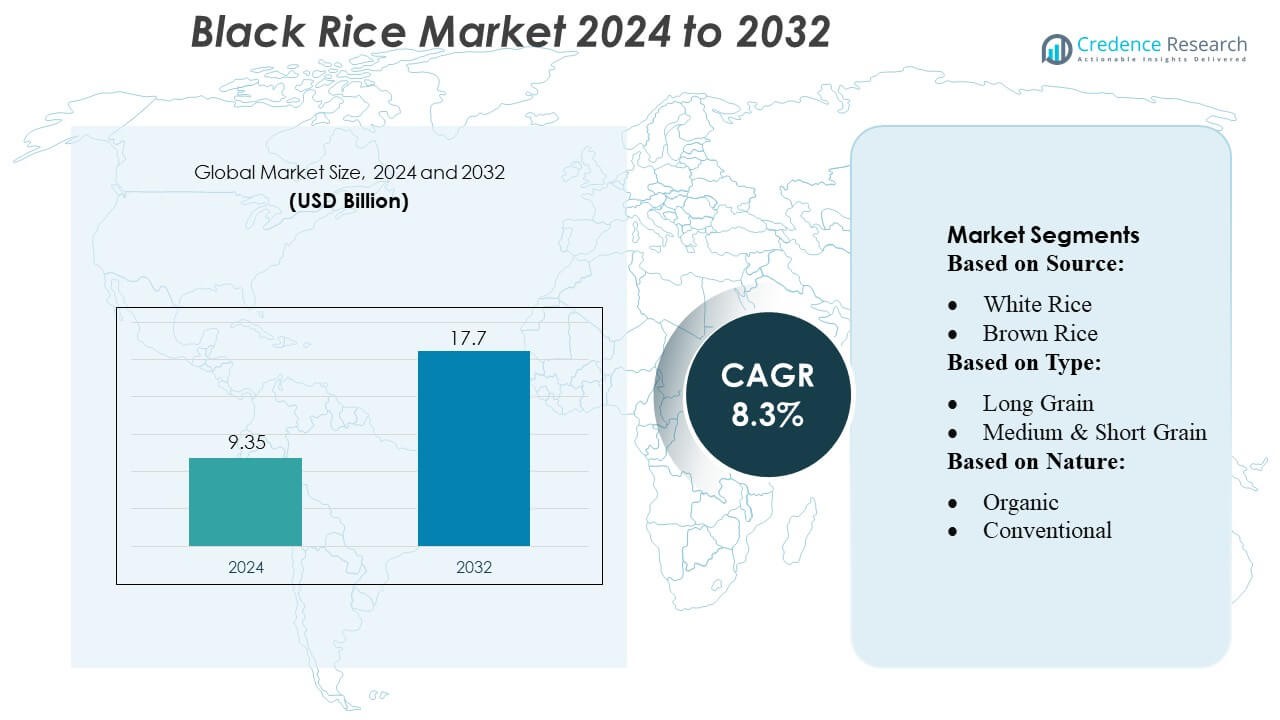
Home » Food & Beverage » Black Rice Market

Global Black Rice Market by Type (Philippine heirloom balatinaw black rice, Pirurut ong black glutinous rice, Thai jasmine black rice) by Form (Grocery stores, Convenience stores, Mass merchandisers, Farm and fleet, Others (club retailers, close-out operators, e-commerce)) by Applicatio (Household Consumers, Food and Beverages Industry, Pharmaceutical Industry) – Growth, Share, Opportunities & Competitive Analysis, 2020 – 2030

Price: $4999

Published: | Report ID: 7096 | Report Format : PDF

Market Insights

The global black rice market is poised for significant expansion, largely influenced by the continuous growth of the global human population. Recognized for its rich nutrient profile, black rice is not only nutritious but also economical. Such attributes are expected to propel the market growth substantially over the forthcoming decade.

Black rice, with its cost-effective nature, emerges as a viable solution to address food security concerns in developing nations. One of the distinct features of this grain is its black-purple hue, attributed to the presence of a potent antioxidant known as anthocyanin. Apart from imparting color, anthocyanin is renowned for its myriad health benefits. As awareness of these health advantages gains traction, anthocyanin will undoubtedly play a pivotal role in marketing strategies, further boosting the demand for black rice.

In terms forecast, the Global Black Rice market is projected to experience a Compound Annual Growth Rate (CAGR) of 5.13% during the predicted period. In 2022, the market revenue stood at over USD 181.13 Million, and by 2030, it’s anticipated to reach USD 270.86 Million. Thus, the cumulative growth potential for the global Black Rice market between 2022 and 2030 is estimated at an impressive USD 1.56 billion.

Black Rice Market

Market Growth Drivers in the Black Rice Market

The black rice market is buoyed by two significant market drivers: its myriad health and nutritional benefits and its adaptability in the culinary world. As health-conscious consumers seek out nutritionally-rich foods, black rice, enriched with antioxidants such as anthocyanin, emerges as a preferred choice. This trend is accentuated by the burgeoning awareness of its potential in preventative healthcare and wellness. Concurrently, another key market driver is the grain’s versatility in diverse culinary applications, particularly amid the rising popularity of ethnic and fusion cuisines. With its unique texture, deep hue, and nutty undertone, black rice is increasingly featured in both traditional and innovative fusion recipes, further solidifying its position in the global food market.

Design Element 2

Access crucial information at unmatched prices!

Request your free sample report today & start making informed decisions powered by Credence Research!

Download Free Sample
CTA Design Element 3

Interesting Facts about Black Rice Industry

  • Black Rice is also known as purple rice or forbidden rice or chak-hao
  • Black Rice is a good source of iron and several nutrients.
  • Black Rice is native to North-East India.
  • Black Rice Prices vary from USD 3 to USD 10 based on species and quality.
  • Black Rice Concentrates and Isolates are Widely being Used in Dairy Protein, Meat Alternatives, and Sports & Energy Nutrition

Black rice has been valued since ancient times due to its nutritional value. This crop was called “forbidden rice” in China since no one was allowed to eat it besides royalty. This crop is so nutritious that royalty reserved it for their use.

Good Source of Nutrients and Iron

Black rice is an excellent source of several kinds of nutrients. Black rice has one of the highest amounts of protein among the different rice varieties. While brown rice has 7 grams of protein per 100 grams, black rice has 9 grams of protein, making it an even healthier food choice than brown rice. The health benefits of brown rice are relatively well known. However, since black rice is a richer source of nutrients, it will have an equally sizable demand with proper marketing.

Black rice is also a good source of iron. Hence, this is the perfect food for the impoverished masses in developing nations since these areas are afflicted with large-scale iron deficiencies. Black rice is the answer to the iron deficiency problem in many parts of the globe. Philippine heirloom balatinaw black rice, Pirurut ong black glutinous rice, and Thai jasmine black rice are significant types of black rice.

Black Rice Offers Several Health Benefits

Black rice is also a good source of fiber, carbohydrates, and healthy plant proteins. These are essential facets that will fuel the growth of the black rice market.

Besides having a high amount of several nutrients, black rice is also an excellent source of antioxidants. This means that black rice can protect against free radical damage, which is the root cause of several adverse health conditions. One point to note about black rice is that it has the highest antioxidants compared to other sorts of rice. Black rice is also rich in carotenoids and flavonoids, among other antioxidants.

Hence, black rice represents a viable alternative for low-income groups to supplement their diet with healthy plant-based food.

Another critical factor that will drive the growth of the black rice market is that it is less well known than other kinds of rice. While different kinds of rice, such as brown rice, are well known, the market is saturated and does not have the potential for further growth (apart from the increasing population). Hence, with a concerted marketing campaign, the market for black rice will increase substantially over the coming year.

Grocery Stores Dominate Distribution Channel

Grocery stores, Convenience stores, Mass merchandisers, Farm and fleet, and Others (club retailers, close-out operators, e-commerce) are major distribution channels for black rice. Grocery stores dominated distribution channels with over 35% share in 2021. However, e-commerce is likely to grow at a rapid pace in the years to come. While Household Consumers, Food and Beverages Industry, and Pharmaceutical Industry are significant end-users of black rice. Household consumers will dominate with over 50% share in 2021. Natureland Organics, FOR8 Aromatic, Woodland Foods, Naturally Yours, Epicurious, and Love and Lemons are some of the most prominent brands in the Black Rice Industry.

Market Restraints in the Black Rice Market

The black rice market, while promising, faces several challenges that can potentially curb its growth. One significant restraint is its limited production, which inherently affects its global availability, making it a less common commodity compared to other rice varieties. This scarcity, coupled with a pronounced price sensitivity—given the price fluctuations based on species and quality—creates apprehension among potential buyers, especially those who are budget-conscious. Additionally, despite its myriad benefits, there’s a palpable challenge in its broader adoption, primarily due to a lack of awareness and hesitancy among consumers to explore unfamiliar culinary options. These combined factors pose tangible barriers to the seamless expansion of the black rice market.

Shape Your Report to Specific Countries or Regions & Enjoy 30% Off!

Market Opportunities in the Black Rice Market

The rise of e-commerce and online retail presents a significant market opportunity for black rice. Digital platforms offer a broader reach, enabling producers to access markets previously difficult to penetrate. This digital proliferation not only facilitates a wider distribution but also educates potential consumers about the unique benefits and applications of black rice, thus fostering increased demand.

Furthermore, there’s immense potential in exporting and promoting local varieties of black rice, which can position it as a premium and exotic offering in international markets. The celebration of indigenous varieties can lead to enhanced brand differentiation and the potential to command higher price points.

Additionally, the global trend towards sustainable and environmentally-friendly practices offers another avenue of opportunity. By adopting and promoting sustainable farming practices, black rice producers can appeal to the ever-growing segment of environmentally-conscious consumers. Such initiatives not only enhance the crop’s marketability but also ensure long-term sustainability and ecological balance in its production.

Market Segmentations

By Type

  • Philippine heirloom balatinaw black rice,
  • Pirurut ong black glutinous rice,
  • Thai jasmine black rice

By Form

  • Grocery stores,
  • Convenience stores,
  • Mass merchandisers,
  • Farm and fleet,

Others

  • Club retailers,
  • Close-out operators,
  • E-commerce

By Application

  • Household Consumers,
  • Food and Beverages Industry,
  • Pharmaceutical Industry

Chapter No. 1 :………. Introduction.. 47

1.1.      Report Description. 47

1.1.1.    Purpose of the Report 47

1.1.2.    USP & Key Offerings. 47

1.2.      Key Benefits for Stakeholders. 47

1.3.      Target Audience. 48

1.4.      Report Scope  49

Chapter No. 2 :………. Executive Summary. 51

2.1.      Black Rice Market Snapshot. 51

2.2.      Global Black Rice Market, 2017 – 2030 (Tons) 52

2.3.      Global Black Rice Market, 2017 – 2030 (USD Million) 53

Chapter No. 3 :………. Impact Analysis of COVID 19 & Russia-Ukraine War on Black Rice Market. 54

3.1.      Impact Assessment of COVID-19 Pandemic, By Region. 54

3.2.      Russia-Ukraine War Impacts. 55

Chapter No. 4 :………. Black Rice Market – Industry Analysis. 57

4.1.      Introduction  57

4.2.      Market Drivers  58

4.2.1.    Health and Nutritional Benefits and Increasing Health Consciousness. 58

4.2.2.    Diverse Culinary Uses. 59

4.2.3.    Growth of Ethnic and Fusion Cuisines. 60

4.3.      Market Restraints. 62

4.3.1.    Limited Production and Availability & Price Sensitivity. 62

4.3.2.    Challenges in Adoption. 62

4.4.      Market Opportunities. 64

4.4.1.    E-commerce and Online Retail 64

4.4.2.    Export, Promotion of Local Varieties and Sustainable Farming Practices. 64

4.5.      Porter’s Five Forces Analysis. 65

4.6.      Value Chain Analysis. 67

4.7.      Buying Criteria  68

Chapter No. 5 :………. Import Export Analysis. 69

5.1.      Import Analysis by Region. 69

5.1.1.    Global Black Rice Market Import Volume/Revenue, By Region, 2017 – 2022. 69

5.2.      Export Analysis by Region. 70

5.2.1.    Global Black Rice Market Export Volume/Revenue, By Region, 2017 – 2022. 70

Chapter No. 6 :………. Demand Supply Analysis. 71

6.1.      Demand Analysis by Region. 71

6.1.1.    Global Black Rice Market Demand Volume/Revenue, By Region, 2017 – 2022. 71

6.2.      Supply Analysis by Region. 72

6.2.1.    Global Black Rice Market Supply Volume/Revenue, By Region, 2017 – 2022. 72

Chapter No. 7 :………. Production Analysis. 73

7.1.      Production Analysis by Region. 73

7.1.1.    Global Black Rice Market Production, By Region, 2017 – 2022. 73

7.1.2.    Global Black Rice Market Production Volume, By Region, 2017 – 2022 (Tons) 73

Chapter No. 8 :………. Price Analysis. 74

8.1.      Price Analysis by Region. 74

8.1.1.    Global Black Rice Market Price, By Region, 2017 – 2022  74

8.1.2.    Global Application Market Price, By Region, 2017 – 2022  (USD/Kg) 74

8.2.      Price Analysis by Type. 75

8.2.1.    Global Black Rice Market Price, By Type, 2017 – 2022. 75

8.2.2.    Global Type Market Price, By Type, 2017 – 2022. 75

Chapter No. 9 :………. Cultivation Cost Analysis. 76

9.1.      Cultivation Cost Analysis. 76

9.1.1.    Cultivation Cost Analysis. 76

9.2.      Cultivation Process. 76

Chapter No. 10 :…….. Analysis Competitive Landscape. 78

10.1.    Company Market Share Analysis – 2022. 78

10.1.1.  Global Black Rice Market: Company Market Share, by Volume, 2022. 78

10.1.2.  Global Black Rice Market: Company Market Share, by Revenue2022. 79

10.1.3.  Global Black Rice Market: Top 3 Company Market Share, by Revenue2022. 79

10.1.    Global Black Rice Market Company Volume Market Share, 2022. 80

10.2.    Global Black Rice Market Company Revenue Market Share, 2022. 81

Chapter No. 11 :…….. PESTEL & Adjacent Market Analysis. 82

11.1.    PESTEL  82

11.1.1.  Political Factors. 82

11.1.2.  Economic Factors. 82

11.1.3.  Social Factors. 82

11.1.4.  Technological Factors. 83

11.1.5.  Environmental Factors. 83

11.1.6.  Legal Factors. 83

Chapter No. 12 :…….. Black Rice Market – By Application Segment Analysis. 84

12.1.    Black Rice Market Overview, by Application Segment. 84

12.1.1.  Black Rice Market Volume Share, By Application, 2022 & 2030. 84

12.1.2.  Black Rice Market Revenue Share, By Application, 2022 & 2030. 84

12.1.3.  Black Rice Market Attractiveness Analysis, By Application. 85

12.1.4.  Incremental Revenue Growth Opportunity, by Application, 2023 – 2030. 85

12.1.5.  Black Rice Market Revenue, By Application, 2017 to 2022  86

12.2.    Household Consumers. 87

12.3.    Food and Beverages. 87

12.4.    Pharmaceutical 88

Chapter No. 13 :…….. Black Rice Market – By Distribution Channel Segment Analysis. 89

13.1.    Black Rice Market Overview, by Distribution Channel Segment. 89

13.1.1.  Black Rice Market Volume Share, By Distribution Channel, 2022 & 2030. 89

13.1.2.  Black Rice Market Revenue Share, By Distribution Channel, 2022 & 2030. 89

13.1.3.  Black Rice Market Attractiveness Analysis, By Distribution Channel 90

13.1.4.  Incremental Revenue Growth Opportunity, by Distribution Channel, 2023 – 2030. 90

13.1.5.  Black Rice Market Revenue, By Distribution Channel, 2017 to 2022. 91

13.2.    Grocery stores  92

13.3.    Convenience stores. 92

13.4.    Mass merchandisers. 93

13.5.    Farm and fleet  93

13.6.    Others  94

Chapter No. 14 :…….. Black Rice Market – By Species Segment Analysis. 95

14.1.    Black Rice Market Overview, by Species Segment. 95

14.1.1.  Black Rice Market Revenue Share, By Species, 2022 & 2030  95

14.1.2.  Black Rice Market Revenue Share, By Species, 2022 & 2030  95

14.1.3.  Black Rice Market Attractiveness Analysis, By Species  96

14.1.4.  Incremental Revenue Growth Opportunity, by Species, 2023 – 2030. 96

14.1.5.  Black Rice Market Revenue, By Species, 2017 to 2022  97

14.2.    Philippine heirloom balatinaw.. 98

14.3.    Pirurut ong black glutinous rice. 98

14.4.    Thai jasmine black rice. 99

14.5.    Others (Schizochytrium, Euglena, etc.) 99

Chapter No. 15 :…….. Black Rice Market – Regional Analysis. 100

15.1.    Black Rice Market Overview, by Regional Segments. 100

15.2.    Region  100

15.2.1.  Global Black Rice Market Volume Share, By Region, 2022 & 2030. 100

15.2.2.  Global Black Rice Market Revenue Share, By Region, 2022 & 2030. 101

15.2.3.  Black Rice Market Attractiveness Analysis, By Region. 102

15.2.4.  Incremental Revenue Growth Opportunity, by Region, 2023 – 2030. 102

15.2.5.  Black Rice Market Revenue, By Region, 2017 to 2022. 103

15.2.6.  Global Black Rice Market Volume, By Country, 2017 – 2022 (Tons) 104

15.2.7.  Global Black Rice Market Revenue, By Country, 2017 – 2022 (USD Million) 105

Chapter No. 16 :…….. Black Rice Market – North America.. 106

16.1.    North America  106

16.1.    Key Highlights  107

16.1.1.  North America Black Rice Market Volume, By Country, 2017 – 2022 (Tons) 108

16.1.2.  North America Black Rice Market Revenue, By Country, 2017 – 2022 (USD Million) 109

16.1.2.1.      North America Black Rice Market Volume, By Application, 2017 – 2022 (Tons) 110

16.1.3.  North America Black Rice Market Revenue, By Application, 2017 – 2022 (USD Million) 111

16.1.4.  North America Black Rice Market Volume, By Distribution Channel, 2017 – 2022 (Tons) 112

16.1.5.  North America Black Rice Market Revenue, By Distribution Channel, 2017 – 2022 (USD Million) 113

16.1.6.  North America Black Rice Market Volume, By Species, 2017 – 2022 (Tons) 114

16.1.7.  North America Black Rice Market Revenue, By Species, 2017 – 2022 (USD Million) 115

16.1.8.  U.S. 116

16.1.8.1.      U.S. Black Rice Market Volume, By Application, 2017 – 2022 (Tons) 116

16.1.9.  U.S. Black Rice Market Revenue, By Application, 2017 – 2022 (USD Million) 117

16.1.10.            U.S. Black Rice Market Volume, By Distribution Channel, 2017 – 2022 (Tons) 118

16.1.11.            U.S. Black Rice Market Revenue, By Distribution Channel, 2017 – 2022 (USD Million) 119

16.1.12.            U.S. Black Rice Market Volume, By Species, 2017 – 2022 (Tons) 120

16.1.13.            U.S. Black Rice Market Revenue, By Species, 2017 – 2022 (USD Million) 121

16.1.14.            Canada. 122

16.1.14.1.    Canada Black Rice Market Volume, By Application, 2017 – 2022 (Tons) 122

16.1.15.            Canada Black Rice Market Revenue, By Application, 2017 – 2022 (USD Million) 123

16.1.16.            Canada Black Rice Market Volume, By Distribution Channel, 2017 – 2022 (Tons) 124

16.1.17.            Canada Black Rice Market Revenue, By Distribution Channel, 2017 – 2022 (USD Million) 125

16.1.18.            Canada Black Rice Market Volume, By Species, 2017 – 2022 (Tons) 126

16.1.19.            Canada Black Rice Market Revenue, By Species, 2017 – 2022 (USD Million) 127

16.1.20.            Mexico. 128

16.1.20.1.    Mexico Black Rice Market Volume, By Application, 2017 – 2022 (Tons) 128

16.1.21.            Mexico Black Rice Market Revenue, By Application, 2017 – 2022 (USD Million) 129

16.1.22.            Mexico Black Rice Market Volume, By Distribution Channel, 2017 – 2022 (Tons) 130

16.1.23.            Mexico Black Rice Market Revenue, By Distribution Channel, 2017 – 2022 (USD Million) 131

16.1.24.            Mexico Black Rice Market Volume, By Species, 2017 – 2022 (Tons) 132

16.1.25.            Mexico Black Rice Market Revenue, By Species, 2017 – 2022 (USD Million) 133

Chapter No. 17 :…….. Black Rice Market – Europe. 134

17.1.    Europe  134

17.2.    Key Highlights  135

17.2.1.  Europe Black Rice Market Volume, By Country, 2017 – 2022 (Tons) 136

17.2.2.  Europe Black Rice Market Revenue, By Country, 2017 – 2022 (USD Million) 137

17.2.2.1.      Mexico Black Rice Market Volume, By Application, 2017 – 2022 (Tons) 138

17.2.3.  Europe Black Rice Market Revenue, By Application, 2017 – 2022 (USD Million) 139

17.2.4.  Europe Black Rice Market Volume, By Distribution Channel, 2017 – 2022 (Tons) 140

17.2.5.  Europe Black Rice Market Revenue, By Distribution Channel, 2017 – 2022 (USD Million) 141

17.2.6.  Europe Black Rice Market Volume, By Species, 2017 – 2022 (Tons) 142

17.2.7.  Europe Black Rice Market Revenue, By Species, 2017 – 2022 (USD Million) 143

17.2.8.  UK  144

17.2.8.1.      UK Black Rice Market Volume, By Application, 2017 – 2022 (Tons) 144

17.2.9.  UK Black Rice Market Revenue, By Application, 2017 – 2022 (USD Million) 145

17.2.10.            UK Black Rice Market Volume, By Distribution Channel, 2017 – 2022 (Tons) 146

17.2.11.            UK Black Rice Market Revenue, By Distribution Channel, 2017 – 2022 (USD Million) 147

17.2.12.            UK Black Rice Market Volume, By Species, 2017 – 2022 (Tons) 148

17.2.13.            UK Black Rice Market Revenue, By Species, 2017 – 2022 (USD Million) 149

17.2.14.            France. 150

17.2.14.1.    France Black Rice Market Volume, By Application, 2017 – 2022 (Tons) 150

17.2.15.            France Black Rice Market Revenue, By Application, 2017 – 2022 (USD Million) 151

17.2.16.            France Black Rice Market Volume, By Distribution Channel, 2017 – 2022 (Tons) 152

17.2.17.            France Black Rice Market Revenue, By Distribution Channel, 2017 – 2022 (USD Million) 153

17.2.18.            France Black Rice Market Volume, By Species, 2017 – 2022 (Tons) 154

17.2.19.            France Black Rice Market Revenue, By Species, 2017 – 2022 (USD Million) 155

17.2.20.            Germany. 156

17.2.20.1.    Germany Black Rice Market Volume, By Application, 2017 – 2022 (Tons) 156

17.2.21.            Germany Black Rice Market Revenue, By Application, 2017 – 2022 (USD Million) 157

17.2.22.            Germany Black Rice Market Volume, By Distribution Channel, 2017 – 2022 (Tons) 158

17.2.23.            Germany Black Rice Market Revenue, By Distribution Channel, 2017 – 2022 (USD Million) 159

17.2.24.            Germany Black Rice Market Volume, By Species, 2017 – 2022 (Tons) 160

17.2.25.            Germany Black Rice Market Revenue, By Species, 2017 – 2022 (USD Million) 161

17.2.26.            Italy. 162

17.2.26.1.    Italy Black Rice Market Volume, By Application, 2017 – 2022 (Tons) 162

17.2.27.            Italy Black Rice Market Revenue, By Application, 2017 – 2022 (USD Million) 163

17.2.28.            Italy Black Rice Market Volume, By Distribution Channel, 2017 – 2022 (Tons) 164

17.2.29.            Italy Black Rice Market Revenue, By Distribution Channel, 2017 – 2022 (USD Million) 165

17.2.30.            Italy Black Rice Market Volume, By Species, 2017 – 2022 (Tons) 166

17.2.31.            Italy Black Rice Market Revenue, By Species, 2017 – 2022 (USD Million) 167

17.2.32.            Spain. 168

17.2.32.1.    Russia Black Rice Market Volume, By Application, 2017 – 2022 (Tons) 168

17.2.33.            Spain Black Rice Market Revenue, By Application, 2017 – 2022 (USD Million) 169

17.2.34.            Spain Black Rice Market Volume, By Distribution Channel, 2017 – 2022 (Tons) 170

17.2.35.            Spain Black Rice Market Revenue, By Distribution Channel, 2017 – 2022 (USD Million) 171

17.2.36.            Spain Black Rice Market Volume, By Species, 2017 – 2022 (Tons) 172

17.2.37.            Spain Black Rice Market Revenue, By Species, 2017 – 2022 (USD Million) 173

17.2.38.            Russia. 174

17.2.38.1.    Russia Black Rice Market Volume, By Application, 2017 – 2022 (Tons) 174

17.2.39.            Russia Black Rice Market Revenue, By Application, 2017 – 2022 (USD Million) 175

17.2.40.            Russia Black Rice Market Volume, By Distribution Channel, 2017 – 2022 (Tons) 176

17.2.41.            Russia Black Rice Market Revenue, By Distribution Channel, 2017 – 2022 (USD Million) 177

17.2.42.            Russia Black Rice Market Volume, By Species, 2017 – 2022 (Tons) 178

17.2.43.            Russia Black Rice Market Revenue, By Species, 2017 – 2022 (USD Million) 179

17.2.44.            Belgium.. 180

17.2.44.1.    Belgium Black Rice Market Volume, By Application, 2017 – 2022 (Tons) 180

17.2.45.            Belgium Black Rice Market Revenue, By Application, 2017 – 2022 (USD Million) 181

17.2.46.            Belgium Black Rice Market Volume, By Distribution Channel, 2017 – 2022 (Tons) 182

17.2.47.            Belgium Black Rice Market Revenue, By Distribution Channel, 2017 – 2022 (USD Million) 183

17.2.48.            Belgium Black Rice Market Volume, By Species, 2017 – 2022 (Tons) 184

17.2.49.            Belgium Black Rice Market Revenue, By Species, 2017 – 2022 (USD Million) 185

17.2.50.            Netherland. 186

17.2.50.1.    Netherland Black Rice Market Volume, By Application, 2017 – 2022 (Tons) 186

17.2.51.            Netherland Black Rice Market Revenue, By Application, 2017 – 2022 (USD Million) 187

17.2.52.            Netherland Black Rice Market Volume, By Distribution Channel, 2017 – 2022 (Tons) 188

17.2.53.            Netherland Black Rice Market Revenue, By Distribution Channel, 2017 – 2022 (USD Million) 189

17.2.54.            Netherland Black Rice Market Volume, By Species, 2017 – 2022 (Tons) 190

17.2.55.            Netherland Black Rice Market Revenue, By Species, 2017 – 2022 (USD Million) 191

17.2.56.            Austria. 192

17.2.56.1.    Austria Black Rice Market Volume, By Application, 2017 – 2022 (Tons) 192

17.2.57.            Austria Black Rice Market Revenue, By Application, 2017 – 2022 (USD Million) 193

17.2.58.            Austria Black Rice Market Volume, By Distribution Channel, 2017 – 2022 (Tons) 194

17.2.59.            Austria Black Rice Market Revenue, By Distribution Channel, 2017 – 2022 (USD Million) 195

17.2.60.            Austria Black Rice Market Volume, By Species, 2017 – 2022 (Tons) 196

17.2.61.            Austria Black Rice Market Revenue, By Species, 2017 – 2022 (USD Million) 197

17.2.62.            Sweden. 198

17.2.62.1.    Sweden Black Rice Market Volume, By Application, 2017 – 2022 (Tons) 198

17.2.63.            Sweden Black Rice Market Revenue, By Application, 2017 – 2022 (USD Million) 199

17.2.64.            Sweden Black Rice Market Volume, By Distribution Channel, 2017 – 2022 (Tons) 200

17.2.65.            Sweden Black Rice Market Revenue, By Distribution Channel, 2017 – 2022 (USD Million) 201

17.2.66.            Sweden Black Rice Market Volume, By Species, 2017 – 2022 (Tons) 202

17.2.67.            Sweden Black Rice Market Revenue, By Species, 2017 – 2022 (USD Million) 203

17.2.68.            Poland. 204

17.2.68.1.    Poland Black Rice Market Volume, By Application, 2017 – 2022 (Tons) 204

17.2.69.            Poland Black Rice Market Revenue, By Application, 2017 – 2022 (USD Million) 205

17.2.70.            Poland Black Rice Market Volume, By Distribution Channel, 2017 – 2022 (Tons) 206

17.2.71.            Poland Black Rice Market Revenue, By Distribution Channel, 2017 – 2022 (USD Million) 207

17.2.72.            Poland Black Rice Market Volume, By Species, 2017 – 2022 (Tons) 208

17.2.73.            Poland Black Rice Market Revenue, By Species, 2017 – 2022 (USD Million) 209

17.2.74.            Denmark. 210

17.2.74.1.    Denmark Black Rice Market Volume, By Application, 2017 – 2022 (Tons) 210

17.2.75.            Denmark Black Rice Market Revenue, By Application, 2017 – 2022 (USD Million) 211

17.2.76.            Denmark Black Rice Market Volume, By Distribution Channel, 2017 – 2022 (Tons) 212

17.2.77.            Denmark Black Rice Market Revenue, By Distribution Channel, 2017 – 2022 (USD Million) 213

17.2.78.            Denmark Black Rice Market Volume, By Species, 2017 – 2022 (Tons) 214

17.2.79.            Denmark Black Rice Market Revenue, By Species, 2017 – 2022 (USD Million) 215

17.2.80.            Switzerland. 216

17.2.80.1.    Denmark Black Rice Market Volume, By Application, 2017 – 2022 (Tons) 216

17.2.81.            Switzerland Black Rice Market Revenue, By Application, 2017 – 2022 (USD Million) 217

17.2.82.            Switzerland Black Rice Market Volume, By Distribution Channel, 2017 – 2022 (Tons) 218

17.2.83.            Switzerland Black Rice Market Revenue, By Distribution Channel, 2017 – 2022 (USD Million) 219

17.2.84.            Switzerland Black Rice Market Volume, By Species, 2017 – 2022 (Tons) 220

17.2.85.            Switzerland Black Rice Market Revenue, By Species, 2017 – 2022 (USD Million) 221

17.2.86.            Rest of Europe. 222

17.2.86.1.    Switzerland Black Rice Market Volume, By Application, 2017 – 2022 (Tons) 222

17.2.87.            Rest of Europe Black Rice Market Revenue, By Application, 2017 – 2022 (USD Million) 223

17.2.88.            Rest of Europe Black Rice Market Volume, By Distribution Channel, 2017 – 2022 (Tons) 224

17.2.89.            Rest of Europe Black Rice Market Revenue, By Distribution Channel, 2017 – 2022 (USD Million) 225

17.2.90.            Rest of Europe Black Rice Market Volume, By Species, 2017 – 2022 (Tons) 226

17.2.91.            Rest of Europe Black Rice Market Revenue, By Species, 2017 – 2022 (USD Million) 227

Chapter No. 18 :…….. Black Rice Market – Asia Pacific. 228

18.1.    Asia Pacific  228

18.2.    Key Highlights  229

18.2.1.  Asia Pacific Black Rice Market Volume, By Country, 2017 – 2022 (Tons) 230

18.2.2.  Asia Pacific Black Rice Market Revenue, By Country, 2017 – 2022 (USD Million) 231

18.2.2.1.      Asia Pacific Black Rice Market Volume, By Application, 2017 – 2022 (Tons) 232

18.2.3.  Asia Pacific Black Rice Market Revenue, By Application, 2017 – 2022 (USD Million) 233

18.2.4.  Asia Pacific Black Rice Market Volume, By Distribution Channel, 2017 – 2022 (Tons) 234

18.2.5.  Asia Pacific Black Rice Market Revenue, By Distribution Channel, 2017 – 2022 (USD Million) 235

18.2.6.  Asia Pacific Black Rice Market Volume, By Species, 2017 – 2022 (Tons) 236

18.2.7.  Asia Pacific Black Rice Market Revenue, By Species, 2017 – 2022 (USD Million) 237

18.2.8.  China  238

18.2.8.1.      China Black Rice Market Volume, By Application, 2017 – 2022 (Tons) 238

18.2.9.  China Black Rice Market Revenue, By Application, 2017 – 2022 (USD Million) 239

18.2.10.            China Black Rice Market Volume, By Distribution Channel, 2017 – 2022 (Tons) 240

18.2.11.            China Black Rice Market Revenue, By Distribution Channel, 2017 – 2022 (USD Million) 241

18.2.12.            China Black Rice Market Volume, By Species, 2017 – 2022 (Tons) 242

18.2.13.            China Black Rice Market Revenue, By Species, 2017 – 2022 (USD Million) 243

18.2.14.            Japan. 244

18.2.14.1.    China Black Rice Market Volume, By Application, 2017 – 2022 (Tons) 244

18.2.15.            Japan Black Rice Market Revenue, By Application, 2017 – 2022 (USD Million) 245

18.2.16.            Japan Black Rice Market Volume, By Distribution Channel, 2017 – 2022 (Tons) 246

18.2.17.            Japan Black Rice Market Revenue, By Distribution Channel, 2017 – 2022 (USD Million) 247

18.2.18.            Japan Black Rice Market Volume, By Species, 2017 – 2022 (Tons) 248

18.2.19.            Japan Black Rice Market Revenue, By Species, 2017 – 2022 (USD Million) 249

18.2.20.            South Korea. 250

18.2.20.1.    South Korea Black Rice Market Volume, By Application, 2017 – 2022 (Tons) 250

18.2.21.            South Korea Black Rice Market Revenue, By Application, 2017 – 2022 (USD Million) 251

18.2.22.            South Korea Black Rice Market Volume, By Distribution Channel, 2017 – 2022 (Tons) 252

18.2.23.            South Korea Black Rice Market Revenue, By Distribution Channel, 2017 – 2022 (USD Million) 253

18.2.24.            South Korea Black Rice Market Volume, By Species, 2017 – 2022 (Tons) 254

18.2.25.            South Korea Black Rice Market Revenue, By Species, 2017 – 2022 (USD Million) 255

18.2.26.            India. 256

18.2.26.1.    India Black Rice Market Volume, By Application, 2017 – 2022 (Tons) 256

18.2.27.            India Black Rice Market Revenue, By Application, 2017 – 2022 (USD Million) 257

18.2.28.            India Black Rice Market Volume, By Distribution Channel, 2017 – 2022 (Tons) 258

18.2.29.            India Black Rice Market Revenue, By Distribution Channel, 2017 – 2022 (USD Million) 259

18.2.30.            India Black Rice Market Volume, By Species, 2017 – 2022 (Tons) 260

18.2.31.            India Black Rice Market Revenue, By Species, 2017 – 2022 (USD Million) 261

18.2.32.            Australia. 262

18.2.32.1.    Australia Black Rice Market Volume, By Application, 2017 – 2022 (Tons) 262

18.2.33.            Australia Black Rice Market Revenue, By Application, 2017 – 2022 (USD Million) 263

18.2.34.            Australia Black Rice Market Volume, By Distribution Channel, 2017 – 2022 (Tons) 264

18.2.35.            Australia Black Rice Market Revenue, By Distribution Channel, 2017 – 2022 (USD Million) 265

18.2.36.            Australia Black Rice Market Volume, By Species, 2017 – 2022 (Tons) 266

18.2.37.            Australia Black Rice Market Revenue, By Species, 2017 – 2022 (USD Million) 267

18.2.38.            Thailand. 268

18.2.38.1.    Thailand Black Rice Market Volume, By Application, 2017 – 2022 (Tons) 268

18.2.39.            Thailand Black Rice Market Revenue, By Application, 2017 – 2022 (USD Million) 269

18.2.40.            Thailand Black Rice Market Volume, By Distribution Channel, 2017 – 2022 (Tons) 270

18.2.41.            Thailand Black Rice Market Revenue, By Distribution Channel, 2017 – 2022 (USD Million) 271

18.2.42.            Thailand Black Rice Market Volume, By Species, 2017 – 2022 (Tons) 272

18.2.43.            Thailand Black Rice Market Revenue, By Species, 2017 – 2022 (USD Million) 273

18.2.44.            Indonesia. 274

18.2.44.1.    Indonesia Black Rice Market Volume, By Application, 2017 – 2022 (Tons) 274

18.2.45.            Indonesia Black Rice Market Revenue, By Application, 2017 – 2022 (USD Million) 275

18.2.46.            Indonesia Black Rice Market Volume, By Distribution Channel, 2017 – 2022 (Tons) 276

18.2.47.            Indonesia Black Rice Market Revenue, By Distribution Channel, 2017 – 2022 (USD Million) 277

18.2.48.            Indonesia Black Rice Market Volume, By Species, 2017 – 2022 (Tons) 278

18.2.49.            Indonesia Black Rice Market Revenue, By Species, 2017 – 2022 (USD Million) 279

18.2.50.            Vietnam.. 280

18.2.50.1.    Vietnam Black Rice Market Volume, By Application, 2017 – 2022 (Tons) 280

18.2.51.            Vietnam Black Rice Market Revenue, By Application, 2017 – 2022 (USD Million) 281

18.2.52.            Vietnam Black Rice Market Volume, By Distribution Channel, 2017 – 2022 (Tons) 282

18.2.53.            Vietnam Black Rice Market Revenue, By Distribution Channel, 2017 – 2022 (USD Million) 283

18.2.54.            Vietnam Black Rice Market Volume, By Species, 2017 – 2022 (Tons) 284

18.2.55.            Vietnam Black Rice Market Revenue, By Species, 2017 – 2022 (USD Million) 285

18.2.56.            Malaysia. 286

18.2.56.1.    Malaysia Black Rice Market Volume, By Application, 2017 – 2022 (Tons) 286

18.2.57.            Malaysia Black Rice Market Revenue, By Application, 2017 – 2022 (USD Million) 287

18.2.58.            Malaysia Black Rice Market Volume, By Distribution Channel, 2017 – 2022 (Tons) 288

18.2.59.            Malaysia Black Rice Market Revenue, By Distribution Channel, 2017 – 2022 (USD Million) 289

18.2.60.            Malaysia Black Rice Market Volume, By Species, 2017 – 2022 (Tons) 290

18.2.61.            Malaysia Black Rice Market Revenue, By Species, 2017 – 2022 (USD Million) 291

18.2.62.            Philippines. 292

18.2.62.1.    Philippines Black Rice Market Volume, By Application, 2017 – 2022 (Tons) 292

18.2.63.            Philippines Black Rice Market Revenue, By Application, 2017 – 2022 (USD Million) 293

18.2.64.            Philippines Black Rice Market Volume, By Distribution Channel, 2017 – 2022 (Tons) 294

18.2.65.            Philippines Black Rice Market Revenue, By Distribution Channel, 2017 – 2022 (USD Million) 295

18.2.66.            Philippines Black Rice Market Volume, By Species, 2017 – 2022 (Tons) 296

18.2.67.            Philippines Black Rice Market Revenue, By Species, 2017 – 2022 (USD Million) 297

18.2.68.            Taiwan. 298

18.2.68.1.    Taiwan Black Rice Market Volume, By Application, 2017 – 2022 (Tons) 298

18.2.69.            Taiwan Black Rice Market Revenue, By Application, 2017 – 2022 (USD Million) 299

18.2.70.            Taiwan Black Rice Market Volume, By Distribution Channel, 2017 – 2022 (Tons) 300

18.2.71.            Taiwan Black Rice Market Revenue, By Distribution Channel, 2017 – 2022 (USD Million) 301

18.2.72.            Taiwan Black Rice Market Volume, By Species, 2017 – 2022 (Tons) 302

18.2.73.            Taiwan Black Rice Market Revenue, By Species, 2017 – 2022 (USD Million) 303

18.2.74.            Rest of Asia Pacific. 304

18.2.74.1.    Rest of Asia Pacific Black Rice Market Volume, By Application, 2017 – 2022 (Tons) 304

18.2.75.            Rest of Asia Pacific Black Rice Market Revenue, By Application, 2017 – 2022 (USD Million) 305

18.2.76.            Rest of Asia Pacific Black Rice Market Volume, By Distribution Channel, 2017 – 2022 (Tons) 306

18.2.77.            Rest of Asia Pacific Black Rice Market Revenue, By Distribution Channel, 2017 – 2022 (USD Million) 307

18.2.78.            Rest of Asia Pacific Black Rice Market Volume, By Species, 2017 – 2022 (Tons) 308

18.2.79.            Rest of Asia Pacific Black Rice Market Revenue, By Species, 2017 – 2022 (USD Million) 309

Chapter No. 19 :…….. Black Rice Market – Latin America.. 310

19.1.    Latin America  310

19.2.    Key Highlights  311

19.2.1.  Latin America Black Rice Market Volume, By Country, 2017 – 2022 (Tons) 312

19.2.2.  Latin America Black Rice Market Revenue, By Country, 2017 – 2022 (USD Million) 313

19.2.2.1.      Latin America Black Rice Market Volume, By Application, 2017 – 2022 (Tons) 314

19.2.3.  Latin America Black Rice Market Revenue, By Application, 2017 – 2022 (USD Million) 315

19.2.4.  Latin America Black Rice Market Volume, By Distribution Channel, 2017 – 2022 (Tons) 316

19.2.5.  Latin America Black Rice Market Revenue, By Distribution Channel, 2017 – 2022 (USD Million) 317

19.2.6.  Latin America Black Rice Market Volume, By Species, 2017 – 2022 (Tons) 318

19.2.7.  Latin America Black Rice Market Revenue, By Species, 2017 – 2022 (USD Million) 319

19.2.8.  Brazil 320

19.2.8.1.      Brazil Black Rice Market Volume, By Application, 2017 – 2022 (Tons) 320

19.2.9.  Brazil Black Rice Market Revenue, By Application, 2017 – 2022 (USD Million) 321

19.2.10.            Brazil Black Rice Market Volume, By Distribution Channel, 2017 – 2022 (Tons) 322

19.2.11.            Brazil Black Rice Market Revenue, By Distribution Channel, 2017 – 2022 (USD Million) 323

19.2.12.            Brazil Black Rice Market Volume, By Species, 2017 – 2022 (Tons) 324

19.2.13.            Brazil Black Rice Market Revenue, By Species, 2017 – 2022 (USD Million) 325

19.2.14.            Argentina. 326

19.2.14.1.    Argentina Black Rice Market Volume, By Application, 2017 – 2022 (Tons) 326

19.2.15.            Argentina Black Rice Market Revenue, By Application, 2017 – 2022 (USD Million) 327

19.2.16.            Argentina Black Rice Market Volume, By Distribution Channel, 2017 – 2022 (Tons) 328

19.2.17.            Argentina Black Rice Market Revenue, By Distribution Channel, 2017 – 2022 (USD Million) 329

19.2.18.            Argentina Black Rice Market Volume, By Species, 2017 – 2022 (Tons) 330

19.2.19.            Argentina Black Rice Market Revenue, By Species, 2017 – 2022 (USD Million) 331

19.2.20.            Peru. 332

19.2.20.1.    Peru Black Rice Market Volume, By Application, 2017 – 2022 (Tons) 332

19.2.21.            Peru Black Rice Market Revenue, By Application, 2017 – 2022 (USD Million) 333

19.2.22.            Peru Black Rice Market Volume, By Distribution Channel, 2017 – 2022 (Tons) 334

19.2.23.            Peru Black Rice Market Revenue, By Distribution Channel, 2017 – 2022 (USD Million) 335

19.2.24.            Peru Black Rice Market Volume, By Species, 2017 – 2022 (Tons) 336

19.2.25.            Peru Black Rice Market Revenue, By Species, 2017 – 2022 (USD Million) 337

19.2.26.            Chile. 338

19.2.26.1.    Chile Black Rice Market Volume, By Application, 2017 – 2022 (Tons) 338

19.2.27.            Chile Black Rice Market Revenue, By Application, 2017 – 2022 (USD Million) 339

19.2.28.            Chile Black Rice Market Volume, By Distribution Channel, 2017 – 2022 (Tons) 340

19.2.29.            Chile Black Rice Market Revenue, By Distribution Channel, 2017 – 2022 (USD Million) 341

19.2.30.            Chile Black Rice Market Volume, By Species, 2017 – 2022 (Tons) 342

19.2.31.            Chile Black Rice Market Revenue, By Species, 2017 – 2022 (USD Million) 343

19.2.32.            Colombia. 344

19.2.32.1.    Colombia Black Rice Market Volume, By Application, 2017 – 2022 (Tons) 344

19.2.33.            Colombia Black Rice Market Revenue, By Application, 2017 – 2022 (USD Million) 345

19.2.34.            Colombia Black Rice Market Volume, By Distribution Channel, 2017 – 2022 (Tons) 346

19.2.35.            Colombia Black Rice Market Revenue, By Distribution Channel, 2017 – 2022 (USD Million) 347

19.2.36.            Colombia Black Rice Market Volume, By Species, 2017 – 2022 (Tons) 348

19.2.37.            Colombia Black Rice Market Revenue, By Species, 2017 – 2022 (USD Million) 349

19.2.38.            Rest of Latin America. 350

19.2.38.1.    Rest of Latin America Black Rice Market Volume, By Application, 2017 – 2022 (Tons) 350

19.2.39.            Rest of Latin America Black Rice Market Revenue, By Application, 2017 – 2022 (USD Million) 351

19.2.40.            Rest of Latin America Black Rice Market Volume, By Distribution Channel, 2017 – 2022 (Tons) 352

19.2.41.            Rest of Latin America Black Rice Market Revenue, By Distribution Channel, 2017 – 2022 (USD Million) 353

19.2.42.            Rest of Latin America Black Rice Market Volume, By Species, 2017 – 2022 (Tons) 354

19.2.43.            Rest of Latin America Black Rice Market Revenue, By Species, 2017 – 2022 (USD Million) 355

Chapter No. 20 :…….. Black Rice Market – Middle East. 356

20.1.    The Middle-East. 356

20.2.    Key Highlights  357

20.2.1.  Middle East Black Rice Market Volume, By Country, 2017 – 2022 (Tons) 358

20.2.2.  Middle East Black Rice Market Revenue, By Country, 2017 – 2022 (USD Million) 359

20.2.2.1.      Middle East Black Rice Market Volume, By Application, 2017 – 2022 (Tons) 360

20.2.3.  Middle East Black Rice Market Revenue, By Application, 2017 – 2022 (USD Million) 361

20.2.4.  Middle East Black Rice Market Volume, By Distribution Channel, 2017 – 2022 (Tons) 362

20.2.5.  Middle East Black Rice Market Revenue, By Distribution Channel, 2017 – 2022 (USD Million) 363

20.2.6.  Middle East Black Rice Market Volume, By Species, 2017 – 2022 (Tons) 364

20.2.7.  Middle East Black Rice Market Revenue, By Species, 2017 – 2022 (USD Million) 365

20.2.8.  UAE  366

20.2.8.1.      UAE Black Rice Market Volume, By Application, 2017 – 2022 (Tons) 366

20.2.9.  UAE Black Rice Market Revenue, By Application, 2017 – 2022 (USD Million) 367

20.2.10.            UAE Black Rice Market Volume, By Distribution Channel, 2017 – 2022 (Tons) 368

20.2.11.            UAE Black Rice Market Revenue, By Distribution Channel, 2017 – 2022 (USD Million) 369

20.2.12.            UAE Black Rice Market Volume, By Species, 2017 – 2022 (Tons) 370

20.2.13.            UAE Black Rice Market Revenue, By Species, 2017 – 2022 (USD Million) 371

20.2.14.            KSA. 372

20.2.14.1.    KSA Black Rice Market Volume, By Application, 2017 – 2022 (Tons) 372

20.2.15.            KSA Black Rice Market Revenue, By Application, 2017 – 2022 (USD Million) 373

20.2.16.            KSA Black Rice Market Volume, By Distribution Channel, 2017 – 2022 (Tons) 374

20.2.17.            KSA Black Rice Market Revenue, By Distribution Channel, 2017 – 2022 (USD Million) 375

20.2.18.            KSA Black Rice Market Volume, By Species, 2017 – 2022 (Tons) 376

20.2.19.            KSA Black Rice Market Revenue, By Species, 2017 – 2022 (USD Million) 377

20.2.20.            Israel 378

20.2.20.1.    Israel Black Rice Market Volume, By Application, 2017 – 2022 (Tons) 378

20.2.21.            Israel Black Rice Market Revenue, By Application, 2017 – 2022 (USD Million) 379

20.2.22.            Israel Black Rice Market Volume, By Distribution Channel, 2017 – 2022 (Tons) 380

20.2.23.            Israel Black Rice Market Revenue, By Distribution Channel, 2017 – 2022 (USD Million) 381

20.2.24.            Israel Black Rice Market Volume, By Species, 2017 – 2022 (Tons) 382

20.2.25.            Israel Black Rice Market Revenue, By Species, 2017 – 2022 (USD Million) 383

20.2.26.            Turkey. 384

20.2.26.1.    Turkey Black Rice Market Volume, By Application, 2017 – 2022 (Tons) 384

20.2.27.            Turkey Black Rice Market Revenue, By Application, 2017 – 2022 (USD Million) 385

20.2.28.            Turkey Black Rice Market Volume, By Distribution Channel, 2017 – 2022 (Tons) 386

20.2.29.            Turkey Black Rice Market Revenue, By Distribution Channel, 2017 – 2022 (USD Million) 387

20.2.30.            Turkey Black Rice Market Volume, By Species, 2017 – 2022 (Tons) 388

20.2.31.            Turkey Black Rice Market Revenue, By Species, 2017 – 2022 (USD Million) 389

20.2.32.            Iran. 390

20.2.32.1.    Iran Black Rice Market Volume, By Application, 2017 – 2022 (Tons) 390

20.2.33.            Iran Black Rice Market Revenue, By Application, 2017 – 2022 (USD Million) 391

20.2.34.            Iran Black Rice Market Volume, By Distribution Channel, 2017 – 2022 (Tons) 392

20.2.35.            Iran Black Rice Market Revenue, By Distribution Channel, 2017 – 2022 (USD Million) 393

20.2.36.            Iran Black Rice Market Volume, By Species, 2017 – 2022 (Tons) 394

20.2.37.            Iran Black Rice Market Revenue, By Species, 2017 – 2022 (USD Million) 395

20.2.38.            Rest of Middle East 396

20.2.38.1.    Rest of Middle East Black Rice Market Volume, By Application, 2017 – 2022 (Tons) 396

20.2.39.            Rest of Middle East Black Rice Market Revenue, By Application, 2017 – 2022 (USD Million) 397

20.2.40.            Rest of Middle East Black Rice Market Volume, By Distribution Channel, 2017 – 2022 (Tons) 398

20.2.41.            Rest of Middle East Black Rice Market Revenue, By Distribution Channel, 2017 – 2022 (USD Million) 399

20.2.42.            Rest of Middle East Black Rice Market Volume, By Species, 2017 – 2022 (Tons) 400

20.2.43.            Rest of Middle East Black Rice Market Revenue, By Species, 2017 – 2022 (USD Million) 401

Chapter No. 21 :…….. Black Rice Market – Africa.. 402

21.1.    Africa  402

21.2.    Key Highlights  403

21.2.1.  Africa Black Rice Market Volume, By Country, 2017 – 2022 (Tons) 404

21.2.2.  Africa Black Rice Market Revenue, By Country, 2017 – 2022 (USD Million) 405

21.2.2.1.      Africa Black Rice Market Volume, By Application, 2017 – 2022 (Tons) 406

21.2.3.  Africa Black Rice Market Revenue, By Application, 2017 – 2022 (USD Million) 407

21.2.4.  Africa Black Rice Market Volume, By Distribution Channel, 2017 – 2022 (Tons) 408

21.2.5.  Africa Black Rice Market Revenue, By Distribution Channel, 2017 – 2022 (USD Million) 409

21.2.6.  Africa Black Rice Market Volume, By Species, 2017 – 2022 (Tons) 410

21.2.7.  Africa Black Rice Market Revenue, By Species, 2017 – 2022 (USD Million) 411

21.2.8.  South Africa. 412

21.2.8.1.      South Africa Black Rice Market Volume, By Application, 2017 – 2022 (Tons) 412

21.2.9.  South Africa Black Rice Market Revenue, By Application, 2017 – 2022 (USD Million) 413

21.2.10.            South Africa Black Rice Market Volume, By Distribution Channel, 2017 – 2022 (Tons) 414

21.2.11.            South Africa Black Rice Market Revenue, By Distribution Channel, 2017 – 2022 (USD Million) 415

21.2.12.            South Africa Black Rice Market Volume, By Species, 2017 – 2022 (Tons) 416

21.2.13.            South Africa Black Rice Market Revenue, By Species, 2017 – 2022 (USD Million) 417

21.2.14.            Egypt 418

21.2.14.1.    Egypt Black Rice Market Volume, By Application, 2017 – 2022 (Tons) 418

21.2.15.            Egypt Black Rice Market Revenue, By Application, 2017 – 2022 (USD Million) 419

21.2.16.            Egypt Black Rice Market Volume, By Distribution Channel, 2017 – 2022 (Tons) 420

21.2.17.            Egypt Black Rice Market Revenue, By Distribution Channel, 2017 – 2022 (USD Million) 421

21.2.18.            Egypt Black Rice Market Volume, By Species, 2017 – 2022 (Tons) 422

21.2.19.            Egypt Black Rice Market Revenue, By Species, 2017 – 2022 (USD Million) 423

21.2.20.            Nigeria. 424

21.2.20.1.    Nigeria Black Rice Market Volume, By Application, 2017 – 2022 (Tons) 424

21.2.21.            Nigeria Black Rice Market Revenue, By Application, 2017 – 2022 (USD Million) 425

21.2.22.            Nigeria Black Rice Market Volume, By Distribution Channel, 2017 – 2022 (Tons) 426

21.2.23.            Nigeria Black Rice Market Revenue, By Distribution Channel, 2017 – 2022 (USD Million) 427

21.2.24.            Nigeria Black Rice Market Volume, By Species, 2017 – 2022 (Tons) 428

21.2.25.            Nigeria Black Rice Market Revenue, By Species, 2017 – 2022 (USD Million) 429

21.2.26.            Algeria. 430

21.2.26.1.    Algeria Black Rice Market Volume, By Application, 2017 – 2022 (Tons) 430

21.2.27.            Algeria Black Rice Market Revenue, By Application, 2017 – 2022 (USD Million) 431

21.2.28.            Algeria Black Rice Market Volume, By Distribution Channel, 2017 – 2022 (Tons) 432

21.2.29.            Algeria Black Rice Market Revenue, By Distribution Channel, 2017 – 2022 (USD Million) 433

21.2.30.            Algeria Black Rice Market Volume, By Species, 2017 – 2022 (Tons) 434

21.2.31.            Algeria Black Rice Market Revenue, By Species, 2017 – 2022 (USD Million) 435

21.2.32.            Morocco. 436

21.2.32.1.    Morocco Black Rice Market Volume, By Application, 2017 – 2022 (Tons) 436

21.2.33.            Morocco Black Rice Market Revenue, By Application, 2017 – 2022 (USD Million) 437

21.2.34.            Morocco Black Rice Market Volume, By Distribution Channel, 2017 – 2022 (Tons) 438

21.2.35.            Morocco Black Rice Market Revenue, By Distribution Channel, 2017 – 2022 (USD Million) 439

21.2.36.            Morocco Black Rice Market Volume, By Species, 2017 – 2022 (Tons) 440

21.2.37.            Morocco Black Rice Market Revenue, By Species, 2017 – 2022 (USD Million) 441

21.2.38.            Rest of Africa. 442

21.2.38.1.    Rest of Africa Black Rice Market Volume, By Application, 2017 – 2022 (Tons) 442

21.2.39.            Rest of Africa Black Rice Market Revenue, By Application, 2017 – 2022 (USD Million) 443

21.2.40.            Rest of Africa Black Rice Market Volume, By Distribution Channel, 2017 – 2022 (Tons) 444

21.2.41.            Rest of Africa Black Rice Market Revenue, By Distribution Channel, 2017 – 2022 (USD Million) 445

21.2.42.            Rest of Africa Black Rice Market Volume, By Species, 2017 – 2022 (Tons) 446

21.2.43.            Rest of Africa Black Rice Market Revenue, By Species, 2017 – 2022 (USD Million) 447

Chapter No. 22 :…….. Company Profiles. 448

22.1.    Natureland Organics. 448

22.1.1.  Company Overview.. 448

22.1.2.  Product Portfolio. 449

22.1.3.  Financial Overview.. 449

22.2.    FOR8 Aromatic  450

22.2.1.  Company Overview.. 450

22.2.2.  Product Portfolio. 451

22.2.3.  Financial Overview.. 451

22.3.    Woodland Foods. 452

22.3.1.  Company Overview.. 452

22.3.2.  Product Portfolio. 453

22.3.3.  Financial Overview.. 453

22.4.    Naturally Yours  454

22.4.1.  Company Overview.. 454

22.4.2.  Product Portfolio. 455

22.4.3.  Financial Overview.. 455

22.5.    Epicurious  456

22.5.1.  Company Overview.. 456

22.5.2.  Product Portfolio. 457

22.5.3.  Financial Overview.. 457

22.6.    Love and Lemons. 458

22.6.1.  Company Overview.. 458

22.6.2.  Product Portfolio. 459

22.6.3.  Financial Overview.. 459

22.7.    The Natural Rice Co. 460

22.7.1.  Company Overview.. 460

22.7.2.  Product Portfolio. 461

22.7.3.  Financial Overview.. 461

22.8.    Lotus Food Inc  462

22.8.1.  Company Overview.. 462

22.8.2.  Product Portfolio. 463

22.8.3.  Financial Overview.. 463

Chapter No. 23 :…….. Research Methodology. 464

23.1.    Research Methodology. 464

23.2.    Phase I – Secondary Research. 465

23.3.    Phase II – Data Modeling. 465

23.3.1.  Company Share Analysis Model 466

23.3.2.  Revenue Based Modeling. 466

23.4.    Phase III – Primary Research. 467

23.5.    Research Limitations. 468

23.5.1.  Assumptions. 468


List of Figures

FIG NO. 1……….. Global Black Rice Market Volume & Revenue, 2017 – 2030 (Tons) 52

FIG NO. 2……….. Global Black Rice Market Volume & Revenue, 2017 – 2030 (USD Million) 53

FIG NO. 3……….. Porter’s Five Forces Analysis for Global Black Rice Market 65

FIG NO. 4……….. Value Chain Analysis for Global Black Rice Market 67

FIG NO. 5……….. Global Black Rice Market Import Volume/Revenue, By Region, 2017 – 2022. 69

FIG NO. 6……….. Global Black Rice Market Export Volume/Revenue, By Region, 2017 – 2022. 70

FIG NO. 7……….. Global Black Rice Market Demand Volume/Revenue, By Region, 2017 – 2022. 71

FIG NO. 8……….. Global Black Rice Market Supply Volume/Revenue, By Region, 2017 – 2022. 72

FIG NO. 9……….. Global Black Rice Market Production, By Region, 2017 – 2022. 73

FIG NO. 10……… Global Black Rice Market Price, By Region, 2017 – 2022. 74

FIG NO. 11……… Global Black Rice Market Price, By Type, 2017 – 2022. 75

FIG NO. 12……… Cultivation Cost Analysis 76

FIG NO. 13……… Company Share Analysis, 2022. 78

FIG NO. 14……… Company Share Analysis, 2022. 79

FIG NO. 15……… Company Share Analysis, 2022. 79

FIG NO. 16……… Black Rice Market – Company Volume  Market Share, 2022 (Tons) 80

FIG NO. 17……… Black Rice Market – Company Revenue Market Share, 2022. 81

FIG NO. 18……… Black Rice Market Volume Share, By Application, 2022 & 2030. 84

FIG NO. 19……… Black Rice Market Revenue Share, By Application, 2022 & 2030. 84

FIG NO. 20……… Market Attractiveness Analysis, By Application. 85

FIG NO. 21……… Incremental Revenue Growth Opportunity by Application. 85

FIG NO. 22……… Black Rice Market Revenue, By Application, 2017 to 2022. 86

FIG NO. 23……… Global Black Rice Market for Household Consumers, Volume & Revenue (Tons) (USD Million) 2017 – 2030. 87

FIG NO. 24……… Global Black Rice Market for Food and Beverages, Volume & Revenue (Tons) (USD Million) 2017 – 2030. 87

FIG NO. 25……… Global Black Rice Market for Pharmaceutical, Volume & Revenue (Tons) (USD Million) 2017 – 2030. 88

FIG NO. 26……… Black Rice Market Volume Share, By Distribution Channel, 2022 & 2030. 89

FIG NO. 27……… Black Rice Market Revenue Share, By Distribution Channel, 2022 & 2030. 89

FIG NO. 28……… Market Attractiveness Analysis, By Distribution Channel 90

FIG NO. 29……… Incremental Revenue Growth Opportunity by Distribution Channel 90

FIG NO. 30……… Black Rice Market Revenue, By Distribution Channel, 2017 to 2022. 91

FIG NO. 31……… Global Black Rice Market for Grocery stores, Volume & Revenue (Tons) (USD Million) 2017 – 2030. 92

FIG NO. 32……… Global Black Rice Market for Convenience stores, Volume & Revenue (Tons) (USD Million) 2017 – 2030. 92

FIG NO. 33……… Global Black Rice Market for Mass merchandisers, Volume & Revenue (Tons) (USD Million) 2017 – 2030. 93

FIG NO. 34……… Global Black Rice Market for Farm and fleet, Volume & Revenue (Tons) (USD Million) 2017 – 2030. 93

FIG NO. 35……… Global Black Rice Market for Others, Volume & Revenue (Tons) (USD Million) 2017 – 2030. 94

FIG NO. 36……… Black Rice Market Revenue Share, By Species, 2022 & 2030. 95

FIG NO. 37……… Black Rice Market Revenue Share, By Species, 2022 & 2030. 95

FIG NO. 38……… Market Attractiveness Analysis, By Species. 96

FIG NO. 39……… Incremental Revenue Growth Opportunity by Species. 96

FIG NO. 40……… Black Rice Market Revenue, By Species, 2017 to 2022. 97

FIG NO. 41……… Global Black Rice Market for Philippine heirloom balatinaw, Volume & Revenue (Tons) (USD Million) 2017 – 2030. 98

FIG NO. 42……… Global Black Rice Market for Pirurut ong black glutinous rice, Volume & Revenue (Tons) (USD Million) 2017 – 2030. 98

FIG NO. 43……… Global Black Rice Market for Thai jasmine black rice, Volume & Revenue (Tons) (USD Million) 2017 – 2030. 99

FIG NO. 44……… Global Black Rice Market for Others, Volume & Revenue (Tons) (USD Million) 2017 – 2030. 99

FIG NO. 45……… Global Black Rice Market Volume Share, By Region, 2022 & 2030. 100

FIG NO. 46……… Global Black Rice Market Revenue Share, By Region, 2022 & 2030. 101

FIG NO. 47……… Market Attractiveness Analysis, By Region. 102

FIG NO. 48……… Incremental Revenue Growth Opportunity by Region. 102

FIG NO. 49……… Black Rice Market Revenue, By Region, 2017 to 2022. 103

FIG NO. 50……… North America Black Rice Market Volume & Revenue, 2017 – 2022 (Tons) (USD Million) 106

FIG NO. 51……… Europe Black Rice Market Volume & Revenue, 2017 – 2022 (Tons) (USD Million) 134

FIG NO. 52……… Asia Pacific Black Rice Market Volume & Revenue, 2017 – 2022 (Tons) (USD Million) 228

FIG NO. 53……… Latin America Black Rice Market Volume & Revenue, 2017 – 2022 (Tons) (USD Million) 310

FIG NO. 54……… The Middle-East Black Rice Market Volume & Revenue, 2017 – 2022 (Tons) (USD Million) 356

FIG NO. 55……… Africa Black Rice Market Volume & Revenue, 2017 – 2022 (Tons) (USD Million) 402

FIG NO. 56……… Research Methodology – Detailed View.. 464

FIG NO. 57……… Research Methodology. 465


List of Tables

TABLE NO. 1. :…. Global Black Rice Market: Snapshot 51

TABLE NO. 2. :…. Drivers for the Black Rice Market: Impact Analysis. 58

TABLE NO. 3. :…. Restraints for the Black Rice Market: Impact Analysis. 62

TABLE NO. 4. :…. Global Black Rice Market Volume & Revenue, By Region, 2017 – 2022 (Tons) 73

TABLE NO. 5. :…. Global Black Rice Market Volume & Revenue, By Region, 2017 – 2022. 74

TABLE NO. 6. :…. Global Black Rice Market Volume & Revenue, By Type, 2017 – 2022. 75

TABLE NO. 7. :…. Global Black Rice Market Volume, By Country, 2017 – 2022 (Tons) 104

TABLE NO. 8. :…. Global Black Rice Market Volume, By Country, 2023– 2030 (Tons) 104

TABLE NO. 9. :…. Global Black Rice Market Revenue, By Country, 2017 – 2022 (USD Million) 105

TABLE NO. 10. :.. Global Black Rice Market Revenue, By Country, 2023– 2030 (USD Million) 105

TABLE NO. 11. :.. North America Black Rice Market Volume, By Country, 2017 – 2022 (Tons) 108

TABLE NO. 12. :.. North America Black Rice Market Volume, By Country, 2023– 2030 (Tons) 108

TABLE NO. 13. :.. North America Black Rice Market Revenue, By Country, 2017 – 2022 (USD Million) 109

TABLE NO. 14. :.. North America Black Rice Market Revenue, By Country, 2023– 2030 (USD Million) 109

TABLE NO. 15. :.. North America Black Rice Market Volume, By Application, 2017 – 2022 (Tons) 110

TABLE NO. 16. :.. North America Black Rice Market Volume, By Application, 2023– 2030 (Tons) 110

TABLE NO. 17. :.. North America Black Rice Market Revenue, By Application, 2017 – 2022 (USD Million) 111

TABLE NO. 18. :.. North America Black Rice Market Revenue, By Application, 2023– 2030 (USD Million) 111

TABLE NO. 19. :.. North America Black Rice Market Volume, By Distribution Channel, 2017 – 2022 (Tons) 112

TABLE NO. 20. :.. North America Black Rice Market Volume, By Distribution Channel, 2023– 2030 (Tons) 112

TABLE NO. 21. :.. North America Black Rice Market Revenue, By Distribution Channel, 2017 – 2022 (USD Million) 113

TABLE NO. 22. :.. North America Black Rice Market Revenue, By Distribution Channel, 2023– 2030 (USD Million) 113

TABLE NO. 23. :.. North America Black Rice Market Volume, By Species, 2017 – 2022 (Tons) 114

TABLE NO. 24. :.. North America Black Rice Market Volume, By Species, 2023– 2030 (Tons) 114

TABLE NO. 25. :.. North America Black Rice Market Revenue, By Species, 2017 – 2022 (USD Million) 115

TABLE NO. 26. :.. North America Black Rice Market Revenue, By Species, 2023– 2030 (USD Million) 115

TABLE NO. 27. :.. U.S. Black Rice Market Volume, By Application, 2017 – 2022 (Tons) 116

TABLE NO. 28. :.. U.S. Black Rice Market Volume, By Application, 2023– 2030 (Tons) 116

TABLE NO. 29. :.. U.S. Black Rice Market Revenue, By Application, 2017 – 2022 (USD Million) 117

TABLE NO. 30. :.. U.S. Black Rice Market Revenue, By Application, 2023– 2030 (USD Million) 117

TABLE NO. 31. :.. U.S. Black Rice Market Volume, By Distribution Channel, 2017 – 2022 (Tons) 118

TABLE NO. 32. :.. U.S. Black Rice Market Volume, By Distribution Channel, 2023– 2030 (Tons) 118

TABLE NO. 33. :.. U.S. Black Rice Market Revenue, By Distribution Channel, 2017 – 2022 (USD Million) 119

TABLE NO. 34. :.. U.S. Black Rice Market Revenue, By Distribution Channel, 2023– 2030 (USD Million) 119

TABLE NO. 35. :.. U.S. Black Rice Market Volume, By Species, 2017 – 2022 (Tons) 120

TABLE NO. 36. :.. U.S. Black Rice Market Volume, By Species, 2023– 2030 (Tons) 120

TABLE NO. 37. :.. U.S. Black Rice Market Revenue, By Species, 2017 – 2022 (USD Million) 121

TABLE NO. 38. :.. U.S. Black Rice Market Revenue, By Species, 2023– 2030 (USD Million) 121

TABLE NO. 39. :.. Canada Black Rice Market Volume, By Application, 2017 – 2022 (Tons) 122

TABLE NO. 40. :.. Canada Black Rice Market Volume, By Application, 2023– 2030 (Tons) 122

TABLE NO. 41. :.. Canada Black Rice Market Revenue, By Application, 2017 – 2022 (USD Million) 123

TABLE NO. 42. :.. Canada Black Rice Market Revenue, By Application, 2023– 2030 (USD Million) 123

TABLE NO. 43. :.. Canada Black Rice Market Volume, By Distribution Channel, 2017 – 2022 (Tons) 124

TABLE NO. 44. :.. Canada Black Rice Market Volume, By Distribution Channel, 2023– 2030 (Tons) 124

TABLE NO. 45. :.. Canada Black Rice Market Revenue, By Distribution Channel, 2017 – 2022 (USD Million) 125

TABLE NO. 46. :.. Canada Black Rice Market Revenue, By Distribution Channel, 2023– 2030 (USD Million) 125

TABLE NO. 47. :.. Canada Black Rice Market Volume, By Species, 2017 – 2022 (Tons) 126

TABLE NO. 48. :.. Canada Black Rice Market Volume, By Species, 2023– 2030 (Tons) 126

TABLE NO. 49. :.. Canada Black Rice Market Revenue, By Species, 2017 – 2022 (USD Million) 127

TABLE NO. 50. :.. Canada Black Rice Market Revenue, By Species, 2023– 2030 (USD Million) 127

TABLE NO. 51. :.. Mexico Black Rice Market Volume, By Application, 2017 – 2022 (Tons) 128

TABLE NO. 52. :.. Mexico Black Rice Market Volume, By Application, 2023– 2030 (Tons) 128

TABLE NO. 53. :.. Mexico Black Rice Market Revenue, By Application, 2017 – 2022 (USD Million) 129

TABLE NO. 54. :.. Mexico Black Rice Market Revenue, By Application, 2023– 2030 (USD Million) 129

TABLE NO. 55. :.. Mexico Black Rice Market Volume, By Distribution Channel, 2017 – 2022 (Tons) 130

TABLE NO. 56. :.. Mexico Black Rice Market Volume, By Distribution Channel, 2023– 2030 (Tons) 130

TABLE NO. 57. :.. Mexico Black Rice Market Revenue, By Distribution Channel, 2017 – 2022 (USD Million) 131

TABLE NO. 58. :.. Mexico Black Rice Market Revenue, By Distribution Channel, 2023– 2030 (USD Million) 131

TABLE NO. 59. :.. Mexico Black Rice Market Volume, By Species, 2017 – 2022 (Tons) 132

TABLE NO. 60. :.. Mexico Black Rice Market Volume, By Species, 2023– 2030 (Tons) 132

TABLE NO. 61. :.. Mexico Black Rice Market Revenue, By Species, 2017 – 2022 (USD Million) 133

TABLE NO. 62. :.. Mexico Black Rice Market Revenue, By Species, 2023– 2030 (USD Million) 133

TABLE NO. 63. :.. Europe Black Rice Market Volume, By Country, 2017 – 2022 (Tons) 136

TABLE NO. 64. :.. Europe Black Rice Market Volume, By Country, 2023– 2030 (Tons) 136

TABLE NO. 65. :.. Europe Black Rice Market Revenue, By Country, 2017 – 2022 (USD Million) 137

TABLE NO. 66. :.. Europe Black Rice Market Revenue, By Country, 2023– 2030 (USD Million) 137

TABLE NO. 67. :.. Europe Black Rice Market Volume, By Application, 2017 – 2022 (Tons) 138

TABLE NO. 68. :.. Europe Black Rice Market Volume, By Application, 2023– 2030 (Tons) 138

TABLE NO. 69. :.. Europe Black Rice Market Revenue, By Application, 2017 – 2022 (USD Million) 139

TABLE NO. 70. :.. Europe Black Rice Market Revenue, By Application, 2023– 2030 (USD Million) 139

TABLE NO. 71. :.. Europe Black Rice Market Volume, By Distribution Channel, 2017 – 2022 (Tons) 140

TABLE NO. 72. :.. Europe Black Rice Market Volume, By Distribution Channel, 2023– 2030 (Tons) 140

TABLE NO. 73. :.. Europe Black Rice Market Revenue, By Distribution Channel, 2017 – 2022 (USD Million) 141

TABLE NO. 74. :.. Europe Black Rice Market Revenue, By Distribution Channel, 2023– 2030 (USD Million) 141

TABLE NO. 75. :.. Europe Black Rice Market Volume, By Species, 2017 – 2022 (Tons) 142

TABLE NO. 76. :.. Europe Black Rice Market Volume, By Species, 2023– 2030 (Tons) 142

TABLE NO. 77. :.. Europe Black Rice Market Revenue, By Species, 2017 – 2022 (USD Million) 143

TABLE NO. 78. :.. Europe Black Rice Market Revenue, By Species, 2023– 2030 (USD Million) 143

TABLE NO. 79. :.. UK Black Rice Market Volume, By Application, 2017 – 2022 (Tons) 144

TABLE NO. 80. :.. UK Black Rice Market Volume, By Application, 2023– 2030 (Tons) 144

TABLE NO. 81. :.. UK Black Rice Market Revenue, By Application, 2017 – 2022 (USD Million) 145

TABLE NO. 82. :.. UK Black Rice Market Revenue, By Application, 2023– 2030 (USD Million) 145

TABLE NO. 83. :.. UK Black Rice Market Volume, By Distribution Channel, 2017 – 2022 (Tons) 146

TABLE NO. 84. :.. UK Black Rice Market Volume, By Distribution Channel, 2023– 2030 (Tons) 146

TABLE NO. 85. :.. UK Black Rice Market Revenue, By Distribution Channel, 2017 – 2022 (USD Million) 147

TABLE NO. 86. :.. UK Black Rice Market Revenue, By Distribution Channel, 2023– 2030 (USD Million) 147

TABLE NO. 87. :.. UK Black Rice Market Volume, By Species, 2017 – 2022 (Tons) 148

TABLE NO. 88. :.. UK Black Rice Market Volume, By Species, 2023– 2030 (Tons) 148

TABLE NO. 89. :.. UK Black Rice Market Revenue, By Species, 2017 – 2022 (USD Million) 149

TABLE NO. 90. :.. UK Black Rice Market Revenue, By Species, 2023– 2030 (USD Million) 149

TABLE NO. 91. :.. France Black Rice Market Volume, By Application, 2017 – 2022 (Tons) 150

TABLE NO. 92. :.. France Black Rice Market Volume, By Application, 2023– 2030 (Tons) 150

TABLE NO. 93. :.. France Black Rice Market Revenue, By Application, 2017 – 2022 (USD Million) 151

TABLE NO. 94. :.. France Black Rice Market Revenue, By Application, 2023– 2030 (USD Million) 151

TABLE NO. 95. :.. France Black Rice Market Volume, By Distribution Channel, 2017 – 2022 (Tons) 152

TABLE NO. 96. :.. France Black Rice Market Volume, By Distribution Channel, 2023– 2030 (Tons) 152

TABLE NO. 97. :.. France Black Rice Market Revenue, By Distribution Channel, 2017 – 2022 (USD Million) 153

TABLE NO. 98. :.. France Black Rice Market Revenue, By Distribution Channel, 2023– 2030 (USD Million) 153

TABLE NO. 99. :.. France Black Rice Market Volume, By Species, 2017 – 2022 (Tons) 154

TABLE NO. 100. :. France Black Rice Market Volume, By Species, 2023– 2030 (Tons) 154

TABLE NO. 101. :. France Black Rice Market Revenue, By Species, 2017 – 2022 (USD Million) 155

TABLE NO. 102. :. France Black Rice Market Revenue, By Species, 2023– 2030 (USD Million) 155

TABLE NO. 103. :. Germany Black Rice Market Volume, By Application, 2017 – 2022 (Tons) 156

TABLE NO. 104. :. Germany Black Rice Market Volume, By Application, 2023– 2030 (Tons) 156

TABLE NO. 105. :. Germany Black Rice Market Revenue, By Application, 2017 – 2022 (USD Million) 157

TABLE NO. 106. :. Germany Black Rice Market Revenue, By Application, 2023– 2030 (USD Million) 157

TABLE NO. 107. :. Germany Black Rice Market Volume, By Distribution Channel, 2017 – 2022 (Tons) 158

TABLE NO. 108. :. Germany Black Rice Market Volume, By Distribution Channel, 2023– 2030 (Tons) 158

TABLE NO. 109. :. Germany Black Rice Market Revenue, By Distribution Channel, 2017 – 2022 (USD Million) 159

TABLE NO. 110. :. Germany Black Rice Market Revenue, By Distribution Channel, 2023– 2030 (USD Million) 159

TABLE NO. 111. :. Germany Black Rice Market Volume, By Species, 2017 – 2022 (Tons) 160

TABLE NO. 112. :. Germany Black Rice Market Volume, By Species, 2023– 2030 (Tons) 160

TABLE NO. 113. :. Germany Black Rice Market Revenue, By Species, 2017 – 2022 (USD Million) 161

TABLE NO. 114. :. Germany Black Rice Market Revenue, By Species, 2023– 2030 (USD Million) 161

TABLE NO. 115. :. Italy Black Rice Market Volume, By Application, 2017 – 2022 (Tons) 162

TABLE NO. 116. :. Italy Black Rice Market Volume, By Application, 2023– 2030 (Tons) 162

TABLE NO. 117. :. Italy Black Rice Market Revenue, By Application, 2017 – 2022 (USD Million) 163

TABLE NO. 118. :. Italy Black Rice Market Revenue, By Application, 2023– 2030 (USD Million) 163

TABLE NO. 119. :. Italy Black Rice Market Volume, By Distribution Channel, 2017 – 2022 (Tons) 164

TABLE NO. 120. :. Italy Black Rice Market Volume, By Distribution Channel, 2023– 2030 (Tons) 164

TABLE NO. 121. :. Italy Black Rice Market Revenue, By Distribution Channel, 2017 – 2022 (USD Million) 165

TABLE NO. 122. :. Italy Black Rice Market Revenue, By Distribution Channel, 2023– 2030 (USD Million) 165

TABLE NO. 123. :. Italy Black Rice Market Volume, By Species, 2017 – 2022 (Tons) 166

TABLE NO. 124. :. Italy Black Rice Market Volume, By Species, 2023– 2030 (Tons) 166

TABLE NO. 125. :. Italy Black Rice Market Revenue, By Species, 2017 – 2022 (USD Million) 167

TABLE NO. 126. :. Italy Black Rice Market Revenue, By Species, 2023– 2030 (USD Million) 167

TABLE NO. 127. :. Spain Black Rice Market Volume, By Application, 2017 – 2022 (Tons) 168

TABLE NO. 128. :. Spain Black Rice Market Volume, By Application, 2023– 2030 (Tons) 168

TABLE NO. 129. :. Spain Black Rice Market Revenue, By Application, 2017 – 2022 (USD Million) 169

TABLE NO. 130. :. Spain Black Rice Market Revenue, By Application, 2023– 2030 (USD Million) 169

TABLE NO. 131. :. Spain Black Rice Market Volume, By Distribution Channel, 2017 – 2022 (Tons) 170

TABLE NO. 132. :. Spain Black Rice Market Volume, By Distribution Channel, 2023– 2030 (Tons) 170

TABLE NO. 133. :. Spain Black Rice Market Revenue, By Distribution Channel, 2017 – 2022 (USD Million) 171

TABLE NO. 134. :. Spain Black Rice Market Revenue, By Distribution Channel, 2023– 2030 (USD Million) 171

TABLE NO. 135. :. Spain Black Rice Market Volume, By Species, 2017 – 2022 (Tons) 172

TABLE NO. 136. :. Spain Black Rice Market Volume, By Species, 2023– 2030 (Tons) 172

TABLE NO. 137. :. Spain Black Rice Market Revenue, By Species, 2017 – 2022 (USD Million) 173

TABLE NO. 138. :. Spain Black Rice Market Revenue, By Species, 2023– 2030 (USD Million) 173

TABLE NO. 139. :. Russia Black Rice Market Volume, By Application, 2017 – 2022 (Tons) 174

TABLE NO. 140. :. Russia Black Rice Market Volume, By Application, 2023– 2030 (Tons) 174

TABLE NO. 141. :. Russia Black Rice Market Revenue, By Application, 2017 – 2022 (USD Million) 175

TABLE NO. 142. :. Russia Black Rice Market Revenue, By Application, 2023– 2030 (USD Million) 175

TABLE NO. 143. :. Russia Black Rice Market Volume, By Distribution Channel, 2017 – 2022 (Tons) 176

TABLE NO. 144. :. Russia Black Rice Market Volume, By Distribution Channel, 2023– 2030 (Tons) 176

TABLE NO. 145. :. Russia Black Rice Market Revenue, By Distribution Channel, 2017 – 2022 (USD Million) 177

TABLE NO. 146. :. Russia Black Rice Market Revenue, By Distribution Channel, 2023– 2030 (USD Million) 177

TABLE NO. 147. :. Russia Black Rice Market Volume, By Species, 2017 – 2022 (Tons) 178

TABLE NO. 148. :. Russia Black Rice Market Volume, By Species, 2023– 2030 (Tons) 178

TABLE NO. 149. :. Russia Black Rice Market Revenue, By Species, 2017 – 2022 (USD Million) 179

TABLE NO. 150. :. Russia Black Rice Market Revenue, By Species, 2023– 2030 (USD Million) 179

TABLE NO. 151. :. Belgium Black Rice Market Volume, By Application, 2017 – 2022 (Tons) 180

TABLE NO. 152. :. Belgium Black Rice Market Volume, By Application, 2023– 2030 (Tons) 180

TABLE NO. 153. :. Belgium Black Rice Market Revenue, By Application, 2017 – 2022 (USD Million) 181

TABLE NO. 154. :. Belgium Black Rice Market Revenue, By Application, 2023– 2030 (USD Million) 181

TABLE NO. 155. :. Belgium Black Rice Market Volume, By Distribution Channel, 2017 – 2022 (Tons) 182

TABLE NO. 156. :. Belgium Black Rice Market Volume, By Distribution Channel, 2023– 2030 (Tons) 182

TABLE NO. 157. :. Belgium Black Rice Market Revenue, By Distribution Channel, 2017 – 2022 (USD Million) 183

TABLE NO. 158. :. Belgium Black Rice Market Revenue, By Distribution Channel, 2023– 2030 (USD Million) 183

TABLE NO. 159. :. Belgium Black Rice Market Volume, By Species, 2017 – 2022 (Tons) 184

TABLE NO. 160. :. Belgium Black Rice Market Volume, By Species, 2023– 2030 (Tons) 184

TABLE NO. 161. :. Belgium Black Rice Market Revenue, By Species, 2017 – 2022 (USD Million) 185

TABLE NO. 162. :. Belgium Black Rice Market Revenue, By Species, 2023– 2030 (USD Million) 185

TABLE NO. 163. :. Netherland Black Rice Market Volume, By Application, 2017 – 2022 (Tons) 186

TABLE NO. 164. :. Netherland Black Rice Market Volume, By Application, 2023– 2030 (Tons) 186

TABLE NO. 165. :. Netherland Black Rice Market Revenue, By Application, 2017 – 2022 (USD Million) 187

TABLE NO. 166. :. Netherland Black Rice Market Revenue, By Application, 2023– 2030 (USD Million) 187

TABLE NO. 167. :. Netherland Black Rice Market Volume, By Distribution Channel, 2017 – 2022 (Tons) 188

TABLE NO. 168. :. Netherland Black Rice Market Volume, By Distribution Channel, 2023– 2030 (Tons) 188

TABLE NO. 169. :. Netherland Black Rice Market Revenue, By Distribution Channel, 2017 – 2022 (USD Million) 189

TABLE NO. 170. :. Netherland Black Rice Market Revenue, By Distribution Channel, 2023– 2030 (USD Million) 189

TABLE NO. 171. :. Netherland Black Rice Market Volume, By Species, 2017 – 2022 (Tons) 190

TABLE NO. 172. :. Netherland Black Rice Market Volume, By Species, 2023– 2030 (Tons) 190

TABLE NO. 173. :. Netherland Black Rice Market Revenue, By Species, 2017 – 2022 (USD Million) 191

TABLE NO. 174. :. Netherland Black Rice Market Revenue, By Species, 2023– 2030 (USD Million) 191

TABLE NO. 175. :. Austria Black Rice Market Volume, By Application, 2017 – 2022 (Tons) 192

TABLE NO. 176. :. Austria Black Rice Market Volume, By Application, 2023– 2030 (Tons) 192

TABLE NO. 177. :. Austria Black Rice Market Revenue, By Application, 2017 – 2022 (USD Million) 193

TABLE NO. 178. :. Austria Black Rice Market Revenue, By Application, 2023– 2030 (USD Million) 193

TABLE NO. 179. :. Austria Black Rice Market Volume, By Distribution Channel, 2017 – 2022 (Tons) 194

TABLE NO. 180. :. Austria Black Rice Market Volume, By Distribution Channel, 2023– 2030 (Tons) 194

TABLE NO. 181. :. Austria Black Rice Market Revenue, By Distribution Channel, 2017 – 2022 (USD Million) 195

TABLE NO. 182. :. Austria Black Rice Market Revenue, By Distribution Channel, 2023– 2030 (USD Million) 195

TABLE NO. 183. :. Austria Black Rice Market Volume, By Species, 2017 – 2022 (Tons) 196

TABLE NO. 184. :. Austria Black Rice Market Volume, By Species, 2023– 2030 (Tons) 196

TABLE NO. 185. :. Austria Black Rice Market Revenue, By Species, 2017 – 2022 (USD Million) 197

TABLE NO. 186. :. Austria Black Rice Market Revenue, By Species, 2023– 2030 (USD Million) 197

TABLE NO. 187. :. Sweden Black Rice Market Volume, By Application, 2017 – 2022 (Tons) 198

TABLE NO. 188. :. Sweden Black Rice Market Volume, By Application, 2023– 2030 (Tons) 198

TABLE NO. 189. :. Sweden Black Rice Market Revenue, By Application, 2017 – 2022 (USD Million) 199

TABLE NO. 190. :. Sweden Black Rice Market Revenue, By Application, 2023– 2030 (USD Million) 199

TABLE NO. 191. :. Sweden Black Rice Market Volume, By Distribution Channel, 2017 – 2022 (Tons) 200

TABLE NO. 192. :. Sweden Black Rice Market Volume, By Distribution Channel, 2023– 2030 (Tons) 200

TABLE NO. 193. :. Sweden Black Rice Market Revenue, By Distribution Channel, 2017 – 2022 (USD Million) 201

TABLE NO. 194. :. Sweden Black Rice Market Revenue, By Distribution Channel, 2023– 2030 (USD Million) 201

TABLE NO. 195. :. Sweden Black Rice Market Volume, By Species, 2017 – 2022 (Tons) 202

TABLE NO. 196. :. Sweden Black Rice Market Volume, By Species, 2023– 2030 (Tons) 202

TABLE NO. 197. :. Sweden Black Rice Market Revenue, By Species, 2017 – 2022 (USD Million) 203

TABLE NO. 198. :. Sweden Black Rice Market Revenue, By Species, 2023– 2030 (USD Million) 203

TABLE NO. 199. :. Poland Black Rice Market Volume, By Application, 2017 – 2022 (Tons) 204

TABLE NO. 200. :. Poland Black Rice Market Volume, By Application, 2023– 2030 (Tons) 204

TABLE NO. 201. :. Poland Black Rice Market Revenue, By Application, 2017 – 2022 (USD Million) 205

TABLE NO. 202. :. Poland Black Rice Market Revenue, By Application, 2023– 2030 (USD Million) 205

TABLE NO. 203. :. Poland Black Rice Market Volume, By Distribution Channel, 2017 – 2022 (Tons) 206

TABLE NO. 204. :. Poland Black Rice Market Volume, By Distribution Channel, 2023– 2030 (Tons) 206

TABLE NO. 205. :. Poland Black Rice Market Revenue, By Distribution Channel, 2017 – 2022 (USD Million) 207

TABLE NO. 206. :. Poland Black Rice Market Revenue, By Distribution Channel, 2023– 2030 (USD Million) 207

TABLE NO. 207. :. Poland Black Rice Market Volume, By Species, 2017 – 2022 (Tons) 208

TABLE NO. 208. :. Poland Black Rice Market Volume, By Species, 2023– 2030 (Tons) 208

TABLE NO. 209. :. Poland Black Rice Market Revenue, By Species, 2017 – 2022 (USD Million) 209

TABLE NO. 210. :. Poland Black Rice Market Revenue, By Species, 2023– 2030 (USD Million) 209

TABLE NO. 211. :. Denmark Black Rice Market Volume, By Application, 2017 – 2022 (Tons) 210

TABLE NO. 212. :. Denmark Black Rice Market Volume, By Application, 2023– 2030 (Tons) 210

TABLE NO. 213. :. Denmark Black Rice Market Revenue, By Application, 2017 – 2022 (USD Million) 211

TABLE NO. 214. :. Denmark Black Rice Market Revenue, By Application, 2023– 2030 (USD Million) 211

TABLE NO. 215. :. Denmark Black Rice Market Volume, By Distribution Channel, 2017 – 2022 (Tons) 212

TABLE NO. 216. :. Denmark Black Rice Market Volume, By Distribution Channel, 2023– 2030 (Tons) 212

TABLE NO. 217. :. Denmark Black Rice Market Revenue, By Distribution Channel, 2017 – 2022 (USD Million) 213

TABLE NO. 218. :. Denmark Black Rice Market Revenue, By Distribution Channel, 2023– 2030 (USD Million) 213

TABLE NO. 219. :. Denmark Black Rice Market Volume, By Species, 2017 – 2022 (Tons) 214

TABLE NO. 220. :. Denmark Black Rice Market Volume, By Species, 2023– 2030 (Tons) 214

TABLE NO. 221. :. Denmark Black Rice Market Revenue, By Species, 2017 – 2022 (USD Million) 215

TABLE NO. 222. :. Denmark Black Rice Market Revenue, By Species, 2023– 2030 (USD Million) 215

TABLE NO. 223. :. Switzerland Black Rice Market Volume, By Application, 2017 – 2022 (Tons) 216

TABLE NO. 224. :. Switzerland Black Rice Market Volume, By Application, 2023– 2030 (Tons) 216

TABLE NO. 225. :. Switzerland Black Rice Market Revenue, By Application, 2017 – 2022 (USD Million) 217

TABLE NO. 226. :. Switzerland Black Rice Market Revenue, By Application, 2023– 2030 (USD Million) 217

TABLE NO. 227. :. Switzerland Black Rice Market Volume, By Distribution Channel, 2017 – 2022 (Tons) 218

TABLE NO. 228. :. Switzerland Black Rice Market Volume, By Distribution Channel, 2023– 2030 (Tons) 218

TABLE NO. 229. :. Switzerland Black Rice Market Revenue, By Distribution Channel, 2017 – 2022 (USD Million) 219

TABLE NO. 230. :. Switzerland Black Rice Market Revenue, By Distribution Channel, 2023– 2030 (USD Million) 219

TABLE NO. 231. :. Switzerland Black Rice Market Volume, By Species, 2017 – 2022 (Tons) 220

TABLE NO. 232. :. Switzerland Black Rice Market Volume, By Species, 2023– 2030 (Tons) 220

TABLE NO. 233. :. Switzerland Black Rice Market Revenue, By Species, 2017 – 2022 (USD Million) 221

TABLE NO. 234. :. Switzerland Black Rice Market Revenue, By Species, 2023– 2030 (USD Million) 221

TABLE NO. 235. :. Rest of Europe Black Rice Market Volume, By Application, 2017 – 2022 (Tons) 222

TABLE NO. 236. :. Rest of Europe Black Rice Market Volume, By Application, 2023– 2030 (Tons) 222

TABLE NO. 237. :. Rest of Europe Black Rice Market Revenue, By Application, 2017 – 2022 (USD Million) 223

TABLE NO. 238. :. Rest of Europe Black Rice Market Revenue, By Application, 2023– 2030 (USD Million) 223

TABLE NO. 239. :. Rest of Europe Black Rice Market Volume, By Distribution Channel, 2017 – 2022 (Tons) 224

TABLE NO. 240. :. Rest of Europe Black Rice Market Volume, By Distribution Channel, 2023– 2030 (Tons) 224

TABLE NO. 241. :. Rest of Europe Black Rice Market Revenue, By Distribution Channel, 2017 – 2022 (USD Million) 225

TABLE NO. 242. :. Rest of Europe Black Rice Market Revenue, By Distribution Channel, 2023– 2030 (USD Million) 225

TABLE NO. 243. :. Rest of Europe Black Rice Market Volume, By Species, 2017 – 2022 (Tons) 226

TABLE NO. 244. :. Rest of Europe Black Rice Market Volume, By Species, 2023– 2030 (Tons) 226

TABLE NO. 245. :. Rest of Europe Black Rice Market Revenue, By Species, 2017 – 2022 (USD Million) 227

TABLE NO. 246. :. Rest of Europe Black Rice Market Revenue, By Species, 2023– 2030 (USD Million) 227

TABLE NO. 247. :. Asia Pacific Black Rice Market Volume, By Country, 2017 – 2022 (Tons) 230

TABLE NO. 248. :. Asia Pacific Black Rice Market Volume, By Country, 2023– 2030 (Tons) 230

TABLE NO. 249. :. Asia Pacific Black Rice Market Revenue, By Country, 2017 – 2022 (USD Million) 231

TABLE NO. 250. :. Asia Pacific Black Rice Market Revenue, By Country, 2023– 2030 (USD Million) 231

TABLE NO. 251. :. Asia Pacific Black Rice Market Volume, By Application, 2017 – 2022 (Tons) 232

TABLE NO. 252. :. Asia Pacific Black Rice Market Volume, By Application, 2023– 2030 (Tons) 232

TABLE NO. 253. :. Asia Pacific Black Rice Market Revenue, By Application, 2017 – 2022 (USD Million) 233

TABLE NO. 254. :. Asia Pacific Black Rice Market Revenue, By Application, 2023– 2030 (USD Million) 233

TABLE NO. 255. :. Asia Pacific Black Rice Market Volume, By Distribution Channel, 2017 – 2022 (Tons) 234

TABLE NO. 256. :. Asia Pacific Black Rice Market Volume, By Distribution Channel, 2023– 2030 (Tons) 234

TABLE NO. 257. :. Asia Pacific Black Rice Market Revenue, By Distribution Channel, 2017 – 2022 (USD Million) 235

TABLE NO. 258. :. Asia Pacific Black Rice Market Revenue, By Distribution Channel, 2023– 2030 (USD Million) 235

TABLE NO. 259. :. Asia Pacific Black Rice Market Volume, By Species, 2017 – 2022 (Tons) 236

TABLE NO. 260. :. Asia Pacific Black Rice Market Volume, By Species, 2023– 2030 (Tons) 236

TABLE NO. 261. :. Asia Pacific Black Rice Market Revenue, By Species, 2017 – 2022 (USD Million) 237

TABLE NO. 262. :. Asia Pacific Black Rice Market Revenue, By Species, 2023– 2030 (USD Million) 237

TABLE NO. 263. :. China Black Rice Market Volume, By Application, 2017 – 2022 (Tons) 238

TABLE NO. 264. :. China Black Rice Market Volume, By Application, 2023– 2030 (Tons) 238

TABLE NO. 265. :. China Black Rice Market Revenue, By Application, 2017 – 2022 (USD Million) 239

TABLE NO. 266. :. China Black Rice Market Revenue, By Application, 2023– 2030 (USD Million) 239

TABLE NO. 267. :. China Black Rice Market Volume, By Distribution Channel, 2017 – 2022 (Tons) 240

TABLE NO. 268. :. China Black Rice Market Volume, By Distribution Channel, 2023– 2030 (Tons) 240

TABLE NO. 269. :. China Black Rice Market Revenue, By Distribution Channel, 2017 – 2022 (USD Million) 241

TABLE NO. 270. :. China Black Rice Market Revenue, By Distribution Channel, 2023– 2030 (USD Million) 241

TABLE NO. 271. :. China Black Rice Market Volume, By Species, 2017 – 2022 (Tons) 242

TABLE NO. 272. :. China Black Rice Market Volume, By Species, 2023– 2030 (Tons) 242

TABLE NO. 273. :. China Black Rice Market Revenue, By Species, 2017 – 2022 (USD Million) 243

TABLE NO. 274. :. China Black Rice Market Revenue, By Species, 2023– 2030 (USD Million) 243

TABLE NO. 275. :. Japan Black Rice Market Volume, By Application, 2017 – 2022 (Tons) 244

TABLE NO. 276. :. Japan Black Rice Market Volume, By Application, 2023– 2030 (Tons) 244

TABLE NO. 277. :. Japan Black Rice Market Revenue, By Application, 2017 – 2022 (USD Million) 245

TABLE NO. 278. :. Japan Black Rice Market Revenue, By Application, 2023– 2030 (USD Million) 245

TABLE NO. 279. :. Japan Black Rice Market Volume, By Distribution Channel, 2017 – 2022 (Tons) 246

TABLE NO. 280. :. Japan Black Rice Market Volume, By Distribution Channel, 2023– 2030 (Tons) 246

TABLE NO. 281. :. Japan Black Rice Market Revenue, By Distribution Channel, 2017 – 2022 (USD Million) 247

TABLE NO. 282. :. Japan Black Rice Market Revenue, By Distribution Channel, 2023– 2030 (USD Million) 247

TABLE NO. 283. :. Japan Black Rice Market Volume, By Species, 2017 – 2022 (Tons) 248

TABLE NO. 284. :. Japan Black Rice Market Volume, By Species, 2023– 2030 (Tons) 248

TABLE NO. 285. :. Japan Black Rice Market Revenue, By Species, 2017 – 2022 (USD Million) 249

TABLE NO. 286. :. Japan Black Rice Market Revenue, By Species, 2023– 2030 (USD Million) 249

TABLE NO. 287. :. South Korea Black Rice Market Volume, By Application, 2017 – 2022 (Tons) 250

TABLE NO. 288. :. South Korea Black Rice Market Volume, By Application, 2023– 2030 (Tons) 250

TABLE NO. 289. :. South Korea Black Rice Market Revenue, By Application, 2017 – 2022 (USD Million) 251

TABLE NO. 290. :. South Korea Black Rice Market Revenue, By Application, 2023– 2030 (USD Million) 251

TABLE NO. 291. :. South Korea Black Rice Market Volume, By Distribution Channel, 2017 – 2022 (Tons) 252

TABLE NO. 292. :. South Korea Black Rice Market Volume, By Distribution Channel, 2023– 2030 (Tons) 252

TABLE NO. 293. :. South Korea Black Rice Market Revenue, By Distribution Channel, 2017 – 2022 (USD Million) 253

TABLE NO. 294. :. South Korea Black Rice Market Revenue, By Distribution Channel, 2023– 2030 (USD Million) 253

TABLE NO. 295. :. South Korea Black Rice Market Volume, By Species, 2017 – 2022 (Tons) 254

TABLE NO. 296. :. South Korea Black Rice Market Volume, By Species, 2023– 2030 (Tons) 254

TABLE NO. 297. :. South Korea Black Rice Market Revenue, By Species, 2017 – 2022 (USD Million) 255

TABLE NO. 298. :. South Korea Black Rice Market Revenue, By Species, 2023– 2030 (USD Million) 255

TABLE NO. 299. :. India Black Rice Market Volume, By Application, 2017 – 2022 (Tons) 256

TABLE NO. 300. :. India Black Rice Market Volume, By Application, 2023– 2030 (Tons) 256

TABLE NO. 301. :. India Black Rice Market Revenue, By Application, 2017 – 2022 (USD Million) 257

TABLE NO. 302. :. India Black Rice Market Revenue, By Application, 2023– 2030 (USD Million) 257

TABLE NO. 303. :. India Black Rice Market Volume, By Distribution Channel, 2017 – 2022 (Tons) 258

TABLE NO. 304. :. India Black Rice Market Volume, By Distribution Channel, 2023– 2030 (Tons) 258

TABLE NO. 305. :. India Black Rice Market Revenue, By Distribution Channel, 2017 – 2022 (USD Million) 259

TABLE NO. 306. :. India Black Rice Market Revenue, By Distribution Channel, 2023– 2030 (USD Million) 259

TABLE NO. 307. :. India Black Rice Market Volume, By Species, 2017 – 2022 (Tons) 260

TABLE NO. 308. :. India Black Rice Market Volume, By Species, 2023– 2030 (Tons) 260

TABLE NO. 309. :. India Black Rice Market Revenue, By Species, 2017 – 2022 (USD Million) 261

TABLE NO. 310. :. India Black Rice Market Revenue, By Species, 2023– 2030 (USD Million) 261

TABLE NO. 311. :. Australia Black Rice Market Volume, By Application, 2017 – 2022 (Tons) 262

TABLE NO. 312. :. Australia Black Rice Market Volume, By Application, 2023– 2030 (Tons) 262

TABLE NO. 313. :. Australia Black Rice Market Revenue, By Application, 2017 – 2022 (USD Million) 263

TABLE NO. 314. :. Australia Black Rice Market Revenue, By Application, 2023– 2030 (USD Million) 263

TABLE NO. 315. :. Australia Black Rice Market Volume, By Distribution Channel, 2017 – 2022 (Tons) 264

TABLE NO. 316. :. Australia Black Rice Market Volume, By Distribution Channel, 2023– 2030 (Tons) 264

TABLE NO. 317. :. Australia Black Rice Market Revenue, By Distribution Channel, 2017 – 2022 (USD Million) 265

TABLE NO. 318. :. Australia Black Rice Market Revenue, By Distribution Channel, 2023– 2030 (USD Million) 265

TABLE NO. 319. :. Australia Black Rice Market Volume, By Species, 2017 – 2022 (Tons) 266

TABLE NO. 320. :. Australia Black Rice Market Volume, By Species, 2023– 2030 (Tons) 266

TABLE NO. 321. :. Australia Black Rice Market Revenue, By Species, 2017 – 2022 (USD Million) 267

TABLE NO. 322. :. Australia Black Rice Market Revenue, By Species, 2023– 2030 (USD Million) 267

TABLE NO. 323. :. Thailand Black Rice Market Volume, By Application, 2017 – 2022 (Tons) 268

TABLE NO. 324. :. Thailand Black Rice Market Volume, By Application, 2023– 2030 (Tons) 268

TABLE NO. 325. :. Thailand Black Rice Market Revenue, By Application, 2017 – 2022 (USD Million) 269

TABLE NO. 326. :. Thailand Black Rice Market Revenue, By Application, 2023– 2030 (USD Million) 269

TABLE NO. 327. :. Thailand Black Rice Market Volume, By Distribution Channel, 2017 – 2022 (Tons) 270

TABLE NO. 328. :. Thailand Black Rice Market Volume, By Distribution Channel, 2023– 2030 (Tons) 270

TABLE NO. 329. :. Thailand Black Rice Market Revenue, By Distribution Channel, 2017 – 2022 (USD Million) 271

TABLE NO. 330. :. Thailand Black Rice Market Revenue, By Distribution Channel, 2023– 2030 (USD Million) 271

TABLE NO. 331. :. Thailand Black Rice Market Volume, By Species, 2017 – 2022 (Tons) 272

TABLE NO. 332. :. Thailand Black Rice Market Volume, By Species, 2023– 2030 (Tons) 272

TABLE NO. 333. :. Thailand Black Rice Market Revenue, By Species, 2017 – 2022 (USD Million) 273

TABLE NO. 334. :. Thailand Black Rice Market Revenue, By Species, 2023– 2030 (USD Million) 273

TABLE NO. 335. :. Indonesia Black Rice Market Volume, By Application, 2017 – 2022 (Tons) 274

TABLE NO. 336. :. Indonesia Black Rice Market Volume, By Application, 2023– 2030 (Tons) 274

TABLE NO. 337. :. Indonesia Black Rice Market Revenue, By Application, 2017 – 2022 (USD Million) 275

TABLE NO. 338. :. Indonesia Black Rice Market Revenue, By Application, 2023– 2030 (USD Million) 275

TABLE NO. 339. :. Indonesia Black Rice Market Volume, By Distribution Channel, 2017 – 2022 (Tons) 276

TABLE NO. 340. :. Indonesia Black Rice Market Volume, By Distribution Channel, 2023– 2030 (Tons) 276

TABLE NO. 341. :. Indonesia Black Rice Market Revenue, By Distribution Channel, 2017 – 2022 (USD Million) 277

TABLE NO. 342. :. Indonesia Black Rice Market Revenue, By Distribution Channel, 2023– 2030 (USD Million) 277

TABLE NO. 343. :. Indonesia Black Rice Market Volume, By Species, 2017 – 2022 (Tons) 278

TABLE NO. 344. :. Indonesia Black Rice Market Volume, By Species, 2023– 2030 (Tons) 278

TABLE NO. 345. :. Indonesia Black Rice Market Revenue, By Species, 2017 – 2022 (USD Million) 279

TABLE NO. 346. :. Indonesia Black Rice Market Revenue, By Species, 2023– 2030 (USD Million) 279

TABLE NO. 347. :. Vietnam Black Rice Market Volume, By Application, 2017 – 2022 (Tons) 280

TABLE NO. 348. :. Vietnam Black Rice Market Volume, By Application, 2023– 2030 (Tons) 280

TABLE NO. 349. :. Vietnam Black Rice Market Revenue, By Application, 2017 – 2022 (USD Million) 281

TABLE NO. 350. :. Vietnam Black Rice Market Revenue, By Application, 2023– 2030 (USD Million) 281

TABLE NO. 351. :. Vietnam Black Rice Market Volume, By Distribution Channel, 2017 – 2022 (Tons) 282

TABLE NO. 352. :. Vietnam Black Rice Market Volume, By Distribution Channel, 2023– 2030 (Tons) 282

TABLE NO. 353. :. Vietnam Black Rice Market Revenue, By Distribution Channel, 2017 – 2022 (USD Million) 283

TABLE NO. 354. :. Vietnam Black Rice Market Revenue, By Distribution Channel, 2023– 2030 (USD Million) 283

TABLE NO. 355. :. Vietnam Black Rice Market Volume, By Species, 2017 – 2022 (Tons) 284

TABLE NO. 356. :. Vietnam Black Rice Market Volume, By Species, 2023– 2030 (Tons) 284

TABLE NO. 357. :. Vietnam Black Rice Market Revenue, By Species, 2017 – 2022 (USD Million) 285

TABLE NO. 358. :. Vietnam Black Rice Market Revenue, By Species, 2023– 2030 (USD Million) 285

TABLE NO. 359. :. Malaysia Black Rice Market Volume, By Application, 2017 – 2022 (Tons) 286

TABLE NO. 360. :. Malaysia Black Rice Market Volume, By Application, 2023– 2030 (Tons) 286

TABLE NO. 361. :. Malaysia Black Rice Market Revenue, By Application, 2017 – 2022 (USD Million) 287

TABLE NO. 362. :. Malaysia Black Rice Market Revenue, By Application, 2023– 2030 (USD Million) 287

TABLE NO. 363. :. Malaysia Black Rice Market Volume, By Distribution Channel, 2017 – 2022 (Tons) 288

TABLE NO. 364. :. Malaysia Black Rice Market Volume, By Distribution Channel, 2023– 2030 (Tons) 288

TABLE NO. 365. :. Malaysia Black Rice Market Revenue, By Distribution Channel, 2017 – 2022 (USD Million) 289

TABLE NO. 366. :. Malaysia Black Rice Market Revenue, By Distribution Channel, 2023– 2030 (USD Million) 289

TABLE NO. 367. :. Malaysia Black Rice Market Volume, By Species, 2017 – 2022 (Tons) 290

TABLE NO. 368. :. Malaysia Black Rice Market Volume, By Species, 2023– 2030 (Tons) 290

TABLE NO. 369. :. Malaysia Black Rice Market Revenue, By Species, 2017 – 2022 (USD Million) 291

TABLE NO. 370. :. Malaysia Black Rice Market Revenue, By Species, 2023– 2030 (USD Million) 291

TABLE NO. 371. :. Philippines Black Rice Market Volume, By Application, 2017 – 2022 (Tons) 292

TABLE NO. 372. :. Philippines Black Rice Market Volume, By Application, 2023– 2030 (Tons) 292

TABLE NO. 373. :. Philippines Black Rice Market Revenue, By Application, 2017 – 2022 (USD Million) 293

TABLE NO. 374. :. Philippines Black Rice Market Revenue, By Application, 2023– 2030 (USD Million) 293

TABLE NO. 375. :. Philippines Black Rice Market Volume, By Distribution Channel, 2017 – 2022 (Tons) 294

TABLE NO. 376. :. Philippines Black Rice Market Volume, By Distribution Channel, 2023– 2030 (Tons) 294

TABLE NO. 377. :. Philippines Black Rice Market Revenue, By Distribution Channel, 2017 – 2022 (USD Million) 295

TABLE NO. 378. :. Philippines Black Rice Market Revenue, By Distribution Channel, 2023– 2030 (USD Million) 295

TABLE NO. 379. :. Philippines Black Rice Market Volume, By Species, 2017 – 2022 (Tons) 296

TABLE NO. 380. :. Philippines Black Rice Market Volume, By Species, 2023– 2030 (Tons) 296

TABLE NO. 381. :. Philippines Black Rice Market Revenue, By Species, 2017 – 2022 (USD Million) 297

TABLE NO. 382. :. Philippines Black Rice Market Revenue, By Species, 2023– 2030 (USD Million) 297

TABLE NO. 383. :. Taiwan Black Rice Market Volume, By Application, 2017 – 2022 (Tons) 298

TABLE NO. 384. :. Taiwan Black Rice Market Volume, By Application, 2023– 2030 (Tons) 298

TABLE NO. 385. :. Taiwan Black Rice Market Revenue, By Application, 2017 – 2022 (USD Million) 299

TABLE NO. 386. :. Taiwan Black Rice Market Revenue, By Application, 2023– 2030 (USD Million) 299

TABLE NO. 387. :. Taiwan Black Rice Market Volume, By Distribution Channel, 2017 – 2022 (Tons) 300

TABLE NO. 388. :. Taiwan Black Rice Market Volume, By Distribution Channel, 2023– 2030 (Tons) 300

TABLE NO. 389. :. Taiwan Black Rice Market Revenue, By Distribution Channel, 2017 – 2022 (USD Million) 301

TABLE NO. 390. :. Taiwan Black Rice Market Revenue, By Distribution Channel, 2023– 2030 (USD Million) 301

TABLE NO. 391. :. Taiwan Black Rice Market Volume, By Species, 2017 – 2022 (Tons) 302

TABLE NO. 392. :. Taiwan Black Rice Market Volume, By Species, 2023– 2030 (Tons) 302

TABLE NO. 393. :. Taiwan Black Rice Market Revenue, By Species, 2017 – 2022 (USD Million) 303

TABLE NO. 394. :. Taiwan Black Rice Market Revenue, By Species, 2023– 2030 (USD Million) 303

TABLE NO. 395. :. Rest of Asia Pacific Black Rice Market Volume, By Application, 2017 – 2022 (Tons) 304

TABLE NO. 396. :. Rest of Asia Pacific Black Rice Market Volume, By Application, 2023– 2030 (Tons) 304

TABLE NO. 397. :. Rest of Asia Pacific Black Rice Market Revenue, By Application, 2017 – 2022 (USD Million) 305

TABLE NO. 398. :. Rest of Asia Pacific Black Rice Market Revenue, By Application, 2023– 2030 (USD Million) 305

TABLE NO. 399. :. Rest of Asia Pacific Black Rice Market Volume, By Distribution Channel, 2017 – 2022 (Tons) 306

TABLE NO. 400. :. Rest of Asia Pacific Black Rice Market Volume, By Distribution Channel, 2023– 2030 (Tons) 306

TABLE NO. 401. :. Rest of Asia Pacific Black Rice Market Revenue, By Distribution Channel, 2017 – 2022 (USD Million) 307

TABLE NO. 402. :. Rest of Asia Pacific Black Rice Market Revenue, By Distribution Channel, 2023– 2030 (USD Million) 307

TABLE NO. 403. :. Rest of Asia Pacific Black Rice Market Volume, By Species, 2017 – 2022 (Tons) 308

TABLE NO. 404. :. Rest of Asia Pacific Black Rice Market Volume, By Species, 2023– 2030 (Tons) 308

TABLE NO. 405. :. Rest of Asia Pacific Black Rice Market Revenue, By Species, 2017 – 2022 (USD Million) 309

TABLE NO. 406. :. Rest of Asia Pacific Black Rice Market Revenue, By Species, 2023– 2030 (USD Million) 309

TABLE NO. 407. :. Latin America Black Rice Market Volume, By Country, 2017 – 2022 (Tons) 312

TABLE NO. 408. :. Latin America Black Rice Market Volume, By Country, 2023– 2030 (Tons) 312

TABLE NO. 409. :. Latin America Black Rice Market Revenue, By Country, 2017 – 2022 (USD Million) 313

TABLE NO. 410. :. Latin America Black Rice Market Revenue, By Country, 2023– 2030 (USD Million) 313

TABLE NO. 411. :. Latin America Black Rice Market Volume, By Application, 2017 – 2022 (Tons) 314

TABLE NO. 412. :. Latin America Black Rice Market Volume, By Application, 2023– 2030 (Tons) 314

TABLE NO. 413. :. Latin America Black Rice Market Revenue, By Application, 2017 – 2022 (USD Million) 315

TABLE NO. 414. :. Latin America Black Rice Market Revenue, By Application, 2023– 2030 (USD Million) 315

TABLE NO. 415. :. Latin America Black Rice Market Volume, By Distribution Channel, 2017 – 2022 (Tons) 316

TABLE NO. 416. :. Latin America Black Rice Market Volume, By Distribution Channel, 2023– 2030 (Tons) 316

TABLE NO. 417. :. Latin America Black Rice Market Revenue, By Distribution Channel, 2017 – 2022 (USD Million) 317

TABLE NO. 418. :. Latin America Black Rice Market Revenue, By Distribution Channel, 2023– 2030 (USD Million) 317

TABLE NO. 419. :. Latin America Black Rice Market Volume, By Species, 2017 – 2022 (Tons) 318

TABLE NO. 420. :. Latin America Black Rice Market Volume, By Species, 2023– 2030 (Tons) 318

TABLE NO. 421. :. Latin America Black Rice Market Revenue, By Species, 2017 – 2022 (USD Million) 319

TABLE NO. 422. :. Latin America Black Rice Market Revenue, By Species, 2023– 2030 (USD Million) 319

TABLE NO. 423. :. Brazil Black Rice Market Volume, By Application, 2017 – 2022 (Tons) 320

TABLE NO. 424. :. Brazil Black Rice Market Volume, By Application, 2023– 2030 (Tons) 320

TABLE NO. 425. :. Brazil Black Rice Market Revenue, By Application, 2017 – 2022 (USD Million) 321

TABLE NO. 426. :. Brazil Black Rice Market Revenue, By Application, 2023– 2030 (USD Million) 321

TABLE NO. 427. :. Brazil Black Rice Market Volume, By Distribution Channel, 2017 – 2022 (Tons) 322

TABLE NO. 428. :. Brazil Black Rice Market Volume, By Distribution Channel, 2023– 2030 (Tons) 322

TABLE NO. 429. :. Brazil Black Rice Market Revenue, By Distribution Channel, 2017 – 2022 (USD Million) 323

TABLE NO. 430. :. Brazil Black Rice Market Revenue, By Distribution Channel, 2023– 2030 (USD Million) 323

TABLE NO. 431. :. Brazil Black Rice Market Volume, By Species, 2017 – 2022 (Tons) 324

TABLE NO. 432. :. Brazil Black Rice Market Volume, By Species, 2023– 2030 (Tons) 324

TABLE NO. 433. :. Brazil Black Rice Market Revenue, By Species, 2017 – 2022 (USD Million) 325

TABLE NO. 434. :. Brazil Black Rice Market Revenue, By Species, 2023– 2030 (USD Million) 325

TABLE NO. 435. :. Argentina Black Rice Market Volume, By Application, 2017 – 2022 (Tons) 326

TABLE NO. 436. :. Argentina Black Rice Market Volume, By Application, 2023– 2030 (Tons) 326

TABLE NO. 437. :. Argentina Black Rice Market Revenue, By Application, 2017 – 2022 (USD Million) 327

TABLE NO. 438. :. Argentina Black Rice Market Revenue, By Application, 2023– 2030 (USD Million) 327

TABLE NO. 439. :. Argentina Black Rice Market Volume, By Distribution Channel, 2017 – 2022 (Tons) 328

TABLE NO. 440. :. Argentina Black Rice Market Volume, By Distribution Channel, 2023– 2030 (Tons) 328

TABLE NO. 441. :. Argentina Black Rice Market Revenue, By Distribution Channel, 2017 – 2022 (USD Million) 329

TABLE NO. 442. :. Argentina Black Rice Market Revenue, By Distribution Channel, 2023– 2030 (USD Million) 329

TABLE NO. 443. :. Argentina Black Rice Market Volume, By Species, 2017 – 2022 (Tons) 330

TABLE NO. 444. :. Argentina Black Rice Market Volume, By Species, 2023– 2030 (Tons) 330

TABLE NO. 445. :. Argentina Black Rice Market Revenue, By Species, 2017 – 2022 (USD Million) 331

TABLE NO. 446. :. Argentina Black Rice Market Revenue, By Species, 2023– 2030 (USD Million) 331

TABLE NO. 447. :. Peru Black Rice Market Volume, By Application, 2017 – 2022 (Tons) 332

TABLE NO. 448. :. Peru Black Rice Market Volume, By Application, 2023– 2030 (Tons) 332

TABLE NO. 449. :. Peru Black Rice Market Revenue, By Application, 2017 – 2022 (USD Million) 333

TABLE NO. 450. :. Peru Black Rice Market Revenue, By Application, 2023– 2030 (USD Million) 333

TABLE NO. 451. :. Peru Black Rice Market Volume, By Distribution Channel, 2017 – 2022 (Tons) 334

TABLE NO. 452. :. Peru Black Rice Market Volume, By Distribution Channel, 2023– 2030 (Tons) 334

TABLE NO. 453. :. Peru Black Rice Market Revenue, By Distribution Channel, 2017 – 2022 (USD Million) 335

TABLE NO. 454. :. Peru Black Rice Market Revenue, By Distribution Channel, 2023– 2030 (USD Million) 335

TABLE NO. 455. :. Peru Black Rice Market Volume, By Species, 2017 – 2022 (Tons) 336

TABLE NO. 456. :. Peru Black Rice Market Volume, By Species, 2023– 2030 (Tons) 336

TABLE NO. 457. :. Peru Black Rice Market Revenue, By Species, 2017 – 2022 (USD Million) 337

TABLE NO. 458. :. Peru Black Rice Market Revenue, By Species, 2023– 2030 (USD Million) 337

TABLE NO. 459. :. Chile Black Rice Market Volume, By Application, 2017 – 2022 (Tons) 338

TABLE NO. 460. :. Chile Black Rice Market Volume, By Application, 2023– 2030 (Tons) 338

TABLE NO. 461. :. Chile Black Rice Market Revenue, By Application, 2017 – 2022 (USD Million) 339

TABLE NO. 462. :. Chile Black Rice Market Revenue, By Application, 2023– 2030 (USD Million) 339

TABLE NO. 463. :. Chile Black Rice Market Volume, By Distribution Channel, 2017 – 2022 (Tons) 340

TABLE NO. 464. :. Chile Black Rice Market Volume, By Distribution Channel, 2023– 2030 (Tons) 340

TABLE NO. 465. :. Chile Black Rice Market Revenue, By Distribution Channel, 2017 – 2022 (USD Million) 341

TABLE NO. 466. :. Chile Black Rice Market Revenue, By Distribution Channel, 2023– 2030 (USD Million) 341

TABLE NO. 467. :. Chile Black Rice Market Volume, By Species, 2017 – 2022 (Tons) 342

TABLE NO. 468. :. Chile Black Rice Market Volume, By Species, 2023– 2030 (Tons) 342

TABLE NO. 469. :. Chile Black Rice Market Revenue, By Species, 2017 – 2022 (USD Million) 343

TABLE NO. 470. :. Chile Black Rice Market Revenue, By Species, 2023– 2030 (USD Million) 343

TABLE NO. 471. :. Colombia Black Rice Market Volume, By Application, 2017 – 2022 (Tons) 344

TABLE NO. 472. :. Colombia Black Rice Market Volume, By Application, 2023– 2030 (Tons) 344

TABLE NO. 473. :. Colombia Black Rice Market Revenue, By Application, 2017 – 2022 (USD Million) 345

TABLE NO. 474. :. Colombia Black Rice Market Revenue, By Application, 2023– 2030 (USD Million) 345

TABLE NO. 475. :. Colombia Black Rice Market Volume, By Distribution Channel, 2017 – 2022 (Tons) 346

TABLE NO. 476. :. Colombia Black Rice Market Volume, By Distribution Channel, 2023– 2030 (Tons) 346

TABLE NO. 477. :. Colombia Black Rice Market Revenue, By Distribution Channel, 2017 – 2022 (USD Million) 347

TABLE NO. 478. :. Colombia Black Rice Market Revenue, By Distribution Channel, 2023– 2030 (USD Million) 347

TABLE NO. 479. :. Colombia Black Rice Market Volume, By Species, 2017 – 2022 (Tons) 348

TABLE NO. 480. :. Colombia Black Rice Market Volume, By Species, 2023– 2030 (Tons) 348

TABLE NO. 481. :. Colombia Black Rice Market Revenue, By Species, 2017 – 2022 (USD Million) 349

TABLE NO. 482. :. Colombia Black Rice Market Revenue, By Species, 2023– 2030 (USD Million) 349

TABLE NO. 483. :. Rest of Latin America Black Rice Market Volume, By Application, 2017 – 2022 (Tons) 350

TABLE NO. 484. :. Rest of Latin America Black Rice Market Volume, By Application, 2023– 2030 (Tons) 350

TABLE NO. 485. :. Rest of Latin America Black Rice Market Revenue, By Application, 2017 – 2022 (USD Million) 351

TABLE NO. 486. :. Rest of Latin America Black Rice Market Revenue, By Application, 2023– 2030 (USD Million) 351

TABLE NO. 487. :. Rest of Latin America Black Rice Market Volume, By Distribution Channel, 2017 – 2022 (Tons) 352

TABLE NO. 488. :. Rest of Latin America Black Rice Market Volume, By Distribution Channel, 2023– 2030 (Tons) 352

TABLE NO. 489. :. Rest of Latin America Black Rice Market Revenue, By Distribution Channel, 2017 – 2022 (USD Million) 353

TABLE NO. 490. :. Rest of Latin America Black Rice Market Revenue, By Distribution Channel, 2023– 2030 (USD Million) 353

TABLE NO. 491. :. Rest of Latin America Black Rice Market Volume, By Species, 2017 – 2022 (Tons) 354

TABLE NO. 492. :. Rest of Latin America Black Rice Market Volume, By Species, 2023– 2030 (Tons) 354

TABLE NO. 493. :. Rest of Latin America Black Rice Market Revenue, By Species, 2017 – 2022 (USD Million) 355

TABLE NO. 494. :. Rest of Latin America Black Rice Market Revenue, By Species, 2023– 2030 (USD Million) 355

TABLE NO. 495. :. Middle East Black Rice Market Volume, By Country, 2017 – 2022 (Tons) 358

TABLE NO. 496. :. Middle East Black Rice Market Volume, By Country, 2023– 2030 (Tons) 358

TABLE NO. 497. :. Middle East Black Rice Market Revenue, By Country, 2017 – 2022 (USD Million) 359

TABLE NO. 498. :. Middle East Black Rice Market Revenue, By Country, 2023– 2030 (USD Million) 359

TABLE NO. 499. :. Middle East Black Rice Market Volume, By Application, 2017 – 2022 (Tons) 360

TABLE NO. 500. :. Middle East Black Rice Market Volume, By Application, 2023– 2030 (Tons) 360

TABLE NO. 501. :. Middle East Black Rice Market Revenue, By Application, 2017 – 2022 (USD Million) 361

TABLE NO. 502. :. Middle East Black Rice Market Revenue, By Application, 2023– 2030 (USD Million) 361

TABLE NO. 503. :. Middle East Black Rice Market Volume, By Distribution Channel, 2017 – 2022 (Tons) 362

TABLE NO. 504. :. Middle East Black Rice Market Volume, By Distribution Channel, 2023– 2030 (Tons) 362

TABLE NO. 505. :. Middle East Black Rice Market Revenue, By Distribution Channel, 2017 – 2022 (USD Million) 363

TABLE NO. 506. :. Middle East Black Rice Market Revenue, By Distribution Channel, 2023– 2030 (USD Million) 363

TABLE NO. 507. :. Middle East Black Rice Market Volume, By Species, 2017 – 2022 (Tons) 364

TABLE NO. 508. :. Middle East Black Rice Market Volume, By Species, 2023– 2030 (Tons) 364

TABLE NO. 509. :. Middle East Black Rice Market Revenue, By Species, 2017 – 2022 (USD Million) 365

TABLE NO. 510. :. Middle East Black Rice Market Revenue, By Species, 2023– 2030 (USD Million) 365

TABLE NO. 511. :. UAE Black Rice Market Volume, By Application, 2017 – 2022 (Tons) 366

TABLE NO. 512. :. UAE Black Rice Market Volume, By Application, 2023– 2030 (Tons) 366

TABLE NO. 513. :. UAE Black Rice Market Revenue, By Application, 2017 – 2022 (USD Million) 367

TABLE NO. 514. :. UAE Black Rice Market Revenue, By Application, 2023– 2030 (USD Million) 367

TABLE NO. 515. :. UAE Black Rice Market Volume, By Distribution Channel, 2017 – 2022 (Tons) 368

TABLE NO. 516. :. UAE Black Rice Market Volume, By Distribution Channel, 2023– 2030 (Tons) 368

TABLE NO. 517. :. UAE Black Rice Market Revenue, By Distribution Channel, 2017 – 2022 (USD Million) 369

TABLE NO. 518. :. UAE Black Rice Market Revenue, By Distribution Channel, 2023– 2030 (USD Million) 369

TABLE NO. 519. :. UAE Black Rice Market Volume, By Species, 2017 – 2022 (Tons) 370

TABLE NO. 520. :. UAE Black Rice Market Volume, By Species, 2023– 2030 (Tons) 370

TABLE NO. 521. :. UAE Black Rice Market Revenue, By Species, 2017 – 2022 (USD Million) 371

TABLE NO. 522. :. UAE Black Rice Market Revenue, By Species, 2023– 2030 (USD Million) 371

TABLE NO. 523. :. KSA Black Rice Market Volume, By Application, 2017 – 2022 (Tons) 372

TABLE NO. 524. :. KSA Black Rice Market Volume, By Application, 2023– 2030 (Tons) 372

TABLE NO. 525. :. KSA Black Rice Market Revenue, By Application, 2017 – 2022 (USD Million) 373

TABLE NO. 526. :. KSA Black Rice Market Revenue, By Application, 2023– 2030 (USD Million) 373

TABLE NO. 527. :. KSA Black Rice Market Volume, By Distribution Channel, 2017 – 2022 (Tons) 374

TABLE NO. 528. :. KSA Black Rice Market Volume, By Distribution Channel, 2023– 2030 (Tons) 374

TABLE NO. 529. :. KSA Black Rice Market Revenue, By Distribution Channel, 2017 – 2022 (USD Million) 375

TABLE NO. 530. :. KSA Black Rice Market Revenue, By Distribution Channel, 2023– 2030 (USD Million) 375

TABLE NO. 531. :. KSA Black Rice Market Volume, By Species, 2017 – 2022 (Tons) 376

TABLE NO. 532. :. KSA Black Rice Market Volume, By Species, 2023– 2030 (Tons) 376

TABLE NO. 533. :. KSA Black Rice Market Revenue, By Species, 2017 – 2022 (USD Million) 377

TABLE NO. 534. :. KSA Black Rice Market Revenue, By Species, 2023– 2030 (USD Million) 377

TABLE NO. 535. :. Israel Black Rice Market Volume, By Application, 2017 – 2022 (Tons) 378

TABLE NO. 536. :. Israel Black Rice Market Volume, By Application, 2023– 2030 (Tons) 378

TABLE NO. 537. :. Israel Black Rice Market Revenue, By Application, 2017 – 2022 (USD Million) 379

TABLE NO. 538. :. Israel Black Rice Market Revenue, By Application, 2023– 2030 (USD Million) 379

TABLE NO. 539. :. Israel Black Rice Market Volume, By Distribution Channel, 2017 – 2022 (Tons) 380

TABLE NO. 540. :. Israel Black Rice Market Volume, By Distribution Channel, 2023– 2030 (Tons) 380

TABLE NO. 541. :. Israel Black Rice Market Revenue, By Distribution Channel, 2017 – 2022 (USD Million) 381

TABLE NO. 542. :. Israel Black Rice Market Revenue, By Distribution Channel, 2023– 2030 (USD Million) 381

TABLE NO. 543. :. Israel Black Rice Market Volume, By Species, 2017 – 2022 (Tons) 382

TABLE NO. 544. :. Israel Black Rice Market Volume, By Species, 2023– 2030 (Tons) 382

TABLE NO. 545. :. Israel Black Rice Market Revenue, By Species, 2017 – 2022 (USD Million) 383

TABLE NO. 546. :. Israel Black Rice Market Revenue, By Species, 2023– 2030 (USD Million) 383

TABLE NO. 547. :. Turkey Black Rice Market Volume, By Application, 2017 – 2022 (Tons) 384

TABLE NO. 548. :. Turkey Black Rice Market Volume, By Application, 2023– 2030 (Tons) 384

TABLE NO. 549. :. Turkey Black Rice Market Revenue, By Application, 2017 – 2022 (USD Million) 385

TABLE NO. 550. :. Turkey Black Rice Market Revenue, By Application, 2023– 2030 (USD Million) 385

TABLE NO. 551. :. Turkey Black Rice Market Volume, By Distribution Channel, 2017 – 2022 (Tons) 386

TABLE NO. 552. :. Turkey Black Rice Market Volume, By Distribution Channel, 2023– 2030 (Tons) 386

TABLE NO. 553. :. Turkey Black Rice Market Revenue, By Distribution Channel, 2017 – 2022 (USD Million) 387

TABLE NO. 554. :. Turkey Black Rice Market Revenue, By Distribution Channel, 2023– 2030 (USD Million) 387

TABLE NO. 555. :. Turkey Black Rice Market Volume, By Species, 2017 – 2022 (Tons) 388

TABLE NO. 556. :. Turkey Black Rice Market Volume, By Species, 2023– 2030 (Tons) 388

TABLE NO. 557. :. Turkey Black Rice Market Revenue, By Species, 2017 – 2022 (USD Million) 389

TABLE NO. 558. :. Turkey Black Rice Market Revenue, By Species, 2023– 2030 (USD Million) 389

TABLE NO. 559. :. Iran Black Rice Market Volume, By Application, 2017 – 2022 (Tons) 390

TABLE NO. 560. :. Iran Black Rice Market Volume, By Application, 2023– 2030 (Tons) 390

TABLE NO. 561. :. Iran Black Rice Market Revenue, By Application, 2017 – 2022 (USD Million) 391

TABLE NO. 562. :. Iran Black Rice Market Revenue, By Application, 2023– 2030 (USD Million) 391

TABLE NO. 563. :. Iran Black Rice Market Volume, By Distribution Channel, 2017 – 2022 (Tons) 392

TABLE NO. 564. :. Iran Black Rice Market Volume, By Distribution Channel, 2023– 2030 (Tons) 392

TABLE NO. 565. :. Iran Black Rice Market Revenue, By Distribution Channel, 2017 – 2022 (USD Million) 393

TABLE NO. 566. :. Iran Black Rice Market Revenue, By Distribution Channel, 2023– 2030 (USD Million) 393

TABLE NO. 567. :. Iran Black Rice Market Volume, By Species, 2017 – 2022 (Tons) 394

TABLE NO. 568. :. Iran Black Rice Market Volume, By Species, 2023– 2030 (Tons) 394

TABLE NO. 569. :. Iran Black Rice Market Revenue, By Species, 2017 – 2022 (USD Million) 395

TABLE NO. 570. :. Iran Black Rice Market Revenue, By Species, 2023– 2030 (USD Million) 395

TABLE NO. 571. :. Rest of Middle East Black Rice Market Volume, By Application, 2017 – 2022 (Tons) 396

TABLE NO. 572. :. Rest of Middle East Black Rice Market Volume, By Application, 2023– 2030 (Tons) 396

TABLE NO. 573. :. Rest of Middle East Black Rice Market Revenue, By Application, 2017 – 2022 (USD Million) 397

TABLE NO. 574. :. Rest of Middle East Black Rice Market Revenue, By Application, 2023– 2030 (USD Million) 397

TABLE NO. 575. :. Rest of Middle East Black Rice Market Volume, By Distribution Channel, 2017 – 2022 (Tons) 398

TABLE NO. 576. :. Rest of Middle East Black Rice Market Volume, By Distribution Channel, 2023– 2030 (Tons) 398

TABLE NO. 577. :. Rest of Middle East Black Rice Market Revenue, By Distribution Channel, 2017 – 2022 (USD Million) 399

TABLE NO. 578. :. Rest of Middle East Black Rice Market Revenue, By Distribution Channel, 2023– 2030 (USD Million) 399

TABLE NO. 579. :. Rest of Middle East Black Rice Market Volume, By Species, 2017 – 2022 (Tons) 400

TABLE NO. 580. :. Rest of Middle East Black Rice Market Volume, By Species, 2023– 2030 (Tons) 400

TABLE NO. 581. :. Rest of Middle East Black Rice Market Revenue, By Species, 2017 – 2022 (USD Million) 401

TABLE NO. 582. :. Rest of Middle East Black Rice Market Revenue, By Species, 2023– 2030 (USD Million) 401

TABLE NO. 583. :. Africa Black Rice Market Volume, By Country, 2017 – 2022 (Tons) 404

TABLE NO. 584. :. Africa Black Rice Market Volume, By Country, 2023– 2030 (Tons) 404

TABLE NO. 585. :. Africa Black Rice Market Revenue, By Country, 2017 – 2022 (USD Million) 405

TABLE NO. 586. :. Africa Black Rice Market Revenue, By Country, 2023– 2030 (USD Million) 405

TABLE NO. 587. :. Africa Black Rice Market Volume, By Application, 2017 – 2022 (Tons) 406

TABLE NO. 588. :. Africa Black Rice Market Volume, By Application, 2023– 2030 (Tons) 406

TABLE NO. 589. :. Africa Black Rice Market Revenue, By Application, 2017 – 2022 (USD Million) 407

TABLE NO. 590. :. Africa Black Rice Market Revenue, By Application, 2023– 2030 (USD Million) 407

TABLE NO. 591. :. Africa Black Rice Market Volume, By Distribution Channel, 2017 – 2022 (Tons) 408

TABLE NO. 592. :. Africa Black Rice Market Volume, By Distribution Channel, 2023– 2030 (Tons) 408

TABLE NO. 593. :. Africa Black Rice Market Revenue, By Distribution Channel, 2017 – 2022 (USD Million) 409

TABLE NO. 594. :. Africa Black Rice Market Revenue, By Distribution Channel, 2023– 2030 (USD Million) 409

TABLE NO. 595. :. Africa Black Rice Market Volume, By Species, 2017 – 2022 (Tons) 410

TABLE NO. 596. :. Africa Black Rice Market Volume, By Species, 2023– 2030 (Tons) 410

TABLE NO. 597. :. Africa Black Rice Market Revenue, By Species, 2017 – 2022 (USD Million) 411

TABLE NO. 598. :. Africa Black Rice Market Revenue, By Species, 2023– 2030 (USD Million) 411

TABLE NO. 599. :. South Africa Black Rice Market Volume, By Application, 2017 – 2022 (Tons) 412

TABLE NO. 600. :. South Africa Black Rice Market Volume, By Application, 2023– 2030 (Tons) 412

TABLE NO. 601. :. South Africa Black Rice Market Revenue, By Application, 2017 – 2022 (USD Million) 413

TABLE NO. 602. :. South Africa Black Rice Market Revenue, By Application, 2023– 2030 (USD Million) 413

TABLE NO. 603. :. South Africa Black Rice Market Volume, By Distribution Channel, 2017 – 2022 (Tons) 414

TABLE NO. 604. :. South Africa Black Rice Market Volume, By Distribution Channel, 2023– 2030 (Tons) 414

TABLE NO. 605. :. South Africa Black Rice Market Revenue, By Distribution Channel, 2017 – 2022 (USD Million) 415

TABLE NO. 606. :. South Africa Black Rice Market Revenue, By Distribution Channel, 2023– 2030 (USD Million) 415

TABLE NO. 607. :. South Africa Black Rice Market Volume, By Species, 2017 – 2022 (Tons) 416

TABLE NO. 608. :. South Africa Black Rice Market Volume, By Species, 2023– 2030 (Tons) 416

TABLE NO. 609. :. South Africa Black Rice Market Revenue, By Species, 2017 – 2022 (USD Million) 417

TABLE NO. 610. :. South Africa Black Rice Market Revenue, By Species, 2023– 2030 (USD Million) 417

TABLE NO. 611. :. Egypt Black Rice Market Volume, By Application, 2017 – 2022 (Tons) 418

TABLE NO. 612. :. Egypt Black Rice Market Volume, By Application, 2023– 2030 (Tons) 418

TABLE NO. 613. :. Egypt Black Rice Market Revenue, By Application, 2017 – 2022 (USD Million) 419

TABLE NO. 614. :. Egypt Black Rice Market Revenue, By Application, 2023– 2030 (USD Million) 419

TABLE NO. 615. :. Egypt Black Rice Market Volume, By Distribution Channel, 2017 – 2022 (Tons) 420

TABLE NO. 616. :. Egypt Black Rice Market Volume, By Distribution Channel, 2023– 2030 (Tons) 420

TABLE NO. 617. :. Egypt Black Rice Market Revenue, By Distribution Channel, 2017 – 2022 (USD Million) 421

TABLE NO. 618. :. Egypt Black Rice Market Revenue, By Distribution Channel, 2023– 2030 (USD Million) 421

TABLE NO. 619. :. Egypt Black Rice Market Volume, By Species, 2017 – 2022 (Tons) 422

TABLE NO. 620. :. Egypt Black Rice Market Volume, By Species, 2023– 2030 (Tons) 422

TABLE NO. 621. :. Egypt Black Rice Market Revenue, By Species, 2017 – 2022 (USD Million) 423

TABLE NO. 622. :. Egypt Black Rice Market Revenue, By Species, 2023– 2030 (USD Million) 423

TABLE NO. 623. :. Nigeria Black Rice Market Volume, By Application, 2017 – 2022 (Tons) 424

TABLE NO. 624. :. Nigeria Black Rice Market Volume, By Application, 2023– 2030 (Tons) 424

TABLE NO. 625. :. Nigeria Black Rice Market Revenue, By Application, 2017 – 2022 (USD Million) 425

TABLE NO. 626. :. Nigeria Black Rice Market Revenue, By Application, 2023– 2030 (USD Million) 425

TABLE NO. 627. :. Nigeria Black Rice Market Volume, By Distribution Channel, 2017 – 2022 (Tons) 426

TABLE NO. 628. :. Nigeria Black Rice Market Volume, By Distribution Channel, 2023– 2030 (Tons) 426

TABLE NO. 629. :. Nigeria Black Rice Market Revenue, By Distribution Channel, 2017 – 2022 (USD Million) 427

TABLE NO. 630. :. Nigeria Black Rice Market Revenue, By Distribution Channel, 2023– 2030 (USD Million) 427

TABLE NO. 631. :. Nigeria Black Rice Market Volume, By Species, 2017 – 2022 (Tons) 428

TABLE NO. 632. :. Nigeria Black Rice Market Volume, By Species, 2023– 2030 (Tons) 428

TABLE NO. 633. :. Nigeria Black Rice Market Revenue, By Species, 2017 – 2022 (USD Million) 429

TABLE NO. 634. :. Nigeria Black Rice Market Revenue, By Species, 2023– 2030 (USD Million) 429

TABLE NO. 635. :. Algeria Black Rice Market Volume, By Application, 2017 – 2022 (Tons) 430

TABLE NO. 636. :. Algeria Black Rice Market Volume, By Application, 2023– 2030 (Tons) 430

TABLE NO. 637. :. Algeria Black Rice Market Revenue, By Application, 2017 – 2022 (USD Million) 431

TABLE NO. 638. :. Algeria Black Rice Market Revenue, By Application, 2023– 2030 (USD Million) 431

TABLE NO. 639. :. Algeria Black Rice Market Volume, By Distribution Channel, 2017 – 2022 (Tons) 432

TABLE NO. 640. :. Algeria Black Rice Market Volume, By Distribution Channel, 2023– 2030 (Tons) 432

TABLE NO. 641. :. Algeria Black Rice Market Revenue, By Distribution Channel, 2017 – 2022 (USD Million) 433

TABLE NO. 642. :. Algeria Black Rice Market Revenue, By Distribution Channel, 2023– 2030 (USD Million) 433

TABLE NO. 643. :. Algeria Black Rice Market Volume, By Species, 2017 – 2022 (Tons) 434

TABLE NO. 644. :. Algeria Black Rice Market Volume, By Species, 2023– 2030 (Tons) 434

TABLE NO. 645. :. Algeria Black Rice Market Revenue, By Species, 2017 – 2022 (USD Million) 435

TABLE NO. 646. :. Algeria Black Rice Market Revenue, By Species, 2023– 2030 (USD Million) 435

TABLE NO. 647. :. Morocco Black Rice Market Volume, By Application, 2017 – 2022 (Tons) 436

TABLE NO. 648. :. Morocco Black Rice Market Volume, By Application, 2023– 2030 (Tons) 436

TABLE NO. 649. :. Morocco Black Rice Market Revenue, By Application, 2017 – 2022 (USD Million) 437

TABLE NO. 650. :. Morocco Black Rice Market Revenue, By Application, 2023– 2030 (USD Million) 437

TABLE NO. 651. :. Morocco Black Rice Market Volume, By Distribution Channel, 2017 – 2022 (Tons) 438

TABLE NO. 652. :. Morocco Black Rice Market Volume, By Distribution Channel, 2023– 2030 (Tons) 438

TABLE NO. 653. :. Morocco Black Rice Market Revenue, By Distribution Channel, 2017 – 2022 (USD Million) 439

TABLE NO. 654. :. Morocco Black Rice Market Revenue, By Distribution Channel, 2023– 2030 (USD Million) 439

TABLE NO. 655. :. Morocco Black Rice Market Volume, By Species, 2017 – 2022 (Tons) 440

TABLE NO. 656. :. Morocco Black Rice Market Volume, By Species, 2023– 2030 (Tons) 440

TABLE NO. 657. :. Morocco Black Rice Market Revenue, By Species, 2017 – 2022 (USD Million) 441

TABLE NO. 658. :. Morocco Black Rice Market Revenue, By Species, 2023– 2030 (USD Million) 441

TABLE NO. 659. :. Rest of Africa Black Rice Market Volume, By Application, 2017 – 2022 (Tons) 442

TABLE NO. 660. :. Rest of Africa Black Rice Market Volume, By Application, 2023– 2030 (Tons) 442

TABLE NO. 661. :. Rest of Africa Black Rice Market Revenue, By Application, 2017 – 2022 (USD Million) 443

TABLE NO. 662. :. Rest of Africa Black Rice Market Revenue, By Application, 2023– 2030 (USD Million) 443

TABLE NO. 663. :. Rest of Africa Black Rice Market Volume, By Distribution Channel, 2017 – 2022 (Tons) 444

TABLE NO. 664. :. Rest of Africa Black Rice Market Volume, By Distribution Channel, 2023– 2030 (Tons) 444

TABLE NO. 665. :. Rest of Africa Black Rice Market Revenue, By Distribution Channel, 2017 – 2022 (USD Million) 445

TABLE NO. 666. :. Rest of Africa Black Rice Market Revenue, By Distribution Channel, 2023– 2030 (USD Million) 445

TABLE NO. 667. :. Rest of Africa Black Rice Market Volume, By Species, 2017 – 2022 (Tons) 446

TABLE NO. 668. :. Rest of Africa Black Rice Market Volume, By Species, 2023– 2030 (Tons) 446

TABLE NO. 669. :. Rest of Africa Black Rice Market Revenue, By Species, 2017 – 2022 (USD Million) 447

TABLE NO. 670. :. Rest of Africa Black Rice Market Revenue, By Species, 2023– 2030 (USD Million) 447

Frequently Asked Questions

How COVID 19 Impacted Black Rice Market?

Likewise other industries, COVID 19 also taken a toll on Black Rice market with around 4.12% decline in its revenue in 2020 as compare to 2019

Which is the leading regional market for Black Rice?

Asia Pacific is the largest regional market with highest share in the total volume of Black Rice consumed in 2021 followed by Europe

What is the major growth driving factors for global Black Rice market?

Increasing health awareness and popularity of black rice among end-users as a major source of nutrition and iron

Which is major segment in Black Rice market by end-user?

Household consumers dominated the Black Rice market in 2021 with over 40% share

Which is major segment in Black Rice market by distribution channel?

Grocery Stores was the largest distribution channel of Black Rice in 2021 with over 35% share

Neotame Market

Published:
Report ID: 14477

Malt Ingredients Market

Published:
Report ID: 8009

Non GMO Yogurt Market

Published:
Report ID: 14336

Food Service Disposables Market

Published:
Report ID: 5610

Ready Meal Trays Market

Published:
Report ID: 35054

Colostrum Market

Published:
Report ID: 3771

Citrus Essential Oil Market

Published:
Report ID: 3047

Grape Seed Extracts Market

Published:
Report ID: 6449

Food Processing Machinery Market

Published:
Report ID: 5611

Cardamom Oil Market

Published:
Report ID: 2385

Edible Insects Market

Published:
Report ID: 4785

Middle East & Africa Tahini Market

Published:
Report ID: 8471

Purchase Options

$2999
Delivery Format: Excel.
$4999
Designed for the individual purchaser.
$6999
Users located at a single corporate site or regional office.
$7999
Allowed for unlimited sharing globally within one company.
Smallform of Sample request

Have a question?

User Profile

Don’t settle for less – trust Mitul to help you find the best solution.

Report delivery within 24 to 48 hours

– Other Info –

What people say?-

User Review

I am very impressed with the information in this report. The author clearly did their research when they came up with this product and it has already given me a lot of ideas.

Jana Schmidt
CEDAR CX Technologies

– Connect with us –

Phone

+91 6232 49 3207


support

24/7 Research Support


sales@credenceresearch.com

– Research Methodology –

Going beyond the basics: advanced techniques in research methodology

– Trusted By –

Pepshi, LG, Nestle
Motorola, Honeywell, Johnson and johnson
LG Chem, SIEMENS, Pfizer
Unilever, Samsonite, QIAGEN