Market Overview:
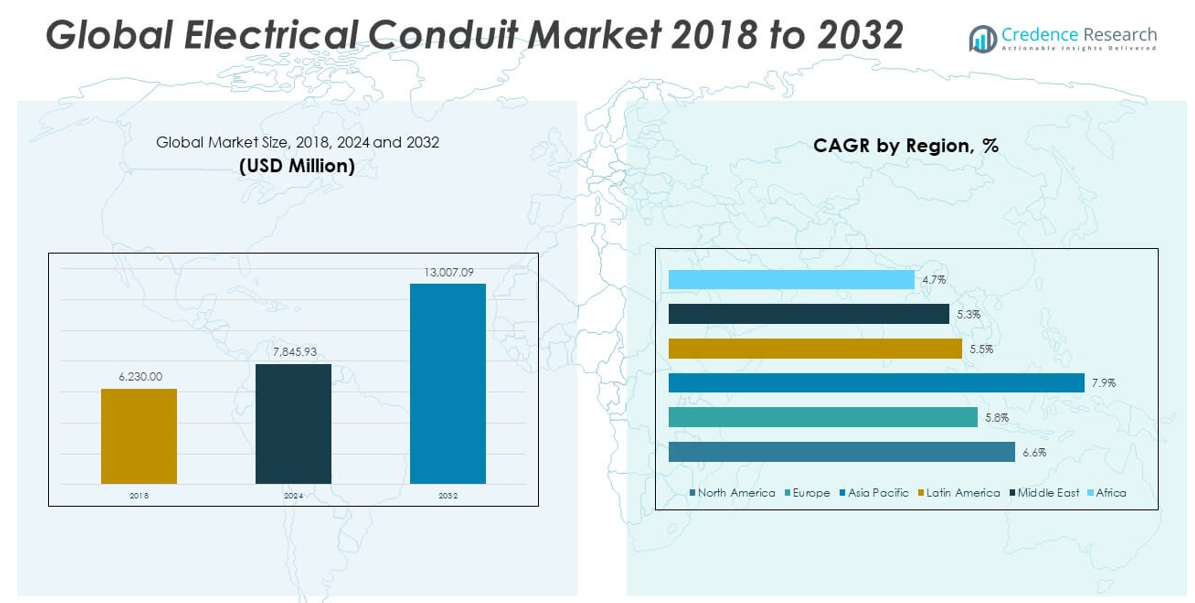
The Electrical Conduit Market size was valued at USD 6,230.00 million in 2018 to USD 7,845.93 million in 2024 and is anticipated to reach USD 13,007.09 million by 2032, at a CAGR of 6.55% during the forecast period.
The electrical conduit market is gaining momentum due to the global push for modern infrastructure development and safe electrical installations. Rapid urbanization and ongoing construction activities in residential, commercial, and industrial sectors are increasing the need for reliable wiring systems. Government investments in smart city projects and modernization of aging grid infrastructure are further driving the demand for conduit systems. The transition toward renewable energy and electric mobility also creates a strong need for durable and weather-resistant conduits in solar, wind, and EV charging applications. Moreover, stringent building codes and safety regulations across regions are compelling builders and developers to adopt conduit solutions to ensure compliance. Manufacturers are continuously innovating with flexible, corrosion-resistant, and halogen-free conduits that reduce installation complexity and enhance safety. These technological enhancements, combined with growing awareness of fire protection and environmental sustainability, are contributing to widespread adoption across a variety of sectors.
Asia Pacific leads the electrical conduit market due to rapid industrialization, expanding construction activity, and large-scale government-led development initiatives. Countries in the region are witnessing increasing demand for secure electrical infrastructure to support urban growth, renewable energy projects, and transportation networks. North America maintains a strong position with a well-established construction sector and a focus on modernizing utility grids and commercial buildings. The region benefits from strict safety codes and a growing preference for energy-efficient infrastructure. In Europe, emphasis on green energy and smart building technologies is boosting demand for advanced conduit systems in residential and industrial applications. Meanwhile, the Middle East, Africa, and Latin America are emerging as promising markets, driven by rising electricity access, urban expansion, and public infrastructure investments. Although these regions are still developing, they offer significant growth opportunities for global and regional players aiming to strengthen their presence in untapped or underpenetrated markets.
Market Insights:
- The Electrical Conduit Market is projected to grow from USD 7,845.93 million in 2024 to USD 13,007.09 million by 2032, driven by a CAGR of 6.55%.
- Rapid urbanization and construction activity across residential, commercial, and industrial sectors are accelerating the demand for structured electrical wiring systems.
- Government-backed smart city programs and infrastructure modernization projects are significantly boosting conduit installations globally.
- The transition to renewable energy and electric mobility is increasing the need for weather-resistant and durable conduits in solar, wind, and EV applications.
- Strict electrical safety regulations and fire codes are compelling builders to use halogen-free and corrosion-resistant conduit systems.
- Raw material price volatility and skilled labor shortages in emerging regions remain key challenges to consistent market growth.
- Asia Pacific leads the global market due to large-scale development, while North America and Europe focus on modernizing grids and expanding energy-efficient buildings.
Access crucial information at unmatched prices!
Request your sample report today & start making informed decisions powered by Credence Research Inc.!
Download Sample
Market Drivers:
Infrastructure Expansion and Urban Development Initiatives Fuel Demand for Conduit Installations
The rapid pace of global urbanization is significantly influencing the need for advanced electrical infrastructure. With new commercial buildings, residential complexes, and industrial facilities being constructed across both developed and emerging economies, the demand for secure and structured wiring systems is accelerating. The Electrical Conduit Market is responding to this need by offering solutions that enhance electrical safety, simplify maintenance, and protect cabling systems from environmental stress. Governments are rolling out large-scale infrastructure projects, such as smart cities and transportation corridors, which require reliable conduit systems. Private developers also seek to ensure compliance with modern safety standards in construction. These factors together are shaping a favorable environment for increased adoption of electrical conduits across diverse building types.
- For example, ABB Installation Products opened a $4 million Northeast Distribution Center in Easton, Pennsylvania to meet increased demand for electrical products and solutions, including conduit and cable management systems, across the United States.
Regulatory Enforcement and Electrical Safety Standards Encourage Product Usage
Compliance with rigorous building codes and electrical safety regulations plays a critical role in driving the market. Regulatory bodies in various regions enforce mandatory use of protective conduit systems in residential, industrial, and commercial settings. The market benefits from policies that prioritize fire prevention, worker safety, and protection of electrical networks against mechanical damage and moisture exposure. It helps builders and contractors meet these regulations while maintaining cost efficiency and structural integrity. Growing awareness among project managers and end-users about fire-resistant and halogen-free conduit materials supports market penetration. The role of third-party certification and inspection services also adds accountability, which strengthens confidence in compliant conduit products.
- For example, Legrand’s Wiremold Raceway Systemsare designed to meet rigorous U.S. and international electrical codes, including UL, CSA, and RoHS compliance.
Renewable Energy Integration and Power Grid Upgrades Create Sustained Opportunities
The global transition toward renewable energy sources requires robust electrical infrastructure, especially in harsh and remote environments. Solar farms, wind parks, and other distributed energy systems depend on conduits to protect underground and overhead power lines. The Electrical Conduit Market is benefiting from increased investments in grid modernization and energy storage facilities. Governments and utilities are working on grid expansion and retrofitting projects, often involving high-voltage and complex cable arrangements. It provides essential products that withstand vibration, thermal stress, and chemical exposure. These applications position conduits as essential components in long-term sustainability initiatives.
Technological Advancements in Conduit Design Improve Efficiency and Safety
Continuous product innovation is helping manufacturers meet evolving customer needs across sectors. Lightweight materials, corrosion-resistant coatings, flexible designs, and pre-wired systems are reducing installation times and labor costs. It supports faster project execution without compromising on performance or safety. Integration with IoT-enabled monitoring and modular configurations is attracting demand from high-tech industrial and commercial facilities. Customization options for specific voltage ranges, bend angles, and environmental conditions are expanding use cases. This ability to deliver engineered solutions has strengthened the role of conduits in modern electrical infrastructure.
Market Trends:
Rising Preference for Non-Metallic Conduits in Cost-Sensitive and Corrosion-Prone Environments
A growing trend in the construction and utility sectors is the shift from metallic to non-metallic conduit systems. Non-metallic options, including PVC, HDPE, and fiberglass, are gaining popularity due to their lightweight structure, corrosion resistance, and ease of installation. The Electrical Conduit Market is responding to this shift by expanding product lines that serve environments where metal conduits degrade quickly. These materials offer reliable performance in chemical processing plants, coastal facilities, and underground installations. Contractors and project managers are opting for non-metallic conduits to reduce installation time and avoid maintenance issues. The trend is gaining traction in markets where cost-efficiency and environmental resistance are high priorities.
- Champion Fiberglass, for example, has published detailed chemical resistance data for its Champion Duct® and Haz Duct® fiberglass conduits, demonstrating their ability to withstand immersion in harsh chemicals like hydrogen sulfide, hydrochloric acid, and sulfuric acid for 30 days at elevated temperatures, confirming suitability for wastewater and chemical plants.
Growth in Modular and Prefabricated Construction Drives Demand for Preassembled Conduit Systems
The rise of modular and prefabricated buildings is influencing electrical component procurement strategies. Preassembled conduit systems, which are manufactured offsite and delivered ready for installation, are streamlining construction workflows and reducing labor dependency. The Electrical Conduit Market is seeing increasing demand for such preconfigured solutions, particularly in data centers, hospitals, and commercial office spaces. These systems support standardization, reduce on-site safety risks, and help meet tight project timelines. It also enables improved coordination among contractors and design engineers. This trend is expected to continue as developers seek to optimize cost, time, and quality in high-density construction projects.
Sustainability-Focused Procurement Policies Influence Conduit Material Selection
Sustainability has become a defining trend in construction, influencing not only energy systems but also material choices. Public and private developers are prioritizing eco-friendly procurement, which includes recyclable and low-impact conduit products. The Electrical Conduit Market is responding by offering solutions that align with green building certifications and lifecycle impact standards. Manufacturers are investing in formulations that minimize emissions, reduce toxic content, and enable material reuse. It helps contractors meet environmental targets without compromising on performance or compliance. This shift in procurement priorities is likely to drive demand for conduits made from sustainable or recycled materials.
- For instance, Atkore’s 2024 Environmental Product Declarations for PVC conduit and fittings provide quantitative lifecycle metrics including greenhouse gas emissions and energy consumption allowing contractors to select products aligned with LEED and other green building standards.
Integration of Smart Technologies into Conduit Infrastructure Gains Momentum
The adoption of smart infrastructure is pushing the role of electrical conduits beyond simple cable protection. Emerging applications now require conduits that accommodate sensors, data cables, and IoT-enabled systems. The Electrical Conduit Market is adapting by developing products that support structured cabling and digital building management solutions. It is also expanding into applications such as energy monitoring, occupancy tracking, and environmental sensing. Conduits are being designed to allow easy upgrades, data transmission shielding, and compatibility with hybrid power systems. This trend is reshaping how conduits are engineered and specified in future-ready infrastructure.
Market Challenges Analysis:
Volatile Raw Material Prices and Supply Chain Disruptions Impact Manufacturing Costs
Fluctuations in the prices of essential raw materials such as steel, aluminum, and polyvinyl chloride (PVC) continue to create uncertainty for manufacturers. These cost variations affect the overall pricing strategy and profit margins of conduit producers, particularly those operating on tight budgets. The Electrical Conduit Market faces challenges in maintaining consistent supply while managing procurement risks tied to geopolitical instability, trade regulations, and shipping delays. It also depends on a global supplier network, which becomes vulnerable during periods of economic disruption or material scarcity. Manufacturers are often forced to absorb short-term losses or pass on increased costs to end-users. These conditions make it difficult to forecast pricing and inventory planning, especially for large-scale infrastructure projects with fixed budgets.
Lack of Standardization and Skilled Workforce Slows Product Adoption in Developing Regions
Varying construction codes and a lack of uniform electrical installation standards across different regions hinder market consistency. The Electrical Conduit Market must navigate complex compliance requirements, which slows the adoption of standardized products in emerging economies. It also faces workforce limitations, with a shortage of trained electricians and installers familiar with modern conduit systems. Inconsistent installation practices increase the risk of system failure, undermining end-user confidence in conduit-based solutions. Training programs and regulatory harmonization are often underfunded, limiting knowledge transfer and best practices. These gaps create barriers for new entrants and delay the expansion of advanced conduit technologies in developing markets.
Market Opportunities:
Smart City Initiatives and Electrification of Infrastructure Open New Growth Avenues
Government-led smart city projects and the electrification of public infrastructure present strong growth potential for conduit manufacturers. These initiatives demand robust and scalable electrical networks, increasing the need for safe and durable wiring enclosures. The Electrical Conduit Market can benefit by offering solutions compatible with advanced systems like intelligent traffic controls, surveillance, and public EV charging stations. It can also align its products with digital infrastructure standards to support long-term reliability and flexibility. Urban redevelopment plans and the transition to electric public transport further expand application areas. These projects create opportunities to supply high-performance conduit systems tailored to modern, tech-driven environments.
Expansion in Industrial Automation and Data Center Development Supports Long-Term Demand
The rapid rise of industrial automation and digital transformation across sectors is driving new demand for secure cabling infrastructure. Factories, logistics centers, and data centers require reliable conduit systems to protect sensitive electrical and communication wiring. The Electrical Conduit Market is well-positioned to serve these segments with products designed for controlled environments and complex layouts. It can also support modular installations and high-density cable management, essential for evolving data infrastructure. The global push toward Industry 4.0 and increased cloud adoption will continue to create openings for high-quality, customizable conduit systems. These industrial shifts offer strong and sustained opportunities for growth.
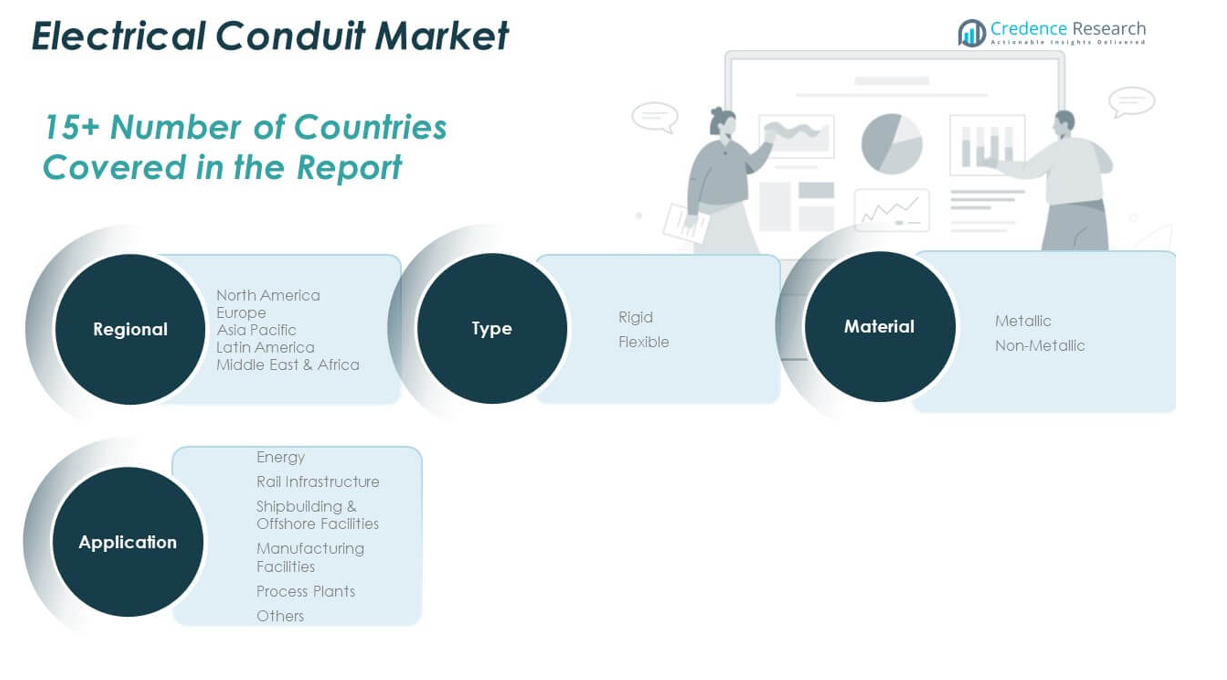
Market Segmentation Analysis:
The Electrical Conduit Market is segmented
By type into rigid and flexible conduits. Rigid conduits are preferred in industrial and commercial settings due to their strength and protective capabilities, particularly in environments requiring high mechanical protection. Flexible conduits offer ease of installation and are widely used in spaces with limited accessibility or complex layouts.
By material, the market includes metallic and non-metallic conduits. Metallic conduits, such as steel and aluminum, are commonly used in applications demanding durability and grounding capabilities. Non-metallic conduits, made from PVC or HDPE, are gaining traction due to their corrosion resistance, lightweight nature, and cost-efficiency.
- For example, ABB’s Carlon® Schedule 40 and 80 PVC Conduit is UL 651 listed and designed for underground and aboveground installations, its lightweight construction (up to 50% lighter than steel), corrosion resistance, and ease of cutting and joining. Carlon® PVC is widely used in residential, commercial, and utility projects, especially where exposure to moisture or chemicals is a concern.
By application, the market is segmented into energy, rail infrastructure, shipbuilding and offshore facilities, manufacturing facilities, process plants, and others. The energy segment leads due to high demand for safe and efficient wiring systems in renewable and conventional power projects. Rail and offshore applications require robust conduits capable of withstanding harsh environments. It continues to serve diverse industries with tailored solutions that ensure performance, safety, and compliance.
- For example, ABB’s Adaptaflex flexible metallic and non-metallic conduit systems are certified to EN 45545-2 for fire safety in rail applications.
Segmentation:
By Type
By Material
By Application
- Energy
- Rail Infrastructure
- Shipbuilding & Offshore Facilities
- Manufacturing Facilities
- Process Plants
- Others
By Region
- North America
- Europe
- Germany
- France
- U.K.
- Italy
- Spain
- Rest of Europe
- Asia Pacific
- China
- Japan
- India
- South Korea
- South-east Asia
- Rest of Asia Pacific
- Latin America
- Brazil
- Argentina
- Rest of Latin America
- Middle East & Africa
- GCC Countries
- South Africa
- Rest of the Middle East and Africa
Regional Analysis:
North America
The North America Electrical Conduit Market size was valued at USD 2,168.04 million in 2018 to USD 2,695.81 million in 2024 and is anticipated to reach USD 4,462.75 million by 2032, at a CAGR of 6.6% during the forecast period. North America holds a prominent share of the global Electrical Conduit Market, accounting for 23% of the total market. The region benefits from a well-established construction sector, strict safety regulations, and growing investments in energy infrastructure. It sees strong demand from commercial buildings, industrial automation, and data center development. Regulatory mandates for fire safety and compliance continue to drive the adoption of conduit systems across new projects and retrofit installations. The market is also witnessing increased demand for non-metallic conduits in underground and corrosive environments. It continues to attract innovation in flexible and halogen-free conduit systems tailored to modern infrastructure needs.
Europe
The Europe Electrical Conduit Market size was valued at USD 1,731.94 million in 2018 to USD 2,100.93 million in 2024 and is anticipated to reach USD 3,300.58 million by 2032, at a CAGR of 5.8% during the forecast period. Europe contributes 18% of the global Electrical Conduit Market share, supported by high infrastructure standards and strict energy regulations. The region is seeing a gradual shift toward green construction, which is influencing material choices and product designs. Demand for advanced conduit systems is rising in residential renovation, smart buildings, and renewable energy facilities. It benefits from government incentives promoting energy-efficient upgrades and sustainable housing. Urban centers in countries like Germany, France, and the U.K. are adopting digital and modular infrastructure that requires structured wiring protection. The market remains stable and innovation-driven, with increased emphasis on recyclable and low-impact conduit materials.
Asia Pacific
The Asia Pacific Electrical Conduit Market size was valued at USD 1,513.89 million in 2018 to USD 1,991.66 million in 2024 and is anticipated to reach USD 3,645.90 million by 2032, at a CAGR of 7.9% during the forecast period. Asia Pacific leads the global Electrical Conduit Market with a 34% share, driven by rapid urbanization, population growth, and infrastructure development. Countries like China, India, Japan, and Indonesia are investing heavily in smart city projects, transportation networks, and industrial hubs. The region is witnessing widespread adoption of conduits in utility grids, residential construction, and commercial real estate. It also benefits from strong demand in renewable energy installations and electrification of rural areas. Competitive pricing, expanding manufacturing capabilities, and government support are strengthening regional production and exports. It continues to offer the highest growth potential among all regions.
Latin America
The Latin America Electrical Conduit Market size was valued at USD 381.28 million in 2018 to USD 475.38 million in 2024 and is anticipated to reach USD 729.31 million by 2032, at a CAGR of 5.5% during the forecast period. Latin America holds 6% of the global Electrical Conduit Market share, with growth supported by ongoing public infrastructure projects and housing initiatives. The market is gaining momentum in countries like Brazil, Mexico, and Colombia, where urban development and utility access are expanding. Rising investments in transportation, energy, and water management projects are creating steady demand for electrical conduit systems. The adoption rate remains moderate due to economic constraints and inconsistent regulatory enforcement. It is gradually benefiting from international partnerships and technology transfers aimed at improving electrical safety. Local manufacturing and supply chain efficiency are expected to enhance competitiveness in the coming years.
Middle East
The Middle East Electrical Conduit Market size was valued at USD 255.43 million in 2018 to USD 302.80 million in 2024 and is anticipated to reach USD 456.62 million by 2032, at a CAGR of 5.3% during the forecast period. The Middle East accounts for 5% of the global Electrical Conduit Market, supported by large-scale infrastructure development and urban planning initiatives. Major cities in the UAE, Saudi Arabia, and Qatar are experiencing a construction boom, especially in commercial real estate and tourism-related developments. The demand for conduit systems is growing in underground metro lines, airports, and power distribution networks. Regional governments are focusing on safety and building compliance, which is driving the use of structured wiring protection. It also sees growing interest in conduit solutions for desert environments that demand heat- and UV-resistant materials. Strategic procurement and regional integration are enabling faster adoption of international standards.
Africa
The Africa Electrical Conduit Market size was valued at USD 179.42 million in 2018 to USD 279.35 million in 2024 and is anticipated to reach USD 411.92 million by 2032, at a CAGR of 4.7% during the forecast period. Africa holds 4% of the global Electrical Conduit Market share, with growth supported by improving electricity access and urban development. Countries like South Africa, Kenya, and Nigeria are investing in residential housing, public infrastructure, and utility grid upgrades. It faces challenges related to affordability and infrastructure gaps, but rising foreign direct investment is supporting long-term development. Local governments are working to modernize construction practices and introduce updated electrical safety standards. The demand for conduit systems is increasing in both above-ground and underground applications. It presents growth opportunities for manufacturers focused on cost-effective and durable product solutions tailored to emerging markets.
Shape Your Report to Specific Countries or Regions & Enjoy 30% Off!
Key Player Analysis:
- Atkore International
- Thomas & Betts
- Schneider Electric
- Legrand
- Siemens
- General Electric
- Eaton Corporation
- Southwire Company
- Cooper Industries
- Hubbell Incorporated
- Robroy Industries
- Sekisui Chemical Co., Ltd.
- Aliaxis SA
- Dura-Line Corporation
- Anamet Electrical, Inc.
Competitive Analysis:
The Electrical Conduit Market features a mix of global and regional players competing on product quality, pricing, distribution reach, and innovation. Leading companies are focusing on expanding their product portfolios with corrosion-resistant, flame-retardant, and flexible conduit systems to meet evolving industry demands. It is witnessing increased investment in automation and sustainable material development to enhance manufacturing efficiency and reduce environmental impact. Strategic partnerships, mergers, and acquisitions are helping firms strengthen market presence and access new customer segments. Companies are also prioritizing compliance with international safety standards to expand into regulated markets. The market remains highly competitive, with players differentiating themselves through technological advancements, custom solutions, and service offerings tailored to diverse construction and industrial needs.
Recent Developments:
- In May 2025, ABB finalized the acquisition of BrightLoop, a French innovator in power electronics. This strategic purchase enhances ABB’s capabilities in electrification—particularly in applications that often rely on conduit systems for energy distribution in industrial mobility and marine sectors.
- In April 2025, Atkore completed the divestiture of its Northwest Polymers recycling business and ratified a new five-year labor agreement with the United Steelworkers at its Harvey, IL facility.
- In February 2025, Schneider Electric finalized its acquisition of a controlling interest (75%) in Motivair Corporation, a specialist in liquid cooling and thermal management for high-performance computing. Schneider plans to acquire the remaining 25% by 2028.
- In February 2025, TE Connectivity agreed to acquire Richards Manufacturing Co. This move, valuing around USD 2.3 billion in cash, strengthens TE’s position in the electrical utilities sector especially across underground grid equipment used in conduit-protected systems.
Market Concentration & Characteristics:
The Electrical Conduit Market exhibits moderate to high market concentration, with several dominant players holding significant shares in key regions. It features a well-structured supply chain supported by established manufacturers, regional distributors, and local installers. The market is characterized by strong regulatory influence, high entry barriers due to certification requirements, and consistent demand across construction, industrial, and utility sectors. Product standardization, durability, and code compliance remain critical purchase factors. It also demonstrates steady technological evolution, with growing emphasis on flexible designs, recyclable materials, and integration with smart infrastructure. Competitive pricing and after-sales support continue to shape buyer preferences across both public and private sector projects.
Report Coverage:
The research report offers an in-depth analysis based on Type, Material and Application. It details leading market players, providing an overview of their business, product offerings, investments, revenue streams, and key applications. Additionally, the report includes insights into the competitive environment, SWOT analysis, current market trends, as well as the primary drivers and constraints. Furthermore, it discusses various factors that have driven market expansion in recent years. The report also explores market dynamics, regulatory scenarios, and technological advancements that are shaping the industry. It assesses the impact of external factors and global economic changes on market growth. Lastly, it provides strategic recommendations for new entrants and established companies to navigate the complexities of the market.
Future Outlook:
- Rising investments in smart grid infrastructure will increase demand for advanced conduit systems.
- Expansion of renewable energy projects will drive conduit usage in solar and wind installations.
- Growth in modular construction will boost adoption of preassembled and flexible conduit solutions.
- Urbanization in emerging economies will create new opportunities in residential and commercial sectors.
- Advancements in halogen-free and recyclable materials will support sustainable product development.
- Increased electrification of transportation will expand conduit demand in EV charging infrastructure.
- Greater focus on workplace safety and regulatory compliance will strengthen product standardization.
- Integration with digital infrastructure will lead to demand for conduits compatible with smart systems.
- Expansion of data centers will require secure cable management, enhancing conduit market growth.
- Strategic collaborations and acquisitions will help companies expand reach and diversify offerings.


