
Vietnam households buy purifiers to close a safe water gap
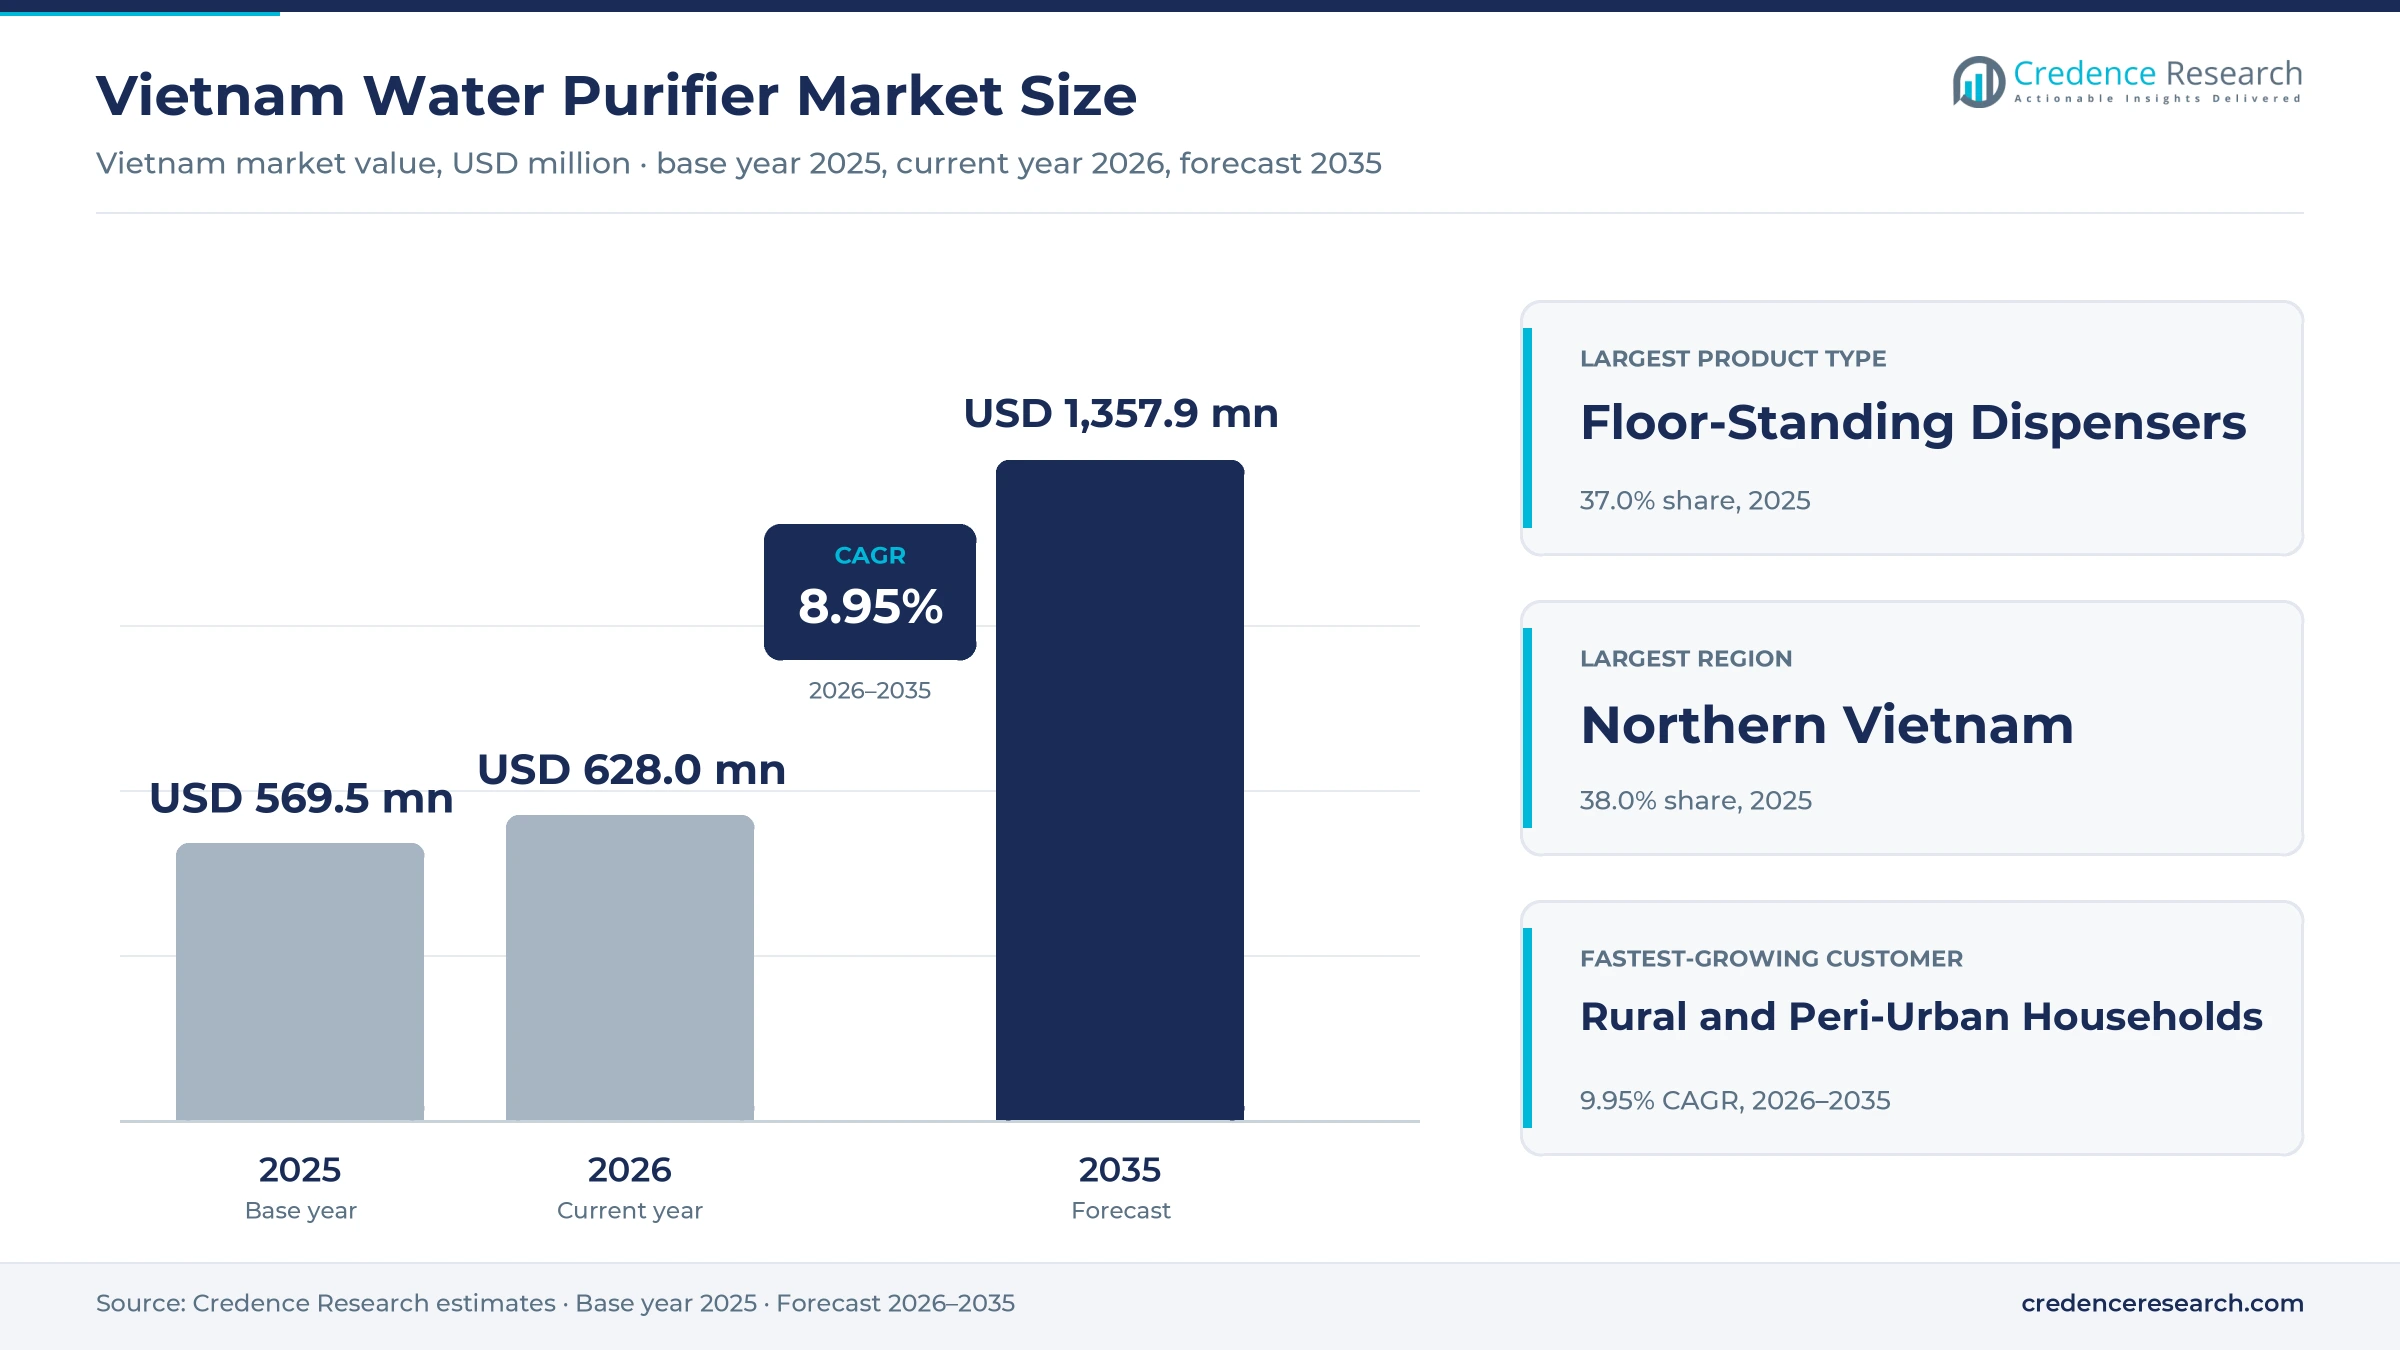
The Vietnam water purifier market was valued at USD 569.5 million in 2025 and is projected to increase from USD 628.0 million in 2026 to USD 1.36 billion by 2035, registering a CAGR of 8.95% during 2026–2035. Demand comes from households that do not trust tap or well water for drinking and cooking, and from hotels and offices that want to replace bottled water. Northern Vietnam held the largest regional share, 38.0% in 2025, because Hanoi and the Red River Delta combine dense housing with high appliance ownership and strong retail chains. The Mekong Delta is the fastest-growing region at 9.73% a year, as repeated saltwater intrusion pushes rural families toward point-of-use treatment. Floor-standing reverse osmosis dispensers led the product mix in 2025, while hydrogen and alkaline models are moving into the premium tier. A new national domestic water standard took effect in July 2025, which raises attention to tap water quality across provinces.
Which purifiers and buyers does the estimate cover?
The estimate measures the retail sales value of point-of-use water purifiers sold in Vietnam to households, small businesses and institutions. It covers countertop purifiers, under-sink purifiers, floor-standing dispensers and faucet-mounted and pitcher filters that use reverse osmosis, ultrafiltration, ultraviolet, activated carbon or multi-stage treatment. Values are stated at current prices and include sales through electronics chains, specialty dealers, brand showrooms and online platforms.
The estimate excludes municipal water treatment plants, industrial process water systems, bottled water and replacement filter cartridges sold separately after the first year of use. The value chain runs from membrane, pump and electronics suppliers through local assembly plants and importers to the brands, retail chains and service teams that install and maintain units.
Vietnam Water Purifier Market Insights
- The Vietnam water purifier market was valued at USD 569.5 million in 2025 and is projected to reach USD 1.36 billion by 2035, registering a CAGR of 8.95% during 2026–2035.
- Northern Vietnam held 38.0% of 2025 sales, because Hanoi and the Red River Delta pair dense housing with strong electronics retail.
- Floor-standing dispensers led with 37.0% of 2025 value, because cabinet reverse osmosis units are the standard kitchen purchase in Vietnam.
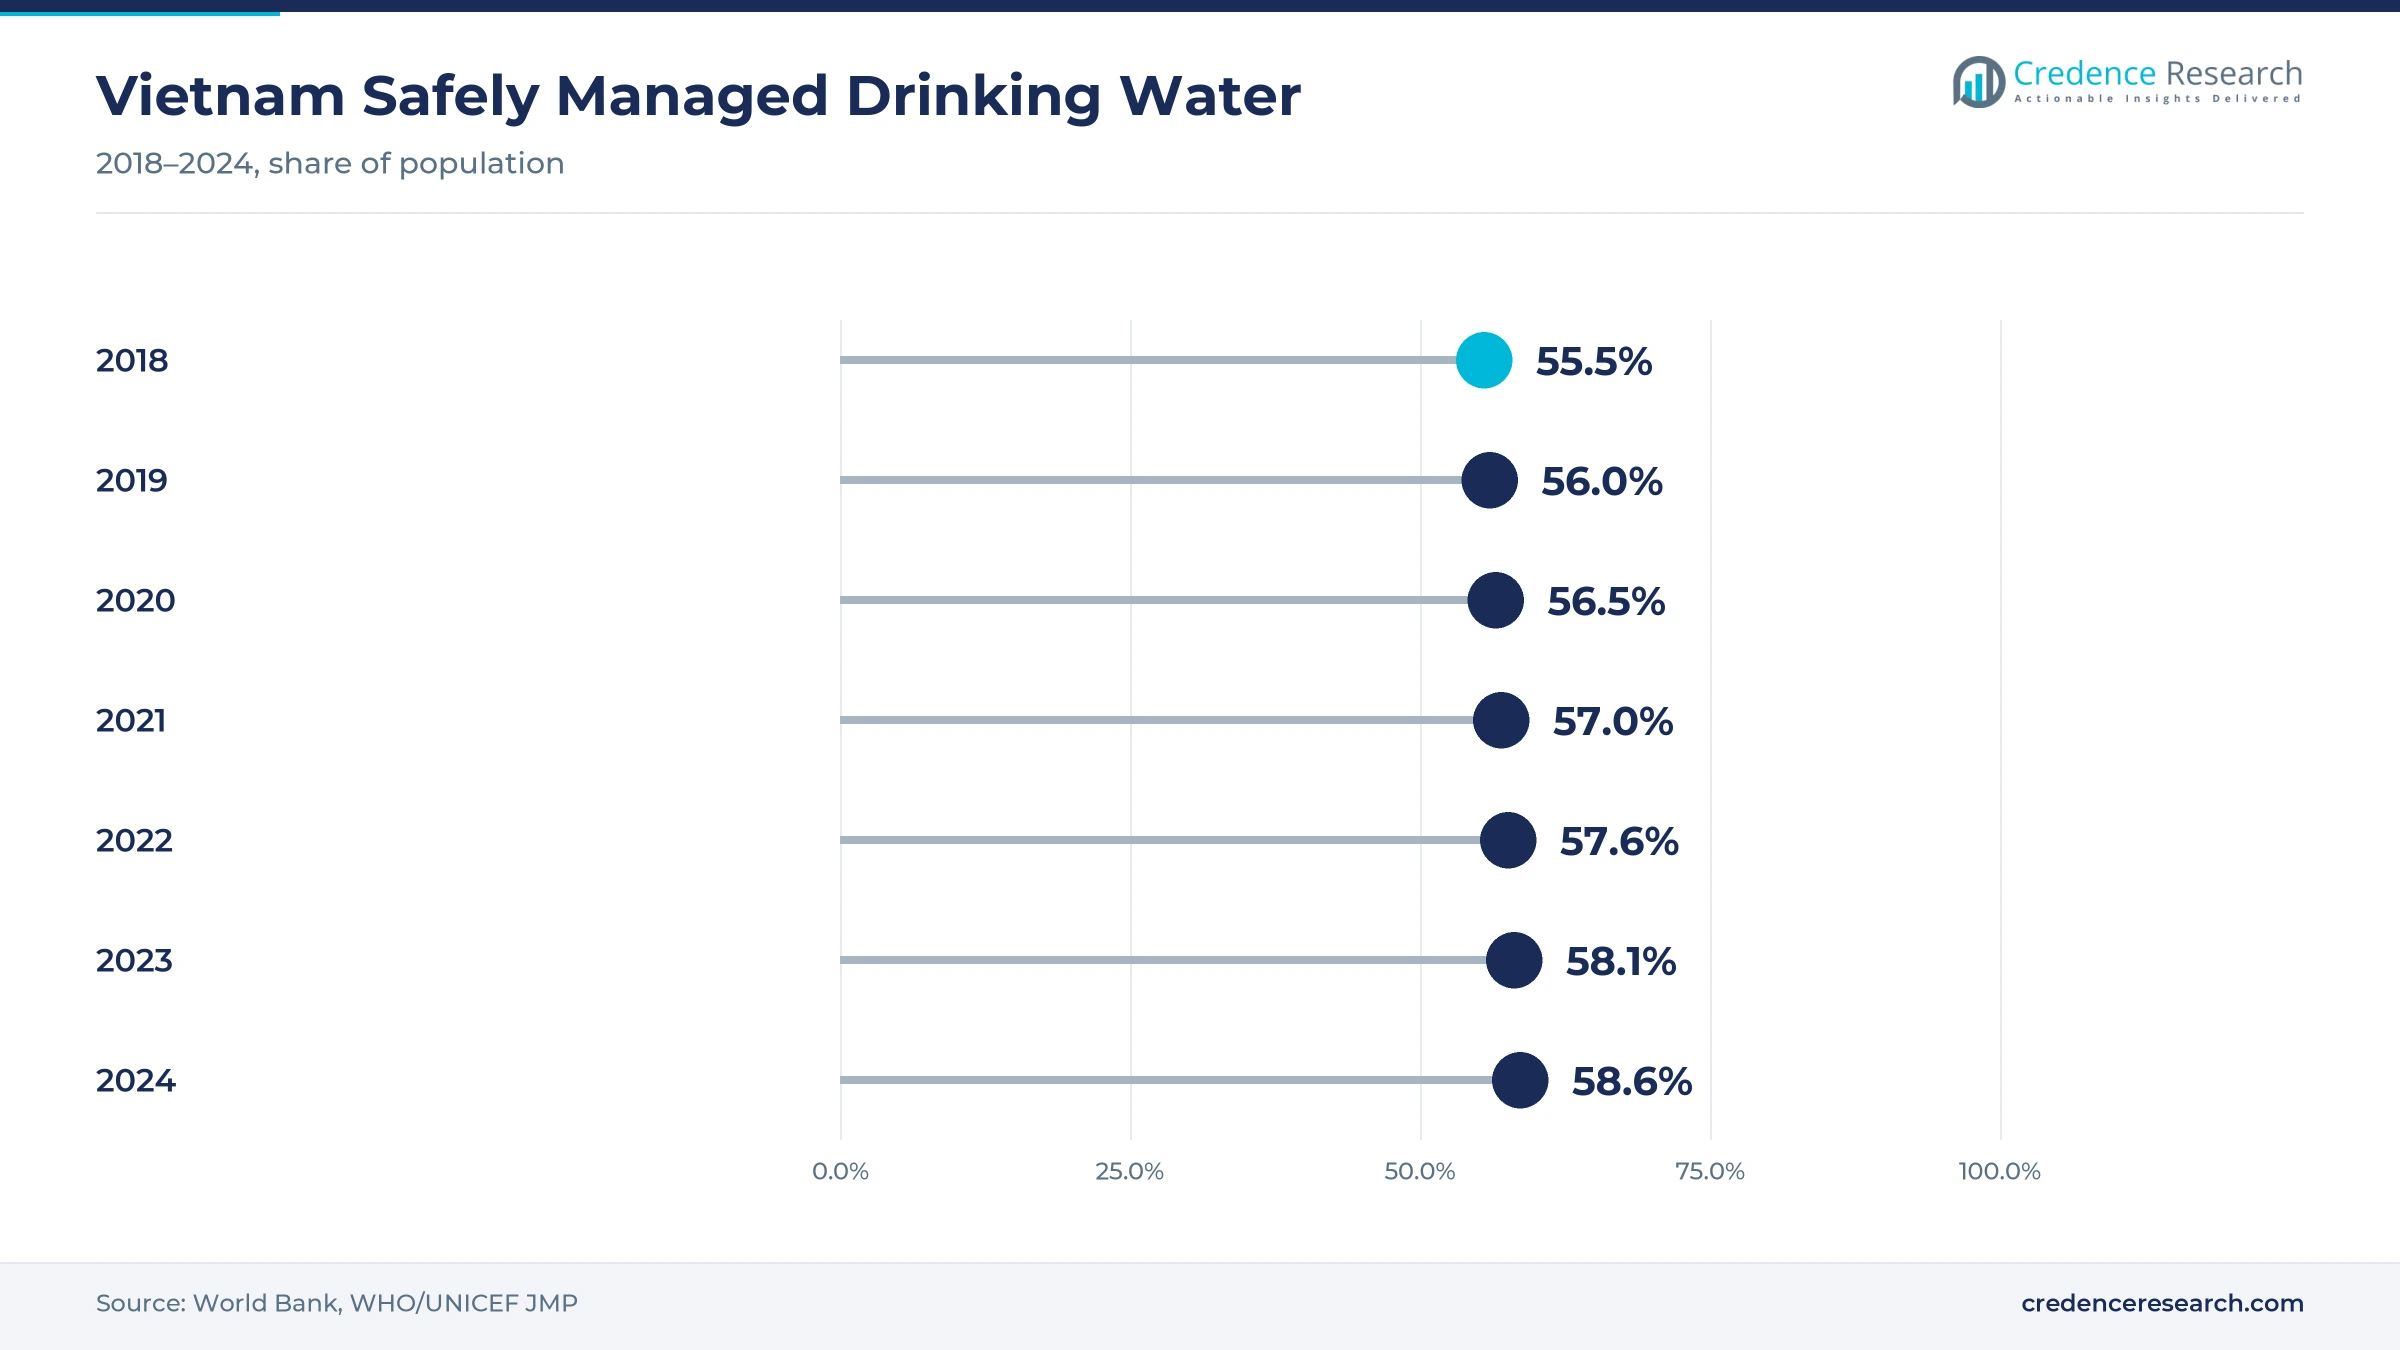
- Only 58.6% of Vietnam's population used safely managed drinking water in 2024, based on World Bank data, which keeps point-of-use treatment in demand.
- Coway Vina installed 542 purifiers across all guest rooms at New World Saigon Hotel in August 2026, which shows hotels moving away from bottled water.
Floor-standing RO units lead while under-sink models rise
Why do floor-standing dispensers lead product demand?
Based on product type, the market is categorized into countertop purifiers, under-sink purifiers, floor-standing dispensers and faucet-mounted and pitcher filters. Floor-Standing Dispensers led with 37.0% of 2025 value, because cabinet units with hot and cold taps replace both the kettle and the water jug in many kitchens. Under-Sink Purifiers grow fastest at 10.07% a year, as new apartments with fitted kitchens favor hidden units.
How dominant is reverse osmosis treatment?
Based on technology, the market is categorized into reverse osmosis, ultrafiltration, ultraviolet and activated carbon and multi-stage systems. Reverse Osmosis led with 62.0% of 2025 value, because buyers want to remove salts, heavy metals and microbes from mixed tap and well water. Activated Carbon and Multi-Stage grow fastest at 9.70% a year, as hydrogen, alkaline and mineral stages turn basic filters into premium kitchen appliances.
Which buyers account for most purifier spending?
Based on customer type, the market is categorized into urban households, rural and peri-urban households, small businesses and institutions. Urban Households led with 58.0% of 2025 value, because city apartments have higher incomes and easy access to stores. Rural and Peri-Urban Households grow fastest at 9.95% a year, as rural families with weaker piped supply buy their first purifier through installment plans and local dealers.
Which sales channels are gaining share?
Based on distribution channel, the market is categorized into consumer electronics chains, specialty dealers, brand-owned and direct sales and e-commerce platforms. Consumer Electronics Chains led with 46.0% of 2025 value, because national chains bundle delivery, installation and installment payment. E-Commerce Platforms grow fastest at 10.71% a year, as brands sell filters and new models through official online stores.
| Segment Group | Leading Sub-segment | Share, 2025 | Fastest-growing Sub-segment | CAGR, 2026–2035 |
|---|---|---|---|---|
| By Product Type | Floor-Standing Dispensers | 37.0% | Under-Sink Purifiers | 10.07% |
| By Technology | Reverse Osmosis | 62.0% | Activated Carbon and Multi-Stage | 9.70% |
| By Customer Type | Urban Households | 58.0% | Rural and Peri-Urban Households | 9.95% |
| By Distribution Channel | Consumer Electronics Chains | 46.0% | E-Commerce Platforms | 10.71% |
Request a Free Sample
Fill in your details and we'll send you a free sample report.
- Sample data tables & charts
- Research methodology
Water quality gaps, income and retail reach lift demand
How does the safely managed water gap lift demand?
The persistent gap in safely managed drinking water is the main source of demand, because households that cannot trust tap or well water buy point-of-use treatment. Only 58.6% of the population used safely managed drinking water in 2024, up from 53.9% in 2015, according to World Bank data. Coverage reached 75.8% in urban areas but only 47.0% in rural areas, which leaves a wide gap outside the cities. The Ministry of Health's Circular 52/2024/TT-BYT also replaced the earlier domestic water rules on July 1, 2025, as noted by Thai Nguyen provincial authorities. As a result, units built around reverse osmosis membranes hold 62.0% of 2025 value.
Why do rising incomes push buyers toward premium units?
Rising purchasing power pushes buyers toward premium units, because families that already own a basic filter now trade up to hot, cold and mineral models. Vietnam's GDP grew 8.02% in 2025, and GDP per capita reached about US$5,026, up US$326 from 2024, based on National Statistics Office estimates. Coway Vina launched its AIS ice-making purifier on Dec. 18, 2025, at a list price of 38 million dong or a rental of 930,000 dong a month. Karofi sells a hydro-ion S-Series with three alkaline levels, and Kangaroo markets a 10-stage hydrogen alkaline model. In turn, activated carbon and multi-stage systems become the fastest-growing technology group, as hydrogen and mineral stages spread.
How do local plants and retail chains widen access?
Local manufacturing and omnichannel retail widen access, because domestic brands can price units lower and reach buyers across provinces. Dien May Xanh launched a national clean water campaign on Nov. 2, 2024, after selling about 400,000 purifiers in five years, and it set a goal of 1 million units by 2025, according to its investor news page. The chain partnered with Kangaroo, Karofi, Sunhouse, Hoa Phat, Toshiba and Mutosi and offered 0% installments for up to 12 months. Sunhouse said in April 2025 that it runs 10 factories and has added water purifier lines. As a result, chains that also sell air conditioners hold 46.0% of 2025 value.
Why do salinity and drought episodes trigger purchases?
Salinity and drought episodes trigger purchases, because saltwater in canals and supply plants makes untreated water unsafe for drinking. The government issued a dispatch on April 8, 2024, ordering local authorities to ensure enough drinking water as the Mekong Delta faced three waves of intrusion through mid-May. Up to 96,000 households, or about 430,000 people, faced daily water shortages in 2024, as reported by Viet Nam News. About 3,000 households in Ca Mau also lacked fresh water, and tides are rising by nearly 2 cm a year. Therefore, the Mekong Delta becomes the fastest-growing zone in the forecast, as rural families buy units that remove salt.
Hydrogen units, hotel installs and rural buyers shape demand
How is the rise of hydrogen and smart units changing the mix?
The rise of hydrogen and smart units is changing the product mix, because brands now compete on health claims and app control rather than on filter stages alone. Karofi's KAE-S88 PROMAX uses seven platinum-coated titanium plates, offers pH levels of about 8.5 to 9.5 and links to the Karofi 365 app. Kangaroo's KG100HC uses a 10-stage system with a Korean-made RO Vortex membrane. Coway's AIS model adds dual LED UV care that disinfects the faucet and ice tray up to four times a day. In turn, purifiers increasingly join other smart home appliances as buyers trade up from basic filters.
Why is the shift to hotel and office installs gaining pace?
The shift to hotel and office installs is gaining pace, because operators want to cut bottled water costs and plastic waste. Coway Vina installed 542 non-electric P-350N purifiers across all guest rooms at New World Saigon Hotel, cutting monthly glass bottle use from 24,000 to 200, according to an Aug. 18, 2026, release. The company then installed 164 units at Prince Hotel Da Nang, which removes about 108,000 single-use plastic bottles a year. Coway services these units every six months under its Heart Service program. As a result, small businesses and institutions together held a growing share of new installations in 2025.
Can rural and peri-urban households open a new growth channel?
Rural and peri-urban households offer a large opening, because their safe water coverage trails the cities by almost 29 points. Only 47.0% of rural residents used safely managed drinking water in 2024, compared with 75.8% in urban areas, based on World Bank data. About 62% of the population still lived in rural areas in 2024, according to UN water data. Dien May Xanh's pay-later program also lets buyers start using a purifier with no upfront payment and 0% interest for up to 12 months. As a result, rural and peri-urban households grow at 9.95% a year, the fastest customer rate in the forecast.
Is there room for rental and online filter subscriptions?
Rental and online filter subscriptions are an opening, because many buyers prefer a monthly fee that includes cleaning and cartridge changes. Coway Vina launched its AIS purifier on Dec. 18, 2025, with a rental of 930,000 dong a month that includes periodic cleaning, maintenance and filter replacement, compared with a 38 million dong list price. The company also sends technicians every six months to replace filters on hotel units. Dien May Xanh also added an old-for-new exchange policy in November 2024, and retail chains add trade-in offers and after-sales service to keep buyers inside their channel. In turn, e-commerce platforms grow at 10.71% a year, as brands sell refills, ultrafiltration membranes and new models through official online stores.
Filter costs, weak claims and service gaps slow adoption
How do filter costs and wastewater limit use?
Filter replacement costs limit regular use, because households must change several cartridges each year to keep units safe. Many buyers delay replacement after the warranty period, which lowers water quality and damages trust in the product. Reverse osmosis units also discharge reject water, which concerns families in areas with weak supply. As a result, brands now promote longer-life filters, water-saving membranes and reminder apps that tell users when a change is due.
Why do weak health claims hurt buyer trust?
Weak health claims hurt buyer trust, because many listings promise mineral, alkaline or hydrogen benefits without independent testing. Shoppers who compare online offers often cannot tell certified units from cheap copies. In turn, low-quality purifiers that fail early push some families back to bottled water. Leading brands respond by citing Ministry of Health bottled water standards, publishing laboratory results and selling through authorized dealers with clear warranties.
How does price competition squeeze margins?
Price competition squeezes margins, because local brands, imports and retailer promotions all target the same mid-market kitchen buyer. Frequent discount campaigns train shoppers to wait for sales, which slows full-price demand. As a result, smaller assemblers struggle to fund research and service networks. Brands respond with tiered model ranges, bundled filter packs and installment plans that protect average selling prices while keeping entry models within reach of rural households.
Why do service gaps slow rural adoption?
Service gaps slow rural adoption, because purifiers need installation, water testing and regular filter changes that small towns often lack. Dealers in remote districts may carry few spare parts, which leaves broken units idle for weeks. In turn, families hesitate to buy a second unit or upgrade. Brands respond by training local technicians, expanding authorized service points and using retail chain networks to schedule visits across provinces.
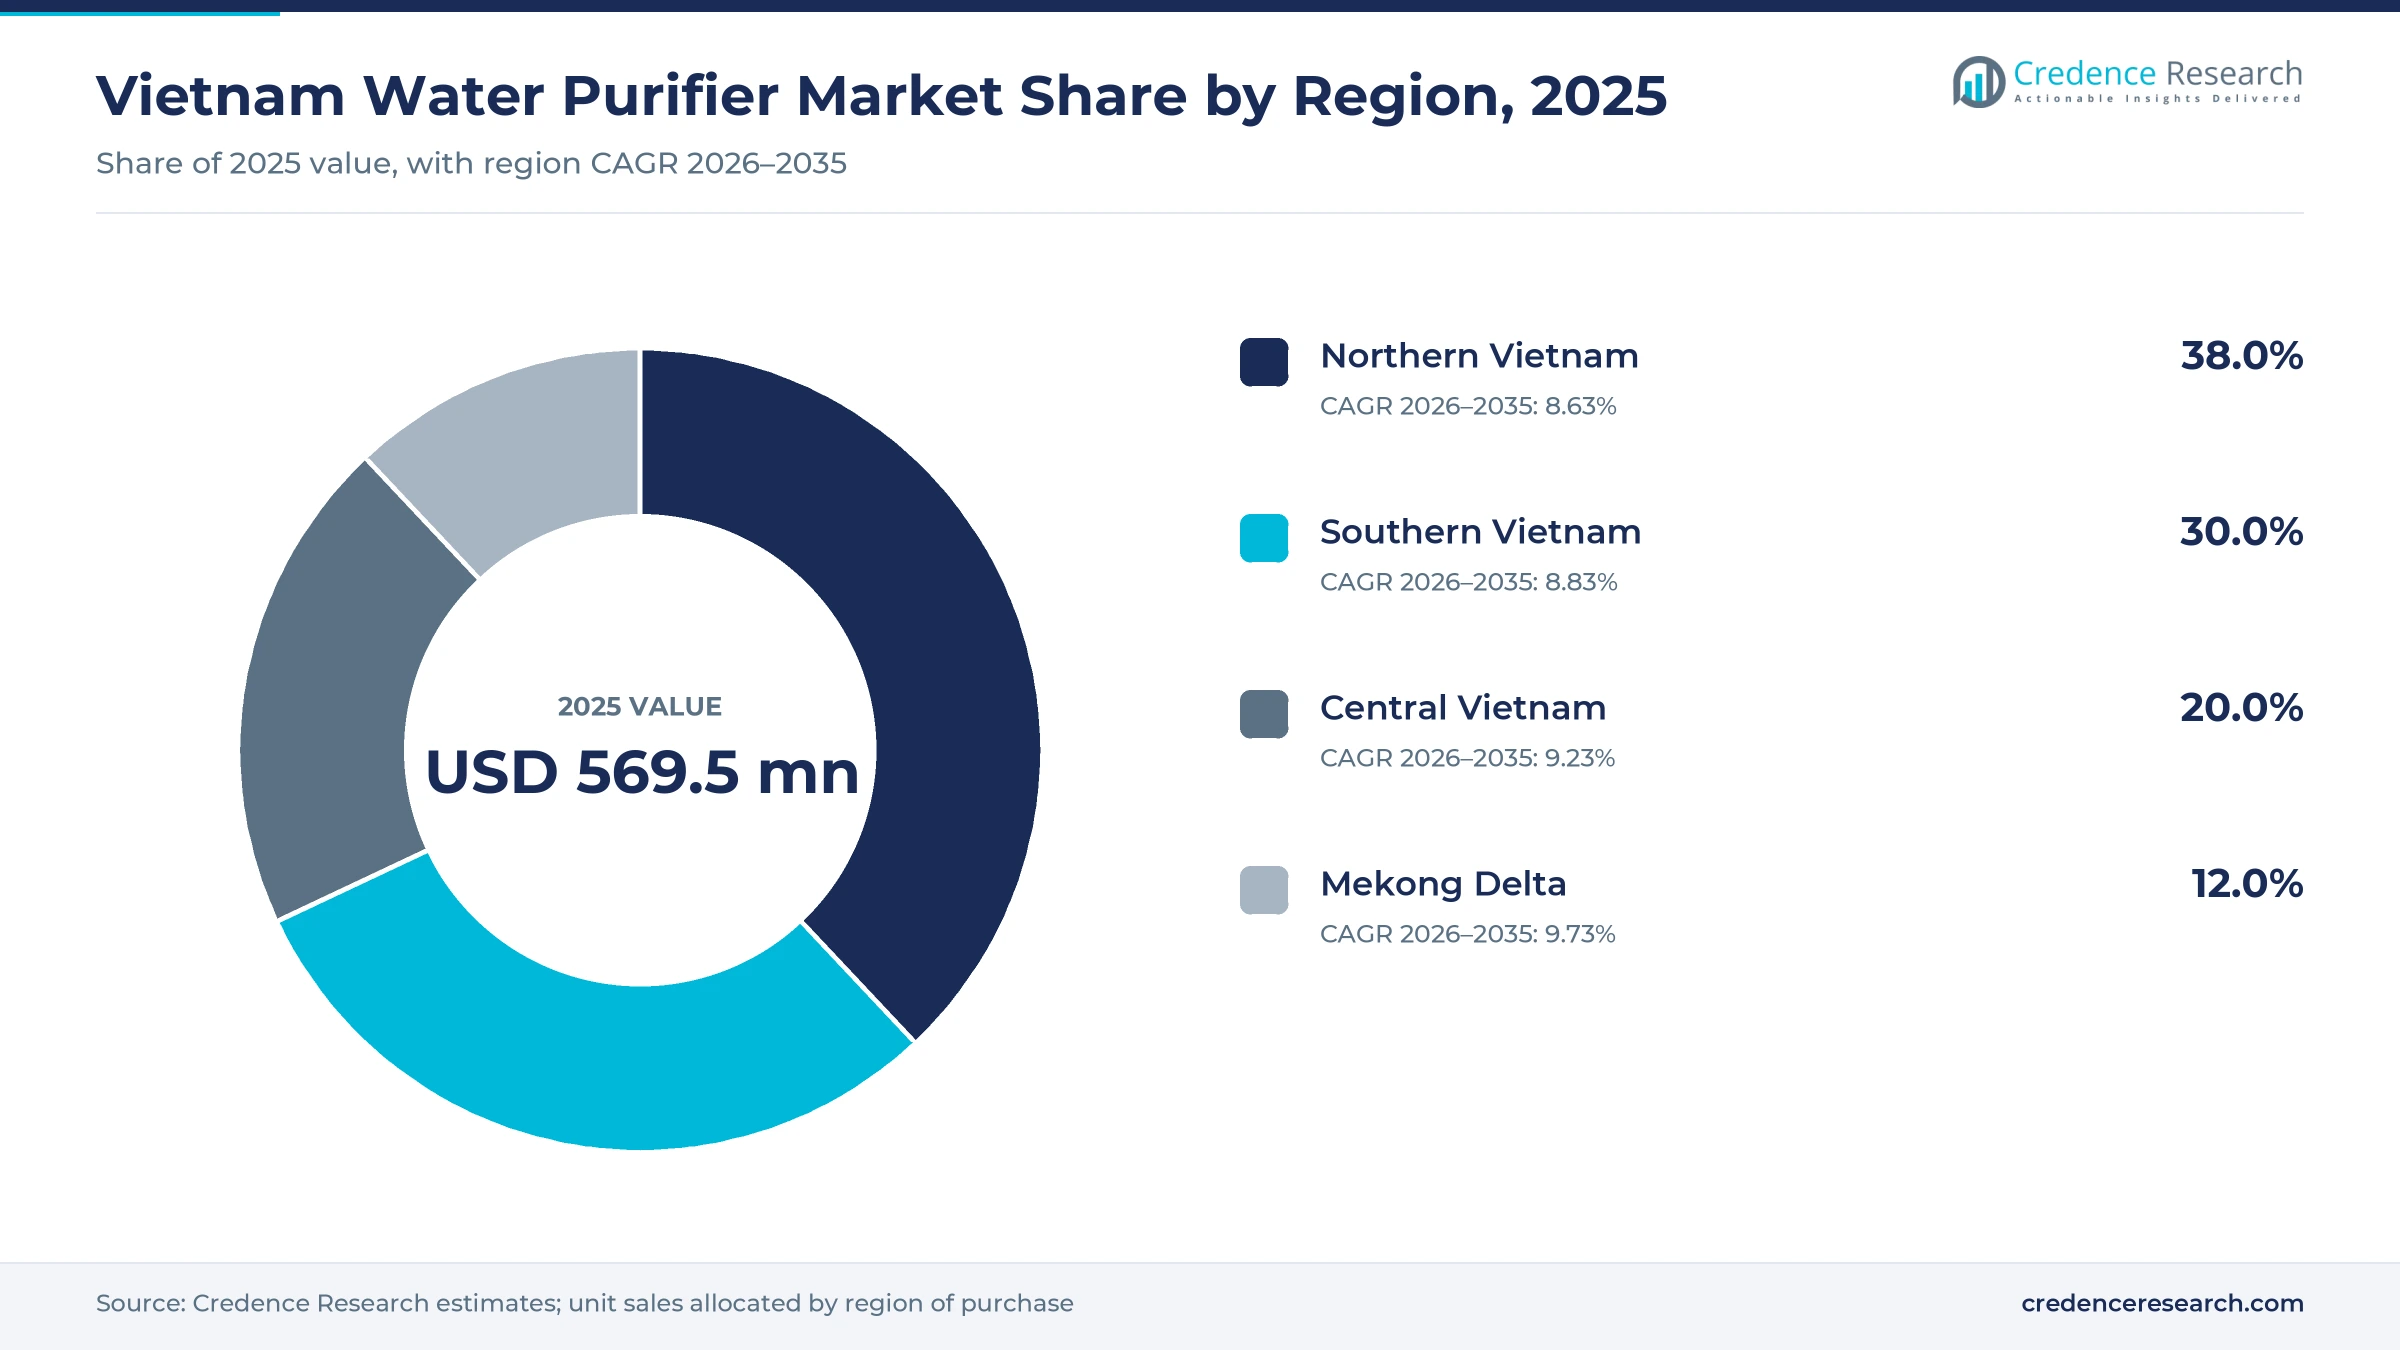
The north leads while the Mekong Delta grows fastest
| Region | Value, 2025 (USD million) | Share, 2025 | CAGR, 2026–2035 |
|---|---|---|---|
| Northern Vietnam | 216.4 | 38.0% | 8.63% |
| Southern Vietnam | 170.8 | 30.0% | 8.83% |
| Central Vietnam | 113.9 | 20.0% | 9.23% |
| Mekong Delta | 68.3 | 12.0% | 9.73% |
Why does Northern Vietnam hold the largest share?
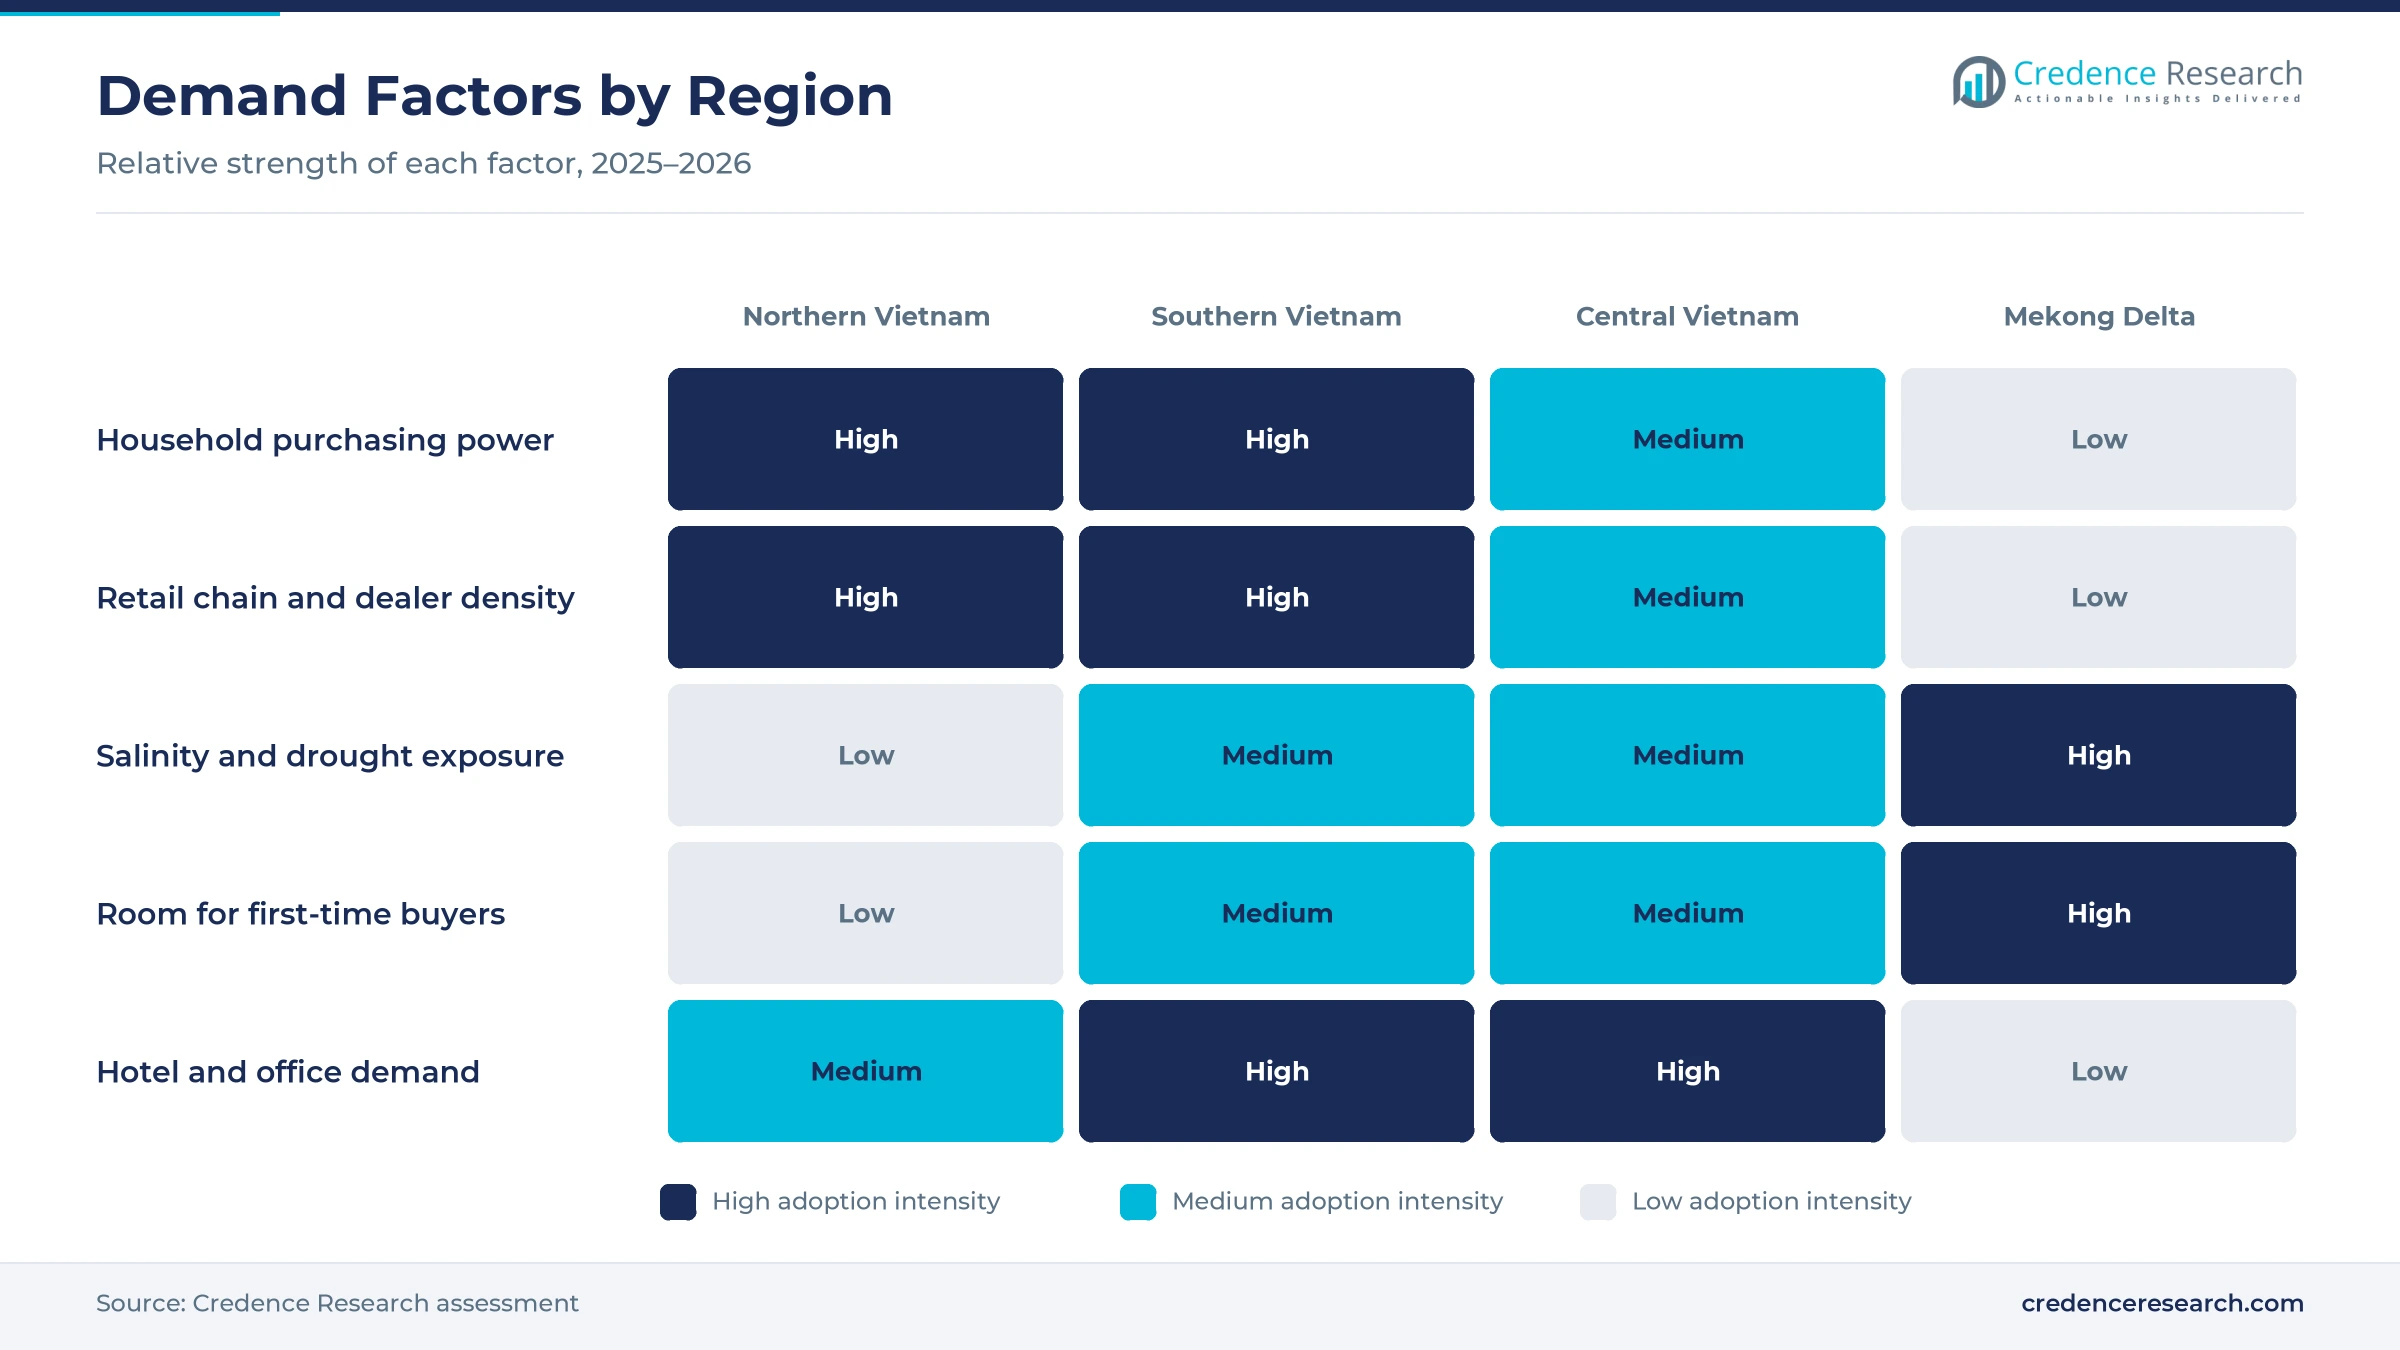
Northern Vietnam held 38.0% of 2025 value and grows at 8.63% a year, because Hanoi and the Red River Delta combine dense apartment housing with high appliance ownership. Many households in peri-urban districts still use private wells and mixed supply, which keeps reverse osmosis units in demand. National electronics chains and brand dealers also have their densest store coverage in the capital region. However, growth slows as most city homes already own a purifier.
How does Southern Vietnam add volume?
Southern Vietnam held 30.0% of 2025 value and grows at 8.83% a year, because Ho Chi Minh City and its industrial provinces have the largest pool of middle-income households. Saltwater affecting supply plants in 2024 also shortened tap water hours in some districts, which pushed residents toward home treatment. In turn, premium launches such as Coway's AIS purifier start in Ho Chi Minh City showrooms. Hotels and offices in the city also lead commercial installs.
What drives demand in Central Vietnam?
Central Vietnam held 20.0% of 2025 value and grows at 9.23% a year, because coastal provinces face seasonal floods, dry spells and uneven piped supply outside the main cities. Tourism cities such as Da Nang and Nha Trang add hotel demand, as shown by Coway's 164-unit installation at Prince Hotel Da Nang in 2026. However, rural districts have fewer dealers, which makes electronics chains and online platforms important for reaching new buyers across the region.
Why is the Mekong Delta growing fastest?
The Mekong Delta held 12.0% of 2025 value and grows fastest at 9.73% a year, because repeated drought and saltwater intrusion make canal and well water unsafe in many districts. Up to 96,000 households faced daily shortages in 2024, which raised demand for units that remove salt. As a result, retail chains and dealers promote reverse osmosis models and installment plans, and first-time buyers in rural areas lift volume through 2035.
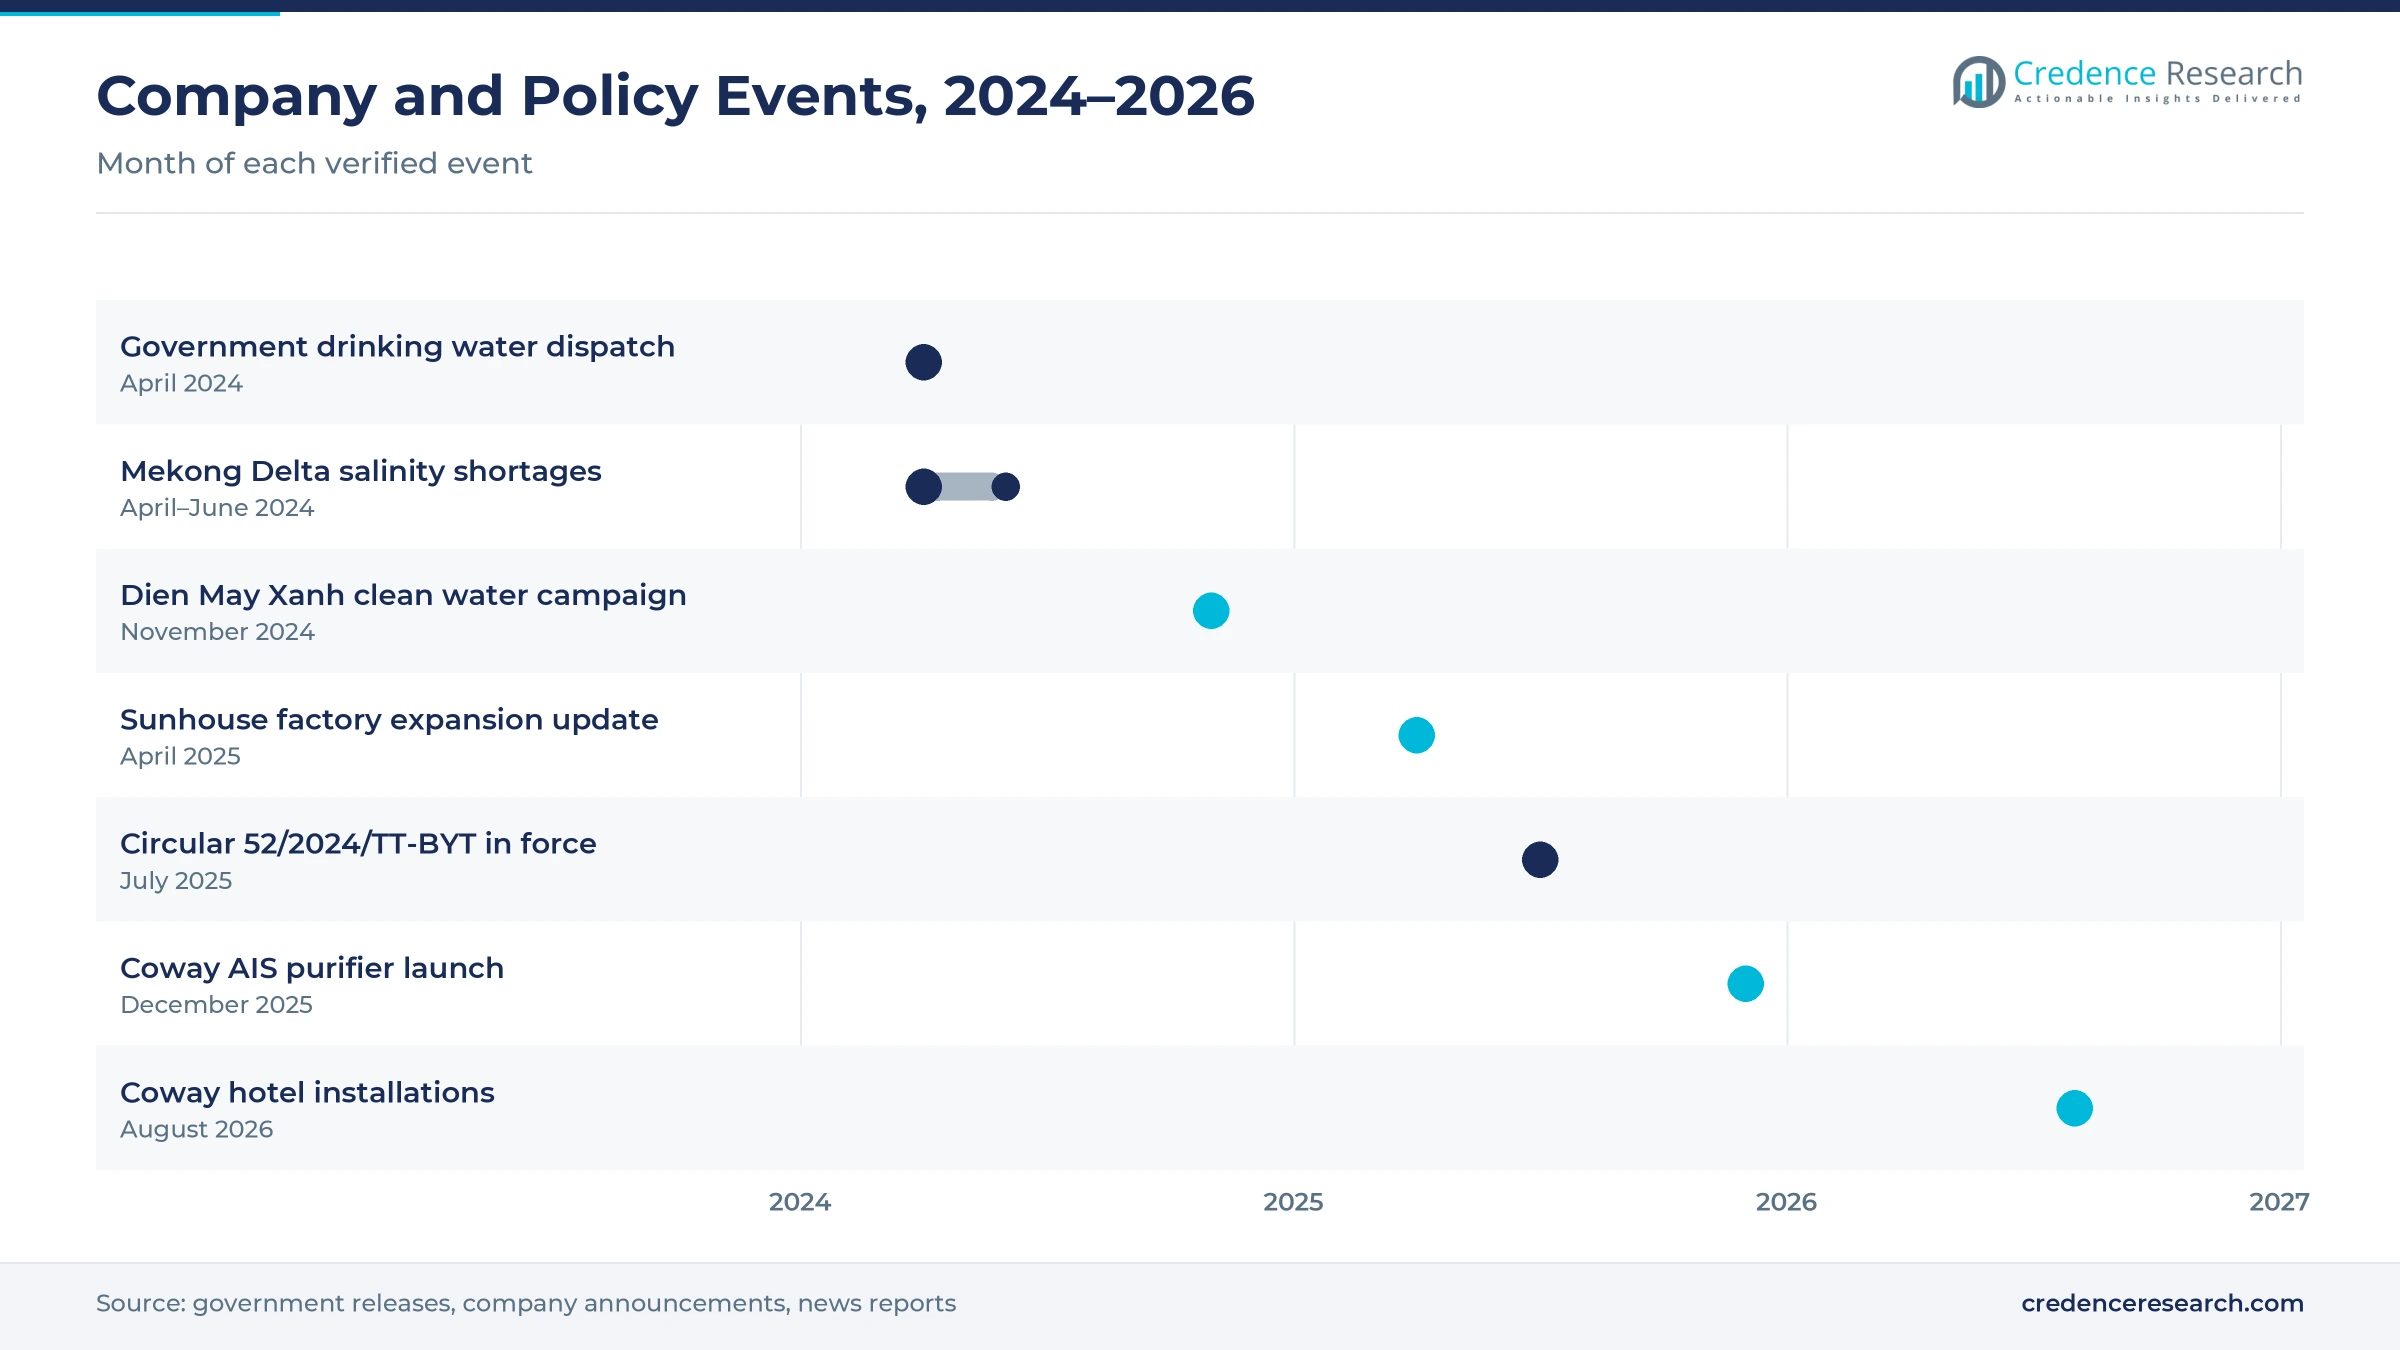
Retail drives, water rules and hotel deals shaped 2024–2026
| Development | Status and market relevance |
|---|---|
| In April 2024, the government issued a dispatch ordering local authorities to ensure drinking water during Mekong Delta salinity. | Raised household attention to safe drinking water |
| In November 2024, Dien May Xanh launched a national clean water campaign with six purifier brands. | Targets wider household reach with 0% installments |
| In July 2025, Circular 52/2024/TT-BYT on domestic water quality took effect nationwide. | Updates tap water rules and local monitoring |
| In December 2025, Coway Vina launched its AIS ice-making purifier in Ho Chi Minh City. | Adds a premium unit with purchase and rental options |
| In August 2026, Coway Vina installed purifiers in all guest rooms at New World Saigon Hotel and Prince Hotel Da Nang. | Expands hotel demand as operators cut bottled water |
RO, hydrogen modules and app control change the product mix
- Reverse osmosis membranes remove salts, metals and microbes from mixed tap and well water, which makes them the default choice in areas with salinity.
- Hydrogen and alkaline modules use electrolysis or magnets to change pH and add hydrogen, which lets brands position purifiers as premium health appliances.
- LED ultraviolet care disinfects faucets, tanks and ice trays several times a day, which lowers bacteria risk in hot and cold dispensers.
- App-linked service tracks filter life and sends reminders through apps such as Karofi 365, which helps brands sell refills and maintenance plans.
Need a Custom Version of This Report?
Tailor the scope, geography, or segments to your exact requirements.
- Custom geography or segment scope
- Direct access to our analyst team
Local appliance brands compete with Korean rental leaders
Competition is led by Vietnamese appliance groups that sell through national electronics chains and dense dealer networks. Karofi, Kangaroo, Sunhouse and Mutosi compete on reverse osmosis cabinet units, hot and cold dispensers and hydrogen or alkaline models, and all four sell through Dien May Xanh. Kangaroo promotes patented hydrogen alkaline technology, while Karofi adds voice control and app monitoring to its premium S-Series. Sunhouse builds purifiers in its own domestic factories, which supports low-cost entry models. Coway Vina, established in 2020, competes through rental plans, showrooms in Hanoi and Ho Chi Minh City and hotel contracts. Toshiba, Panasonic, AO Smith, Cuckoo and Dai Viet compete in premium and mid-market tiers. Rivals compete on price, filter life, health features, installment offers and service speed, while retail chain campaigns decide much of the volume.
Companies profiled and their roles in this market
| Company | Type | Role in the market |
|---|---|---|
| KAROFI Group Joint Stock Company | Domestic brand | Sells hydro-ion S-Series purifiers with app monitoring |
| Kangaroo International Joint Venture Company | Domestic brand | Markets 10-stage hydrogen alkaline purifiers |
| SUNHOUSE Group Joint Stock Company | Domestic manufacturer | Added water purifier lines across its 10 factories |
| Mutosi Group Joint Stock Company | Domestic brand | Partner brand in Dien May Xanh's 2024 clean water campaign |
| Coway Vina Co., Ltd. | Rental and direct seller | Launched AIS purifier in 2025 and hotel installs in 2026 |
Credence Research view on rural reach and service
Credence Research's view is that Vietnamese purifier spending will grow faster than overall appliance sales because safe water coverage remains well below urban levels in rural provinces. Salinity, drought and new water rules keep households alert to water quality, while rising incomes support premium upgrades. However, filter costs, weak claims and thin rural service will keep some buyers cautious. Brands that pair affordable reverse osmosis units with installment plans, verified test results and local technicians should gain share fastest through 2035, especially in the Mekong Delta and Central Vietnam.
How the Vietnam purifier spending estimate was built
The report uses 2025 as the base year on a calendar basis, and market values come from the Credence Research model. That model combines safe water coverage data from the World Bank, national income statistics, retailer and company disclosures and typical retail prices by product type. Segment and regional splits are Credence Research estimates based on population, water source quality and retail reach by zone. Sources used are government releases, company announcements, news reports and statistical databases, and no interviews or surveys were used.
Rural demand and premium upgrades carry growth to 2035
Purifier sales are expected to reach USD 1.36 billion by 2035, an 8.95% CAGR during 2026–2035, as safe water gaps, rising incomes and retail reach keep demand strong. Growth should stay high through 2028 while rural households buy first units and city homes move to premium hydrogen and under-sink models. After that, filter subscriptions, rental plans and commercial installs will add steady value as urban ownership matures. Faster expansion of safe piped water would lower this outlook, while more salinity events would raise it. Under-sink purifiers are expected to grow at 10.07% a year, the fastest product rate.
Frequently Asked Questions
How big is the Vietnam water purifier market?
Which product type leads purifier sales in Vietnam?
Which region leads the Vietnam water purifier market?
Which technology dominates purifier demand?
What drives purifier demand in Vietnam?
Which buyers are growing fastest?
Who are the leading water purifier brands in Vietnam?
What are the main challenges for purifier brands?
Table of Content
Chapter 1 Market Segmentation
- 1.1 Segmentation Framework
- 1.1.1 Product and Service Classification
- 1.1.2 Application and End-Use Classification
- 1.1.3 Technology and Solution Classification
- 1.1.4 Customer and Distribution Channel Classification
- 1.1.5 Geographic Segmentation
- 1.1.6 Market Segment Definitions and Boundaries
- 1.2 By Product Type
- 1.2.1 Floor-Standing Dispensers
- 1.2.2 Countertop Purifiers
- 1.2.3 Under-Sink Purifiers
- 1.2.4 Faucet-Mounted and Pitcher Filters
- 1.3 By Technology
- 1.3.1 Reverse Osmosis
- 1.3.2 Ultrafiltration
- 1.3.3 Ultraviolet
- 1.3.4 Activated Carbon and Multi-Stage
- 1.4 By Customer Type
- 1.4.1 Urban Households
- 1.4.2 Rural and Peri-Urban Households
- 1.4.3 Small Businesses
- 1.4.4 Institutions
Chapter 2 Introduction
- 2.1 Report Objectives and Scope
- 2.2 Product Definition and Industry Terminology
- 2.3 Market Inclusions and Exclusions
- 2.4 Research Process
- 2.4.1 Primary Research and Expert Interviews
- 2.4.2 Secondary Research and Source Review
- 2.4.3 Top-Down and Bottom-Up Estimation
- 2.4.4 Data Triangulation and Verification
- 2.5 Market Size Measurement Basis
- 2.5.1 2025: USD 569.5 million → 2035: USD 1.36 billion
- 2.6 Historical and Forecast Reference Periods
- 2.6.1 Historical Period: 2018-2025
- 2.6.2 Base Year: 2025
- 2.6.3 Forecast Period: 2025-2035
- 2.7 Research Assumptions and Limitations
Chapter 3 Executive Summary
- 3.1 Market Snapshot and Key Findings
- 3.2 Base-Year Market Size, 2025
- 3.3 Forecast Market Size, 2035
- 3.4 Revenue and Volume Growth Outlook
- 3.5 Key Demand and Supply Indicators
- 3.6 Leading Market Segments
- 3.7 Fastest-Growing Market Opportunities
- 3.8 Regional Performance Highlights
- 3.9 Technology and Industry Transformation
- 3.10 Competitive Landscape Summary
- 3.11 Analyst View and Strategic Implications
Chapter 4 Vietnam Water Purifier Market Trends and Developments
- 4.1 Historical Industry Development, 2018-2025
- 4.2 Recent Market Trends and Developments
- 4.3 Demand and Customer Behavior Trends
- 4.4 Technology and Product Innovation
- 4.5 Artificial Intelligence, Automation and Digitalization
- 4.6 Local Manufacturing and Supply Chain Realignment
- 4.7 Industry Partnerships, Mergers and Acquisitions
- 4.8 Sustainability and Circular Economy Developments
- 4.9 Government and Private Sector Investment Trends
- 4.10 Emerging Business Models and Commercialization
- 4.11 Industry Developments and Announcements
Chapter 5 Vietnam Water Purifier Market Production, Supply and Demand Analysis
- 5.1 Demand Trend and Consumption Analysis, 2018-2025
- 5.2 Demand Forecast, 2025-2035
- 5.3 Production and Output Trend, 2018-2025
- 5.4 Production and Output Forecast, 2025-2035
- 5.5 Installed Capacity and Capacity Utilization
- 5.6 Company-Wise Production Plants and Statistics
- 5.6.1 Installed Production Capacity
- 5.6.2 Actual Production
- 5.6.3 Planned Capacity and Expansion Targets
- 5.7 Supply Chain Structure and Procurement Trends
- 5.8 Supply-Demand Gap and Bottlenecks
- 5.9 Import Dependence and Sourcing Structure
- 5.10 Contract Manufacturing and Outsourcing
- 5.11 Regional Supply and Demand Concentration
Chapter 6 Vietnam Water Purifier Market Pricing Analysis
- 6.1 Pricing Structure and Measurement
- 6.2 Historical Pricing Trends, 2018-2025
- 6.3 Pricing Outlook, 2025-2035
- 6.4 Average Selling Price and Unit Economics
- 6.5 Pricing by Product and Market Segment
- 6.6 Geographic Pricing Differences
- 6.7 Key Input, Energy, Labor and Logistics Costs
- 6.8 Contract Pricing and Purchasing Models
- 6.9 Pricing Sensitivity and Competitive Positioning
- 6.10 Price, Margin and Profitability Implications
Chapter 7 Vietnam Water Purifier Market Dynamics
- 7.1 Market Growth Drivers
- 7.1.1 Demand-Side Drivers
- 7.1.2 Technology and Innovation Drivers
- 7.1.3 Infrastructure and Investment Drivers
- 7.1.4 Regulatory and Policy Drivers
- 7.2 Market Restraints
- 7.2.1 Cost and Affordability Constraints
- 7.2.2 Technology and Adoption Barriers
- 7.2.3 Supply Chain and Operational Constraints
- 7.3 Market Challenges
- 7.3.1 Competitive Pressure and Margin Erosion
- 7.3.2 Skills, Infrastructure and Implementation Gaps
- 7.4 Emerging Market Opportunities
- 7.5 Market Dynamics Impact and Time-Horizon Assessment
Chapter 8 Vietnam Water Purifier Value Chain Analysis
- 8.1 Industry Value Chain Overview
- 8.2 Upstream Suppliers and Critical Inputs
- 8.3 Technology and Component Providers
- 8.4 Manufacturing or Service Delivery
- 8.5 Distribution, Channel Partners and Integrators
- 8.6 Downstream Applications and End Users
- 8.7 Value Addition and Profit Pools
- 8.8 Vertical Integration and Outsourcing
- 8.9 Supplier Concentration and Risk
- 8.10 Supply Chain Localization and Resilience
Chapter 9 Vietnam Water Purifier Market Regulations and Policies
- 9.1 Relevant Laws, Standards and Compliance Frameworks
- 9.2 Product, Service, Safety and Quality Requirements
- 9.3 Government Policies, Incentives and Subsidies
- 9.4 Imports, Exports and Trade Barriers
- 9.5 Public Procurement and Local Content Requirements
- 9.6 Environmental and Sustainability Compliance
- 9.7 Upcoming Policy Changes and Market Implications
Chapter 10 Vietnam Water Purifier Market Hotspots and Opportunities
- 10.1 Market Opportunity Mapping and Growth Hotspots
- 10.2 High-Growth Applications and Customer Groups
- 10.3 Underserved Markets and White-Space Opportunities
- 10.4 Emerging Technology and Product Opportunities
- 10.5 New Capacity and Investment Hotspots
- 10.6 Market Entry and Expansion Opportunities
- 10.7 Distribution and Partnership Opportunities
- 10.8 Near-Term and Long-Term Commercial Potential
- 10.9 Opportunity Attractiveness and Execution Risks
Chapter 11 Vietnam Water Purifier Market Outlook, 2025-2035
- 11.1 Market Size and Analysis
- 11.1.1 Revenue (Market Measurement: 2025: USD 569.5 million → 2035: USD 1.36 billion)
- 11.1.2 Market Volume and Quantity Sold
- 11.1.3 Historical Market Size, 2018-2025
- 11.1.4 Base-Year Market Size, 2025
- 11.2 Market Forecast, 2025-2035
- 11.2.1 Revenue Forecast to 2035
- 11.2.2 Volume Forecast to 2035
- 11.2.3 CAGR and Year-on-Year Growth
- 11.2.4 Incremental Revenue Opportunity
- 11.3 Forecast Assumptions and Scenario Analysis
- 11.3.1 Base-Case Forecast
- 11.3.2 Optimistic and Conservative Scenarios
- 11.3.3 Technology, Pricing and Policy Sensitivities
- 11.4 Market Attractiveness and Growth Outlook
Chapter 12 Vietnam Water Purifier Market Segmentation and Outlook
- 12.1 Segmentation Summary and Market Shares, 2025
- 12.2 Largest and Fastest-Growing Segments
- 12.3 By Product Type - Market Size and Forecast, 2025-2035
- 12.3.1 Segment Definition and Scope
- 12.3.2 Historical Market Size, 2018-2025
- 12.3.3 Revenue Forecast, 2025-2035
- 12.3.4 Volume Forecast, 2025-2035
- 12.3.5 Base-Year Market Share, 2025
- 12.3.6 Segment CAGR and Growth Drivers
- 12.3.7 Subsegment Market Size and Forecast
- 12.3.7.1 Floor-Standing Dispensers
- 12.3.7.2 Countertop Purifiers
- 12.3.7.3 Under-Sink Purifiers
- 12.3.7.4 Faucet-Mounted and Pitcher Filters
- 12.3.8 Subsegment Pricing and Adoption Trends
- 12.3.9 Leading Suppliers and Competition
- 12.3.10 Regional Demand and Opportunities
- 12.4 By Technology - Market Size and Forecast, 2025-2035
- 12.4.1 Segment Definition and Scope
- 12.4.2 Historical Market Size, 2018-2025
- 12.4.3 Revenue Forecast, 2025-2035
- 12.4.4 Volume Forecast, 2025-2035
- 12.4.5 Base-Year Market Share, 2025
- 12.4.6 Segment CAGR and Growth Drivers
- 12.4.7 Subsegment Market Size and Forecast
- 12.4.7.1 Reverse Osmosis
- 12.4.7.2 Ultrafiltration
- 12.4.7.3 Ultraviolet
- 12.4.7.4 Activated Carbon and Multi-Stage
- 12.4.8 Subsegment Pricing and Adoption Trends
- 12.4.9 Leading Suppliers and Competition
- 12.4.10 Regional Demand and Opportunities
- 12.5 By Customer Type - Market Size and Forecast, 2025-2035
- 12.5.1 Segment Definition and Scope
- 12.5.2 Historical Market Size, 2018-2025
- 12.5.3 Revenue Forecast, 2025-2035
- 12.5.4 Volume Forecast, 2025-2035
- 12.5.5 Base-Year Market Share, 2025
- 12.5.6 Segment CAGR and Growth Drivers
- 12.5.7 Subsegment Market Size and Forecast
- 12.5.7.1 Urban Households
- 12.5.7.2 Rural and Peri-Urban Households
- 12.5.7.3 Small Businesses
- 12.5.7.4 Institutions
- 12.5.8 Subsegment Pricing and Adoption Trends
- 12.5.9 Leading Suppliers and Competition
- 12.5.10 Regional Demand and Opportunities
- 12.6 Segment Growth Comparison
- 12.7 Segment Attractiveness and Priority Matrix
Chapter 13 Vietnam Water Purifier End-Use and Application Market Outlook
- 13.1 End-Use Industry and Customer Demand Structure
- 13.2 Leading Applications and Customer Groups
- 13.3 End-Use Market Size, Share and Forecast
- 13.4 Major End-Use Industry Deep Dives
- 13.4.1 Customer Requirements and Use Cases
- 13.4.2 Demand and Replacement Cycles
- 13.4.3 Technical and Regulatory Considerations
- 13.4.4 Purchasing and Procurement Models
- 13.4.5 Leading Vendors and Distribution Channels
- 13.4.6 Forecast and Commercial Opportunities
- 13.5 Emerging Applications and Cross-Segment Demand
- 13.6 End-Use Industry Investment Priorities
Chapter 14 Vietnam Water Purifier Geographic Market Outlook, 2025-2035
- 14.1 Regional Market Size and Country-Level Shares, 2025
- 14.2 Country Market Size Comparison, 2025
- 14.3 Country Market Forecasts, 2025-2035
- 14.4 Subregional Industrial and Demand Clusters
- 14.5 Intra-Regional Pricing and Cost Differences
- 14.6 Cross-Border Trade and Supply Networks
- 14.7 Regional Supply and Demand Balances
- 14.8 Country Opportunity Comparison and Prioritization
Note: Every listed country is covered on the structure shown under the first country.
Chapter 15 Vietnam Water Purifier Technology, Innovation and Sustainability Outlook
- 15.1 Technology Landscape and Maturity
- 15.2 Product, Process and Service Innovation
- 15.3 AI, Automation and Digital Tools in the Industry
- 15.4 Technology Adoption and Performance Benchmarking
- 15.5 Innovation Pipeline and R&D Investment
- 15.6 Patent and Intellectual Property Trends
- 15.7 Energy Efficiency and Resource Management
- 15.8 Sustainability, Recycling and Circularity
- 15.9 Technology Roadmap, 2025-2035
- 15.10 Risks of Obsolescence and Technology Substitution
Chapter 16 Vietnam Water Purifier Market Key Strategic Imperatives
- 16.1 Growth and Market Entry Priorities
- 16.2 High-Return Products and Segments
- 16.3 Pricing, Profitability and Cost Optimization
- 16.4 Technology Investment and Product Differentiation
- 16.5 Supply Chain Localization and Resilience
- 16.6 Distribution and Customer Acquisition
- 16.7 Partnership, Acquisition and Capacity Strategy
- 16.8 Regional Expansion Priorities
- 16.9 Short-, Medium- and Long-Term Actions
Chapter 17 Competition Outlook
- 17.1 Industry Competition Characteristics
- 17.2 Market Structure and Concentration
- 17.3 Market Share and Competitive Positioning, 2025
- 17.4 Company-Wise Revenue and Product Benchmarking
- 17.5 Production and Service Capacity Benchmarking
- 17.6 Technology, Pricing and Differentiation
- 17.7 Regional Footprint and Distribution Strength
- 17.8 Mergers, Acquisitions and Strategic Alliances
- 17.9 New Entrants and Competitive Threats
- 17.10 Porter's Five Forces and Industry Attractiveness
- 17.11 Competitive Outlook, 2025-2035
Chapter 18 Company Profiles
- 18.1 Company Coverage and Selection Criteria
- 18.2 KAROFI Group Joint Stock Company
- 18.2.1 Business Description
- 18.2.2 Company Ownership and Geographic Presence
- 18.2.3 Product and Service Portfolio
- 18.2.4 Manufacturing and Operating Footprint
- 18.2.5 Production Capacity and Expansion Plans
- 18.2.6 Financial Performance and Investment
- 18.2.7 Market Share and Competitive Position
- 18.2.8 Technology and Innovation Capabilities
- 18.2.9 Strategic Alliances or Partnerships
- 18.2.10 Recent Developments
- 18.2.11 Growth Strategy and Outlook
- 18.3 Kangaroo International Joint Venture Company
- 18.4 SUNHOUSE Group Joint Stock Company
- 18.5 Mutosi Group Joint Stock Company
- 18.6 Dai Viet Group Joint Stock Company
- 18.7 A. O. Smith Vietnam
- 18.8 Coway Vina Co., Ltd.
- 18.9 Panasonic Vietnam Co., Ltd.
- 18.10 Toshiba Lifestyle Products Vietnam
- 18.11 Cuckoo Vina Co., Ltd.
- 18.12 Other Relevant Market Participants
Note: Every listed company is profiled on the structure shown under the first company. The company list is preliminary and may change based on research findings, market developments, data availability and client requirements.
Chapter 19 Disclaimer
- 19.1 Research and Forecast Disclaimer
- 19.2 Data Source and Estimation Limitations
Note: The depth of individual sections depends on data availability for this market. Volume, capacity, trade and other unit-based metrics are included where applicable.

