
A large, young population keeps clothing demand steady
The Indonesia apparel market was valued at USD 23.40 billion in 2025 and is projected to increase from USD 24.37 billion in 2026 to USD 34.59 billion by 2035, registering a CAGR of 3.97% during 2026–2035. Demand comes from more than 285 million people, steady household spending and a strong habit of buying new clothes for Eid, school terms and family events. Java held the largest regional share, 58.4% in 2025, because the island hosts most malls, garment factories and online shoppers in the country. Sulawesi grows fastest at 4.59% a year, helped by the quickest regional economic growth in the country during 2025. The most important commercial change is the shift of fashion discovery to marketplaces and live shopping, which now lets local labels reach buyers far beyond Jakarta and Surabaya.
Which garments and sales channels does the estimate count?
The estimate measures retail sales value of finished clothing bought by households in Indonesia, including tops, bottoms, dresses, outerwear, intimates and sleepwear for women, men, children and youth. It covers sales through brand stores, department stores, specialty retailers, online marketplaces and traditional markets. Values are stated in USD million at current prices, converted from rupiah at average annual exchange rates.
The estimate excludes footwear, bags, jewelry, home textiles and work uniforms bought directly by employers or government agencies. It also excludes garments made in Indonesia for export buyers. The value chain runs from fiber, yarn and fabric mills through garment makers and brand owners to distributors, retailers, online sellers and households.
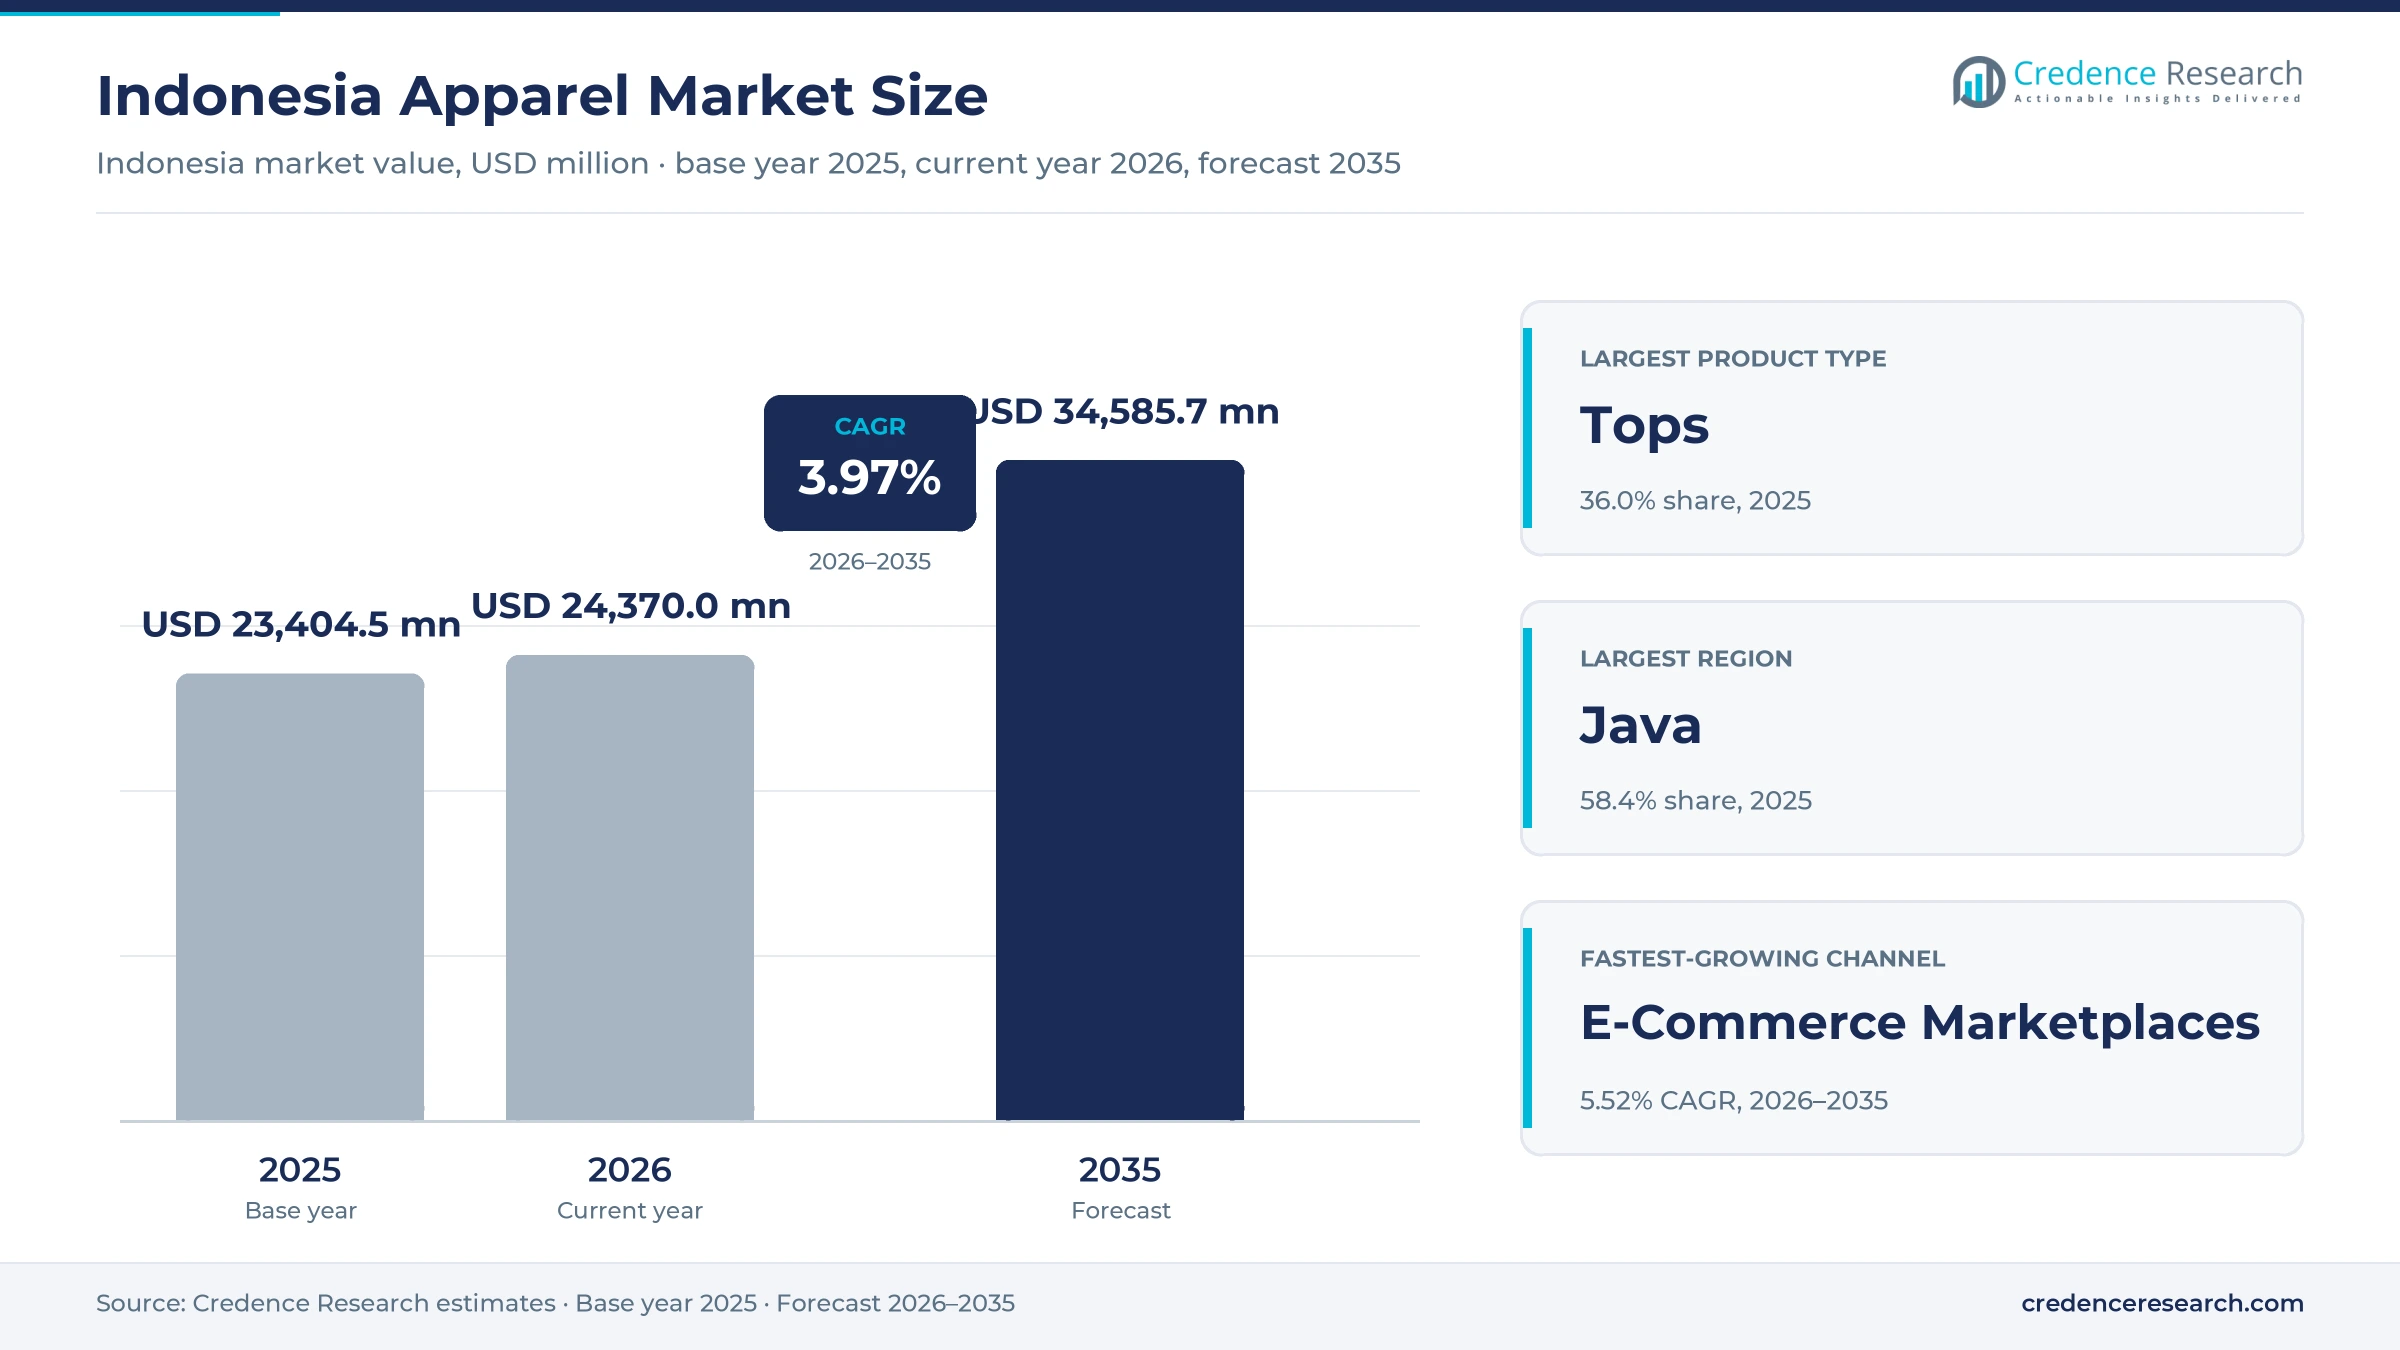
Indonesia Apparel Market Insights
- The Indonesia apparel market was valued at USD 23.40 billion in 2025 and is projected to reach USD 34.59 billion by 2035, registering a CAGR of 3.97% during 2026–2035.
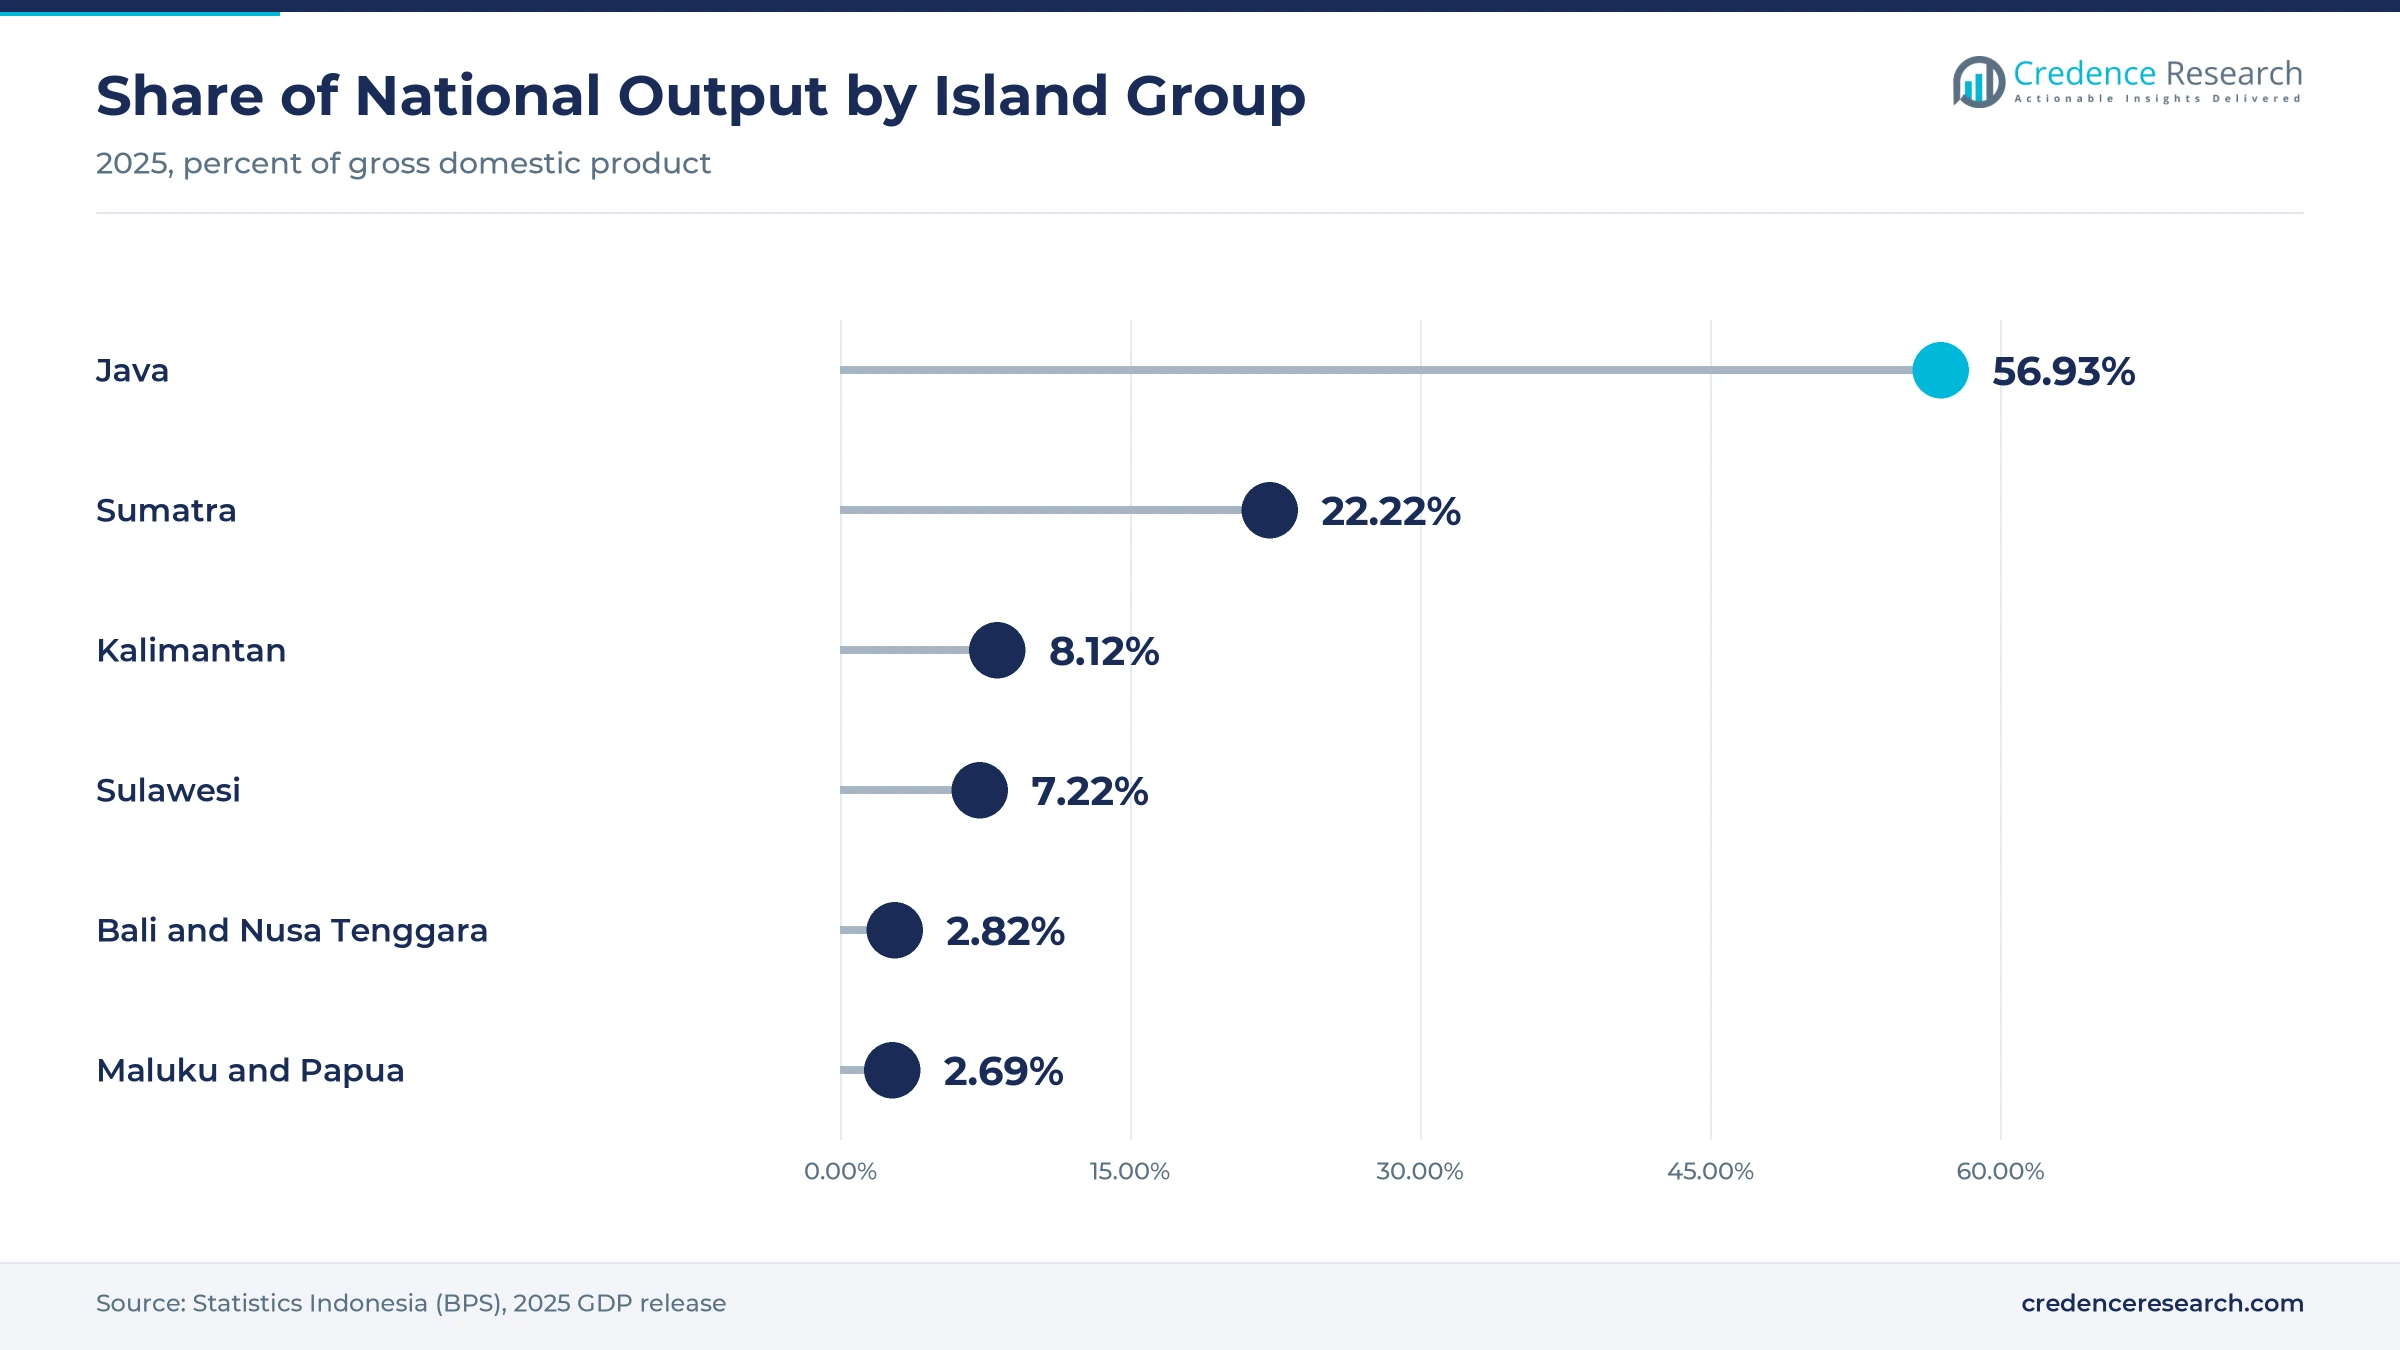
- Java held 58.4% of 2025 value, because the island hosts most malls, garment factories and online shoppers, and it produced 56.93% of national output in 2025.
- Tops led with 36.0% of 2025 value, as T-shirts, shirts, blouses and modest tunics are bought most often across every age group.
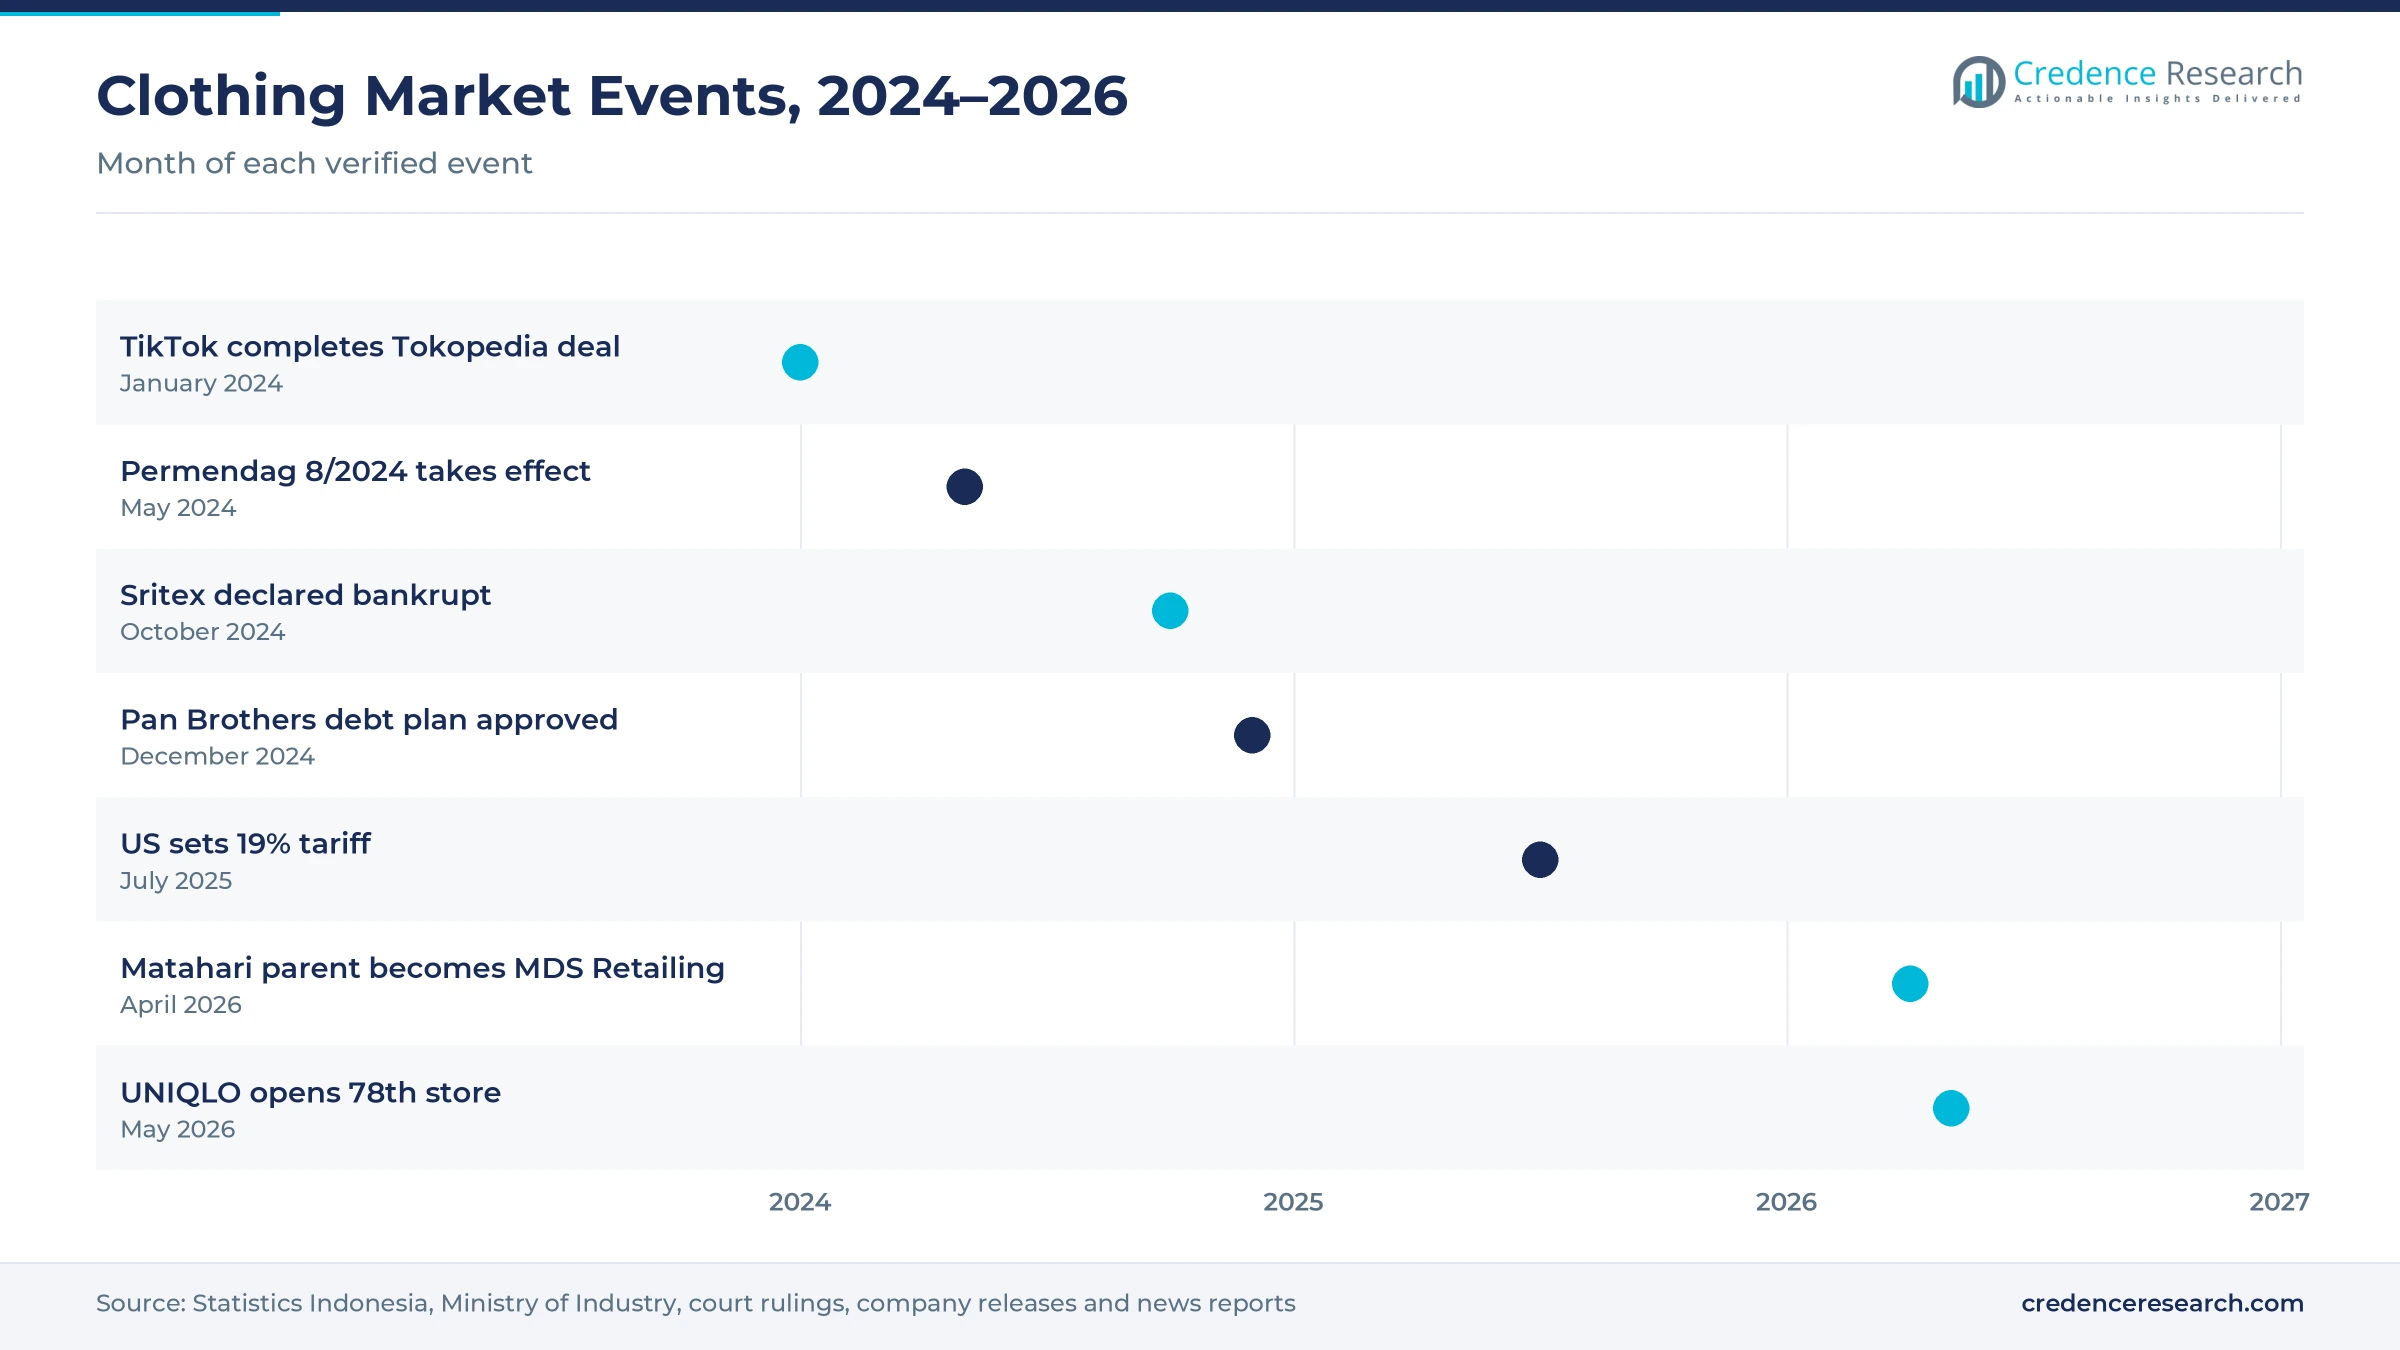
- TikTok took a 75.01% stake in Tokopedia on Jan. 31, 2024, which joined short video and shopping in one of the largest fashion sales channels.
- E-commerce marketplaces grow fastest at 5.52% a year during 2026–2035, as 229.43 million internet users compare styles and prices online.
Tops, women and everyday casual wear carry the most value
Why do tops lead clothing sales in Indonesia?
Based on product type, the market is categorized into tops, bottoms, dresses and one-piece apparel, outerwear and intimate and sleepwear. Tops led with 36.0% of 2025 value, because T-shirts, shirts, blouses and long tunics are bought most often in a hot climate. Dresses & One-Piece Apparel grows fastest at 4.26% a year, as modest dresses and gamis sets gain from festive buying. Spending on lingerie and sleepwear also stays steady because buyers replace these items often.
How do women and young buyers shape demand?
Based on customer type, the market is categorized into women, men, children and infants, and youth and unisex buyers. Women led with 44.0% of 2025 value, because women buy more often and spend more on modest sets, dresses and women's wear for festive seasons. Youth & Unisex clothing grows fastest at 4.87% a year, as streetwear and local sports labels win students and young workers.
Which buying occasions drive the most spending?
Based on purchase occasion, the market is categorized into everyday casual, work and formal, religious and festive, sports and active, and ceremonial and social events. Everyday Casual wear led with 46.0% of 2025 value, because households replace T-shirts, jeans and house dresses all year. Sports & Active wear grows fastest at 4.76% a year, as football fandom and running clubs lift demand for jerseys and training clothes.
Which channels sell the most clothing?
Based on distribution channel, the market is categorized into brand-owned stores, department stores, multi-brand specialty retail, e-commerce marketplaces and traditional retail. Traditional Retail led with 34.0% of 2025 value, because wet markets, wholesale centers and small shops serve most towns. E-Commerce Marketplaces grow fastest at 5.52% a year, as live shopping and creator reviews move first purchases online.
| Segment Group | Leading Sub-segment | Share, 2025 | Fastest-growing Sub-segment | CAGR, 2026–2035 |
|---|---|---|---|---|
| By Product Type | Tops | 36.0% | Dresses & One-Piece Apparel | 4.26% |
| By Customer Type | Women | 44.0% | Youth & Unisex | 4.87% |
| By Purchase Occasion | Everyday Casual | 46.0% | Sports & Active | 4.76% |
| By Distribution Channel | Traditional Retail | 34.0% | E-Commerce Marketplaces | 5.52% |
Request a Free Sample
Fill in your details and we'll send you a free sample report.
- Sample data tables & charts
- Research methodology
Steady spending, marketplaces and local mills lift sales
How does a large consumer base keep clothing demand resilient?
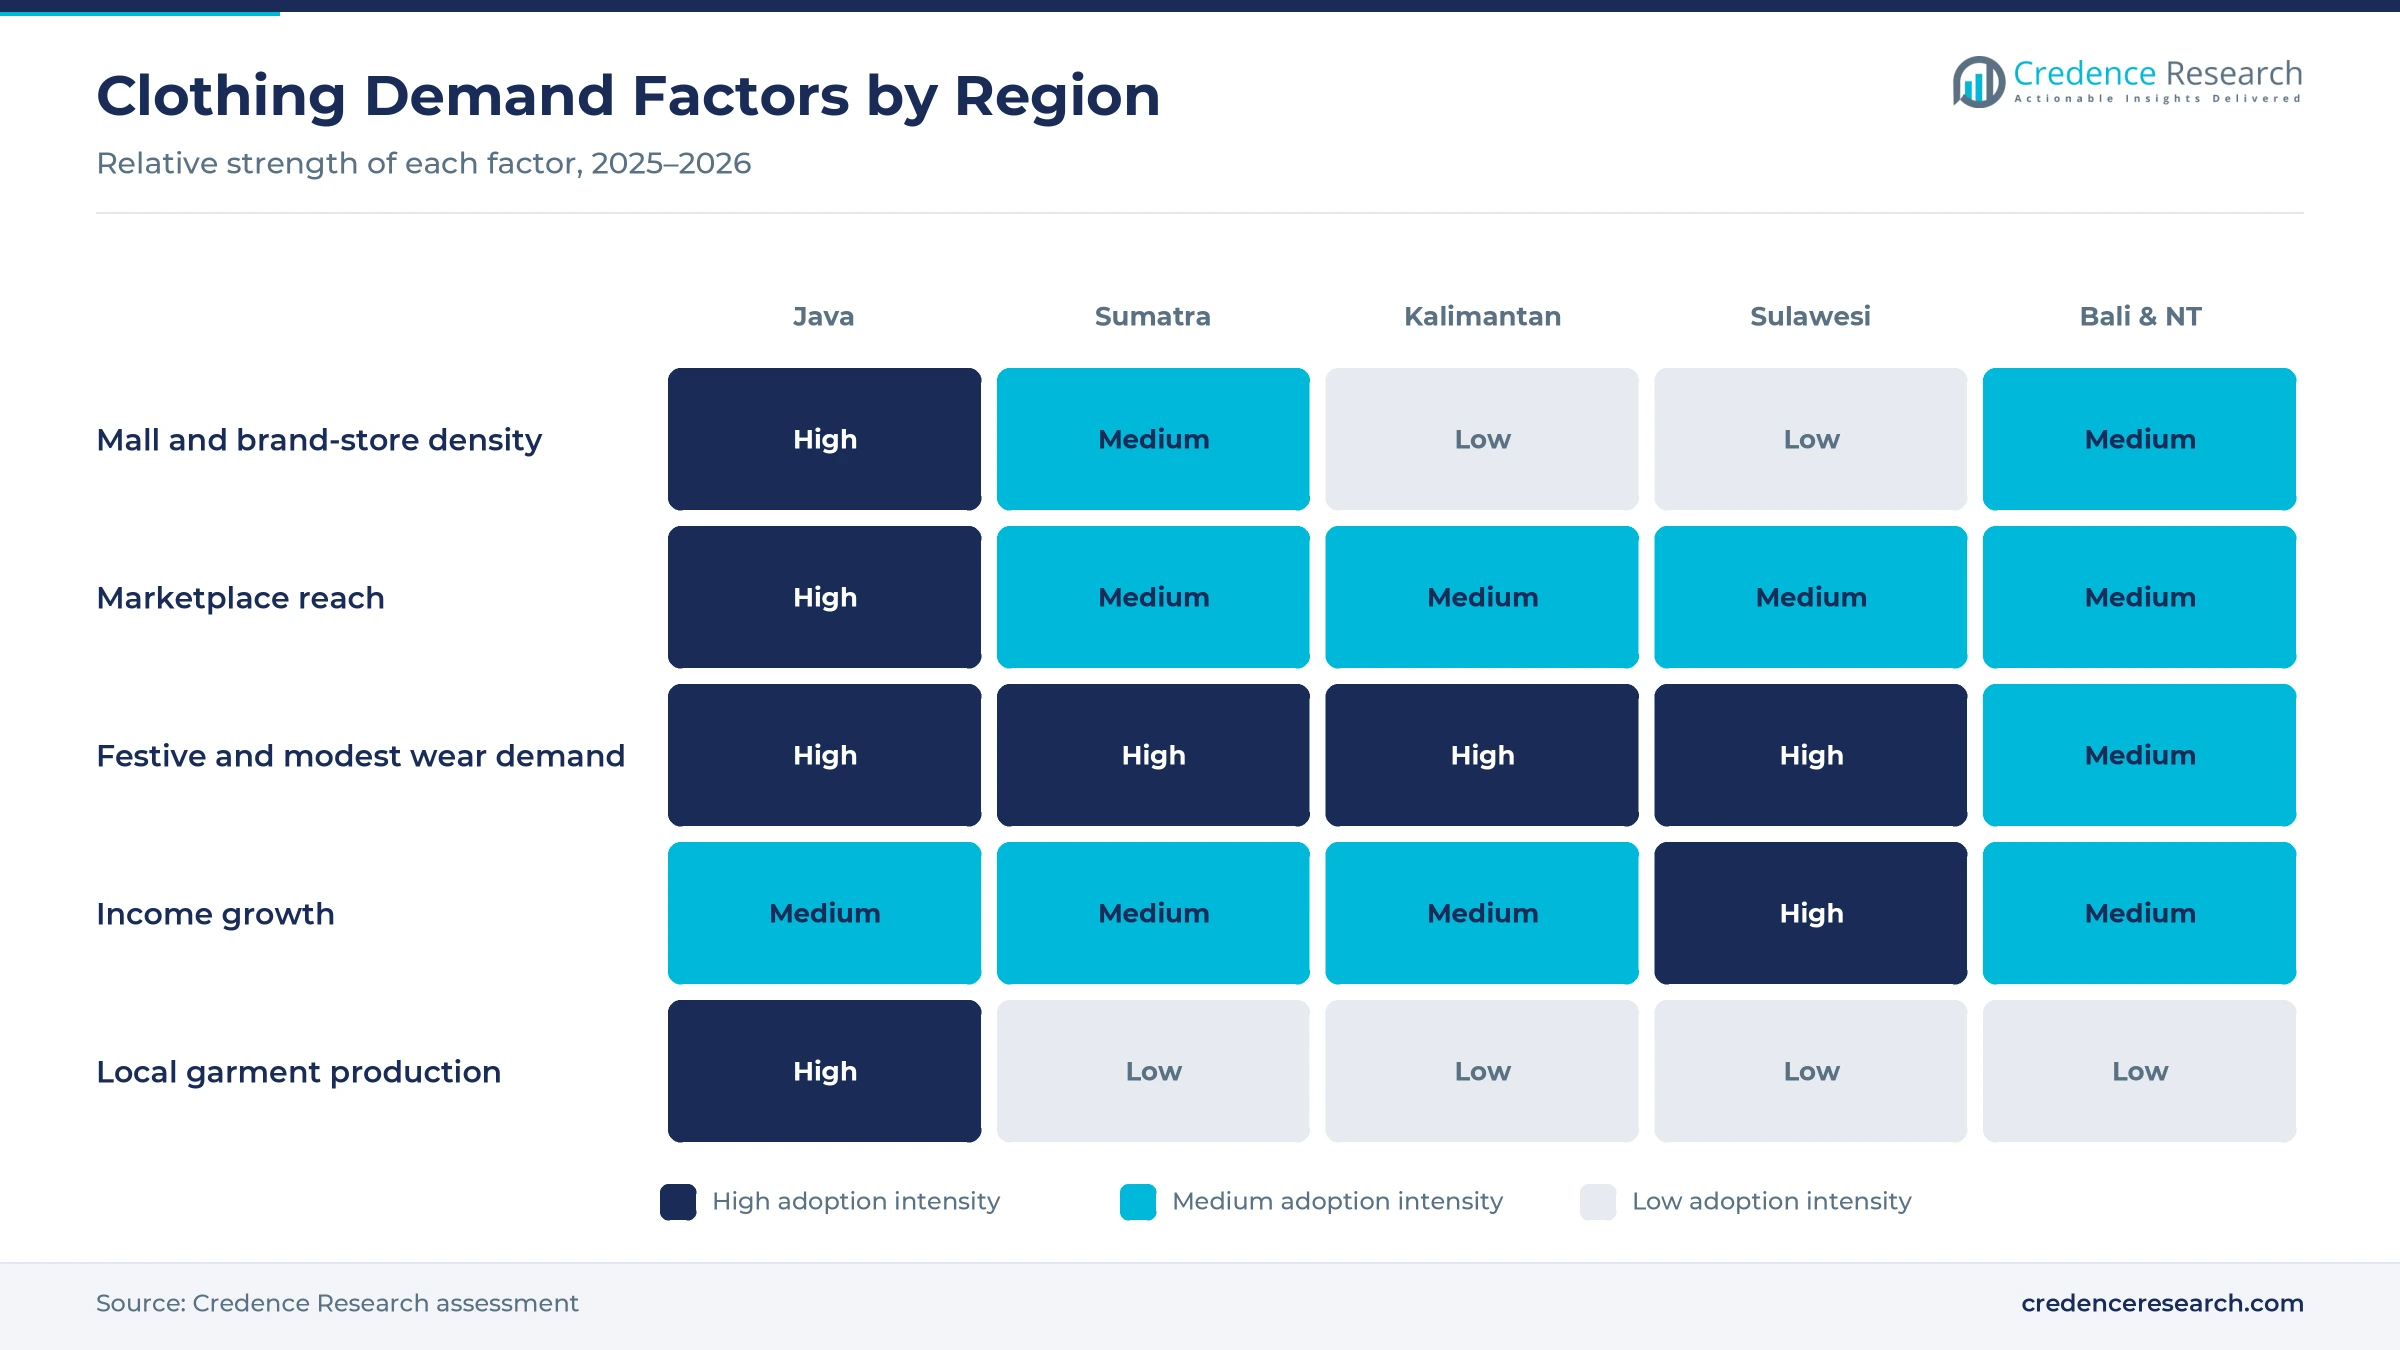
A large and growing consumer base keeps clothing demand resilient, because every household buys basic garments several times a year. Indonesia had about 285.7 million people in 2025, up from 283.5 million in 2024, according to World Bank figures. Household final consumption grew 5.11% in 2024 and 4.98% in 2025, according to World Bank data. The national economy grew 5.11% in 2025, up from 5.03% in 2024, according to Statistics Indonesia. Java alone produced 56.93% of national output in 2025, which keeps the densest pool of buyers on one island. As a result, everyday tops, bottoms and intimates are replaced often, which keeps volume steady even when prices rise.
Why do marketplaces and omnichannel retail widen fashion discovery?
Marketplaces and omnichannel retail widen fashion discovery, because buyers now find new styles on their phones before they visit a store. Indonesia had 229.43 million internet users in 2025, a penetration rate of 80.66%, according to an APJII survey reported by Bisnis.com. Java accounted for 58% of all users and reached 84.69% penetration. TikTok completed its purchase of 75.01% of Tokopedia on Jan. 31, 2024, paying US$840 million for new shares, according to Kontan. Matahari's parent became PT MDS Retailing on April 22, 2026, and shifted toward multi-concept stores and private labels. Consequently, marketplaces win a growing share of first clothing purchases through 2035.
How does deep garment production capability support local supply?
Deep garment production capability supports local supply, because brands can source fabric, sewing and finishing within the country. The textile, apparel and footwear industry employed more than 3.8 million workers and exported about USD 4.85 billion in the first half of 2026, according to the Ministry of Industry as reported by RRI. The industrial confidence index for the sector reached 53.10 in July 2026, which signals expansion. Pan Brothers won court approval for its debt plan on Dec. 23, 2024, and expects orders from Adidas, Uniqlo and The North Face. Trisula runs four production subsidiaries for uniforms, sportswear and casual wear. In turn, local textile mills and sewing plants keep lead times short for domestic brands.
Why do new brand stores deepen organized fashion retail?
New brand stores deepen organized fashion retail, because mall shoppers expect wider ranges, clear sizing and regular new collections. UNIQLO opened its 78th store in Indonesia at Plaza Indonesia in Jakarta on May 27, 2026. The store includes a section for products from selected local small businesses beside its LifeWear range. MDS Retailing runs about 140 Matahari stores in 80 cities and added the SUKO, ZES and MU+KU concepts in 2026. These formats target young urban buyers in Jakarta and Surabaya with private labels and minimalist basics. As a result, brand-owned stores grow faster than department stores through 2035, especially in Java's large cities.
Multi-concept stores and local labels reshape fashion
How is the shift to multi-concept stores and private labels playing out?
Department store groups are shifting toward multi-concept stores and private labels, because single large floors no longer match how young buyers shop. MDS Retailing announced its new name on April 22, 2026, while keeping the Matahari signs on its stores. The group now pushes private labels such as Nevada, COLE, Connexion and Little M to control stock and margins. MDS Retailing still runs about 140 Matahari stores in 80 cities, so the shift reaches most large towns. Ramayana closed six stores during 2024 and 4 more during 2025, according to Kontan, as it trimmed weaker sites. Consequently, department stores grow more slowly than brand stores and marketplaces through 2035.
Why are local sportswear and streetwear labels rising?
Local sportswear and streetwear labels are rising, because young buyers want national pride, online buzz and lower prices than imported brands. Erigo's sportswear line Erspo has supplied apparel for the Indonesian national football team since 2024. Football fandom turns replica jerseys and training tops into mass purchases that sell heavily online to 229.43 million internet users. UNIQLO also gave local small businesses shelf space at its 78th Indonesian store in May 2026, which shows how global chains now work with local makers. Pan Brothers, meanwhile, keeps sewing for global sports brands such as Adidas and The North Face. As a result, sports and active wear grows at 4.76% a year, while youth and unisex clothing grows faster than any other customer group.
Can lower U.S. tariffs open room for export-ready makers?
Lower U.S. tariffs open a clear opportunity, because export-ready garment makers can use the extra orders to fund better lines for domestic brands. The United States set a 19% tariff on Indonesian goods in July 2025, down from a planned 32%, according to the Jakarta Globe. Vietnam faces about 20% and Bangladesh about 35%, which gives Indonesian factories a price edge. Ready-made garments shipped to the United States were valued at $1.27 billion from January to May 2025. The ministry also cites the Indonesia-European Union trade agreement as a new market opening. In turn, busier plants can supply domestic labels with lower cost per piece.
Is there room to grow online fashion outside Java?
Online fashion outside Java offers a second opening, because internet use is already high on the other islands while mall choice remains thin. Internet penetration reached 78.72% in Kalimantan, 77.12% in Sumatra, 76.86% in Bali and Nusa Tenggara and 71.64% in Sulawesi in 2025. Sulawesi also posted the fastest regional economic growth in 2025, at 6.23%. Sellers of online fashion can therefore reach buyers in smaller towns without opening stores. Lower delivery costs and cash-on-delivery options also help first-time buyers trust online orders. Local sellers can also test modest and festive ranges online before they open stores in these towns. Consequently, Sulawesi becomes the fastest-growing region for clothing spending through 2035.
Cheap imports, mill closures and weak stores weigh on growth
How do cheap imports undercut local garment makers?
Cheap imports undercut local garment makers, because low-priced clothing from abroad reaches buyers through marketplaces and traditional markets. Permendag 8/2024, effective May 17, 2024, relaxed import arrangements for ready-made clothing and accessories. At least 36 textile firms shut down between 2019 and mid-2024, according to a trade union confederation. As a result, local makers lose volume, cut shifts and delay new lines, while workers in sewing towns face layoffs. Stronger border checks, fair platform rules and clear labeling help reduce this pressure over time.
Why did large mill closures shake the supply chain?
Large mill closures shook the supply chain, because one failed group can halt fabric and garment output across several towns. A Semarang court declared Sritex bankrupt on Oct. 21, 2024, and the group closed operations on March 1, 2025. About 10,665 workers lost jobs in Central Java factories during early 2025. Consequently, brands must spread sourcing across more mills to protect supply, and smaller labels may face higher fabric prices and longer waits while other mills add capacity.
How do weaker department stores slow mid-price sales?
Weaker department stores slow mid-price sales, because many families in second-tier cities still buy clothing in these stores. Ramayana closed six stores in 2024 and four in 2025, and MDS Retailing has moved toward smaller concepts. Fewer large stores reduce shelf space for local mid-price labels. In turn, these labels must shift sales to marketplaces and their own stores, which raises spending on marketing, delivery and returns for brands with small budgets.
Does the end of safeguard duties raise price pressure?
The end of safeguard duties can raise price pressure, because imported garments become cheaper once extra duties lapse. Finance Ministry Regulation 142 of 2021 set duties from November 2021 for three years, with up to Rp 63,000 per piece on outerwear. Local makers then face sharper price competition in basic tops and bottoms. Therefore, efficiency gains and faster design cycles matter more for domestic producers, which must keep prices low while meeting changing styles each season.
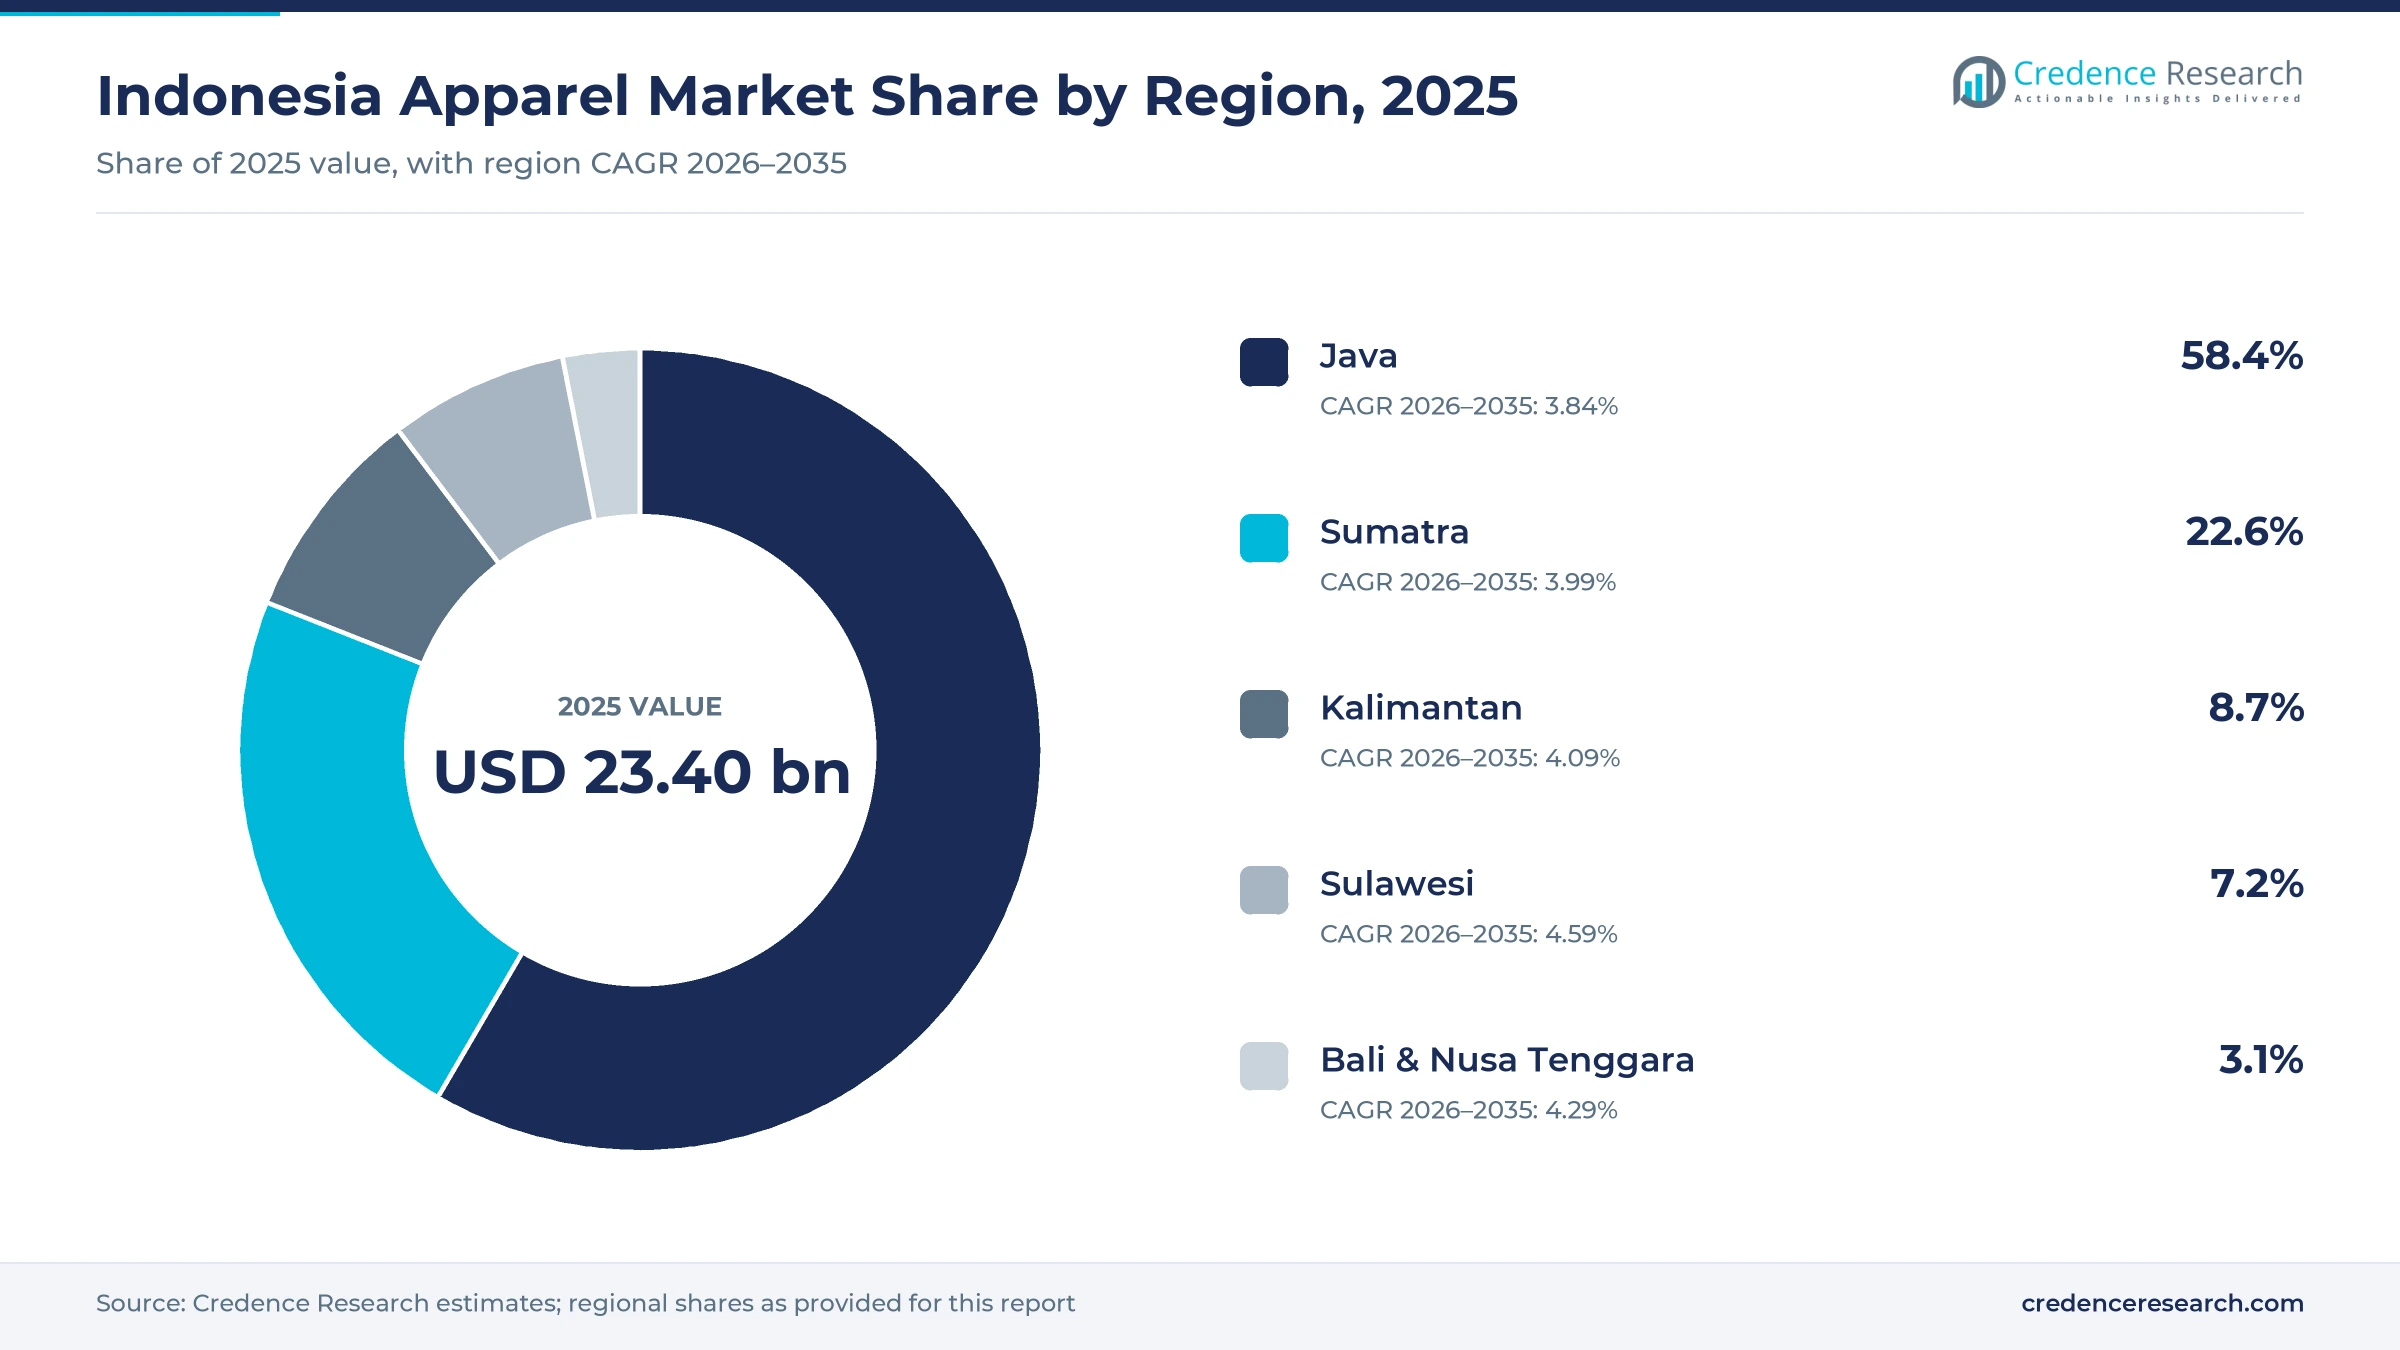
Java leads while Sulawesi grows fastest
| Region | Value, 2025 (USD billion) | Share, 2025 | CAGR, 2026–2035 |
|---|---|---|---|
| Java | 13.67 | 58.4% | 3.84% |
| Sumatra | 5.29 | 22.6% | 3.99% |
| Kalimantan | 2.04 | 8.7% | 4.09% |
| Sulawesi | 1.69 | 7.2% | 4.59% |
| Bali & Nusa Tenggara | 0.73 | 3.1% | 4.29% |
Why does Java lead clothing spending?
Java held 58.4% of 2025 value and grows at 3.84% a year, because the island hosts the largest cities, the most malls and most garment plants. Java produced 56.93% of national output in 2025 and grew 5.30%, according to Statistics Indonesia. The island also had 84.69% internet penetration in 2025, the highest of any region. UNIQLO and MDS Retailing focus new concepts on Jakarta and Surabaya, which keeps premium and brand-store sales concentrated on Java.
How does Sumatra add steady volume?
Sumatra held 22.6% of 2025 value and grows at 3.99% a year, because large cities such as Medan, Palembang and Pekanbaru support steady clothing demand. Sumatra produced 22.22% of national output in 2025 and grew 4.81%, up from 4.45% in 2024. Internet penetration reached 77.12%, which lets marketplaces serve smaller towns. Traditional markets still sell most everyday and festive clothing in the region, while new malls in Medan and Palembang add brand stores for young urban buyers who want global basics.
What shapes Kalimantan demand?
Kalimantan held 8.7% of 2025 value and grows at 4.09% a year, because mining and plantation incomes support spending in Balikpapan, Samarinda and Banjarmasin. Kalimantan produced 8.12% of national output in 2025, although growth slowed to 4.79% from 5.52% in 2024. Internet penetration reached 78.72%, so online orders fill gaps where malls are few. Festive buying before Eid also lifts demand for modest sets and family outfits in the region.
Why is Sulawesi the fastest-growing region?
Sulawesi held 7.2% of 2025 value and grows fastest at 4.59% a year, because its economy grew 6.23% in 2025, the quickest of any island group. Sulawesi produced 7.22% of national output, led by nickel processing and trade in Makassar. Rising wages lift spending on branded basics, while online orders reach towns with few clothing stores.
How do Bali and Nusa Tenggara add tourist demand?
Bali and Nusa Tenggara held 3.1% of 2025 value and grow at 4.29% a year, because tourism supports resort wear, beachwear and souvenir clothing. The region produced 2.82% of national output in 2025 and grew 4.87%. Internet penetration reached 76.86%, which helps local resort labels sell to visitors after they return home.
Platform deals, court rulings and store openings
| Development | Status and market relevance |
|---|---|
| In March 2025, Sritex closed its operations after a Semarang court declared it bankrupt, and about 10,665 workers lost jobs. | Removes a large fabric and garment supplier |
| In July 2025, the United States set a 19% tariff on Indonesian goods, down from a planned 32%. | Gives garment exporters a price edge over Vietnam and Bangladesh |
| In April 2026, PT Matahari Department Store Tbk became PT MDS Retailing Tbk and shifted to multi-concept retail. | Adds SUKO, ZES and MU+KU formats and private labels |
| In May 2026, UNIQLO opened its 78th store in Indonesia at Plaza Indonesia in Jakarta. | Shows continued brand-store growth on Java |
| In August 2026, the Ministry of Industry said textile, apparel and footwear exports reached about USD 4.85 billion in the first half of 2026. | Signals recovery in local garment production |
Live commerce, private labels and upcycling change the shelf
- Live shopping on TikTok Shop and Tokopedia lets sellers show fit and fabric in real time, which reduces returns for first-time online buyers.
- Private-label sourcing gives retailers such as MDS Retailing tighter control over stock, design cycles and margins than buying third-party brands.
- Upcycling programs such as the UNIQLO REMAKE PROJECT with ESMOD Jakarta turn donated garments into 16 new student collections for display.
- Durable fabric finishes help denim jeans and cotton basics keep color and shape after many washes in a hot climate.
Need a Custom Version of This Report?
Tailor the scope, geography, or segments to your exact requirements.
- Custom geography or segment scope
- Direct access to our analyst team
Global chains, department stores and local labels compete
Competition is spread across global chains, department stores, local brands and thousands of small sellers. UNIQLO runs 78 stores and competes on basics, quality and mall locations. MDS Retailing operates about 140 Matahari stores in 80 cities and now adds smaller concepts and private labels. Ramayana serves value buyers but has closed weaker stores since 2024. Erigo competes through online reach and its Erspo football kits, which give it strong national visibility. Trisula and Pan Brothers add manufacturing depth, because they make uniforms, sportswear and casual wear for local and global brands. Companies compete on price per piece, design speed, modest and festive ranges, sizing, store reach and marketplace visibility. Fast fashion sellers also pressure margins with weekly drops and low prices.
Companies profiled and their roles in this market
| Company | Type | Role in the market |
|---|---|---|
| PT Fast Retailing Indonesia (UNIQLO) | Global brand retailer | Opened its 78th Indonesian store at Plaza Indonesia in May 2026 |
| PT MDS Retailing Tbk | Department store group | Runs about 140 Matahari stores; launched SUKO, ZES and MU+KU in 2026 |
| PT Ramayana Lestari Sentosa Tbk | Value department store | Closed six stores in 2024 and four in 2025 |
| PT Trisula International Tbk | Manufacturer and brand owner | Four production subsidiaries for uniforms, sportswear and casual wear |
| PT Pan Brothers Tbk | Garment manufacturer | Court approved its debt plan in December 2024 |
| Erigo | Local brand | Erspo has supplied the national football team since 2024 |
Credence Research view on steady clothing demand
Credence Research's view is that Indonesian clothing demand will grow steadily through 2035, because a large young population keeps buying basics and festive outfits each year. Tops already hold 36.0% of 2025 value, and marketplaces keep winning first purchases. Domestic factories give local brands short lead times, while lower U.S. tariffs keep large plants busy. However, cheap imports and the loss of large mills could squeeze local makers. Brand stores and online sellers should gain share from department stores, while Sulawesi and the outer islands grow faster than Java.
How the clothing spending estimate was built
The report uses 2025 as the base year, with values in USD million at current prices. Market values come from the Credence Research model, which combines population, household spending, clothing purchase frequency and average prices. Regional shares are those set for this report, and segment splits by product type, customer type, occasion and channel are Credence Research estimates. Sources used are government statistics, ministry statements, World Bank data, court and company announcements and news reports, and no interviews or surveys were used.
Online reach and local supply set the path to 2035
The market is expected to reach USD 34.59 billion by 2035, a 3.97% CAGR during 2026–2035, as population growth, steady incomes and online discovery lift clothing purchases. Growth should be strongest in Sulawesi and in e-commerce marketplaces, while Java keeps the largest share. Youth and unisex clothing and sports wear will gain share as local brands grow. Retailers that combine stores, marketplaces and private labels should win share. In contrast, a new surge of cheap imports or more mill closures would slow value growth for domestic makers.
Frequently Asked Questions
How big is the Indonesia apparel market?
Which region leads clothing sales in Indonesia?
Which region grows fastest?
Which product type holds the largest share?
Which sales channel grows fastest?
How does local manufacturing support the market?
Who are the leading clothing companies in Indonesia?
What are the main risks to growth?
Table of Content
Chapter 1 Market Segmentation
- 1.1 Segmentation Framework
- 1.1.1 Product and Service Classification
- 1.1.2 Application and End-Use Classification
- 1.1.3 Technology and Solution Classification
- 1.1.4 Customer and Distribution Channel Classification
- 1.1.5 Geographic Segmentation
- 1.1.6 Market Segment Definitions and Boundaries
- 1.2 By Product Type
- 1.2.1 Tops
- 1.2.2 Bottoms
- 1.2.3 Intimate & Sleepwear
- 1.2.4 Dresses & One-Piece Apparel
- 1.2.5 Outerwear
- 1.3 By Customer Type
- 1.3.1 Women
- 1.3.2 Men
- 1.3.3 Children & Infants
- 1.3.4 Youth & Unisex
- 1.4 By Purchase Occasion
- 1.4.1 Everyday Casual
- 1.4.2 Religious & Festive
- 1.4.3 Work & Formal
- 1.4.4 Sports & Active
- 1.4.5 Ceremonial & Social Events
Chapter 2 Introduction
- 2.1 Report Objectives and Scope
- 2.2 Product Definition and Industry Terminology
- 2.3 Market Inclusions and Exclusions
- 2.4 Research Process
- 2.4.1 Primary Research and Expert Interviews
- 2.4.2 Secondary Research and Source Review
- 2.4.3 Top-Down and Bottom-Up Estimation
- 2.4.4 Data Triangulation and Verification
- 2.5 Market Size Measurement Basis
- 2.5.1 2025: USD 23.40 billion → 2035: USD 34.59 billion
- 2.6 Historical and Forecast Reference Periods
- 2.6.1 Historical Period: 2018-2025
- 2.6.2 Base Year: 2025
- 2.6.3 Forecast Period: 2025-2035
- 2.7 Research Assumptions and Limitations
Chapter 3 Executive Summary
- 3.1 Market Snapshot and Key Findings
- 3.2 Base-Year Market Size, 2025
- 3.3 Forecast Market Size, 2035
- 3.4 Revenue and Volume Growth Outlook
- 3.5 Key Demand and Supply Indicators
- 3.6 Leading Market Segments
- 3.7 Fastest-Growing Market Opportunities
- 3.8 Regional Performance Highlights
- 3.9 Technology and Industry Transformation
- 3.10 Competitive Landscape Summary
- 3.11 Analyst View and Strategic Implications
Chapter 4 Indonesia Apparel Market Trends and Developments
- 4.1 Historical Industry Development, 2018-2025
- 4.2 Recent Market Trends and Developments
- 4.3 Demand and Customer Behavior Trends
- 4.4 Technology and Product Innovation
- 4.5 Artificial Intelligence, Automation and Digitalization
- 4.6 Local Manufacturing and Supply Chain Realignment
- 4.7 Industry Partnerships, Mergers and Acquisitions
- 4.8 Sustainability and Circular Economy Developments
- 4.9 Government and Private Sector Investment Trends
- 4.10 Emerging Business Models and Commercialization
- 4.11 Industry Developments and Announcements
Chapter 5 Indonesia Apparel Market Production, Supply and Demand Analysis
- 5.1 Demand Trend and Consumption Analysis, 2018-2025
- 5.2 Demand Forecast, 2025-2035
- 5.3 Production and Output Trend, 2018-2025
- 5.4 Production and Output Forecast, 2025-2035
- 5.5 Installed Capacity and Capacity Utilization
- 5.6 Company-Wise Production Plants and Statistics
- 5.6.1 Installed Production Capacity
- 5.6.2 Actual Production
- 5.6.3 Planned Capacity and Expansion Targets
- 5.7 Supply Chain Structure and Procurement Trends
- 5.8 Supply-Demand Gap and Bottlenecks
- 5.9 Import Dependence and Sourcing Structure
- 5.10 Contract Manufacturing and Outsourcing
- 5.11 Regional Supply and Demand Concentration
Chapter 6 Indonesia Apparel Market Pricing Analysis
- 6.1 Pricing Structure and Measurement
- 6.2 Historical Pricing Trends, 2018-2025
- 6.3 Pricing Outlook, 2025-2035
- 6.4 Average Selling Price and Unit Economics
- 6.5 Pricing by Product and Market Segment
- 6.6 Geographic Pricing Differences
- 6.7 Key Input, Energy, Labor and Logistics Costs
- 6.8 Contract Pricing and Purchasing Models
- 6.9 Pricing Sensitivity and Competitive Positioning
- 6.10 Price, Margin and Profitability Implications
Chapter 7 Indonesia Apparel Market Dynamics
- 7.1 Market Growth Drivers
- 7.1.1 Demand-Side Drivers
- 7.1.2 Technology and Innovation Drivers
- 7.1.3 Infrastructure and Investment Drivers
- 7.1.4 Regulatory and Policy Drivers
- 7.2 Market Restraints
- 7.2.1 Cost and Affordability Constraints
- 7.2.2 Technology and Adoption Barriers
- 7.2.3 Supply Chain and Operational Constraints
- 7.3 Market Challenges
- 7.3.1 Competitive Pressure and Margin Erosion
- 7.3.2 Skills, Infrastructure and Implementation Gaps
- 7.4 Emerging Market Opportunities
- 7.5 Market Dynamics Impact and Time-Horizon Assessment
Chapter 8 Indonesia Apparel Value Chain Analysis
- 8.1 Industry Value Chain Overview
- 8.2 Upstream Suppliers and Critical Inputs
- 8.3 Technology and Component Providers
- 8.4 Manufacturing or Service Delivery
- 8.5 Distribution, Channel Partners and Integrators
- 8.6 Downstream Applications and End Users
- 8.7 Value Addition and Profit Pools
- 8.8 Vertical Integration and Outsourcing
- 8.9 Supplier Concentration and Risk
- 8.10 Supply Chain Localization and Resilience
Chapter 9 Indonesia Apparel Market Regulations and Policies
- 9.1 Relevant Laws, Standards and Compliance Frameworks
- 9.2 Product, Service, Safety and Quality Requirements
- 9.3 Government Policies, Incentives and Subsidies
- 9.4 Imports, Exports and Trade Barriers
- 9.5 Public Procurement and Local Content Requirements
- 9.6 Environmental and Sustainability Compliance
- 9.7 Upcoming Policy Changes and Market Implications
Chapter 10 Indonesia Apparel Market Hotspots and Opportunities
- 10.1 Market Opportunity Mapping and Growth Hotspots
- 10.2 High-Growth Applications and Customer Groups
- 10.3 Underserved Markets and White-Space Opportunities
- 10.4 Emerging Technology and Product Opportunities
- 10.5 New Capacity and Investment Hotspots
- 10.6 Market Entry and Expansion Opportunities
- 10.7 Distribution and Partnership Opportunities
- 10.8 Near-Term and Long-Term Commercial Potential
- 10.9 Opportunity Attractiveness and Execution Risks
Chapter 11 Indonesia Apparel Market Outlook, 2025-2035
- 11.1 Market Size and Analysis
- 11.1.1 Revenue (Market Measurement: 2025: USD 23.40 billion → 2035: USD 34.59 billion)
- 11.1.2 Market Volume and Quantity Sold
- 11.1.3 Historical Market Size, 2018-2025
- 11.1.4 Base-Year Market Size, 2025
- 11.2 Market Forecast, 2025-2035
- 11.2.1 Revenue Forecast to 2035
- 11.2.2 Volume Forecast to 2035
- 11.2.3 CAGR and Year-on-Year Growth
- 11.2.4 Incremental Revenue Opportunity
- 11.3 Forecast Assumptions and Scenario Analysis
- 11.3.1 Base-Case Forecast
- 11.3.2 Optimistic and Conservative Scenarios
- 11.3.3 Technology, Pricing and Policy Sensitivities
- 11.4 Market Attractiveness and Growth Outlook
Chapter 12 Indonesia Apparel Market Segmentation and Outlook
- 12.1 Segmentation Summary and Market Shares, 2025
- 12.2 Largest and Fastest-Growing Segments
- 12.3 By Product Type - Market Size and Forecast, 2025-2035
- 12.3.1 Segment Definition and Scope
- 12.3.2 Historical Market Size, 2018-2025
- 12.3.3 Revenue Forecast, 2025-2035
- 12.3.4 Volume Forecast, 2025-2035
- 12.3.5 Base-Year Market Share, 2025
- 12.3.6 Segment CAGR and Growth Drivers
- 12.3.7 Subsegment Market Size and Forecast
- 12.3.7.1 Tops
- 12.3.7.2 Bottoms
- 12.3.7.3 Intimate & Sleepwear
- 12.3.7.4 Dresses & One-Piece Apparel
- 12.3.7.5 Outerwear
- 12.3.8 Subsegment Pricing and Adoption Trends
- 12.3.9 Leading Suppliers and Competition
- 12.3.10 Regional Demand and Opportunities
- 12.4 By Customer Type - Market Size and Forecast, 2025-2035
- 12.4.1 Segment Definition and Scope
- 12.4.2 Historical Market Size, 2018-2025
- 12.4.3 Revenue Forecast, 2025-2035
- 12.4.4 Volume Forecast, 2025-2035
- 12.4.5 Base-Year Market Share, 2025
- 12.4.6 Segment CAGR and Growth Drivers
- 12.4.7 Subsegment Market Size and Forecast
- 12.4.7.1 Women
- 12.4.7.2 Men
- 12.4.7.3 Children & Infants
- 12.4.7.4 Youth & Unisex
- 12.4.8 Subsegment Pricing and Adoption Trends
- 12.4.9 Leading Suppliers and Competition
- 12.4.10 Regional Demand and Opportunities
- 12.5 By Purchase Occasion - Market Size and Forecast, 2025-2035
- 12.5.1 Segment Definition and Scope
- 12.5.2 Historical Market Size, 2018-2025
- 12.5.3 Revenue Forecast, 2025-2035
- 12.5.4 Volume Forecast, 2025-2035
- 12.5.5 Base-Year Market Share, 2025
- 12.5.6 Segment CAGR and Growth Drivers
- 12.5.7 Subsegment Market Size and Forecast
- 12.5.7.1 Everyday Casual
- 12.5.7.2 Religious & Festive
- 12.5.7.3 Work & Formal
- 12.5.7.4 Sports & Active
- 12.5.7.5 Ceremonial & Social Events
- 12.5.8 Subsegment Pricing and Adoption Trends
- 12.5.9 Leading Suppliers and Competition
- 12.5.10 Regional Demand and Opportunities
- 12.6 Segment Growth Comparison
- 12.7 Segment Attractiveness and Priority Matrix
Chapter 13 Indonesia Apparel End-Use and Application Market Outlook
- 13.1 End-Use Industry and Customer Demand Structure
- 13.2 Leading Applications and Customer Groups
- 13.3 End-Use Market Size, Share and Forecast
- 13.4 Major End-Use Industry Deep Dives
- 13.4.1 Customer Requirements and Use Cases
- 13.4.2 Demand and Replacement Cycles
- 13.4.3 Technical and Regulatory Considerations
- 13.4.4 Purchasing and Procurement Models
- 13.4.5 Leading Vendors and Distribution Channels
- 13.4.6 Forecast and Commercial Opportunities
- 13.5 Emerging Applications and Cross-Segment Demand
- 13.6 End-Use Industry Investment Priorities
Chapter 14 Indonesia Apparel Geographic Market Outlook, 2025-2035
- 14.1 Regional Market Size and Country-Level Shares, 2025
- 14.2 Country Market Size Comparison, 2025
- 14.3 Country Market Forecasts, 2025-2035
- 14.4 Subregional Industrial and Demand Clusters
- 14.5 Intra-Regional Pricing and Cost Differences
- 14.6 Cross-Border Trade and Supply Networks
- 14.7 Regional Supply and Demand Balances
- 14.8 Country Opportunity Comparison and Prioritization
Note: Every listed country is covered on the structure shown under the first country.
Chapter 15 Indonesia Apparel Technology, Innovation and Sustainability Outlook
- 15.1 Technology Landscape and Maturity
- 15.2 Product, Process and Service Innovation
- 15.3 AI, Automation and Digital Tools in the Industry
- 15.4 Technology Adoption and Performance Benchmarking
- 15.5 Innovation Pipeline and R&D Investment
- 15.6 Patent and Intellectual Property Trends
- 15.7 Energy Efficiency and Resource Management
- 15.8 Sustainability, Recycling and Circularity
- 15.9 Technology Roadmap, 2025-2035
- 15.10 Risks of Obsolescence and Technology Substitution
Chapter 16 Indonesia Apparel Market Key Strategic Imperatives
- 16.1 Growth and Market Entry Priorities
- 16.2 High-Return Products and Segments
- 16.3 Pricing, Profitability and Cost Optimization
- 16.4 Technology Investment and Product Differentiation
- 16.5 Supply Chain Localization and Resilience
- 16.6 Distribution and Customer Acquisition
- 16.7 Partnership, Acquisition and Capacity Strategy
- 16.8 Regional Expansion Priorities
- 16.9 Short-, Medium- and Long-Term Actions
Chapter 17 Competition Outlook
- 17.1 Industry Competition Characteristics
- 17.2 Market Structure and Concentration
- 17.3 Market Share and Competitive Positioning, 2025
- 17.4 Company-Wise Revenue and Product Benchmarking
- 17.5 Production and Service Capacity Benchmarking
- 17.6 Technology, Pricing and Differentiation
- 17.7 Regional Footprint and Distribution Strength
- 17.8 Mergers, Acquisitions and Strategic Alliances
- 17.9 New Entrants and Competitive Threats
- 17.10 Porter's Five Forces and Industry Attractiveness
- 17.11 Competitive Outlook, 2025-2035
Chapter 18 Company Profiles
- 18.1 Company Coverage and Selection Criteria
- 18.2 PT Fast Retailing Indonesia (UNIQLO)
- 18.2.1 Business Description
- 18.2.2 Company Ownership and Geographic Presence
- 18.2.3 Product and Service Portfolio
- 18.2.4 Manufacturing and Operating Footprint
- 18.2.5 Production Capacity and Expansion Plans
- 18.2.6 Financial Performance and Investment
- 18.2.7 Market Share and Competitive Position
- 18.2.8 Technology and Innovation Capabilities
- 18.2.9 Strategic Alliances or Partnerships
- 18.2.10 Recent Developments
- 18.2.11 Growth Strategy and Outlook
- 18.3 PT MDS Retailing Tbk
- 18.4 PT Ramayana Lestari Sentosa Tbk
- 18.5 PT Mega Perintis Tbk
- 18.6 PT Trisula International Tbk
- 18.7 PT Pan Brothers Tbk
- 18.8 PT Ricky Putra Globalindo Tbk
- 18.9 PT Bersama Zatta Jaya Tbk
- 18.10 Erigo
- 18.11 Modinity Group
- 18.12 Other Relevant Market Participants
Note: Every listed company is profiled on the structure shown under the first company. The company list is preliminary and may change based on research findings, market developments, data availability and client requirements.
Chapter 19 Disclaimer
- 19.1 Research and Forecast Disclaimer
- 19.2 Data Source and Estimation Limitations
Note: The depth of individual sections depends on data availability for this market. Volume, capacity, trade and other unit-based metrics are included where applicable.

