
Urban haze turns indoor cleaning devices into staples
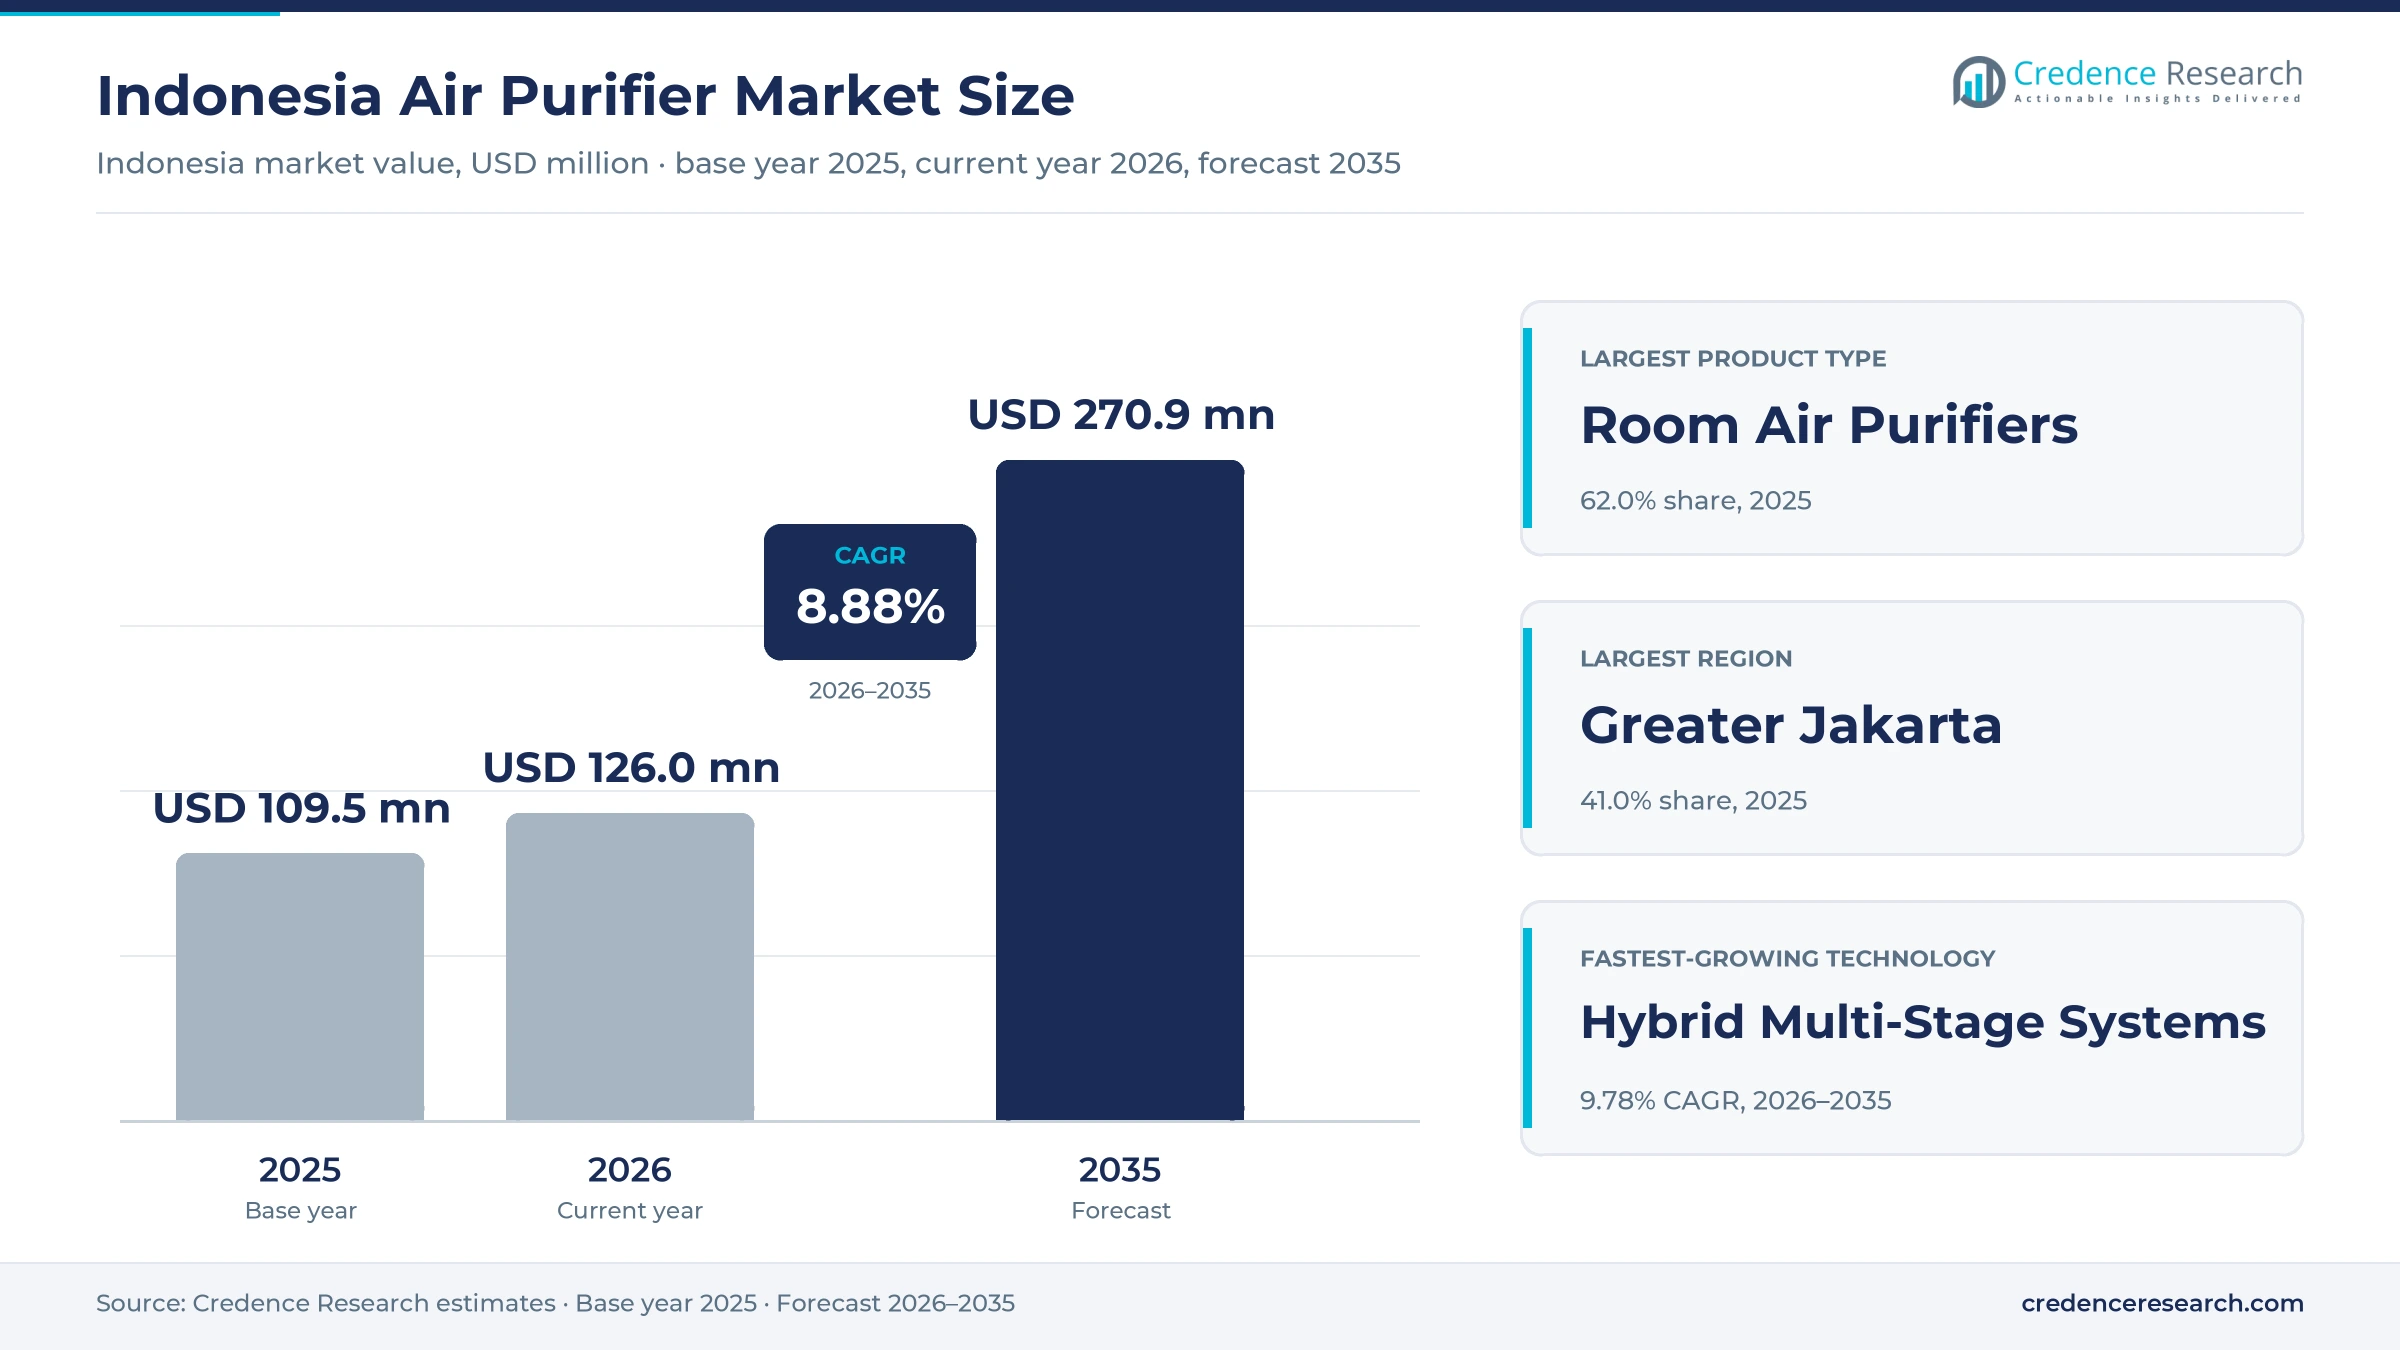
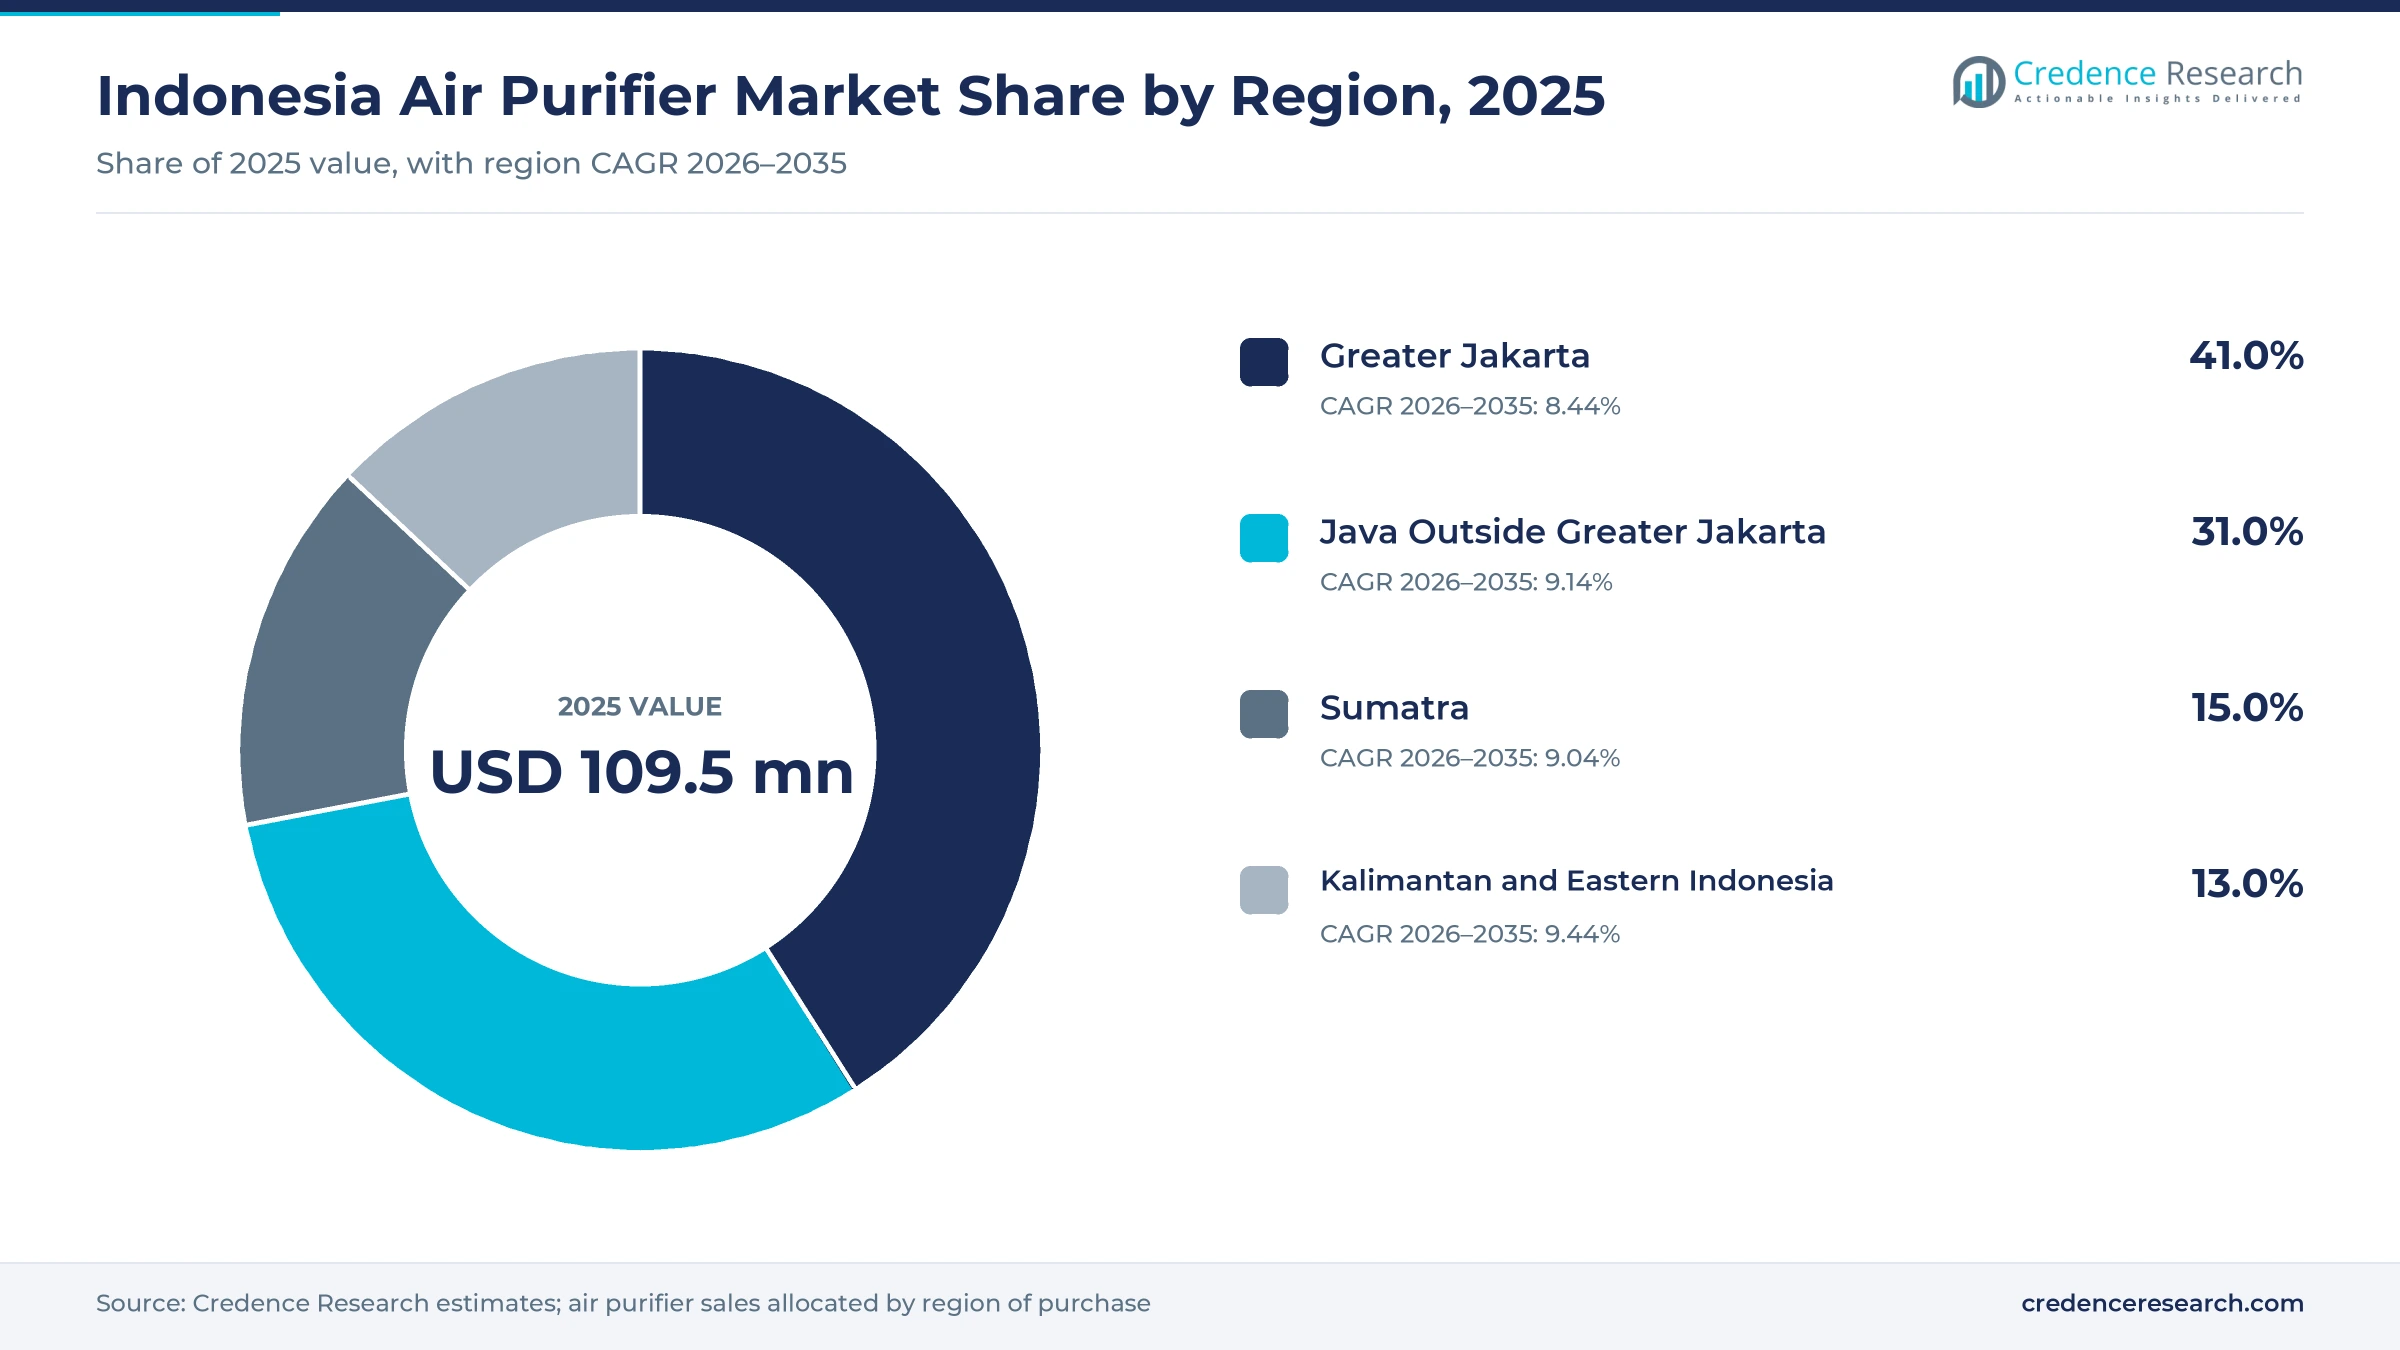
The Indonesia air purifier market was valued at USD 109.5 million in 2025 and is projected to increase from USD 126.0 million in 2026 to USD 270.9 million by 2035, registering a CAGR of 8.88% during 2026–2035. Demand comes from households and offices that face recurring fine-particle pollution, dry-season haze and growing awareness of respiratory illness. Greater Jakarta held the largest regional share, 41.0% in 2025, because the capital region combines the worst urban air with the highest incomes and dense retail coverage. Kalimantan and Eastern Indonesia is the fastest-growing region at 9.44% a year, as online delivery reaches cities that had few appliance stores. Room units led the product mix, while connected models with app control and real-time sensors are spreading across price tiers. Jakarta is drafting a 2025 to 2045 air quality road map to replace a 2005 bylaw, which keeps indoor protection in public debate.
Which devices and buyers does the indoor cleaning estimate cover?
The estimate measures retail and project sales value of finished air purifiers sold in Indonesia to households, offices, hotels, shops, clinics, hospitals and schools. It covers room units, whole-home and ducted purification systems, portable personal and in-car devices, and combined purifier and humidifier models. Values are stated in USD million at current prices and include sales through online marketplaces, brand web stores, electronics chains and institutional dealers.
The estimate excludes replacement filters sold separately, standalone air conditioners with built-in ionizers, industrial dust collectors and vehicle cabin filters fitted at the factory, and it also leaves out exports to other countries. The value chain runs from filter media and sensor suppliers through overseas and local assembly to brand owners, distributors and the retailers and dealers that sell and service devices across the islands.
Indonesia Air Purifier Market Insights
- The Indonesia air purifier market was valued at USD 109.5 million in 2025 and is projected to reach USD 270.9 million by 2035, registering a CAGR of 8.88% during 2026–2035.
- Greater Jakarta held 41.0% of 2025 sales, because the capital region pairs persistent fine-particle pollution with high incomes and dense appliance retail.
- Room air purifiers led with 62.0% of 2025 value, because single-room units fit apartments and bedrooms at prices that most urban buyers can afford.
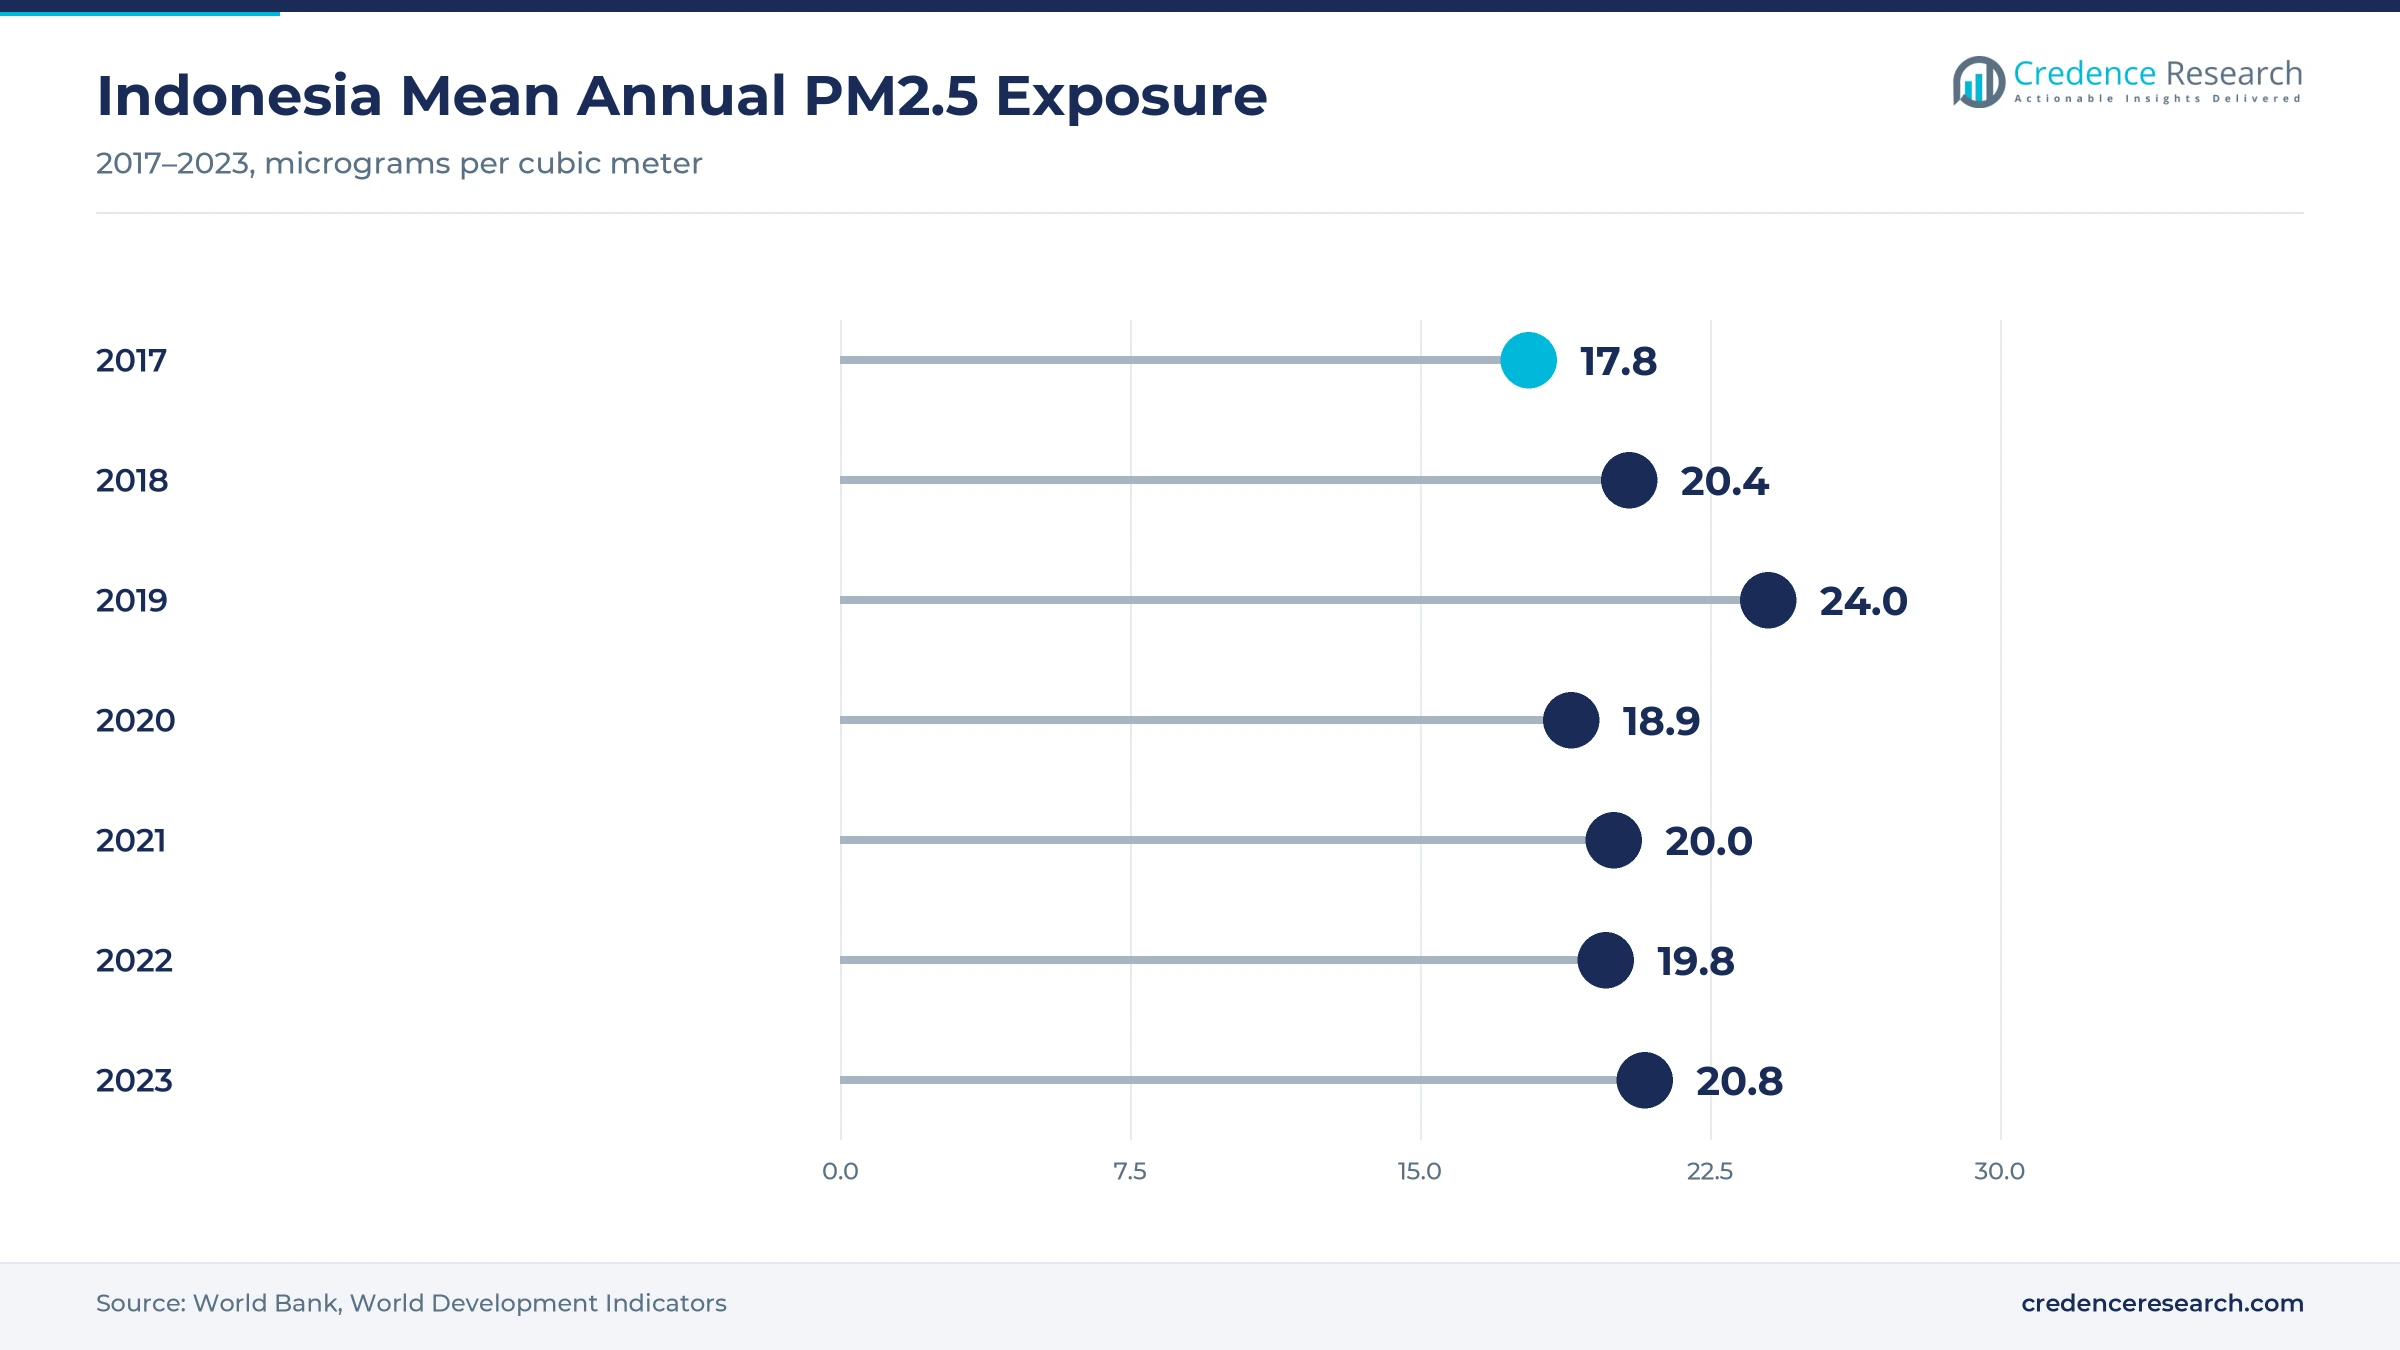
- Indonesia's mean annual PM2.5 exposure was 20.8 micrograms per cubic meter in 2023, based on World Bank data, well above the WHO guideline level.
- Coway introduced its Squarebig and Squarefit purifiers in April 2026, after opening sales offices outside Jakarta, which shows brands chasing demand beyond the capital.
Room units lead while whole-home systems grow fastest
Why do room units lead product demand?
Based on product type, the market is categorized into room air purifiers, whole-home air purification systems, portable personal purifiers and air purifier and humidifier combos. Room Air Purifiers led with 62.0% of 2025 value, because single-room units suit apartments and bedrooms and sell at accessible prices online. Whole-Home Air Purification Systems grow fastest at 9.81% a year, as new landed homes, offices and clinics add ducted filtration to cooling systems.
How are multi-stage filters changing the technology mix?
Based on technology, the market is categorized into HEPA filtration, activated carbon filtration, UV-C purification and hybrid multi-stage systems. HEPA Filtration led with 46.0% of 2025 value, because HEPA filters capture fine particles that drive most buying decisions in polluted cities. Hybrid Multi-Stage Systems grow fastest at 9.78% a year, as brands combine particle, odor and germ control in one housing with sensors and automatic modes.
How much do offices, schools and clinics buy?
Based on end user, the market is categorized into residential households, corporate offices, hospitality and retail facilities, and healthcare and education facilities. Residential Households led with 58.0% of 2025 value, because most units are bought for bedrooms and family living rooms. Healthcare and Education Facilities grow fastest at 9.21% a year among institutional buyers, as schools and clinics respond to respiratory illness and dry-season haze.
Which sales channels are gaining share?
Based on distribution channel, the market is categorized into e-commerce marketplaces, brand-owned online stores, electronics retail chains and HVAC and institutional dealers. E-Commerce Marketplaces led with 38.0% of 2025 value, because marketplaces offer wide choice, price comparison and delivery across the islands. Brand-Owned Online Stores grow fastest at 9.94% a year, as brands sell filters and subscriptions directly.
| Segment Group | Leading Sub-segment | Share, 2025 | Fastest-growing Sub-segment | CAGR, 2026–2035 |
|---|---|---|---|---|
| By Product Type | Room Air Purifiers | 62.0% | Whole-Home Air Purification Systems | 9.81% |
| By Technology | HEPA Filtration | 46.0% | Hybrid Multi-Stage Systems | 9.78% |
| By End User | Residential Households | 58.0% | Healthcare and Education Facilities | 9.21% |
| By Distribution Channel | E-Commerce Marketplaces | 38.0% | Brand-Owned Online Stores | 9.94% |
Request a Free Sample
Fill in your details and we'll send you a free sample report.
- Sample data tables & charts
- Research methodology
Pollution, online retail and connected homes lift demand
How does persistent urban pollution lift purifier demand?
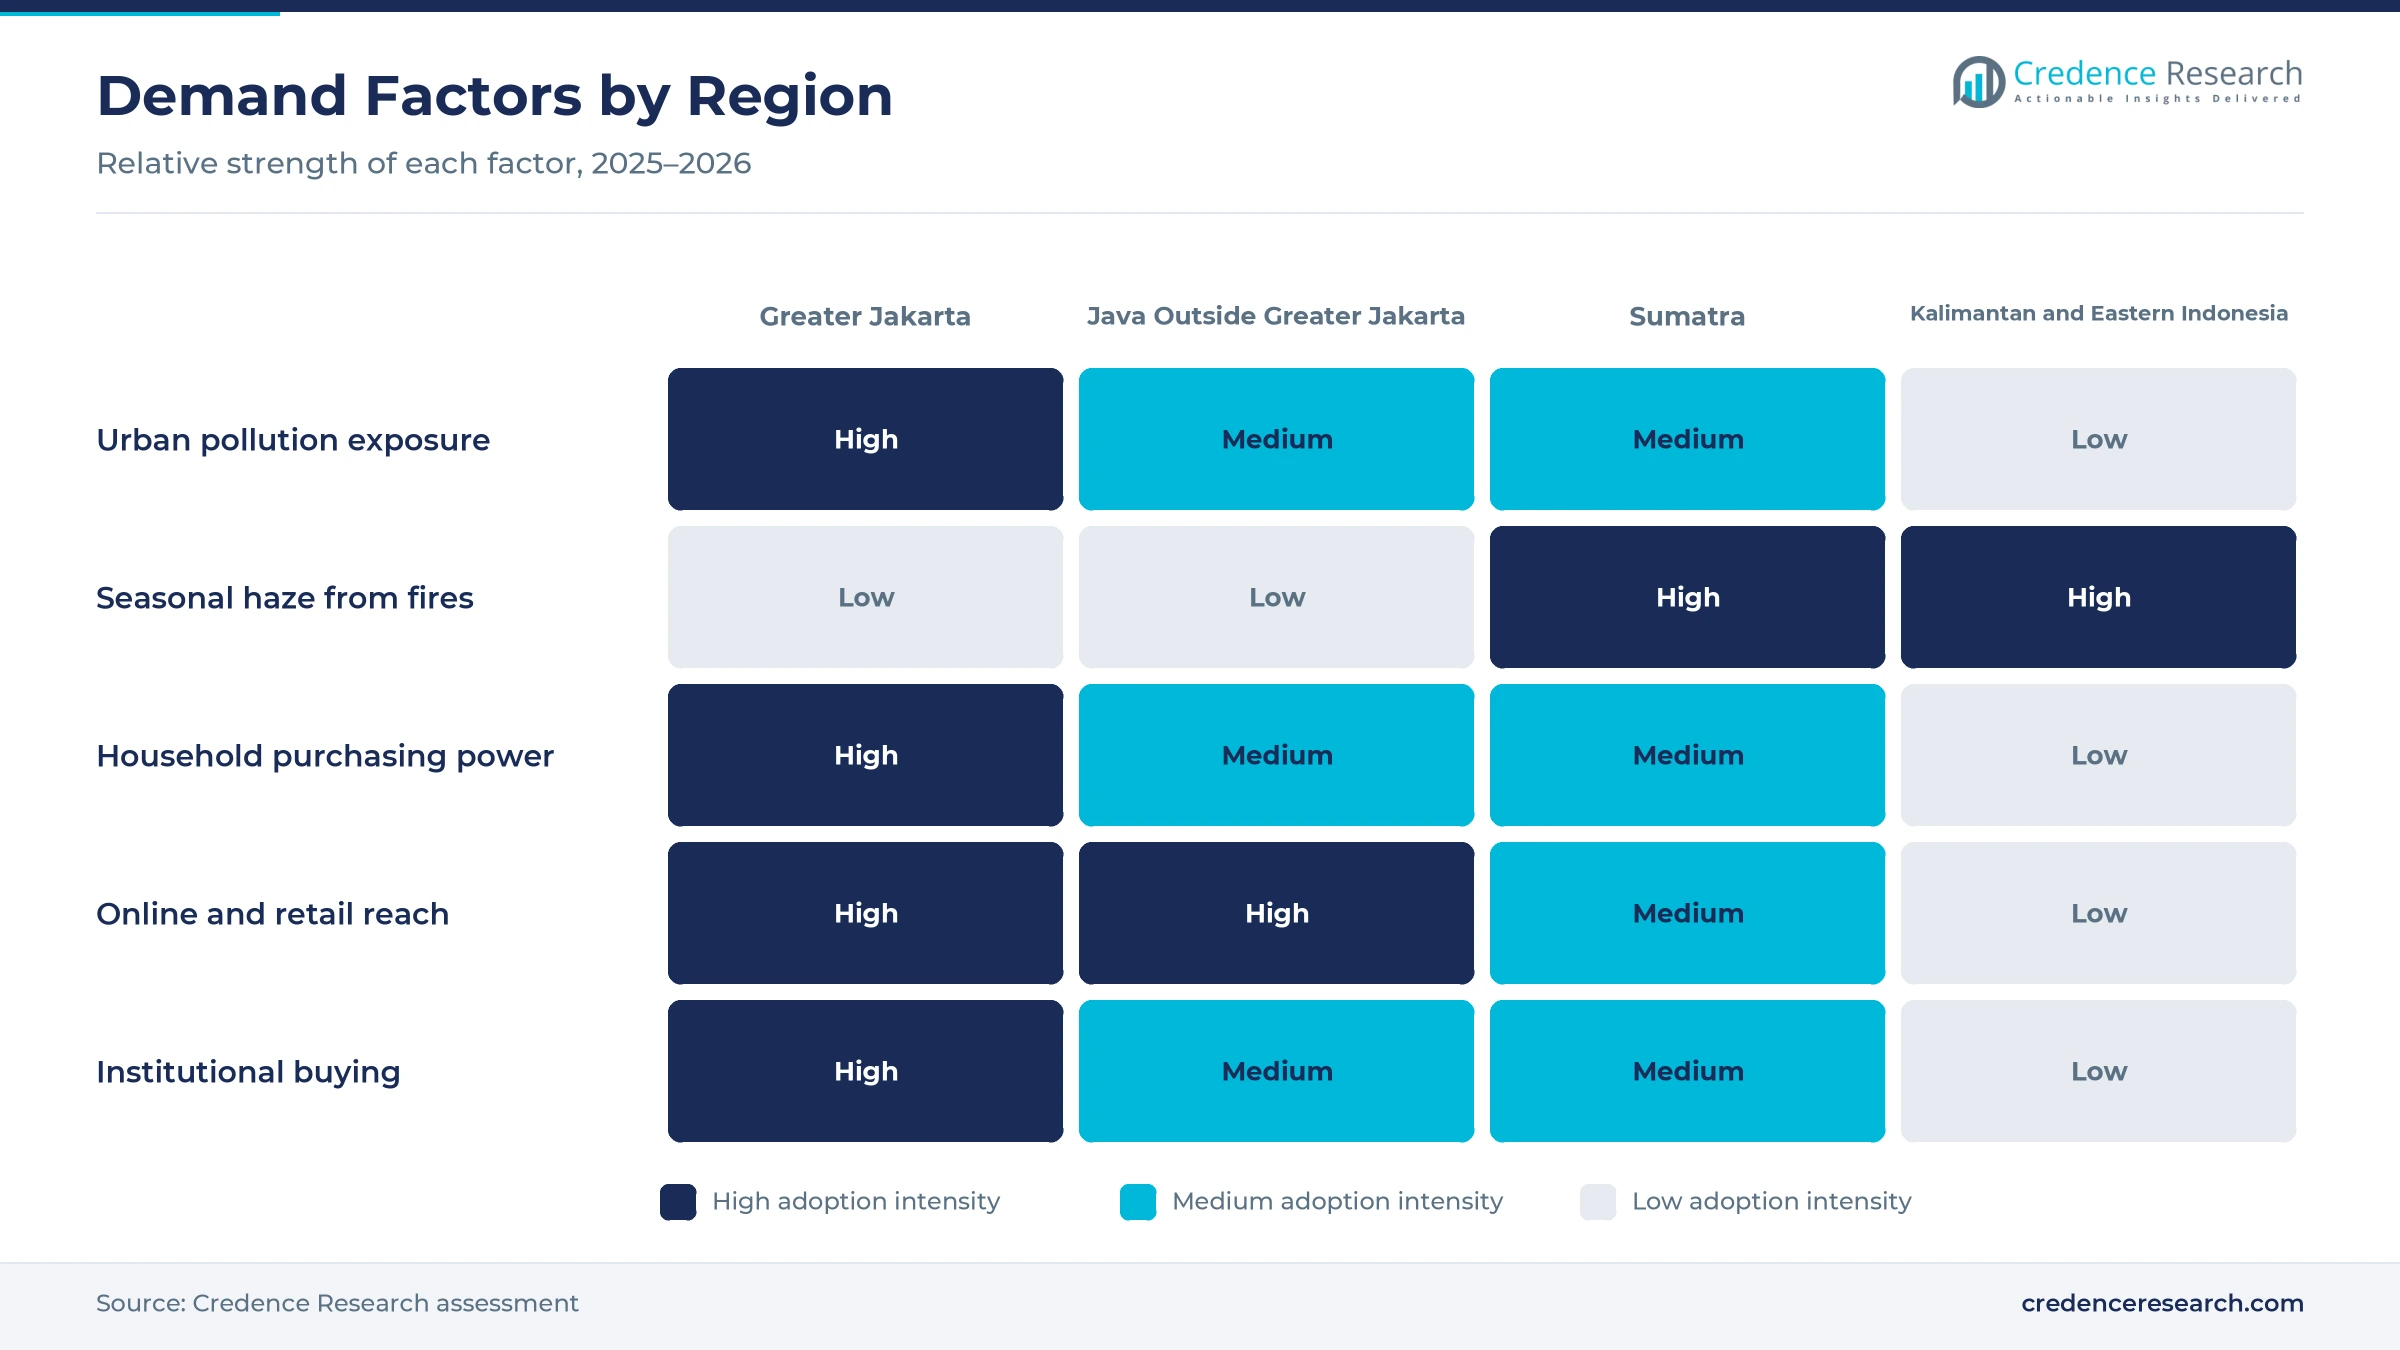
Persistent fine-particle pollution is the core driver, because buyers purchase purifiers when outdoor air stays unhealthy for weeks. Indonesia's mean annual PM2.5 exposure reached 20.8 micrograms per cubic meter in 2023, up from 18.9 in 2020, according to World Bank data. In February 2026, Jakarta's PM2.5 level was more than eight times the WHO threshold, and the city recorded at least 2 million respiratory illness cases in 2025, according to Asia News Network. The meteorology agency also warned that the 2026 dry season could be longer and drier than 2025. As a result, the capital region holds the largest regional share, and repeat buying rises with each new haze season.
Why does digital appliance distribution widen the buyer base?
Digital appliance distribution widens the buyer base, because marketplaces reach households in cities without brand stores. Internet penetration reached 80.66% in 2025, or about 229 million people, based on the national internet providers association survey reported by Selular. Statistics Indonesia, the national statistics office, counted 4.4 million e-commerce businesses in 2024, up 15.3% from 2023, and 66.87% of deliveries went to Java. In addition, Coway opened a Surabaya sales office in 2025 and promoted new devices there in September 2026. E-commerce marketplaces therefore hold 38.0% of 2025 value, and online reach carries brands to first-time buyers in secondary cities outside the capital region.
How do smart-home and connected devices raise spending?
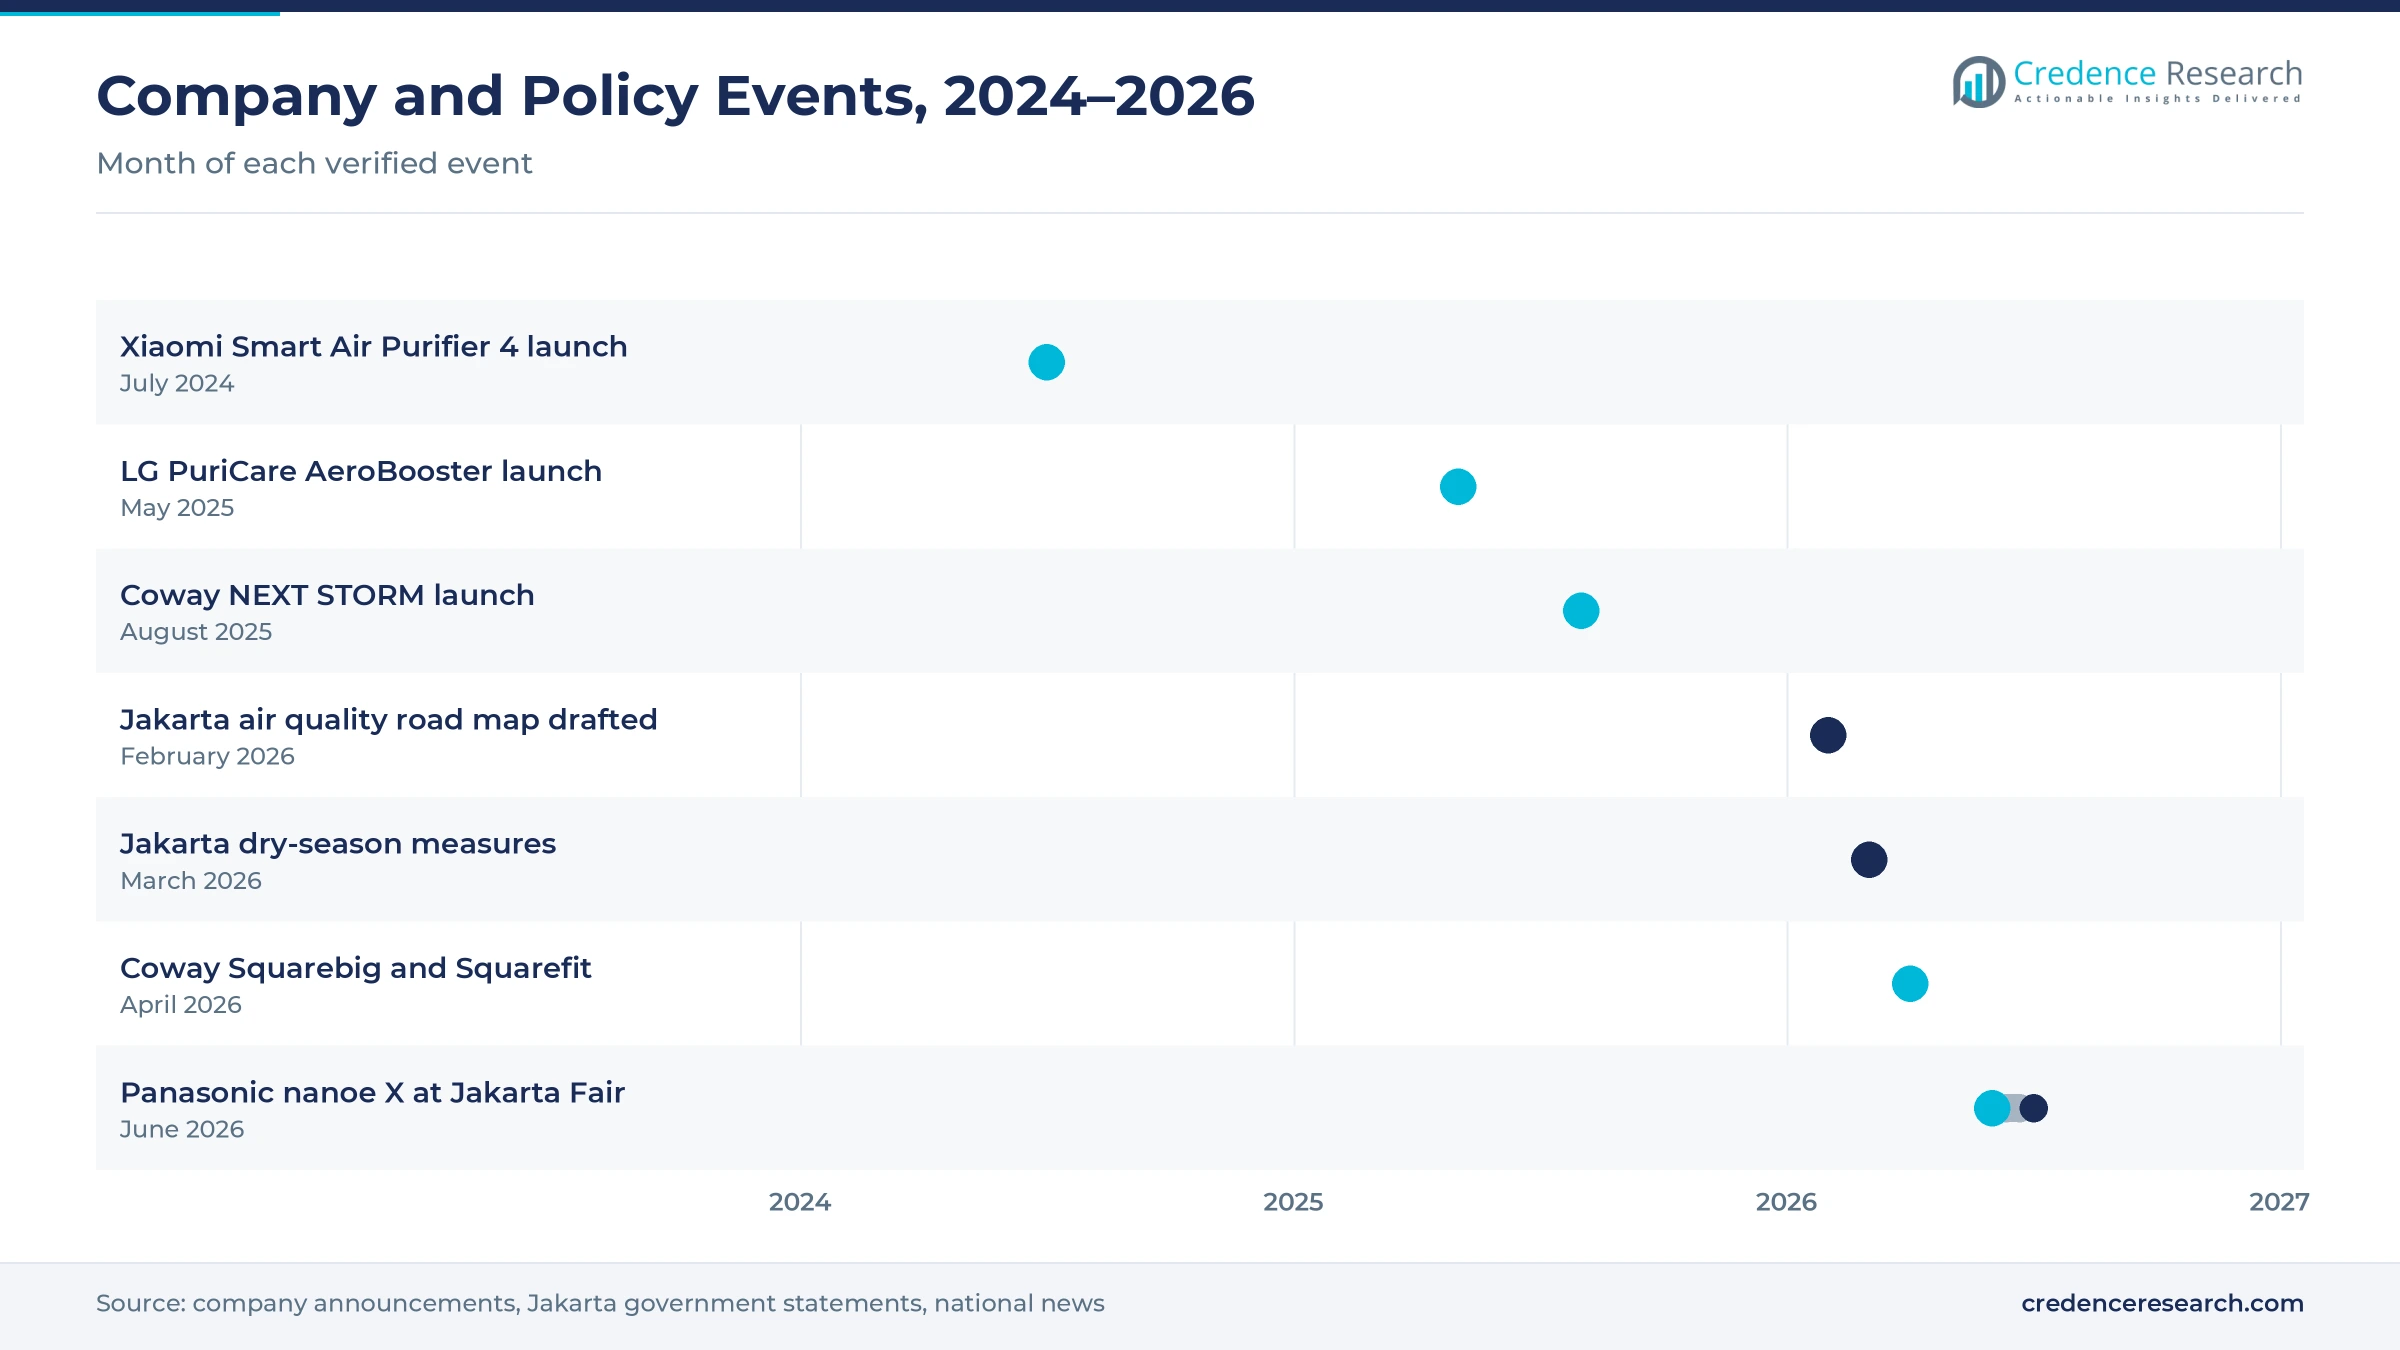
Smart-home adoption raises average spending, because connected purifiers with sensors and app control sell at higher prices. Xiaomi Indonesia launched the Smart Air Purifier 4 and Smart Air Purifier Elite on July 2, 2024, both controlled through its home app. LG Electronics Indonesia launched the PuriCare AeroBooster and AeroHit in Jakarta on May 23, 2025, noting that adoption was still low. Coway's Squarebig, introduced in April 2026, monitors air quality in real time and covers rooms of up to 79 square meters. In turn, buyers pair purifiers with other smart home devices, and multi-stage hybrid systems become the fastest-growing technology through 2035.
Why do offices, schools and public buyers add demand?
Institutional buying adds a second demand stream, because employers, schools and agencies buy many units at once when haze peaks. Sharp Electronics Indonesia said in August 2023 that its business and government project sales had risen by 60% to 70%, according to Kontan. Sharp also reported strong demand for units covering more than 35 square meters from corporate, government and education buyers. In addition, Jakarta installed water mist systems at 100 locations by March 2026, showing that public bodies treat air quality as a health priority. Residential households still hold 58.0% of value, while healthcare and education buyers grow at 9.21% a year.
Design-led launches and b2B buying reshape the category
How is the shift to design-led and quieter units changing products?
A shift toward design-led and quieter purifiers is changing how brands compete, because buyers now place units in living rooms and bedrooms. Coway introduced its NEXT STORM purifier in August 2025 with stronger output, wider coverage and quieter operation. In April 2026, Coway added Squarebig and Squarefit in natural colors designed to blend with home interiors, with Squarebig rated for rooms of 79 square meters. LG's 2025 AeroBooster targets large rooms and uses a slim tube body and rotating fan to spread clean air around large rooms. Sharp's Purefit FX-S120Y, available since October 2023, covers rooms of 84 square meters. As a result, room air purifiers keep 62.0% of value, while premium and smart tiers gain share as buyers treat devices as visible furniture.
Why is the rise of hybrid and germ-control features spreading?
The rise of hybrid filtration and germ-control features is spreading, because buyers want one device that handles dust, odor and microbes. Sharp sells 33 active purifier models in Indonesia for rooms of 10 to 62 square meters, including units with humidifiers, dehumidifiers and in-car formats, which pair with standalone humidifiers in dry rooms. Panasonic showed air conditioners with its nanoe X Generator Mark3 at the Jakarta Fair from June 11 to July 12, 2026, promoting indoor air quality as a cooling feature. Hybrid multi-stage systems therefore grow at 9.78% a year, the fastest technology rate, while filters with activated carbon layers remain standard for odor control.
Can schools, clinics and offices open a project channel?
Schools, clinics and offices are an opening for brands, because procurement teams order many identical units with service contracts. WHO estimates that ambient air pollution caused 4.2 million premature deaths worldwide in 2019, with the greatest burden in South-East Asia and the Western Pacific, according to WHO. Sharp reported demand for large-room units from education and government buyers during the 2023 haze. In addition, healthcare and education facilities grow faster than offices, because clinics and classrooms run purifiers for long daily hours and need large-room units. Building managers that already hire contract cleaning services can add filter replacement to the same service visits.
Is there room to grow sales outside Java?
Sales outside Java offer a large opening, because adoption remains low in Sumatra, Kalimantan and eastern cities. Internet penetration in Maluku and Papua reached 69.26% in 2025, against 84.69% in Java, based on a survey of 8,700 respondents in 38 provinces, which shows that online reach is widening but still uneven. Coway described its Surabaya push in September 2026 as part of a strategy to get closer to buyers beyond the capital region, after opening a Bandung office. Seasonal forest and peat fires also cause haze in Sumatra and Kalimantan, which creates sudden demand. In turn, Kalimantan and Eastern Indonesia becomes the fastest-growing zone, as marketplaces and dealers add coverage in Balikpapan, Makassar and Manado through 2035.
Low adoption, filter costs and price gaps slow growth
How does low household adoption limit growth?
Low household adoption remains the largest constraint, because many families still see purifiers as optional rather than essential. LG noted in May 2025 that adoption in Indonesia was still low, even after several haze seasons. As a result, brands must spend on education and promotions each dry season. Demand also falls when rains clear the air, which leaves retailers with seasonal stock swings and discounting pressure. Brands that build year-round health messaging and bundle filters with devices are best placed to smooth these demand cycles.
Why do filter costs deter repeat use?
Filter replacement costs deter repeat use, because HEPA and carbon filters must be changed every few months in polluted cities. Many buyers stop replacing filters after the first year, which lowers device performance and trust in the category. In turn, brands lose recurring revenue from consumables when owners let filters expire without replacement. Firms respond with longer-life filters, reminders in apps and subscription plans that spread costs across the year. Clear filter-life indicators on devices also help owners keep units working at rated performance.
How do price gaps and imports pressure margins?
Price gaps and imported low-cost models pressure margins, because marketplaces list many unbranded devices with uncertain filter ratings. Shoppers often compare headline prices rather than clean air delivery rates, which favors cheaper units. As a result, established brands must offer entry models and frequent discounts. Rupiah weakness also raises landed costs for imported units and parts, which squeezes retail margins for distributors that buy stock months ahead of the haze season.
Why does weak product information slow trading up?
Weak product information slows trading up, because many buyers cannot compare room coverage, filter grades or noise levels. Claims about ionizers and germ control vary across brands, which confuses shoppers. Therefore, some buyers delay purchases or choose units that are too small for their rooms. Brands respond with room-size guides, in-store demonstrations and doctor-led campaigns on indoor air quality, which help shoppers match device capacity to the rooms they need to clean.
Greater Jakarta leads while eastern islands grow fastest
| Region | Value, 2025 (USD million) | Share, 2025 | CAGR, 2026–2035 |
|---|---|---|---|
| Greater Jakarta | 44.9 | 41.0% | 8.44% |
| Java Outside Greater Jakarta | 33.9 | 31.0% | 9.14% |
| Sumatra | 16.4 | 15.0% | 9.04% |
| Kalimantan and Eastern Indonesia | 14.2 | 13.0% | 9.44% |
Why does Greater Jakarta hold the largest share?
Greater Jakarta held 41.0% of 2025 value and grows at 8.44% a year, because the capital region combines heavy traffic, construction dust and coal plant emissions with the country's highest incomes. More than 25 million vehicles operate in Jakarta, according to city officials. In turn, offices, schools and apartment households buy most premium units here, although growth slows as the base matures. Replacement filters and second units for bedrooms now make up a larger part of demand in apartments and landed homes across the capital region.
How does Java outside the capital add volume?
Java Outside Greater Jakarta held 31.0% of 2025 value and grows at 9.14% a year, because Surabaya, Bandung, Semarang and Yogyakarta have large middle-class populations. Coway opened sales offices in Surabaya and Bandung, which shows brands moving beyond the capital. Industrial zones in West and East Java also add office and factory demand for larger units. Internet penetration of 84.69% across Java in 2025 also supports online buying in secondary cities, where electronics chains have fewer stores than in the capital.
What drives demand in Sumatra?
Sumatra held 15.0% of 2025 value and grows at 9.04% a year, because Medan, Palembang and Pekanbaru face both urban pollution and seasonal haze from peat fires. Buying spikes when haze closes schools and airports, which makes demand uneven from year to year. However, online delivery is reaching more Sumatran cities, which smooths stock shortages during haze events. Rising incomes in plantation and mining towns also widen the base of households that can afford branded units and replacement filters.
Why is Kalimantan and Eastern Indonesia growing fastest?
Kalimantan and Eastern Indonesia held 13.0% of 2025 value and grows fastest at 9.44% a year, because low adoption leaves room for first-time buyers. Fire-prone peatlands in Kalimantan create haze in dry years, and new government and mining offices add institutional demand. As a result, marketplaces and dealers are adding coverage in Balikpapan, Makassar and Manado.
New launches and sales offices marked 2025 and 2026
| Development | Status and market relevance |
|---|---|
| In July 2024, Xiaomi Indonesia launched the Smart Air Purifier 4 and Smart Air Purifier Elite with app-based control. | Brings connected purifiers to mid-range online buyers |
| In May 2025, LG Electronics Indonesia launched the PuriCare AeroBooster and AeroHit purifiers in Jakarta. | Adds design-led units to a category LG described as still low in adoption |
| In August 2025, Coway introduced its NEXT STORM purifier with wider coverage and quieter operation. | Extends Coway's best-selling room purifier line in Indonesia |
| In April 2026, Coway introduced the Squarebig and Squarefit purifiers with real-time air quality monitoring. | Targets buyers who want devices that match home interiors |
| In June 2026, Panasonic showed nanoe X air conditioners and air quality devices at the Jakarta Fair. | Links indoor air quality with cooling purchases |
Multi-stage filters, sensors and app control spread
- Multi-stage filtration combines pre-filters, HEPA media and carbon layers in one housing, which lets a single unit handle dust, smoke and odors.
- Laser particle sensors measure PM1, PM2.5 and PM10 in real time, which allows automatic fan speeds and live readings on displays and apps.
- App and voice control links purifiers to home ecosystems, which lets users schedule cleaning, track filter life and check indoor air remotely.
- Ion and germ-control modules such as Sharp Plasmacluster and Panasonic nanoe X release charged particles that brands promote for odor and microbe control.
Need a Custom Version of This Report?
Tailor the scope, geography, or segments to your exact requirements.
- Custom geography or segment scope
- Direct access to our analyst team
Japanese, Korean and Chinese brands compete on value
Competition is led by Japanese, Korean and Chinese appliance brands that sell through marketplaces, electronics chains and project dealers. Sharp offers 33 active purifier models in Indonesia and builds on its Plasmacluster ion technology, with strong project sales to offices and schools. Xiaomi competes on value and app control through its home ecosystem, while LG Electronics adds design-led PuriCare units. Coway combines room purifiers with sales offices in Jakarta, Bandung and Surabaya and a steady pace of launches. Panasonic links nanoe X air quality features to its cooling range, and Daikin sells purifiers that use its Streamer technology. Rivals compete on clean air delivery rate, filter costs, noise, design and after-sales service, while marketplace rankings and seasonal promotions decide much of the volume. Many lower-priced imported brands also sell online, which keeps price competition intense.
Companies profiled and their roles in this market
| Company | Type | Role in the market |
|---|---|---|
| Sharp Corporation | Appliance maker | Sells 33 active purifier models through retail and business and government projects |
| Xiaomi Corporation | Consumer electronics brand | Launched Smart Air Purifier 4 and Elite in July 2024 with app control |
| LG Electronics | Appliance maker | Launched PuriCare AeroBooster and AeroHit in Jakarta in May 2025 |
| Coway Co., Ltd. | Purifier specialist | Runs sales offices in Jakarta, Bandung and Surabaya and launched Squarebig in 2026 |
| Panasonic Corporation | Appliance maker | Promotes nanoe X indoor air features across purifiers and air conditioners |
Credence Research view on adoption and pricing
Credence Research's view is that Indonesia's air purifier demand will grow faster than appliance spending because haze and urban pollution have made indoor air a household health concern. Online channels now carry brands to buyers outside Jakarta, and connected models raise average prices. However, low adoption, filter costs and cheap imports will keep margins tight. Brands that pair reliable filters with app reminders, service networks and project sales to schools and offices should gain share fastest through 2035.
How the Indonesia indoor cleaning estimate was built
The report uses 2025 as the base year on a calendar basis, and market values come from the Credence Research model. That model combines household and urbanization data, pollution exposure from World Bank data, company disclosures on launches and channels, and typical retail prices by product type. Segment and regional splits are Credence Research estimates based on pollution, income and retail reach by zone. Sources used are government releases, company announcements, industry news and statistical databases, and no interviews or surveys were used.
Wider adoption beyond Jakarta carries growth to 2035
Air purifier sales are expected to reach USD 270.9 million by 2035, an 8.88% CAGR during 2026–2035, as haze seasons and urban pollution keep indoor air quality on the household agenda. Growth should stay strong through 2028 while online channels and connected models widen the buyer base. After that, filter replacement, trading up and institutional orders will carry growth as first-time buying slows in Greater Jakarta. Lasting improvement in outdoor air would lower this outlook, while longer dry seasons would raise it.
Frequently Asked Questions
How big is the Indonesia air purifier market?
Which product type leads air purifier sales in Indonesia?
Which region leads the Indonesia air purifier market?
Which sales channel is growing fastest?
What drives air purifier demand in Indonesia?
How polluted is the air in Indonesia?
Who are the leading air purifier companies in Indonesia?
What are the main challenges for air purifier brands?
Table of Content
Chapter 1 Market Segmentation
- 1.1 Segmentation Framework
- 1.1.1 Product and Service Classification
- 1.1.2 Application and End-Use Classification
- 1.1.3 Technology and Solution Classification
- 1.1.4 Customer and Distribution Channel Classification
- 1.1.5 Geographic Segmentation
- 1.1.6 Market Segment Definitions and Boundaries
- 1.2 By Product Type
- 1.2.1 Room Air Purifiers
- 1.2.2 Whole-Home Air Purification Systems
- 1.2.3 Portable Personal Purifiers
- 1.2.4 Air Purifier and Humidifier Combos
- 1.3 By Technology
- 1.3.1 HEPA Filtration
- 1.3.2 Activated Carbon Filtration
- 1.3.3 UV-C Purification
- 1.3.4 Hybrid Multi-Stage Systems
- 1.4 By End User
- 1.4.1 Residential Households
- 1.4.2 Corporate Offices
- 1.4.3 Hospitality and Retail Facilities
- 1.4.4 Healthcare and Education Facilities
Chapter 2 Introduction
- 2.1 Report Objectives and Scope
- 2.2 Product Definition and Industry Terminology
- 2.3 Market Inclusions and Exclusions
- 2.4 Research Process
- 2.4.1 Primary Research and Expert Interviews
- 2.4.2 Secondary Research and Source Review
- 2.4.3 Top-Down and Bottom-Up Estimation
- 2.4.4 Data Triangulation and Verification
- 2.5 Market Size Measurement Basis
- 2.5.1 2025: USD 109.5 million → 2035: USD 270.9 million
- 2.6 Historical and Forecast Reference Periods
- 2.6.1 Historical Period: 2018-2025
- 2.6.2 Base Year: 2025
- 2.6.3 Forecast Period: 2025-2035
- 2.7 Research Assumptions and Limitations
Chapter 3 Executive Summary
- 3.1 Market Snapshot and Key Findings
- 3.2 Base-Year Market Size, 2025
- 3.3 Forecast Market Size, 2035
- 3.4 Revenue and Volume Growth Outlook
- 3.5 Key Demand and Supply Indicators
- 3.6 Leading Market Segments
- 3.7 Fastest-Growing Market Opportunities
- 3.8 Regional Performance Highlights
- 3.9 Technology and Industry Transformation
- 3.10 Competitive Landscape Summary
- 3.11 Analyst View and Strategic Implications
Chapter 4 Indonesia Air Purifier Market Trends and Developments
- 4.1 Historical Industry Development, 2018-2025
- 4.2 Recent Market Trends and Developments
- 4.3 Demand and Customer Behavior Trends
- 4.4 Technology and Product Innovation
- 4.5 Artificial Intelligence, Automation and Digitalization
- 4.6 Local Manufacturing and Supply Chain Realignment
- 4.7 Industry Partnerships, Mergers and Acquisitions
- 4.8 Sustainability and Circular Economy Developments
- 4.9 Government and Private Sector Investment Trends
- 4.10 Emerging Business Models and Commercialization
- 4.11 Industry Developments and Announcements
Chapter 5 Indonesia Air Purifier Market Production, Supply and Demand Analysis
- 5.1 Demand Trend and Consumption Analysis, 2018-2025
- 5.2 Demand Forecast, 2025-2035
- 5.3 Production and Output Trend, 2018-2025
- 5.4 Production and Output Forecast, 2025-2035
- 5.5 Installed Capacity and Capacity Utilization
- 5.6 Company-Wise Production Plants and Statistics
- 5.6.1 Installed Production Capacity
- 5.6.2 Actual Production
- 5.6.3 Planned Capacity and Expansion Targets
- 5.7 Supply Chain Structure and Procurement Trends
- 5.8 Supply-Demand Gap and Bottlenecks
- 5.9 Import Dependence and Sourcing Structure
- 5.10 Contract Manufacturing and Outsourcing
- 5.11 Regional Supply and Demand Concentration
Chapter 6 Indonesia Air Purifier Market Pricing Analysis
- 6.1 Pricing Structure and Measurement
- 6.2 Historical Pricing Trends, 2018-2025
- 6.3 Pricing Outlook, 2025-2035
- 6.4 Average Selling Price and Unit Economics
- 6.5 Pricing by Product and Market Segment
- 6.6 Geographic Pricing Differences
- 6.7 Key Input, Energy, Labor and Logistics Costs
- 6.8 Contract Pricing and Purchasing Models
- 6.9 Pricing Sensitivity and Competitive Positioning
- 6.10 Price, Margin and Profitability Implications
Chapter 7 Indonesia Air Purifier Market Dynamics
- 7.1 Market Growth Drivers
- 7.1.1 Demand-Side Drivers
- 7.1.2 Technology and Innovation Drivers
- 7.1.3 Infrastructure and Investment Drivers
- 7.1.4 Regulatory and Policy Drivers
- 7.2 Market Restraints
- 7.2.1 Cost and Affordability Constraints
- 7.2.2 Technology and Adoption Barriers
- 7.2.3 Supply Chain and Operational Constraints
- 7.3 Market Challenges
- 7.3.1 Competitive Pressure and Margin Erosion
- 7.3.2 Skills, Infrastructure and Implementation Gaps
- 7.4 Emerging Market Opportunities
- 7.5 Market Dynamics Impact and Time-Horizon Assessment
Chapter 8 Indonesia Air Purifier Value Chain Analysis
- 8.1 Industry Value Chain Overview
- 8.2 Upstream Suppliers and Critical Inputs
- 8.3 Technology and Component Providers
- 8.4 Manufacturing or Service Delivery
- 8.5 Distribution, Channel Partners and Integrators
- 8.6 Downstream Applications and End Users
- 8.7 Value Addition and Profit Pools
- 8.8 Vertical Integration and Outsourcing
- 8.9 Supplier Concentration and Risk
- 8.10 Supply Chain Localization and Resilience
Chapter 9 Indonesia Air Purifier Market Regulations and Policies
- 9.1 Relevant Laws, Standards and Compliance Frameworks
- 9.2 Product, Service, Safety and Quality Requirements
- 9.3 Government Policies, Incentives and Subsidies
- 9.4 Imports, Exports and Trade Barriers
- 9.5 Public Procurement and Local Content Requirements
- 9.6 Environmental and Sustainability Compliance
- 9.7 Upcoming Policy Changes and Market Implications
Chapter 10 Indonesia Air Purifier Market Hotspots and Opportunities
- 10.1 Market Opportunity Mapping and Growth Hotspots
- 10.2 High-Growth Applications and Customer Groups
- 10.3 Underserved Markets and White-Space Opportunities
- 10.4 Emerging Technology and Product Opportunities
- 10.5 New Capacity and Investment Hotspots
- 10.6 Market Entry and Expansion Opportunities
- 10.7 Distribution and Partnership Opportunities
- 10.8 Near-Term and Long-Term Commercial Potential
- 10.9 Opportunity Attractiveness and Execution Risks
Chapter 11 Indonesia Air Purifier Market Outlook, 2025-2035
- 11.1 Market Size and Analysis
- 11.1.1 Revenue (Market Measurement: 2025: USD 109.5 million → 2035: USD 270.9 million)
- 11.1.2 Market Volume and Quantity Sold
- 11.1.3 Historical Market Size, 2018-2025
- 11.1.4 Base-Year Market Size, 2025
- 11.2 Market Forecast, 2025-2035
- 11.2.1 Revenue Forecast to 2035
- 11.2.2 Volume Forecast to 2035
- 11.2.3 CAGR and Year-on-Year Growth
- 11.2.4 Incremental Revenue Opportunity
- 11.3 Forecast Assumptions and Scenario Analysis
- 11.3.1 Base-Case Forecast
- 11.3.2 Optimistic and Conservative Scenarios
- 11.3.3 Technology, Pricing and Policy Sensitivities
- 11.4 Market Attractiveness and Growth Outlook
Chapter 12 Indonesia Air Purifier Market Segmentation and Outlook
- 12.1 Segmentation Summary and Market Shares, 2025
- 12.2 Largest and Fastest-Growing Segments
- 12.3 By Product Type - Market Size and Forecast, 2025-2035
- 12.3.1 Segment Definition and Scope
- 12.3.2 Historical Market Size, 2018-2025
- 12.3.3 Revenue Forecast, 2025-2035
- 12.3.4 Volume Forecast, 2025-2035
- 12.3.5 Base-Year Market Share, 2025
- 12.3.6 Segment CAGR and Growth Drivers
- 12.3.7 Subsegment Market Size and Forecast
- 12.3.7.1 Room Air Purifiers
- 12.3.7.2 Whole-Home Air Purification Systems
- 12.3.7.3 Portable Personal Purifiers
- 12.3.7.4 Air Purifier and Humidifier Combos
- 12.3.8 Subsegment Pricing and Adoption Trends
- 12.3.9 Leading Suppliers and Competition
- 12.3.10 Regional Demand and Opportunities
- 12.4 By Technology - Market Size and Forecast, 2025-2035
- 12.4.1 Segment Definition and Scope
- 12.4.2 Historical Market Size, 2018-2025
- 12.4.3 Revenue Forecast, 2025-2035
- 12.4.4 Volume Forecast, 2025-2035
- 12.4.5 Base-Year Market Share, 2025
- 12.4.6 Segment CAGR and Growth Drivers
- 12.4.7 Subsegment Market Size and Forecast
- 12.4.7.1 HEPA Filtration
- 12.4.7.2 Activated Carbon Filtration
- 12.4.7.3 UV-C Purification
- 12.4.7.4 Hybrid Multi-Stage Systems
- 12.4.8 Subsegment Pricing and Adoption Trends
- 12.4.9 Leading Suppliers and Competition
- 12.4.10 Regional Demand and Opportunities
- 12.5 By End User - Market Size and Forecast, 2025-2035
- 12.5.1 Segment Definition and Scope
- 12.5.2 Historical Market Size, 2018-2025
- 12.5.3 Revenue Forecast, 2025-2035
- 12.5.4 Volume Forecast, 2025-2035
- 12.5.5 Base-Year Market Share, 2025
- 12.5.6 Segment CAGR and Growth Drivers
- 12.5.7 Subsegment Market Size and Forecast
- 12.5.7.1 Residential Households
- 12.5.7.2 Corporate Offices
- 12.5.7.3 Hospitality and Retail Facilities
- 12.5.7.4 Healthcare and Education Facilities
- 12.5.8 Subsegment Pricing and Adoption Trends
- 12.5.9 Leading Suppliers and Competition
- 12.5.10 Regional Demand and Opportunities
- 12.6 Segment Growth Comparison
- 12.7 Segment Attractiveness and Priority Matrix
Chapter 13 Indonesia Air Purifier End-Use and Application Market Outlook
- 13.1 End-Use Industry and Customer Demand Structure
- 13.2 Leading Applications and Customer Groups
- 13.3 End-Use Market Size, Share and Forecast
- 13.4 Major End-Use Industry Deep Dives
- 13.4.1 Customer Requirements and Use Cases
- 13.4.2 Demand and Replacement Cycles
- 13.4.3 Technical and Regulatory Considerations
- 13.4.4 Purchasing and Procurement Models
- 13.4.5 Leading Vendors and Distribution Channels
- 13.4.6 Forecast and Commercial Opportunities
- 13.5 Emerging Applications and Cross-Segment Demand
- 13.6 End-Use Industry Investment Priorities
Chapter 14 Indonesia Air Purifier Geographic Market Outlook, 2025-2035
- 14.1 Regional Market Size and Country-Level Shares, 2025
- 14.2 Country Market Size Comparison, 2025
- 14.3 Country Market Forecasts, 2025-2035
- 14.4 Subregional Industrial and Demand Clusters
- 14.5 Intra-Regional Pricing and Cost Differences
- 14.6 Cross-Border Trade and Supply Networks
- 14.7 Regional Supply and Demand Balances
- 14.8 Country Opportunity Comparison and Prioritization
Note: Every listed country is covered on the structure shown under the first country.
Chapter 15 Indonesia Air Purifier Technology, Innovation and Sustainability Outlook
- 15.1 Technology Landscape and Maturity
- 15.2 Product, Process and Service Innovation
- 15.3 AI, Automation and Digital Tools in the Industry
- 15.4 Technology Adoption and Performance Benchmarking
- 15.5 Innovation Pipeline and R&D Investment
- 15.6 Patent and Intellectual Property Trends
- 15.7 Energy Efficiency and Resource Management
- 15.8 Sustainability, Recycling and Circularity
- 15.9 Technology Roadmap, 2025-2035
- 15.10 Risks of Obsolescence and Technology Substitution
Chapter 16 Indonesia Air Purifier Market Key Strategic Imperatives
- 16.1 Growth and Market Entry Priorities
- 16.2 High-Return Products and Segments
- 16.3 Pricing, Profitability and Cost Optimization
- 16.4 Technology Investment and Product Differentiation
- 16.5 Supply Chain Localization and Resilience
- 16.6 Distribution and Customer Acquisition
- 16.7 Partnership, Acquisition and Capacity Strategy
- 16.8 Regional Expansion Priorities
- 16.9 Short-, Medium- and Long-Term Actions
Chapter 17 Competition Outlook
- 17.1 Industry Competition Characteristics
- 17.2 Market Structure and Concentration
- 17.3 Market Share and Competitive Positioning, 2025
- 17.4 Company-Wise Revenue and Product Benchmarking
- 17.5 Production and Service Capacity Benchmarking
- 17.6 Technology, Pricing and Differentiation
- 17.7 Regional Footprint and Distribution Strength
- 17.8 Mergers, Acquisitions and Strategic Alliances
- 17.9 New Entrants and Competitive Threats
- 17.10 Porter's Five Forces and Industry Attractiveness
- 17.11 Competitive Outlook, 2025-2035
Chapter 18 Company Profiles
- 18.1 Company Coverage and Selection Criteria
- 18.2 Xiaomi Corporation
- 18.2.1 Business Description
- 18.2.2 Company Ownership and Geographic Presence
- 18.2.3 Product and Service Portfolio
- 18.2.4 Manufacturing and Operating Footprint
- 18.2.5 Production Capacity and Expansion Plans
- 18.2.6 Financial Performance and Investment
- 18.2.7 Market Share and Competitive Position
- 18.2.8 Technology and Innovation Capabilities
- 18.2.9 Strategic Alliances or Partnerships
- 18.2.10 Recent Developments
- 18.2.11 Growth Strategy and Outlook
- 18.3 Daikin Industries, Ltd.
- 18.4 Sharp Corporation
- 18.5 Philips
- 18.6 Coway Co., Ltd.
- 18.7 Panasonic Corporation
- 18.8 LG Electronics
- 18.9 Dyson Ltd.
- 18.10 Honeywell International Inc.
- 18.11 Blueair AB
- 18.12 Other Relevant Market Participants
Note: Every listed company is profiled on the structure shown under the first company. The company list is preliminary and may change based on research findings, market developments, data availability and client requirements.
Chapter 19 Disclaimer
- 19.1 Research and Forecast Disclaimer
- 19.2 Data Source and Estimation Limitations
Note: The depth of individual sections depends on data availability for this market. Volume, capacity, trade and other unit-based metrics are included where applicable.

